Christian Kuehne  ,
J. Paul McLean,
Kobra Maleki,
Clara Antón-Fernández,
Rasmus Astrup
,
J. Paul McLean,
Kobra Maleki,
Clara Antón-Fernández,
Rasmus Astrup
A stand-level growth and yield model for thinned and unthinned even-aged Scots pine forests in Norway
Kuehne C., McLean J. P., Maleki K., Antón-Fernández C., Astrup R. (2022). A stand-level growth and yield model for thinned and unthinned even-aged Scots pine forests in Norway. Silva Fennica vol. 56 no. 1 article id 10627. https://doi.org/10.14214/sf.10627
Highlights
- The presented growth and yield model consists of component equations for dominant height, stem density, total basal area, and total stem volume
- The component equations were fitted simultaneously using seemingly unrelated regression
- The model is capable to forecast and compare outcomes of varying thinning regimes
- The new component equations better represent the improved growing conditions for Scots pine in Norway.
Abstract
Management of Scots pine (Pinus sylvestris L.) in Norway requires a forest growth and yield model suitable for describing stand dynamics of even-aged forests under contemporary climatic conditions with and without the effects of silvicultural thinning. A system of equations forming such a stand-level growth and yield model fitted to long-term experimental data is presented here. The growth and yield model consists of component equations for (i) dominant height, (ii) stem density (number of stems per hectare), (iii) total basal area, (iv) and total stem volume fitted simultaneously using seemingly unrelated regression. The component equations for stem density, basal area, and volume include a thinning modifier to forecast stand dynamics in thinned stands. It was shown that thinning significantly increased basal area and volume growth while reducing competition related mortality. No significant effect of thinning was found on dominant height. Model examination by means of various fit statistics indicated no obvious bias and improvement in prediction accuracy in comparison to existing models in general. An application of the developed stand-level model comparing different management scenarios exhibited plausible long-term behavior and we propose this is therefore suitable for national deployment.
Keywords
Pinus sylvestris;
mortality;
volume growth;
seemingly unrelated regression;
production forestry;
system of equations
-
Kuehne,
Norwegian Institute of Bioeconomy Research, Division of Forestry and Forest Resources, P.O. Box 115, NO-1431 Ås, Norway
E-mail
christian.kuehne@nibio.no
- McLean, Norwegian Institute of Bioeconomy Research, Division of Forestry and Forest Resources, P.O. Box 115, NO-1431 Ås, Norway E-mail paul.mclean@nibio.no
- Maleki, Norwegian Institute of Bioeconomy Research, Division of Forestry and Forest Resources, P.O. Box 115, NO-1431 Ås, Norway E-mail kobra.maleki@nibio.no
- Antón-Fernández, Norwegian Institute of Bioeconomy Research, Division of Forestry and Forest Resources, P.O. Box 115, NO-1431 Ås, Norway E-mail clara.anton.fernandez@nibio.no
- Astrup, Norwegian Institute of Bioeconomy Research, Division of Forestry and Forest Resources, P.O. Box 115, NO-1431 Ås, Norway E-mail rasmus.astrup@nibio.no
Received 26 August 2021 Accepted 11 January 2022 Published 26 January 2022
Views 90282
Available at https://doi.org/10.14214/sf.10627 | Download PDF

Supplementary Files
1 Introduction
Management of even-aged forests is generally planned and practiced at the stand-level. This scale of management relies upon stand-level planning tools such as site index curves and stand-level growth and yield models to forecast forest conditions under different management scenarios and to make informed decisions about the size and timing of silvicultural treatments. Scots pine (Pinus sylvestris L.) is an important species throughout northern Europe and is most often managed in even-aged stands. In Norway, Scots pine is the second most abundant conifer by volume and value, accounting for approximately 30% of the volume of productive forests or 31% of total forests (Breidenbach et al. 2021).
Yield tables for Scots pine in Norway were first developed over 50 years ago (Brantseg 1965, 1969) while corresponding site index curves were published a few years later (Tveite 1976). These tables and curves are still the basis of forest management tools currently used by forest practitioners and planners (Norskog 2015). The last development of a comprehensive growth and yield model for Scots pine in Norway took place in 1980 when separately built and previously published equations were merged and implemented directly as a decision support system in the form of a computer program (Braastad 1980). There have been various updates or incarnations of this decision support system since that time (Hobbelstad and Hofstad 1988; Hoen and Eid 1990; Eid and Hobbelstad 2000), however these generally consider the same growth models at their core. The main purpose of these decision support systems is to make models more accessible or to connect multiple models, such as for economic forecasting (Eid and Hobbelstad 2000). However, while easy-to-use decision support systems are often preferred for practical forest management, periodically refreshing the models at their core is essential to ensure their continual relevance for the current forest resource. Some stand-alone component models for stand -level growth and yield models have been produced more recently, for example mortality (Eid and Oyen 2003) and dominant height (Sharma et al 2011). However, these are limited by the fact that: i) they do not include thinning, a major management requirement and ii) a stand-level growth and yield model will be much more robust when components are developed simultaneously because this allows interdependencies between variables to be considered (Weiskittel et al. 2011).
Irrespectively of how models are presented to the public, the data used to construct all of the tools currently available to forest practitioners and planners to predict growth and yield in even-aged Scots pine stands in Norway are out of date by up to 40–50 years. Moreover, it is widely accepted that climatic conditions, and therefore growing conditions have dramatically changed over the last 40 years across much of the planet (Hanssen-Bauer et al. 2017). In Scandinavia this has generally resulted in increased growth rates (Sharma et al. 2012; Mäkinen et al. 2021; Mensah et al. 2021) and it is possible that the height to volume relationship, one of the fundamental dendrometric principles of growth and yield of even-aged stands (Skovsgard and Vanclay 2008) might have changed accordingly.
While the changed climate and the longer time period up to and including present day covered by data provide sufficient reason by themselves to justify a revision to the forest management tools used in Norway, a second consideration is that the current growth and yield tools aren’t necessarily flexible enough to account for contemporary management, a full spectrum of thinning regimes in particular. The thinning of forest stands only became a focus of forest research in Norway starting in the late 1960s and early 1970s. As a result, a large number of long-term experimental trials located across the entire country were established to study the effects of thinning on stand-level growth and yield for the main tree species including Scots pine (Brastaad and Tveite 2001). Data from these long-term trials are now available and offer the possibility to dynamically incorporate thinning into growth and yield tools used for practical forest management (Allen et al. 2020).
Given the now available comprehensive experimental data and their potential to overcome shortcomings of currently applied forest management planning tools, the objectives of this study thus were to i) use the long-term trial data to develop a new stand-level model to forecast growth and yield of thinned and unthinned even-aged Scots pine forests in Norway, ii) compare predictions of the newly derived growth and yield model with predictions from previously published equations, and iii) examine the long-term behavior of the new model by forecasting stand dynamics over approximately 100 to 125 years, i.e. entire rotations.
2 Material and methods
2.1 Study area
The study area covers the main inland forest regions of Norway (Fig. 1). Climatic conditions vary considerably in the study area with mean annual temperature ranging from approximately –2 °C to about 6 °C and mean annual precipitation varying from slightly below 400 mm and up to 1300 mm (1981–2010, Meteorological Institute of Norway). The current study excluded data from the southwestern and western counties with their maritime climate (Fig. 1) as growing conditions in oceanic western Norway are considered to be very different to the rest of the country. As a result, separate forest management tools and guides have already been developed in the past for that region (Bauger 1995; Øyen and Nes 1997).
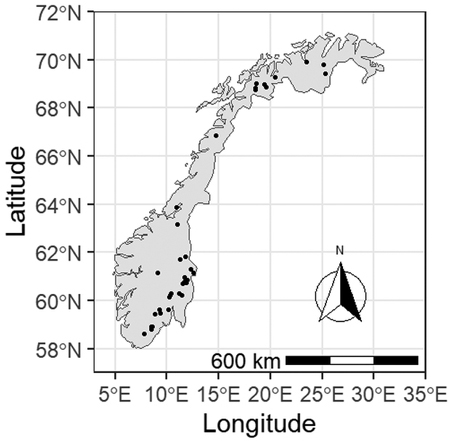
Fig. 1. Locations of Pinus sylvestris forest experimental sites used in this study. Sites from western Norway were excluded from the analysis due to the distinctly different climate of that region.
2.2 Data
Data used in this study were from long-term forest management trials maintained by the Norwegian Institute of Bioeconomy Research (Andreassen et al. 2018). The majority of these silvicultural experiments was established in the early 1970s as part of a larger thinning trial network (Braastad and Tveite 2001). The original idea of establishing these trails was to examine the effects of thinning from below (also low thinning, i.e. removal of suppressed and intermediate trees from the lower end of the diameter distribution) with focus on thinning intensity and timing of thinning on stand-level volume production in 31 to 40 year-old stands. Treatments included one to three thinnings from below with different combinations of target residual trees per hectare (TPH) of 2070, 1600, 1100, and 800 at stand dominant heights of 8, 12, 16, and 20 meters. However, deviations from the original experimental design resulted in a diverse dataset covering a wide range of thinning regimes varying in number of thinning interventions, time of thinning, and thinning intensity (Table 1; Supplementary file S1). To extend the data available for model building, two additional steps were taken that increased the number of sites and the range of forest ages. First, data from thinned and unthinned non-fertilized plots that served as controls for a number of fertilization experiments in Scots pine stands (Skrindo and Økland 1998; Frank and Stuanes 2003) were added to the database. The fertilization trials were established in the 1970s and 1980s in 34 to 50 year-old stands. Second, to increase the number of data points in older stands, we incorporated observations from additional long-term trials established in thinned as well as unmanaged Scots pine stands prior to 1970 (Brantseg 1967, 1969). Most stands in this category were between 25 and 40 years old when the trials were set up in the 1950s and 1960s and then thinned from below multiple times with varying intensities. Irrespective of the original aim of the trials (thinning or fertilization), the majority of the trials analyzed here were established in naturally regenerated stands or in stands established by sowing, with about a quarter of the trials located in planted forests.
| Table 1. Summary statistics of stand-level metrics for thinned and unthinned plots of the model development dataset used in this study. Metrics were derived from even-aged Pinus sylvestris forests in Norway and comprise number of growth intervals (N), total stand age (AGE), site index for Scots pine at base age 40 (SI40), dominant height (HTDOM), number of trees per hectare (TPH), basal area (BA), total stem volume (VOL), age at thinning intervention (AGETHIN), and basal area removed at thinning (BAREM). Values refer to measurements at the beginning of a growth interval and SI40 was derived using the dominant height model developed in this study. | ||||||||||
| Treatment | N | AGE | SI40 | HTDOM | TPH | BA | VOL | AGETHIN | BAREM | |
| (year) | (m) | (m) | (# ha–1) | (m2 ha–1) | (m3 ha–1) | (year) | (m2 ha–1) | |||
| Unthinned | 250 | Mean | 51 | 11.2 | 13.9 | 2280 | 28 | 187 | ||
| SD | 15 | 2.5 | 3.6 | 1147 | 11.7 | 115 | ||||
| Min | 22 | 5.1 | 6.8 | 900 | 8.7 | 40 | ||||
| Max | 109 | 17.4 | 28.2 | 6080 | 56.5 | 620 | ||||
| Thinned | 781 | Mean | 55 | 11.6 | 15.3 | 1380 | 24.8 | 184 | 44 | 4.7 |
| SD | 15 | 2.4 | 4.2 | 633 | 8 | 96 | 11 | 3.3 | ||
| Min | 16 | 6.1 | 6.1 | 280 | 5.5 | 20 | 16 | 0.1 | ||
| Max | 109 | 18.2 | 28.7 | 4730 | 53.1 | 667 | 77 | 24.4 | ||
The final dataset comprised a total of 1031 observations (growth intervals) from 170 permanent plots in 42 trials. The length of the studied growth intervals varied between 1 and 18 years with an average of 6 years. Measurement records for all trees comprised species, vital status (live or dead) and diameter at breast height (DBH). Total tree height (HT) was measured for a randomly selected subsample of all live trees during every measurement campaign with about half of all trees measured for total height on average across all plots. Some of the plots contained individual trees of species other than Scots pine, namely Norway spruce (Picea abies (L.) H. Karst.) and birch (Betula pendula Roth, B. pubescens Ehrh.). However, Scots pine accounted for at least 80% of total plot basal area with an average of 99% across all plots, which is consistent with what are considered “pure stands” in Norway.
2.3 Data preparation
Tree heights missing in the final database were imputed using species specific total tree height equations similar to model RH6a in Tomé (1988) and a mixed -modeling approach similar to the one described in Kuehne et al. (2016). Individual tree measurements for trees ≥ 5 cm DBH were then summarized for each plot to calculate stand-level metrics including dominant height (mean height of the 100 thickest trees ha–1, HTDOM, m), stem density (TPH, number of trees ha–1), total basal area (BA, m2 ha–1), and total stem volume (VOL, m3 ha–1) calculated using species specific individual tree stem volume over bark functions after Braastad (1966), Brantseg (1967), and Vestjordet (1967) (Table 1). We further calculated BA (BABEFORE, BAAFTER) and TPH before as well as after each thinning intervention (TPHBEFORE, TPHAFTER), respectively, and also quantified dominant height (HTTHIN) and stand age at the time of thinning (AGETHIN) when plot records indicated a thinning took place (Table 1). An overview of all stand-level variables used in this work is provided in Table 2.
| Table 2. Abbreviations and definitions of the stand-level variables used in this work. Subscripts of 1 or 2 denote values at the beginning and the end of a measurement period, respectively. | |
| Abbreviation | Definition |
| AGE1,2 | Total stand age (years) |
| AGETHIN | Total stand age at the time of thinning (years) |
| BA1,2 | Total stand basal area (m2 ha–1) |
| BAAFTER | Total stand basal area after thinning (m2 ha–1) |
| BABEFORE | Total stand basal area before thinning (m2 ha–1) |
| BAREM | Total stand basal area removed in a thinning (m2 ha–1) |
| HTDOM | Dominant height (m) |
| HTTHIN | Dominant height at the time of thinning (m) |
| QMD1,2 | Quadratic mean diameter (cm) |
| SI40 | Site index (HTDOM at base stand age of 40 years, m) |
| TPH1,2 | Stem density (number of trees ha–1) |
| TPHAFTER | Stem density after thinning (number of trees ha–1) |
| TPHBEFORE | Stem density before thinning (number of trees ha–1) |
| VOL1,2 | Total stem volume over bark (m3 ha–1) |
2.4 Data analysis
Following Allen et al. (2020) the Scots pine growth and yield model developed here was derived as a system of partially mutually dependent equations consisting of individual component equations for the stand-level metrics HTDOM, TPH, BA, and VOL. Structure, interconnectivity of the individual equations, and functionality of the system of equations are presented as a flow chart in Allen et al. (2020).
Individual equations were first developed separately using non-linear least squares and the ‘nls’ function of the ‘stats’ package of the statistical computing software R (R Core Development Team 2020). Development of component equations individually in this way allowed for the evaluation of various equation structures and forms to find the best fitting final equation for each examined stand-level metric. Model selection for each examined stand-level metric included the comparison of equations that did or did not comprise a thinning response function (Weiskittel et al. 2011). Also called thinning modifiers, thinning response functions are developed to alter predicted stand dynamics after thinning and thus to better forecast forest development in managed, i.e. thinned stands. Mean error (ME), mean absolute error (MAE), and relative mean absolute error (MAE%) were used to evaluate prediction accuracy of the various equations examined for each studied stand-level metric with ME, MAE, and MAE% calculated as follows:

where ![]() is the observed value,
is the observed value, ![]() is the predicted value, and n is the number of observations.
is the predicted value, and n is the number of observations.
Once each final equation for HTDOM, TPH, BA, and VOL was selected we used non-linear seemingly unrelated regression (i.e. simultaneous regression) within the “systemfit” R package (Henningsen and Hamann 2007) as a robust way to account for potential relationships among the different parameters in the system of equations used to build the growth and yield model (Weiskittel et al. 2011). Finally, we developed an equation to predict reduction in TPH in a thinning operation as a function of reduction in BA. Such an equation allows to better quantify a thinning intervention if it is initially defined only as either reduction in TPH or BA, respectively. Only observations recorded immediately after a thinning intervention and thus containing the necessary information were considered in this modeling step (n = 258). The equation thus was not part of the simultaneous regression analysis previously described.
The plausibility of the long term predictions of the stand-level model was assessed visually by examining projections of TPH, BA, and VOL for three stands at a comparatively early stage of development (i.e. they are relatively young in comparison to the expected rotation age). The three stands were selected from the model development dataset, with the main criterion being to illustrate a range of site productivities. The three selected stands therefore primarily varied in site index (SI40 of 5, 11, and 17), initial stem density (2006, 3490, and 2925 trees ha–1, respectively) and age (45, 29, and 26 years, respectively). The long-term predictions were started with the initial HTDOM, TPH, and BA records and included an unthinned management scenario and a light to moderate thinning treatment where 25% of the basal area was removed (del Rio et al. 2017) at HTDOM of 8, 10, and 12 m for SI40 5, 11, 17, respectively. Pre- and post-thinning as well as unthinned stand dynamics were then evaluated based on 5-year prediction intervals and the outcomes of the respective previous prediction step.
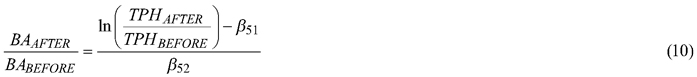
2.5 Model comparison
Performance of the new HTDOM, TPH, BA, and VOL equations developed here was compared against existing models for each of the respective growth and yield component. VOL, BA, and TPH dynamics were compared with the models of Gizachew and Brunner (2011), Brantseg (1969), and Eid and Øyen (2003), respectively. In addition, predictions of the quadratic mean diameter (QMD, cm) using the model of Blingsmo (1984) were compared to QMD at the end of a growth interval calculated from BA and TPH predictions of the newly derived respective equations as follows:
![]()
Prediction accuracy was quantified using the previously defined ME, MAE, and MAE%, the model development data set of 1031 plots, as well as an independent dataset (Suppl. file S2) derived from the Norwegian national forest inventory (NFI, Breidenbach et al. 2020). The NFI dataset comprised a total of 115 thinned (n = 20) and unthinned (n = 95) Scots pine dominated (≥ 80% of basal area) permanent plots with measurements made in 2014 and 2019 (5-year growth interval). The thinning history of each plot was derived by examining plot measurements prior to 2014. We further compared height-age curves derived from the newly developed HTDOM equation to those predicted from the site index model of Tveite (1976 as cited in Øyen and Nes 1997) and the height-age model of Sharma et al. (2011). Since HTDOM predictions of this study’s equation were based on total age, the site index curves produced from the existing models were adjusted to reflect total age instead of the (average) age at breast height (1.3 m) using the conversion equation for Scots pine published in Braastad (1980).
3 Results
3.1 Model selection
3.1.1 Dominant height
Among the various equations examined (Socha et al. 2020) for HTDOM several exhibited comparable short-term prediction accuracy. Given its slightly better prediction performance for extended growth intervals and higher stand ages, Eq. 7 in Diéguez-Aranda et al. (2005a) was selected which uses a generalized algebraic difference approach (GADA, Cieszewski and Bailey 2000) formulation of the log-logistic based height-age model:

where a subscript of 1 or 2 for variables HTDOM and AGE refers to values at the beginning and at the end of a growth interval, respectively, βij are parameters to be estimated, and the variables are as previously defined. According to Krumland and Eng (2005) and Nunes et al. (2011) GADA is the most advanced method to derive flexible dynamic models and involves i) selecting a suitable base equation (here log-logistic) that describes the HTDOM over age curve, ii) identifying parameters in the base equation to relate with site productivity iii) reformulating the base equation by replacing the identified site-specific parameters as functions of a theoretical site productivity measure X0, iv) solving the reformulated base equation for X0 and exchanging all of the general height and age terms in the solution with their initial values, and (v) substitute the site-specific parameters in the reformulated base equation with the solution. Adding a thinning modifier to predict HTDOM did not improve prediction accuracy (data not shown).
3.1.2 Stem density
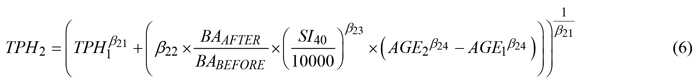
After evaluating the performance of various equations to predict inter-tree competition driven change in TPH (stand-level mortality, Thapa and Burkhardt 2015), equation 20 in Diéguez-Aranda et al. (2005b) was selected as the base model. Extending the base model by adding a thinning modifier similar to equation 8 in Gyawali and Burkhardt (2015) further improved prediction accuracy (data not shown). The final TPH equation was thus as follows:
where SI40 is site index for Scots pine at base age 40 derived using Eq. 5 of this study and all other variables, subscripts, and parameters are as previously defined.
3.1.3 Basal area
A modified version of the stand-level basal area growth model by Brooks (1992, equation 10 as cited in Anastasov 2011) that included a thinning modifier was selected for this study after comparing various approaches (Barrio-Anta et al. 2006). The final equation had the following form:
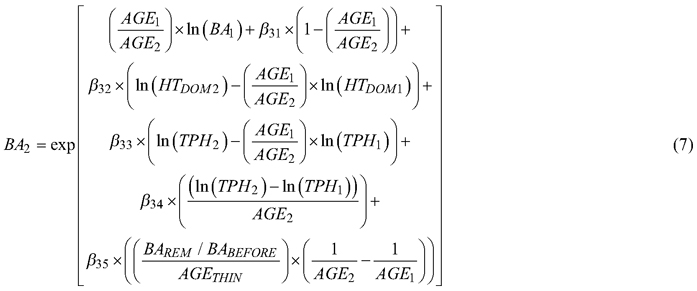
where all variables, subscripts, and parameters are as previously defined.
3.1.4 Volume
After reviewing various approaches (Brooks and Bailey 1992) we followed the procedure presented in Allen et al. (2020) to predict stand-level volume. Because the addition of a thinning modifier improved prediction accuracy the equation used here was modified as follows:

where all variables, subscripts, and parameters are as previously defined.
3.1.5 Reduction in number of trees and basal area
To predict remaining TPH after a thinning intervention when reduction in BA is known only, we used the model in Allen et al. (2020):

where all variables and parameters are as previously defined. To quantify post-thinning BA the equation can be solved as follows:
3.2 Model fitting and evaluation
Parameter estimates and fit statistics for Eqs. 5–9 derived from applying seemingly unrelated regression are given in Table 3. Estimated parameters for all equations were significant at the α = 0.05 level except parameter β22. Parameter β22 relates to the thinning modifier in the TPH Eq. 6 and therefore must be retained for model performance and practical application (Gyawali and Burkhart 2015). No obvious bias was found when plotting residuals for each component Eqs. 5–8 (Fig. 2). However, VOL appeared to be underpredicted for thinned plots with a total stem volume > 500 m3 ha–1 (Fig. 2). Further residual analysis indicated no bias for HTDOM, TPH, BA, and VOL with component specific explanatory variables as well as with stand age, site productivity (SI40), elevation, or thinning intensity (results not shown). A slight overprediction in HTDOM was found for plots of high latitudes, i.e. > 69° (Fig. 3).
| Table 3. Parameter estimates (standard errors) and model fit statistics including mean error (ME), mean absolute error (MAE), and relative MAE (MAE%) for the individual components (Eqs. 5–9) of the stand-level growth and yield model for thinned and unthinned, even-aged Pinus sylvestris forests in Norway. Seemingly unrelated regression was used to derive parameter estimates. | |||||
| HTDOM2 | TPH2 | BA2 | VOL2 | TPHAFTER/TPHBEFORE | |
| βi1 | 68.41819 | –1.56856 | 1.46553 | 0.65394 | –1.91239 |
| (1.84110) | (0.12049) | (0.01025) | (0.01095) | (0.03209) | |
| βi2 | –24.04110 | 0.00284 | 0.52449 | 0.96928 | 1.94414 |
| (1.82025) | (0.00489) | (0.01996) | (0.00330) | (0.03759) | |
| βi3 | 1.46991 | 4.14779 | 0.17701 | 0.91504 | |
| (0.01026) | (0.25666) | (0.00978) | (0.00406) | ||
| βi4 | 4.87715 | 16.53755 | –2.05278 | ||
| (0.23971) | (1.07667) | (0.24101) | |||
| βi5 | –386.71670 | –0.06848 | |||
| (97.76230) | (0.00646) | ||||
| ME | 0.01458 | –0.11108 | 0.02192 | 0.13014 | –0.00041 |
| MAE | 0.34876 | 46.25402 | 0.74455 | 3.92983 | 0.03386 |
| MAE% | 2.18346 | 2.74474 | 2.71853 | 1.97324 | 5.17959 |
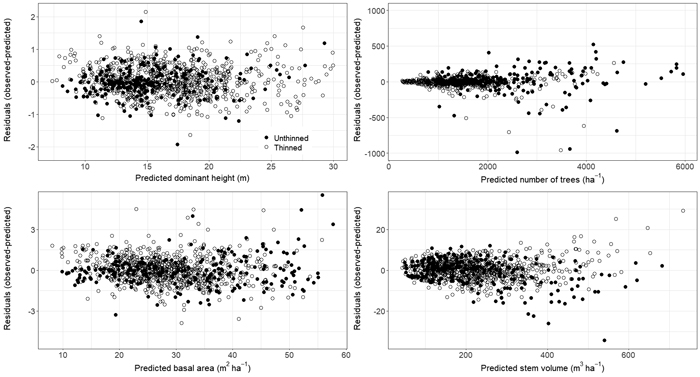
Fig. 2. Residual plots for Eqs. 5–8 representing HTDOM2, TPH2, BA2, and VOL2 of observations from thinned and unthinned plots. Eqs. 5–8 belong to the presented growth and yield model for single-species stands of Pinus sylvestris growing in Norway. View larger in new window/tab.
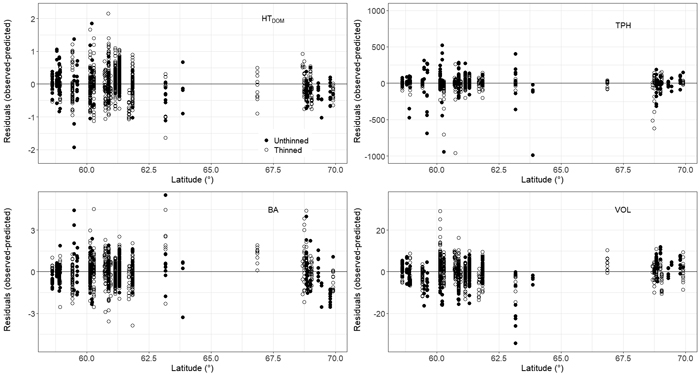
Fig. 3. Dominant height (HTDOM), trees per hectare (TPH), basal area (BA), and total stem volume (VOL) residuals (Eqs. 5–8) plotted over plot latitude for thinned and unthinned plots. Eqs. 5–8 belong to the presented growth and yield model for even-aged stands of Pinus sylvestris growing in Norway. View larger in new window/tab.
Long-term predictions in TPH, BA, and VOL for selected plots of the model development dataset with varying site productivity revealed higher mortality rates in stands with higher SI40 as well as in unthinned stands compared to previously thinned ones (Fig. 4). Modeling results further showed that the effect of thinning on BA development and VOL growth varied with site productivity and management. Light to moderate thinning in stands with a low site index (SI40 = 5) did not result in a noticeable increase in basal area growth with basal area in the thinned scenario remaining clearly below the unthinned scenario at a stand age of 125 years. In contrast, thinned stands on better sites achieved similar or slightly higher maximum basal area as compared to unthinned stands. Similar findings as for BA were also found for VOL (Fig. 4).
Fig. 4. Predictions in stem density, basal area, and total stem volume for three even-aged Pinus sylvestris stands in Norway representing different site indices (SI40 5, 11, and 17 representing dominant stand heights of 5, 11, and 17 m at age 40 years, respectively). Predictions were derived using 5 year prediction intervals and comprise different management scenarios including an unthinned treatment and a single thinning removing 25% of the basal area at 8, 10, or 12 m dominant stand height for SI40 5, 11, and 17, respectively. View larger in new window/tab.
3.3 Model comparison
A comparison of dominant height-age curves produced from Eq. 5 and existing models revealed differences in HTDOM development at higher ages, with the curves of Tveite (1976) and Sharma et al. (2011) tending towards lower HTDOM when compared to the curves from this study (Fig. 5).
Fig. 5. Comparison of site-index (base age 40 years) curves for even-aged stands of Pinus sylvestris in Norway derived from Tveite (1976) and Sharma et al. (2011) and Eq. 5 of this study. View larger in new window/tab.
Comparing predicted TPH, BA, QMD, and VOL derived from this study’s component equations and the model development dataset with predictions of functions previously published showed greater prediction accuracy for equations developed here for all examined components, across all evaluated fit statistics, and irrespective whether plots were thinned or not (Table 4). Relative improvement was greatest for VOL and least pronounced for QMD. In contrast, improved prediction accuracy across all fit statistics was only found for VOL when evaluating the independent NFI dataset (Table 4). In general, decrease in TPH (mortality) was under- and VOL growth was overestimated by the existing models examined when compared to the newly developed equations.
| Table 4. Prediction accuracy metrics including mean error (ME), mean absolute error (MAE), and relative MAE (MAE%) for predicted number of stems per hectare (TPH), basal area (BA), quadratic mean diameter (QMD), and total stem volume (VOL) as derived from this study’s component models as well as existing, previously published models for even-aged Pinus sylvestris stands in Norway. Fit statistics are presented for observations from thinned and unthinned permanent sample plots of this study’s model development dataset and an independent dataset from the Norwegian National Forest Inventory (NFI). | |||||||
| Component | Model | Unthinned | Thinned | ||||
| ME | MAE | MAE% | ME | MAE | MAE% | ||
| Model development dataset | |||||||
| TPH | This study | 5.6835 | 87.2168 | 3.9172 | –1.8884 | 33.6900 | 2.3851 |
| Eid & Øyen (2003) | –106.9901 | 135.1629 | 6.2082 | –26.4859 | 37.7290 | 2.6150 | |
| BA | This study | –0.0949 | 1.0599 | 3.5686 | 0.0639 | 0.8764 | 3.3289 |
| Brantseg (1969) | –1.4966 | 1.8999 | 5.7684 | –0.5530 | 1.1390 | 4.1720 | |
| QMD | This study (BA & TPH) | 0.0108 | 0.2529 | 1.8431 | 0.1238 | 0.3215 | 2.0004 |
| Blingsmo (1984) | 0.2010 | 0.3145 | 2.1849 | 0.2684 | 0.3709 | 2.3439 | |
| VOL | This study | –1.4335 | 9.6842 | 4.9385 | 1.2319 | 9.8617 | 4.8670 |
| Gizachew & Brunner (2011) | –28.0282 | 28.3641 | 12.1442 | –28.8161 | 29.0331 | 13.2350 | |
| Independent NFI dataset | |||||||
| TPH | This study | –14.7621 | 29.8658 | 3.1212 | –3.8224 | 14.5595 | 2.1439 |
| Eid & Øyen (2003) | –27.3764 | 27.8525 | 2.9961 | –9.6650 | 10.1904 | 1.5891 | |
| BA | This study | –0.3519 | 0.8225 | 4.6591 | 0.5458 | 0.8415 | 4.1951 |
| Brantseg (1969) | –0.4961 | 0.9223 | 5.0509 | 0.3200 | 0.7340 | 3.9558 | |
| QMD | This study (BA & TPH) | –0.0582 | 0.4344 | 2.5864 | 0.3087 | 0.5349 | 2.5887 |
| Blingsmo (1984) | –0.0688 | 0.3225 | 1.9894 | 0.3396 | 0.5242 | 2.5556 | |
| VOL | This study | –11.3532 | 12.7894 | 10.4393 | –3.5742 | 9.2175 | 5.6481 |
| Gizachew & Brunner (2011) | –16.3738 | 16.8886 | 13.5945 | –8.2044 | 11.6250 | 8.4833 | |
4 Discussion
The system of equations presented here is a comprehensive stand-level growth and yield model for even-aged Scots pine forests in Norway. Compared to the previous major development of a comparable growth model by Braastad (1980), our model was derived from data up to and including present day, which alone justifies its creation. The model presented here provides further advantages and improvements including i) a simultaneously parameterized set of equations derived from the same single dataset comprising ii) an updated dominant height-stand age equation that can be used to determine site index, iii) inherent growth trajectories that better reflect the improved growing conditions for Scots pine in Norway, and iv) the capability to accurately predict stand dynamics in unthinned as well as thinned stands.
In the model development dataset individual component equations of the presented growth and yield model for even-aged Scots pine stands showed improvement in prediction accuracy when compared to previously published models. In the independent validation dataset, the new equations performed better across all evaluated fit statistics and irrespective whether plots were thinned or not in the case of VOL only. We argue that VOL is the component a potential user is most interested in and thus the most significant stand-level metric among the components equations were derived for. When compared with a published model there was a slight drop in performance for QMD, which could be explained in part by the different way QMD was calculated. Compared to the dedicated model for QMD (Blingsmo 1984), which the current function was tested against, QMD was here derived from equations for TPH and BA. Our equation was therefore not optimized directly for this stand-level metric. For TPH and BA, the new equation performed slightly worse than the published model, however the magnitude of this difference was small and there is uncertainty related with age as well as the thinning operations associated with the independent validation dataset. Moreover, the new model includes a dynamic thinning functionality which has a much larger benefit.
A major objective of this study was to dynamically incorporate thinning into the newly developed model to more accurately predict growth and yield of unthinned as well as thinned forest stands. Consequently, thinning modifiers were successfully incorporated into equations for TPH, BA, and VOL. The underlying thinning response functions in the newly developed BA and VOL equations are exponential in nature and therefore the predicted thinning effect never truly reaches zero. However, after the appropriate period of time the effect becomes negligible because change in BA or VOL for thinned plots converges toward that for unthinned plots (Hasenauer et al. 1997). The exponential thinning response functions are more simplistic and less accurate compared to the ones presented in for example Kuehne et al. (2016) which predict no response at the time of thinning, a relatively rapid increase and often early maximum of the thinning effect shortly after the thinning intervention followed by a more gradual lessening of the response over time after thinning until the thinning effect eventually diminishes and becomes zero again (Snowdon 2002). However, models with more complex thinning response functions did not converge during the model selection step of this study when potential component equations were examined separately. Thinning modifiers presented here still constitute an improvement compared to approaches where mere fixed values are added to stand-level target metrics such as BA or VOL to adjust the growth of thinned stands as compared to dynamics in unthinned ones (Elfving 2010). Moreover, performance and functionality of the corresponding equations still improved when the thinning modifiers were incorporated. This held also true for TPH despite that the thinning effect was not a dynamic response function but a simple independent variable (BAAFTER – BABEFORE ratio) and the estimate of the corresponding parameter was found to be not significant (Gyawali and Burkhart 2015).
In contrast to equations for TPH, BA, and VOL, a thinning modifier did not improve prediction accuracy in HTDOM. This is to be expected because, in general, the height growth of canopy trees is considered relatively insensitive to thinning, which is one of the core philosophies behind the ubiquitous use of site index as an indicator of the potential for site productivity. In this regard, the insensitivity of tree height growth to thinning has been reported by others (del Rio et al. 2017). Further, tree height growth of dominant and co-dominant individuals usually does not vary much across a wide range of stand densities (Lanner 1985). However, a sudden and particularly heavy reduction in stand density can cause immediate and short-term modifications in within-tree photosynthate resource allocation patterns favoring crown expansion over leader growth (Ginn et al. 1991). Consequently, some studies have found a small negative thinning effect on HTDOM (Mäkinen and Isomäki 2004), while others concluded that the effect was negligible due to the observed small magnitude and the short-term duration (Gyawali and Burkhart 2015). In contrast, thinning from below as practiced in the stands analyzed here usually creates a more balanced, regular distribution of trees (Kuehne et al. 2018) lowering inter-tree competition which in turn leads to lower mortality rates (Mäkinen and Isomäki 2004). Furthermore, thinning primarily results in increased individual tree growing space per tree, thus allowing residual trees to exploit newly available resources. However, increased diameter increment and thus stand-level basal area growth as found in this study have also been related to thinning triggered fertilization and selection effects. According to Hynynen (1995), improved nutrient supply (fertilization) and the removal of unhealthy, less vigorous trees (selection) are the principal reasons why thinned forests exhibit increased growth rates when compared with unthinned stands with similar characteristics (age, basal area, site productivity), respectively (Weiskittel et al. 2011).
Similar to other studies relying on long-term forest management experimental trials (Allen et al. 2020), observations from sites with lower site productivity were underrepresented in the data used here, in our case this was especially true for older stands. This could be the reason why performance of the developed HTDOM component model was slightly less accurate for the most northerly plots of the study area where lower site productivities prevail. Besides a slight overprediction in HTDOM we found no obvious bias for stands of high latitudes within the study area. All other component models appeared to work accurately with no difference in prediction performance between plots of varying latitudes. We thus argue that the newly derived system of equations is also suitable for Scots pine stands in northern Norway. This is in agreement with other works that did not exclude data from northern counties in Norway when developing models to predict stand-level attributes of even-aged Scots pine forests (Næsset and Tveite 1999; Eid and Øyen 2003; Sharma et al. 2011).
Component equations developed in this study were derived from mostly short- to mid-term growth intervals with an average measurement cycle of 6 years. Therefore the presented growth and yield model should preferably be used for similar short- and mid-term predictions of up to approximately 10 years. However, evaluation of long-term behavior based on multiple, subsequent applications of the developed system of equations appeared to be plausible. The development of TPH, BA, and VOL showed logical dependencies on stand age, site productivity, stand density, and management intervention with similar relationships recently reported for Norway spruce (Allen et al. 2020). The development of BA over age, for example, followed a sigmoidal curve which after reaching a maximum gradually but slightly decreased (Lembcke et al. 2000). Stand age and thus the point in time of maximum BA appeared to decrease with site productivity while the magnitude of the peak appeared to increase with stand density and site productivity as well as after light to moderate thinnings for stands with higher site productivity. Similar dynamics as found for BA were also derived for VOL and an increase in stand-level BA and VOL growth after thinning compared to an unthinned control on better sites has been previously described for various species including Scots pine (Skovsgaard 2009; Gizachew and Brunner 2011). Effects of thinning in Scots pine forests on total stand productivity, however, are less clear (Mäkinen and Isomäki 2004; Nilsson et al. 2010; del Rio et al. 2017) and seemingly dependent on numerous factors including the choice of metric to quantify stand-level productivity (Allen et al. 2021).
Finally, longer rotations are often necessary to produce Scots pine sawlog timber at sites with low and medium site productivity. However, predictions derived from the newly developed system of equations exceeding a stand age of 120 years need to be handled with caution because observations from such old stands were missing in the underlying model development dataset. This also holds true for stands thinned differently than the ones analyzed in this study were thinning from below was the primary thinning method.
5 Conclusions
The presented stand-level model comprising newly developed component equations for dominant height, number of trees, basal area, and stem volume is capable to predict growth and yield of thinned and unthinned even-aged Scots pine forests growing in Norway. It thus can be used to forecast and compare outcomes of varying management scenarios, different thinning regimes in particular. The new equations better represent the improved growing conditions for Scots pine in Norway as the underlying model development dataset included measurements recorded throughout the last 40 years.
Acknowledgements
The authors are indebted to the many people who have been involved in the installment and monitoring of the permanent sample plots analyzed in this work. We also like to thank Micky G. Allen II for sharing insights into the data used. We further thank subject editor Dr. Sergio de Miguel and three anonymous reviewers for comments on a previous version of this paper.
Funding
This work was partially funded by Utviklingsfondet (Norwegian Agriculture Agency) and Skogtiltaksfondet (Norwegian Forest Owners Association).
Declaration of openness of research materials, data and code
The datasets generated are available from the corresponding author on reasonable request.
Authors’ contributions
CK: conceptualization, methodology, data curation, data analysis, writing – original draft, project administration; JPML: conceptualization, methodology, writing – review and editing; KM: data analysis, writing – review and editing; CAF: data curation, writing – review and editing; RA: conceptualization, writing – review and editing, funding acquisition, project administration
References
Allen II MG, Antón-Fernández C, Astrup R (2020) A stand-level growth and yield model for thinned and unthinned managed Norway spruce forests in Norway. Scan J For Res 35: 238–251. https://doi.org/10.1080/02827581.2020.1773525.
Allen M, Brunner A, Antón-Fernández C, Astrup R (2021) The relationship between volume increment and stand density in Norway spruce plantations. Forestry 94: 151–165. https://doi.org/10.1093/forestry/cpaa020.
Anastasov IZ (2011) Evaluation of basal area projection models for unthinned and thinned central Appalachian hardwood forest stands. Master thesis. Davis College of Agriculture, Natural Resources and Design, West Virginia University.
Andreassen K, Allen M, Holt Hanssen K, Kvaalen H, Støtvig S (2018). Langsiktig feltforsøk i skog ved NIBIO. [NIBIO’s long-term forest field trials]. NIBIO Rapport 4/61/2018.
Anta MB, Dorado FC, Diéguez-Aranda U, Álvarez González JG, Parresol BR, Soalleiro RR (2006) Development of a basal area growth system for maritime pine in northwestern Spain using the generalized algebraic difference approach. Can J For Res 36: 1461–1474. https://doi.org/10.1139/x06-028.
Barrio-Anta M, Castedo F, Diéguez-Aranda U, Álvarez González JG, Parresol B.R., Rodríguez R (2006) Development of a basal area growth system for maritime pine in northwestern Spain using the generalized algebraic difference approach. Can J For Res 36: 1461–1474. https://doi.org/10.1139/x06-028.
Bauger E (1995) Funksjoner og tabeller for kubering av stående trær. [Tree volume functions and tables: Scots pine, Norway spruce and Sitka spruce in western Norway]. Rapport fra Norsk institutt for skogforskning 16: 1–26.
Blingsmo K (1984) Diametertilvekstfunksjoner for bjørk-, furu- og granbestand. [Diameter increment functions for stands of birch, Scots pine and Norway spruce]. Rapport fra Norsk institutt for skogforskning 7/84.
Braastad H (1966) Volumtabeller for bjørk. [Yield tables for birch]. Medd Nor Inst Skogforsk 21: 23–78.
Braastad H (1980) Tilvekstmodellprogram for furu. [Growth model computer program for Pinus sylvestris]. Medd Nor Inst Skogforsk 35: 265–359.
Braastad H, Tveite B (2001) Tynning i gran- og furubestand: effekt på tynning på volumproduksjon, middeldiameter og diameter av de 800 grøvste trær per ha. [Thinning in spruce and pine stands: effect of thinning on volume production, average diameter, and the diameter of the largest 800 trees per hectare]. Rapport fra Norsk institutt for skogforskning 10/01.
Brantseg A (1965) Produksjonstabeller for furu sønnafjells. [Yield tables for Scots pine: South-East Norway]. Standardtabeller. Det norske skogforsøksvesen.
Brantseg A (1967) Furu sønnafjells: kubering av stående skog: funksjoner og tabeller. [Volume functions and tables for Scots pine. South Norway]. Medd Nor Inst Skogforsk 22: 695–739.
Brantseg A (1969) Furu sønnafjells. Produksjonstabeller. [Yield tables for Scots pine: South-East Norway]. Medd Nor Inst Skogforsk 26: 1–291.
Breidenbach J. Granhus A, Hylen G, Eriksen R, Astrup R (2020) A century of National Forest Inventory in Norway–informing past, present, and future decisions. For Ecosyst 7, article id 46. https://doi.org/10.1186/s40663-020-00261-0.
Breidenbach J, Waser LT, Debella-Gilo M, Schumacher J, Rahlf J, Hauglin M, Puliti S, Astrup R (2021) National mapping and estimation of forest area by dominant tree species using Sentinel-2 data. Can J For Res 51: 365–379. https://doi.org/10.1139/cjfr-2020-0170.
Brooks JR (1992) Response to thinning for site-prepared slash and loblolly pine plantations in the Southeast. PhD Dissertation. School of Forest Resources, University of Georgia.
Brooks JR, Bailey RL (1992) A review of thinning for slash and loblolly pine in the south. D. B. Warnell School of Forest Resources, University of Georgia. Technical Report 1992-1.
Cieszewski CJ, Bailey RL (2000) Generalized algebraic difference approach: theory based derivation of dynamic site equations with polymorphism and variable asymptotes. For Sci 46: 116–126.
del Río MD, Bravo-Oviedo A, Pretzsch H, Löf M, Ruiz-Peinado R (2017) A review of thinning effects on Scots pine stands: from growth and yield to new challenges under global change. For Syst 26, article id eR03S. https://doi.org/10.5424/fs/2017262-11325.
Diéguez-Aranda U, Burkhart HE, Rodríguez-Soalleiro R (2005a) Modeling dominant height growth of radiata pine (Pinus radiata D. Don) plantations in north-western Spain. For Ecol Manag 215: 271–284. https://doi.org/10.1016/j.foreco.2005.05.015.
Diéguez-Aranda U, Castedo-Dorado F, Álvarez-González JG, Rodríguez-Soalleiro R (2005b) Modelling mortality of Scots pine (Pinus sylvestris L.) plantations in the northwest of Spain. Eur J For Res 124: 143–153. https://doi.org/10.1007/s10342-004-0043-5.
Eid T, Hobbelstad K (2000) AVVIRK-2000: a large-scale forestry scenario model for long-term investment, income and harvest analyses. Scand J For Res 15: 472–482. https://doi.org/10.1080/028275800750172736.
Eid T, Øyen BH (2003) Models for prediction of mortality in even-aged forest. Scand J For Res 18: 64–77. https://doi.org/10.1080/0891060310002354.
Elfving B (2010) Growth modelling in the Heureka system. Swedish University of Agricultural Sciences, Faculty of Forestry. Unpublished manuscript. http://heurekaslu.org/wiki/Heureka_prognossystem_(Elfving_rapportutkast).pdf.
Frank J, Stuanes AO (2003) Short-term effects of liming and vitality fertilization on forest soil and nutrient leaching in a Scots pine ecosystem in Norway. For Ecol Manag 176: 371–386. https://doi.org/10.1016/S0378-1127(02)00285-2.
Ginn SE, Seiler JR, Cazell BH, Kreh RE (1991) Physiological and growth responses of eight-year-old loblolly pine stands to thinning. For Sci 37: 1030–1040.
Gizachew B, Brunner A (2011) Density–growth relationships in thinned and unthinned Norway spruce and Scots pine stands in Norway. Scand J For Res 26: 543–554. https://doi.org/10.1080/02827581.2011.611477.
Gyawali N, Burkhart HE (2015) General response functions to silvicultural treatments in loblolly pine plantations. Can J For Res 45: 252–265. https://doi.org/10.1139/cjfr-2014-0172.
Hanssen-Bauer I, Drange H, Førland EJ, Roald LA, Børsheim KY, Hisdal H, Lawrence D, Nesje A, Sandven S, Sorteberg A, Ådlandsvik B (2017) Climate in Norway 2100. NCCS, Oslo, Norway.
Hasenauer H, Burkhart HE, Amateis RL (1997) Basal area development in thinned and unthinned loblolly pine plantations. Can J For Res 27: 265–271. https://doi.org/10.1139/x96-163.
Henningsen A, Hamann JD (2007) Systemfit: a package for estimating systems of simultaneous equations in R. J Stat Softw 23: 1–40. https://doi.org/10.18637/jss.v023.i04.
Hobbelstad K, Hofstad O (1988) AVVIRK-3, a model for long-term forest planning. Medd Nor Inst Skogforsk 41.35.
Hoen HF, Eid T (1990) En modell for analyse av behandlingsalternativer for en skog ved bestandssimulering og lineær programmering. [A model for analyses of treatment strategies for a forest applying standvice simulations and linear programming]. Rapport fra Norsk Institutt for Skogforskning 9/90.
Hynynen J (1995) Predicting the growth response to thinning for Scots pine stands using individual-tree growth models. Silva Fenn 29: 225–246. https://doi.org/10.14214/sf.a9210.
Krumland B, Eng H (2005) Site index systems for major young-growth forest and woodland species in Northern California. California Forestry Report 4.
Kuehne C, Weiskittel AR, Wagner RG, Roth BE (2016) Development and evaluation of individual tree-and stand-level approaches for predicting spruce-fir response to commercial thinning in Maine, USA. For Ecol Manag 376: 84–95. https://doi.org/10.1016/j.foreco.2016.06.013.
Kuehne C, Weiskittel A, Pommerening A, Wagner RG (2018) Evaluation of 10-year temporal and spatial variability in structure and growth across contrasting commercial thinning treatments in spruce-fir forests of northern Maine, USA. Ann For Sci 75, article id 20. https://doi.org/10.1007/s13595-018-0697-7.
Lembcke G, Knapp E, Dittmar O (2000) Ertragstafel für die Kiefer (Pinus sylvestris L.) im nordostdeutschen Tiefland. [Scots pine (Pinus sylvestris L.) yield tables for the North German Plain]. Landesforstanstalt Eberswalde.
Lanner RL (1985) On the insensitivity of height growth to spacing. For Ecol Manag 13: 143–148. https://doi.org/10.1016/0378-1127(85)90030-1.
Mäkinen H, Isomäki A (2004) Thinning intensity and growth of Scots pine stands in Finland. For Ecol Manag 201: 311–325. https://doi.org/10.1016/j.foreco.2004.07.016.
Mäkinen H, Henttonen HM, Kohnle U, Kuehne C, Nöjd P, Yue C, Klädke J, Siipilehto J (2021) Site carrying capacity of Norway spruce and Scots pine stands has increased in Germany and northern Europe. For Ecol Manag 492, article id 119214. https://doi.org/10.1016/j.foreco.2021.119214.
Mensah AA, Holmström E, Petersson H, Nyström K, Mason EG, Nilsson U (2021) The millennium shift:investigating the relationship between environment and growth trends of Norway spruce and Scots pine in northern Europe. For Ecol Manag 481, article id 118727. https://doi.org/10.1016/j.foreco.2020.118727.
Næsset E, Tveite B (1999) Stand volume functions for Picea abies in eastern, central and northern Norway. Scand J For Res 14: 164–174. https://doi.org/10.1080/02827589950152890.
Nilsson U, Agestam E, Ekö P-M, Elfving B, Fahlvik N, Johansson U, Karlsson K, Lundmark T, Wallentin C (2010) Thinning of Scots pine and Norway spruce monocultures in Sweden – effects of different thinning programmes on standlevel gross- and net stem volume production. Stud For Suec 219.
Norskog (2015) Skoghåndboka. [The forest compendium]. Det norske Skogselskap, Oslo.
Nunes L, Patrício M, Tomé J, Tomé M (2011) Modeling dominant height growth of maritime pine in Portugal using GADA methodology with parameters depending on soil and climate variables. Ann For Sci 68: 311–323. https://doi.org/10.1007/s13595-011-0036-8.
Øyen B-H, Nes K (1997) Growth patterns of Scots pine in western Norway. Medd Nor Inst Skogforsk 47.18.
R Development Core Team (2020) R: a language and environment for statistical computing. R Foundation for Statistical Computing, Vienna, Austria.
Sharma RP, Brunner A, Eid T, Øyen B-H (2011) Modelling dominant height growth from national forest inventory individual tree data with short time series and large age errors. For Ecol Manag 262: 2162–2175. https://doi.org/10.1016/j.foreco.2011.07.037.
Sharma RP, Brunner A, Eid T (2012) Site index prediction from site and climate variables for Norway spruce and Scots pine in Norway. Scand J For Res 27: 619–636. https://doi.org/10.1080/02827581.2012.685749.
Skovsgaard JP (2009) Analysing effects of thinning on stand volume growth in relation to site conditions: a case study for even-aged Sitka spruce (Picea sitchensis (Bong.) Carr.). Forestr, 82: 87–104. https://doi.org/10.1093/forestry/cpn047.
Skovsgaard JA, Vanclay JK (2008) Forest site productivity: a review of the evolution of dendrometric concepts for even-aged stands. Forestry 81: 13–31. https://doi.org/10.1093/forestry/cpm041.
Skrindo A, Økland RH (1998) Fertilization effects and vegetation-environment relationships in a boreal pine forest in Åmli, S Norway. Sommerfeltia 25: 1–90. https://doi.org/10.2478/som-1998-0001.
Snowdon P (2002) Modeling Type 1 and Type 2 growth responses in plantations after application of fertilizer or other silvicultural treatments. For Ecol Manag 163: 229–244. https://doi.org/10.1016/S0378-1127(01)00582-5.
Socha J, Tymińska-Czabańska L, Grabska E, Orzeł S (2020) Site index models for main forest-forming tree species in Poland. Forests 11, article id 301. https://doi.org/10.3390/f11030301.
Thapa R, Burkhart HE (2015) Modeling stand-level mortality of loblolly pine (Pinus taeda L.) using stand, climate, and soil variables. For Sci 61: 834–846. https://doi.org/10.5849/forsci.14-125.
Tomé M (1988) Modelaçao do crescimento da árvore individual em povoamentos de Eucalyptus globulus Labill. (1ª rotaçao) na regiao centro de Portugal. [Individual tree growth modeling for stands of Eucalyptus globulus Labill. (1st rotation) in Central Portugal]. Ph.D. Thesis, Instituto Superior de Agronomía, Lisboa, Portugal.
Tveite B (1976) Bonitetskurver for furu. [Site index curves for Scots pine]. Internal report (unpublished). Norsk Institutt for Skogforskning.
Vestjordet E (1967) Funksjoner og tabeller for kubering av stående gran. [Functions and tables for volume of standing trees: Norway spruce]. Medd Nor Inst Skogforsk 22: 543–574.
Weiskittel AR, Hann DW, Kerhsaw Jr JA, Vanclay JK (2011) Forest growth and yield modeling. Wiley, Chichester. https://doi.org/10.1002/9781119998518.
Total of 61 references.
