Jari Miina  ,
Mikko Kurttila
,
Mikko Kurttila
A model for the sap yield of birches tapped by citizen scientists
Miina J., Kurttila M. (2022). A model for the sap yield of birches tapped by citizen scientists. Silva Fennica vol. 56 no. 2 article id 10679. https://doi.org/10.14214/sf.10679
Highlights
- Tree diameter and mean stand height positively affected the sap yield of birches
- The sap yield varied between trees, stands, and years
- The sap yield model can be utilised in profitability analyses for sap tapping.
Abstract
The sap yield of birches (Betula pendula Roth and B. pubescens Ehrh.) was modelled as a function of tree diameter (girth) at breast height, as well as site and stand characteristics measured and reported by citizen scientists representing mainly non-industrial private forest owners in the South Savo, North Karelia, and Northern Ostrobothnia regions in Finland. Birches (tree species not recorded) growing on both mineral and peatland sites were tapped during the springs of 2019 and 2020. Citizen scientists were mainly voluntary forest owners who received the instructions and equipment (spouts, drop lines and buckets) for collecting sap from three birches of different diameters in the same birch stand. Citizen scientists were instructed to measure and report the sap yield and girth of the trees, as well as stand characteristics from the forest resource data, if available. Based on the linear mixed model fitted to the data, the sap yield increased with the increasing tree diameter and mean stand height, and varied between years, stands, and trees; between-region variation was not significant. In a birch stand, the simulated total sap yield ha–1 was depended on the average tree size and the stem number ha–1 and was at its highest just before the first commercial thinning and again before the second thinning. The sap model can be used to predict the necessary sap yield in profitability analyses for sap tapping.
Keywords
Betula spp.;
non-timber forest product;
linear mixed model;
crowdsourcing
-
Miina,
Natural Resources Institute Finland (Luke), Yliopistokatu 6 B, FI-80100 Joensuu, Finland
 https://orcid.org/0000-0002-8639-4383
E-mail
jari.miina@luke.fi
https://orcid.org/0000-0002-8639-4383
E-mail
jari.miina@luke.fi
-
Kurttila,
Natural Resources Institute Finland (Luke), Yliopistokatu 6 B, FI-80100 Joensuu, Finland
https://orcid.org/0000-0001-5290-4771
E-mail
mikko.kurttila@luke.fi
Received 15 December 2021 Accepted 28 March 2022 Published 29 March 2022
Views 38295
Available at https://doi.org/10.14214/sf.10679 | Download PDF

1 Introduction
Tapping and using birch sap has been a long tradition in northern and eastern Europe (Svanberg et al. 2012). Birch sap is one of the most abundant non-timber forest products in Finnish boreal forests; according to the national forest inventory, the growing stock volume of birches (Betula pendula Roth and B. pubescens Ehrh.) in Finland is 410 million m3 (Räty and Vaahtera 2020). Although the sap has been used locally and traditionally by Finns, only a few million litres of birch sap is annually tapped and collected for beverage, health-promoting, and cosmetic products. Despite its huge potential, there are only a few local companies buying sap collected by forest owners mainly as a family activity. Globally, consumers’ interest in the utilisation of tree waters has increased (Vanhanen and Miina 2018). Additionally, forest owners have recognised birch sap collection as a means to gain additional income from their forests. Knowledge on sap yield is needed to analyse the profitability of sap tapping in birch forests. Thus far, no empirical models for birch sap yield are available in Finland. An ‘ad hoc’ model modified from the sap yield equations presented by Maher (2005) was applied in calculating the potential for birch sap production at the holding level calculations (Kurttila et al. 2018). Empirical results on birch sap yield have been published only from two locations in Finland (Salo 2000; Potila et al. 2005).
The profitability of sap tapping needs to be analysed due to the high variation in sap yield and various costs involved in sap tapping. In North America, large-scale maple sap tapping, where hundreds or thousands of maple trees (Acer saccharum Marshall) are tapped, requires investments in equipment, such as spouts, drop lines, tubes, fittings, installing tools, sap tanks, and a vacuum pump to intensify sap flow and increase sap yield (Wilmot et al. 2007; Wolfe 2019). Labour costs of installing and maintaining a tubing system should also be included in analyses. Like maple trees, birch stems are wounded in tapping, which results in a column of discoloured, nonconductive wood extending above and below the tap hole (Potila et al. 2005; Nevalainen 2006; van den Berg et al. 2018). Wood discolouration will decrease the commercial value of the most valuable part of the stem. Therefore, the possible decrease in timber quality and value should also be considered in analysing the profitability of sap tapping. Due to this kind of investment cost, the same trees must be tapped in several seasons.
Results on the birch sap yield of large-scale tapping were not freely available in Finland due to the protection of undisclosed know-how and business information. Therefore, we collected data on birch sap yield using citizen science and the bucket collection method. In this study, we presented the model for the yield of birch sap collected by voluntary persons in 2019 and 2020 in the North Karelia, South Savo, and Northern Ostrobothnia regions in Finland. The aim was to prepare a birch sap yield model that could be utilised in profitability analyses for sap tapping in Finnish birch stands. The special aim was to analyse the yield variation among years, regions, stands, and trees.
2 Materials and methods
2.1 Materials
Voluntary persons in the North Karelia, South Savo, and Northern Ostrobothnia regions were reached through Luke’s press release published on Luke’s website, regional media, and events to forest owners. The regions were selected due to their high potential for birch sap tapping since the growing stock volume of birch in these regions is among the highest in Finland (Räty and Vaahtera 2020). Citizen scientists were mainly non-industrial private forest owners who obtained the equipment (spouts, drop lines, sap buckets and measuring bucket) and instructions for selecting three birches, drilling a hole 8 mm wide and 5 cm deep in each tree and installing the spout and drop line. Sap was collected from three birches of different diameter in the same forest stand. The average tree represented the average tree diameter at breast height, and two other trees were smaller and larger than the average tree. In addition to measuring and reporting the sap yield, citizen scientists were asked to measure the girth of tapped birches, to count the number of competing trees within a 4 m radius, and to determine the mean height and GPS coordinates of the stand. If available, stand characteristics, such as mean height and diameter, age, the number of stems ha–1, stand basal area, and site type, were reported from the owner’s forest management plan or Metsään.fi-service.
In spring 2019 and 2020, a total of 62 and 33 people, respectively, collected birch sap and sent the yield records and stand and tree measurements to Luke. The sap yield and girth (or diameter) at breast height were recorded from 187 trees and 62 stands in 2019, and 100 trees and 33 stands in 2020. In total, 225 trees in 74 stands were included in the modelling data, as 62 trees were tapped in both years (Table 1). More data were obtained from Northern Ostrobothnia (44% of observations) and North Karelia (44%) than from South Savo (13%).
On average, sap yield recoding started on April 15, 2019, and April 17, 2020, and ended on May 10, 2019, and May 16, 2020. The average length of sap season was 25 days in 2019 and 30 days in 2020. According to the statistics of the Finnish meteorological Institute, the spring in 2019 was exceptionally warm. In 2020, the mean temperature in April was close to the long-term average and in May below the average.
The mean diameter of the trees tapped in 2019 was 19.1 cm (SD 6.1 cm, range 8.0–43.0 cm, and 19.7 cm (SD 6.6 cm, range 6.4–41.4 cm) in 2020. The tapped trees were growing on rich (OMT 56.9%), medium (MT 37.5%), and sub-dry (VT 5.6%) sites, with 86.1% and 13.9% on mineral and peatland sites, respectively. The fertility of mineral soils was determined using the following site type classification (Cajander 1926), in which OMT = Oxalis-Myrtillus-type, MT = Myrtillus-type, and VT = Vaccinium-type. The fertility of peatlands was determined and classified using the same system as that for mineral soils (Vasander and Laine 2008). Birch tree species (Betula pendula and B. pubescens) were not determined. The stand characteristics that were asked to be either assessed or copied from forest resource data were not always reported by forest owners (Table 1).
| Table 1. Main characteristics of birch sap yield, trees and stands used in modelling the sap yield in the South Savo, North Karelia, and Northern Ostrobothnia regions in Finland. In total, 225 trees in 74 stands were tapped in 2019 and/or 2020 and measured by diameter. Not all stand characteristics were available for each stand. | ||||
| Variable | N | Mean | SD | Range |
| Sap yield (litre tree–1) | 287 | 47.8 | 40.1 | 0.6–246.5 |
| Tree diameter (cm) | 225 | 19.2 | 6.3 | 6.4–43.0 |
| Mean height (m) | 72 | 16.0 | 4.1 | 6.0–25.0 |
| Mean diameter (cm) | 65 | 18.3 | 4.4 | 11.0–35.0 |
| Stand basal area (m2 ha–1) | 39 | 17.3 | 6.6 | 3.0–31.0 |
| Number of stems (ha–1) | 53 | 933 | 520 | 340–2200 |
| Stand age (years) | 66 | 40 | 18 | 10–90 |
| N | Rich (OMT) | Medium (MT) | Sub-dry (VT) | |
| Site fertility a | 73 | 41 (56%) | 28 (38%) | 4 (6%) |
| a Site fertility classes: rich, medium and sub-dry = Oxalis-Myrtillus, Myrtillus and Vaccinium site type, respectively, in the Finnish system of classification (Cajander 1926; Vasander and Laine 2008). | ||||
2.2 Statistical modelling
Correlations between the sap yield and tree-level (diameter) and stand-level variables (age, mean height and diameter, stand basal area, stem number ha–1, etc.) were calculated to identify potential predictors for the sap model. The effect of soil type and site fertility on the stand-level sap yield was tested using the ANOVA test.
A linear mixed model was prepared for the seasonal sap yield of trees. The predicted variable in the model was the logarithmic transformation of sap yield, which resulted in a linear relationship between the dependent and independent variables. The predictors were chosen from tree-level and stand-level variables, as well as their transformations. The data had a hierarchical structure, which was considered by including random stand and tree effects in the variance component model (Searle et al. 1992). The year and region effects were included as fixed dummy variables.
The sap yield of trees in a stand was modelled by fitting a linear mixed model:
![]()
where yield is the sap yield (litre tree–1 year–1), f(·) is the fixed part of the model, X is a vector of fixed predictors, and β is a vector of fixed parameters. Subscripts i, j, k, and t refer to the tree, stand, region, and year, respectively. uijk and ujk are random, normally distributed between-tree and between-stand effects with a mean of zero and constant variances. Normality and constant variance of random effects (u) and residual (e) were achieved with logarithmic transformation of the dependent variable. The linear model was fitted using the MIXED procedure in IBM SPSS Statistics 27 (IBM SPSS Inc. 2020). To be identified as important predictors, the fixed variables included in the models had to be significant at the 0.05 level.
The accuracy of the predictions of the linear model obtained using only the fixed effects was determined by calculating the proportion of explained variance (R2), bias, and root mean square error (RMSE). The relative error statistics (bias% and RMSE%) were calculated by dividing the bias and RMSE by the mean of the predicted response. The transformed response was back-transformed to the original scale before the error statistics were calculated. To correct the bias caused by the logarithmic transformation, half of the total residual variance was added to the logarithmic prediction.
2.3 Simulations
The performance of the estimated model was illustrated by predicting the sap yield in a planted silver birch (Betula pendula) stand on a rich site (OMT) in Mikkeli, South Savo. Stand development was simulated using the Motti stand simulator (Hynynen et al. 2002; Salminen et al. 2005). The Motti software is widely used to demonstrate the impact of alternative forest management activities on stand development, wood production and finances. Here, we illustrate how the stand-level simulations could be utilised to support the decision making on the joint production of birch timber and sap. In our simulations, stand management followed the silvicultural recommendations applied in privately owned forests in Finland (Äijälä et al. 2019). The stand was pre-commercially thinned at the age of 13 years to the density of 1600 birches ha–1 and thinned twice (34 and 46 years) before regeneration fell at the age of 65 years.
The sap yield of a tree of average size (mean diameter and height) in the birch stand was simulated using the estimated model. The total sap yield ha–1 was obtained by multiplying the yield of the average tree by the total number of birches ha–1.
3 Results
The yield of birch sap varied considerably among years, regions, and trees (Fig. 1). In 2019 and 2020, the sap yield was, on average, 53.4 litres tree–1 (SD 41.4 litres, range 1.6–246.5 litres) and 37.3 litres tree–1 (SD 35.4 litres, range 0.6–200.0 litres), respectively. The yield of trees tapped twice was 52.9 litres (SD 40.4 litres, range 5.0–198.5 litres) in 2019 and 36.8 litres (SD 39.4 litres, range 0.6–200.0 litres) in 2020.
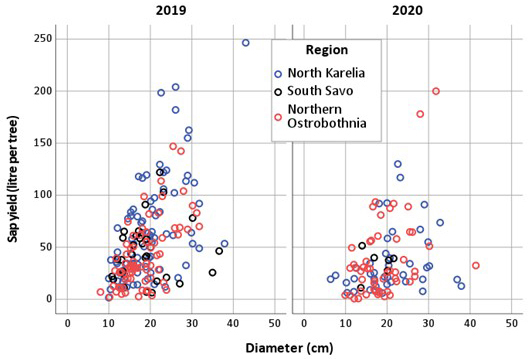
Fig. 1. Birch sap yield tapped in two years in three regions in Finland as a function of tree diameter at breast height.
The annual sap yield of the trees correlated positively with tree diameter (r = 0.44, p < 0.001). The average total sap yield of the stands correlated positively with mean height (r = 0.40, p < 0.001), mean diameter (r = 0.42, p < 0.001), stand age (r = 0.08, p = 0.157) and stand basal area (r = 0.02, p = 0.911) and negatively with stem number (r = –0.25, p = 0.067). Based on the ANOVA, soil type (F = 0.11, p = 0.783) and site fertility (F = 0.25, p = 0.783) had no significant effect on the stand-level sap yield.
A linear mixed model (Eq. 1) was prepared for the seasonal sap yield of birch trees. The year effect, tree diameter, and mean height were significant (p < 0.05), and thus were included in the final model (Table 2). Interaction variables were not significant. In 2019, the sap yield was 72% higher than in 2020. Increasing tree diameter and mean height logically increased the sap yield of trees. According to the model, the sap yield of birch having a diameter of 20 cm and a mean stand height of 23 m was 83 litres in 2019 and 48 litres in 2020 (Fig. 2A).
| Table 2. The linear mixed model (Eq. 1) estimated for the seasonal sap yield of birch trees (litre tree–1). The fitting statistics are calculated using fixed effects. The modelling data consist of 281 observations from 221 trees in 72 stands tapped in 2019 and/or 2020. | ||||
| Variable a | Estimate | Std err. | t-value | p-value |
| Intercept | –2.031 | 0.804 | –2.53 | 0.013 |
| Year 2019 (ref. 2020) | 0.540 | 0.099 | 5.46 | <0.001 |
| ln(d) (cm) | 1.089 | 0.160 | 6.82 | <0.001 |
| ln(H) (m) | 0.729 | 0.265 | 2.75 | 0.007 |
| Random effect | Variance | |||
| Stand (N = 72) | 0.248 | |||
| Tree (N = 221) | 0.083 | |||
| Residual (N = 281) | 0.394 | |||
| Fitting statistics | ||||
| R2 (%) | 55.2 | |||
| Bias (litre tree–1) | –5.69 | |||
| Bias% (%) | –10.7 | |||
| RMSE (litre tree–1) | 34.92 | |||
| RMSE% (%) | 65.4 | |||
| a d = tree diameter at breast height; H = mean stand height. | ||||
The proportion of the variance explained by fixed effects (R2) was 55%, and most of the unexplained variation (47%) was found at the lowest level (i.e., residual) (Table 2). Additionally, the unexplained variation at the stand level was high (34%). Variance associated with the random effect of the tree was small (11%), but there were only one or two observations from each tree. Using the total variance of stand and tree effects (45% of unexplained variance), the 95% confidence interval for the sap yield of the tree having a diameter of 20 cm and a mean stand height of 23 m was 33–313 litres in 2019 and 13–127 litres in 2020. This indicates that random variation at the tree level was large compared with the effects of the fixed predictors.
The predicted sap yield of the average tree followed the development of the mean diameter (and height) and was only slightly affected by thinning (Fig. 2B). In addition to the mean size of the trees, the total sap yield ha–1 was dependent on the stem number ha–1 so that thinning temporarily decreased the total yield (Fig. 2C). The total sap yield ha–1 was at its maximum just before the first thinning and just before the second thinning.
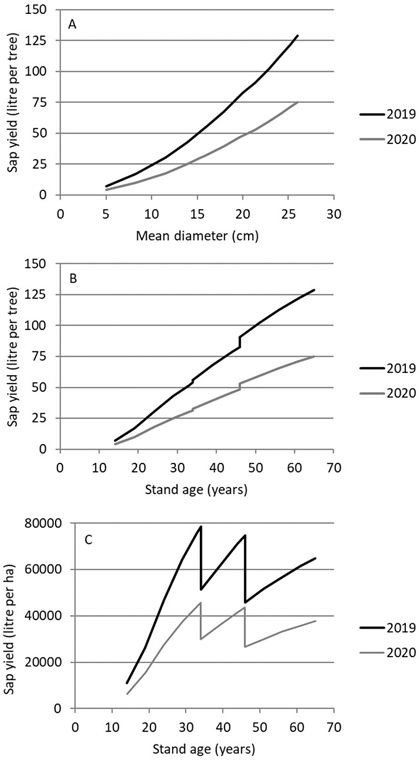
Fig. 2. Simulated development of the annual sap yield of the average tree (A and B) and the total sap yield ha–1 (C) in a planted silver birch stand on rich site (OMT) in Mikkeli, South Savo as a function of mean diameter or stand age. The stand development was simulated using the Motti simulator, and thinnings and final cutting were simulated according to the silvicultural recommendations.
Based on the model predictions (using average year effect), the highest 10-year sap yield (in total, 480 000 litres ha–1) was obtained before the second thinning when the stand density was about 900 stems ha–1, and the mean diameter and height were 16–20 cm and 18–23 m, respectively. The 10-year sap yield was only 1% or 4% lower if tapping was done before the first thinning (about 1500 stems ha–1) or final cutting (about 500 stems ha–1), respectively.
4 Discussion
The sap yield model was based on the data collected by voluntary persons in Finland. The model logically predicted the sap yield, and thus, the predictions could be utilised in the profitability analyses of sap tapping in Finnish birch stands.
The accuracy of data collected by citizen scientists was not assessed though the uniformity and inaccuracy are expected features of citizen-science data. The citizens were able to measure the sap yield and tree girth (or diameter), but site and stand variables were often missing or probably inaccurately assessed. An effort was made to obtain site and stand variables from the multi-source national forest inventory (MS-NFI) data prepared by Luke (https://paikkatietoikkuna.fi/), as the GPS coordinates of the tapped birch stands were available. However, stand and site variables reported by citizens were considered more accurate than those obtained from the MS-NFI data.
Random variation involved in the model predictions was large, indicating that some factors affecting sap production were missing from our analyses. In this study, the main aim was to predict sap production using those variables that are known in forest resource data or can be easily measured. For example, between-year variation in sap yield could be explained by seasonal weather variables (Hölttä et al. 2018) and between-tree variation by relative locations of trees within the stand, and anatomical and mechanical characteristics of wood (Zajączkowska et al. 2019), but the future weather conditions are unknown and wood properties are not easily measurable variables. In the changing climate, both sap yield predictions and the practical collection of sap may become more challenging. For example, early warm period during spring may start the sap flow in birch trees already when the snow cover is thick, which challenges the start of the collection. Similarly, cold period following warm period may affect the sap flow from trees considerably, which increases annual variation. In the future, variables describing soil moisture (e.g., wetness index) could be used as additional variables to predict more accurately the stand- and tree-level sap yield, in addition to tree characteristics such as tree species, canopy size, age, etc. However, Potila et al. (2005) found no difference in the sap yield of Betula pendula growing on mineral soils and B. pubescens growing also on peat soils. Also, thinning may increase the sap yield of remaining trees through enhanced crown development, but this needs further studies. Besides the quantity, the chemical composition of birch sap is an important property that also varies between trees and sites (Ozolinčius et al. 2016; Mingaila et al. 2020).
The birch sap model presented here is the first one in Finland, and possibly also in Europe. Our modelling data covered a wide range of tree sizes and tree-level sap yields, which enabled us to model the relationship between the sap yield and tree diameter. In addition, the sap yield data covered a regionally larger area than the earlier Finnish studies conducted in Koli (Salo 2000) and Ilmajoki (Potila et al. 2005). Our results on the average birch sap yield and its variation were comparable to those presented earlier in Finland (Salo 2000; Potila et al. 2005). As in the earlier studies, sap yield varied a lot among the trees of the same stand. That cannot be explained by the different timing of sap collection, which may however explain the variation between years and stands. Reasons for a large variation in sap yield need to be studied further. In addition, the total sap yield of a birch stand calculated using our model was in line with the quantity of sap tapped from mature birch forests in Belorussia, with an estimated yield of 40 000 litres ha–1 (Rebane 1970).
In long-term sap tapping, it is relevant to determine how the timing of 10-year sap tapping during the rotation of a birch stand would affect the total sap yield. The highest total sap yield was obtained just before the second thinning, but interestingly, according to the estimated yield model, the total sap yield would be only slightly lower if 10-year tapping occurred before the first thinning or at the end of rotation. However, the costs of sap tapping depend, for example, on the number of trees tapped, which should also be considered in determining the optimal timing of sap tapping.
In conclusion, the model for the yield of birch sap can be utilised in analysing the profitability of sap tapping and optimising the stand management and timing of tapping for the joint production of birch timber and sap. In addition, data collected through citizen scientists may offer cost-efficient way to prepare empirical models for various non-timber forest products. However, the quality assessment needs to be considered seriously when planning the data collection.
Acknowledgements
We thank all the persons voluntarily participated in collecting data for this study and the forest owners for offering their birch stands for sap tapping. A special thanks to Raili Hokajärvi at the Finnish Forestry Centre and Marjo Särkkä-Tirkkonen at the Ruralia Institute of the University of Helsinki who organised the distribution of the instructions and equipment in Northern Ostrobothnia and South Savo, respectively. This work was supported by the project ‘Supporting wild forest products (WFP) business development – new yield models and business sustainability assessment tool’ funded by Natural Resources Institute Finland (Luke).
Declaration of openness of research materials, data and code
The data are available from the authors on reasonable request.
Authors’ contributions
JM: conceptualization, methodology, data curation, data analysis, writing – original draft; MK: conceptualization, methodology, data curation, writing – review and editing, funding acquisition, project administration
References
Äijälä O, Koistinen A, Sved J, Vanhatalo K, Väisänen P (2019) Metsänhoidon suositukset. [Forest management recommendations]. Tapion julkaisuja.
Cajander AK (1926) The theory of forest types. Acta For Fenn 29: 1–108. https://doi.org/10.14214/aff.7193.
Hölttä T, Dominguez Carrasco M, Salmon Y, Aalto J, Vanhatalo A, Bäck J, Lintunen A (2018) Water relations in silver birch during springtime: how is sap pressurised? Plant Biol 20: 834–847. https://doi.org/10.1111/plb.12838.
Kurttila M, Pukkala T, Miina J (2018) Synergies and trade-offs in the production of NWFPs predicted in boreal forests. Forests 9, article id 417. https://doi.org/10.3390/f9070417.
Maher K (2005) Production and quality of spring sap from Alaskan birch (Betula neoalaskana Sargent) in Interior Alaska. Master’s Thesis, University of Alaska Fairbanks, USA. https://scholarworks.alaska.edu/bitstream/handle/11122/6148/Maher_K_2005.pdf. Accessed 2 December 2021.
Mingaila J, Čiuldienė D, Viškelis P, Bartkevičius E, Vilimas V, Armolaitis K (2020) The quantity and biochemical composition of sap collected from silver birch (Betula pendula Roth) trees growing in different soils. Forests 11, article id 365. https://doi.org/10.3390/f11040365.
Nevalainen S (2006) Discolouration of birch after sapping. Aktuelt fra Skogforskningen 1/06: 32–36. https://hdl.handle.net/11250/2659896.
Ozolinčius R, Bareika V, Rubinskienė M, Viškelis P, Mažeika R, Staugaitis G (2016) Chemical composition of silver birch (Betula pendula Roth) and downy birch (Betula pubescens Ehrh.) sap. Baltic For 22: 222–229. https://www.balticforestry.mi.lt/bf/PDF_Articles/2016-22%5b2%5d/Baltic%20Forestry%202016.2_222-229.pdf.
Potila H, Niemistö P, Savonen E-M, Siuruainen K, Ala-Laurinaho E, Haapalehto M, Raitio H (2005) Koivunmahlan ja kuusenkerkkien hyödyntäminen PK-elintarviketuotannossa – keruun vaikutukset puiden kasvuun ja terveydentilaan. Loppuraportti. [Utilisation of birch sap and spruce shoots in food sector SMEs – the effects of harvesting on tree growth and vigour]. The Finnish Forest Research Institute, Parkano.
Rebane H (1970) Kask – meie kodumaa kauneim puu. [Birch – the most beautiful tree of Estonia]. Eesti Loodus 10: 582–588. http://www.digar.ee/id/nlib-digar:340566. Accessed 2 December 2021.
Räty M, Vaahtera E (2020) Forest resources. In: Peltola A (ed) (2020) Suomen metsätilastot : Finnish forest statistics. Natural Resources Institute Finland (Luke), pp. 17–39. https://stat.luke.fi/sites/default/files/suomen_metsatilastot_2020_verkko.pdf. Accessed 2 December 2021.
Salo K (2000) Kaskikoivun mahla virtaa. [Sap flowing in birches]. In: Lovén L, Rainio H (eds) Kolin perintö. Kaskisavusta kansallismaisemaan. Metsäntutkimuslaitos – Geologian tutkimuskeskus, Helsinki, pp. 78–83. http://urn.fi/URN:ISBN:951-40-1739-0.
Searle SR, Casella G, McCulloch CE (1992) Variance components. Wiley, New York. https://doi.org/10.1002/9780470316856.
Svanberg I, Sõukand R, Łuczaj Ł, Kalle R, Zyryanova O, Dénes A, Papp N, Nedelcheva A, Šeškauskaitė D, Kołodziejska-Degórska I, Kolosova Vl (2012) Uses of tree saps in northern and eastern parts of Europe. Acta Soc Bot Pol 81: 343–357. https://doi.org/10.5586/asbp.2012.036.
van den Berg AK, Isselhardt ML, Perkins TD (2018) Identifying sustainable practices for tapping and sap collection from birch trees: optimum timing of tapping initiation and the volume of nonconductive wood associated with taphole wounds. Agric Sci 9: 237–246. https://doi.org/10.4236/as.2018.93018.
Vanhanen H, Miina J (eds) (2018) Katsaus puuvesimarkkinoihin : LUMO-INKA – luonnontuotteista uutta liiketoimintaa -hankkeen raportti. [A survey of the tree water markets : Report of New Business Opportunities from Non-Wood Forest Products – LUMO-INKA -project]. Luonnonvara- ja biotalouden tutkimus 22/2018. http://urn.fi/URN:ISBN:978-952-326-568-4.
Vasander H, Laine J (2008) Site type classification on drained peatlands. In: Korhonen R, Korpela L, Sarkkola S (eds) Finland – Fenland : research and sustainable utilisation of mires and peat. Finnish Peatland Society, Maahenki, Helsinki, pp. 146–151. ISBN 978-952-5652-47-5.
Wilmot TR, Perkins TD, van den Berg AK (2007) Vacuum sap collection: how high or low should you go? Maple Syrup Dig 19: 27–32. http://www.maplesyrupdigest.org/?p=521. Accessed 2 December 2021.
Wolfe LM (2019) Master’s project: maple: a sap to syrup guide, a manual for career and technical centers of Vermont. Rubenstein School Masters Project Publications 21. https://scholarworks.uvm.edu/rsmpp/21. Accessed 2 December 2021.
Zajączkowska U, Kaczmarczyk K, Liana J (2019) Birch sap exudation: influence of tree position in a forest stand on birch sap production, trunk wood anatomy and radial bending strength. Silva Fenn 53, article id 10048. https://doi.org/10.14214/sf.10048.
Total of 20 references.
