Silvana M.J. Sione  ,
Silvia G. Ledesma,
Pablo G. Aceñolaza,
Marcelo G. Wilson
,
Silvia G. Ledesma,
Pablo G. Aceñolaza,
Marcelo G. Wilson
Biomass Carbon and Nitrogen allocation in different tree species: do tree compartments and size affect C:N relationship?
Sione S. M.J., Ledesma S. G., Aceñolaza P. G., Wilson M. G. (2022). Biomass Carbon and Nitrogen allocation in different tree species: do tree compartments and size affect C:N relationship? Silva Fennica vol. 56 no. 4 article id 10757. https://doi.org/10.14214/sf.10757
Highlights
- C:N relationship variations in biomass compartments were positively correlated with N concentration and did not exhibit significant association with C
- C:N ratios differed significantly among species and compartments
- Only in Neltuma affinis and Vachellia caven stems C:N relationship differed among tree size.
Abstract
Tree carbon (C) and nitrogen (N) concentrations and C:N ratio are critical for understanding the elemental compositions of forests, N use efficiency, productivity and the biogeochemical cycles. We evaluate differences in C and N allocation among biomass compartments of three N‑fixing tree species of Espinal Argentine eco-region; the scaling relationship between C and N and the C:N ratio variation among compartments and tree size. Neltuma affinis (Spreng.) C.E. Hughes & G.P. Lewis, Neltuma nigra (Griseb.) C.E. Hughes & G.P. Lewis and Vachellia caven (Molina) Seigler & Ebinger plants (n = 30 for each species) were felled, grouped by stem basal diameter-based size classes and partitioned into 3 biomass compartments: stem (st), large branches (lb) and small branches + leaves, flowers and fruits (sbl). C and N concentrations were markedly influenced by species and biomass compartments. In general, sbl compartment presented more N than the st and lb, while C concentrations in Neltuma stems were the highest. Overall, no isometric C–N scaling relationships were found in different compartments. C:N variations in compartments were positively correlated with N concentrations but did not exhibit any significant association with C concentrations. C:N ratios differed significantly among species and biomass compartments. The C:N ratio for compartments ranked in an order of st > lb > sbl. C:N ratio variability in sbl was the least. Only in N. affinis and V. caven stems C:N relationship differed among tree size. Our results provide evidence of the importance of using in situ C and N concentration per main tree species and biomass compartments, to more accurate estimates of C and N stocks.
Keywords
Neltuma nigra;
Neltuma affinis;
Vachellia caven;
biomass compartments;
C:N ratio;
native forests
-
Sione,
National University of Entre Ríos, Faculty of Agricultural Sciences, Ruta 11 Km 10,5 (3101) Oro Verde, Entre Ríos, Argentina; CICyTTP-CONICET (National Research and Technological Investigation Council), Materi y España (3105) Diamante, Entre Ríos, Argentina
 https://orcid.org/0000-0002-2119-0363
E-mail
silvana.sione@fca.uner.edu.ar
https://orcid.org/0000-0002-2119-0363
E-mail
silvana.sione@fca.uner.edu.ar
-
Ledesma,
National University of Entre Ríos, Faculty of Agricultural Sciences, Ruta 11 Km 10,5 (3101) Oro Verde, Entre Ríos, Argentina
https://orcid.org/0000-0002-9264-1766
E-mail
silvia.ledesma@fca.uner.edu.ar
-
Aceñolaza,
National University of Entre Ríos, Faculty of Agricultural Sciences, Ruta 11 Km 10,5 (3101) Oro Verde, Entre Ríos, Argentina; CICyTTP-CONICET (National Research and Technological Investigation Council), Materi y España (3105) Diamante, Entre Ríos, Argentina
https://orcid.org/0000-0002-5033-3466
E-mail
pablo.acenolaza@fca.uner.edu.ar
-
Wilson,
National University of Entre Ríos, Faculty of Agricultural Sciences, Ruta 11 Km 10,5 (3101) Oro Verde, Entre Ríos, Argentina
https://orcid.org/0000-0002-1214-1041
E-mail
wilson.marcelo@inta.gob.ar
Received 22 May 2022 Accepted 19 December 2022 Published 29 December 2022
Views 69788
Available at https://doi.org/10.14214/sf.10757 | Download PDF

Supplementary Files
1 Introduction
Forests play a critical role in the global carbon (C) and nitrogen (N) cycling (Mitchard 2018). C and N are primary elements critical to all biological processes and are involved in the growth and development of organisms. C constitutes a large proportion of plant dry mass, and N is an important limiting factor to forest productivity (Xu et al. 2016; Zhang et al. 2020).
Forest type affects the species composition and productivity of the ecosystem, with a significant effect on the forest ecosystem C and N stocks (Liu et al. 2018; Wang et al. 2021). Previous studies have documented that C and N concentration vary significantly among tree species and plant organs (Yerena Yamallel et al. 2012; Yao et al. 2015; Liang et al. 2018; Ma et al. 2018; Jing et al. 2020; Zhang et al. 2020). For example conifers, comparing to broad-leaved woody species, have higher C concentration in roots, leaves, and stems (Ma et al. 2018), resulting in a lower organic matter mineralization rate (Shirato and Yokozawa 2006). N-fixers, as some Fabaceae tree species, exhibit higher leaf N concentration than non-fixer species (Taylor and Ostrowsky 2019). Also, many studies reported that the amount and quality of plant woody debris, and non-woody debris, change with forest type and structure, and may affect the biodegradability of soil organic matter (Cools et al. 2014; Mendoza et al. 2014b; Moreira et al. 2019; Wang et al. 2021). This is also strongly affected by species composition (Wang et al. 2019) and stand age (Schilling et al. 2016; Lachowicz et al. 2019). However, how tree size affects tree C and N concentrations is still unclear. Several studies reported that stem C concentration was strongly associated with tree size (Martin and Thomas 2013; Gao et al. 2016; Justine et al. 2017; Ma et al. 2019) while other authors did not find a significant relationship (Ming et al. 2014; Cheng et al. 2015). Due to these controversial results, an analysis on the relationship between C and N concentration and tree size is required.
An accurate estimation of C and N stocks in tree species is important to assess their function in the ecosystem, especially for soils (Pan et al. 2018) and to measure forests potential to reduce atmospheric C and N oxides emissions.
The accuracy of biomass C and N stock evaluation in forests depends on reliable estimates of C and N concentrations per plant species and organs (Ma et al. 2019; Chabi et al. 2019). The variation of N and C in plant organs can be quantified by a stoichiometric scaling relationship, which shows the relative accumulation rate of N compared to C and can be interpreted as the proportional relationships between them. Some authors founded that, overall, N scaled isometrically with C in different ecosystem components, such as mineral soils, forest floor, foliage and litter (McGroddy et al. 2004; Xu et al. 2016) but not in plant organs (Liang et al. 2018). This stoichiometric scaling relationship can contribute to the comprehension of nutrient cycling across plants and ecosystem (Elser et al. 2000; Sardans et al. 2012; Wang et al. 2021).
C:N ratio is a key indicator of elemental compositions of organisms and ecosystems, of N use efficiency, productivity and also fundamental in understanding the coupled biogeochemical cycles in ecosystems (Mendoza et al. 2014a). Thus, knowing C:N variation in organisms and ecosystems is vital for understand these cycles (Sardans et al. 2012; Liang et al. 2018). However, the study of C:N ratios and their variation in forests and among different plant tissues or biomass compartments (leaf, branch, stem, and root) is still limited (Zhang et al. 2020).
In this context, the aims of this work are to determine: a) C and N allocation in different biomass compartments of three N-fixing tree species; b) the scaling relationship between C and N, and c) the C:N ratio variation among compartments and tree size, in Espinal eco-region (northeastern Argentina). In this study we hypothesize that there is no isometric C–N scaling relationships in different compartments. Secondly, that different biomass compartments present different C:N ratios due to their tissue composition, structure and physiological functions. Our third hypothesis is that C:N ratios vary considering the species and tree size.
2 Materials and methods
2.1 Study area
The study was carry out in native forest of Paraná Department, Entre Ríos (31°37´S, 60°0´W, at 74 m. a.s.l.) (Fig. 1). The study area corresponds to the Espinal phytogeographic province, an Argentinean eco-region located between 28° and 40° S latitude (Cabrera 1976). Its geomorphology corresponds to a pen-plain ranging from slightly undulating to plain relief (Plan Mapa de Suelos 1998). Vegetation units correspond to semi-xerophilous forests varying from dense to open, with a single canopy layer, which alternate with savannahs and grassy steppes (Cabrera 1976).
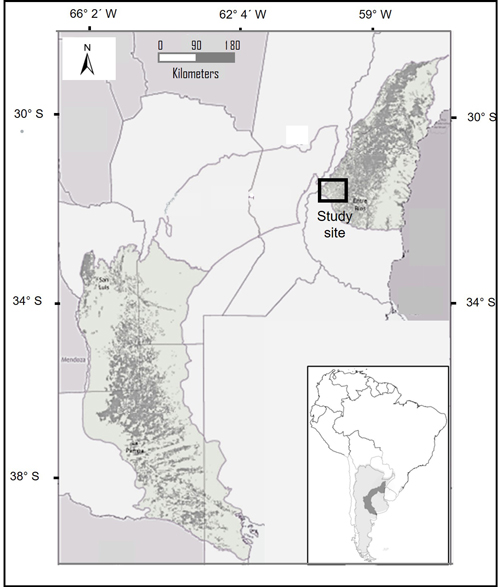
Fig. 1. Location of the study area (Espinal phytogeographic province). Entre Ríos, Argentina (adapted from MAyDS 2020).
The climate is temperate humid; the average annual precipitation is 1000 mm and the mean annual temperature is 18.5 °C. The soil is classified as a fine, smectitic, thermic Typic Hapludert characterized by an argillic horizon with low permeability (Soil Survey Staff 2014). General characteristics of the soils, in the study site, are shown in Table 1. Dominant forest species include three species of the Fabaceae family, Neltuma affinis (Spreng.) C.E. Hughes & G.P. Lewis, Neltuma nigra (Griseb.) C.E. Hughes & G.P. Lewis and Vachellia caven (Molina) Seigler & Ebinger (Tropicos database), all atmospheric N-fixer species (Ferrari and Wall 2004). The average tree density is 1112 individuals ha–1 (Sione et al. 2019).
| Table 1. General characteristics of forest soils in the study area. | |||
| Soil horizons | Source | ||
| A | B1 | ||
| Depth (cm) | 0–12 | 12–25 | Plan Mapa Suelos (1998) |
| Textural class | silty clay loam | silty clay loam | Plan Mapa Suelos (1998) |
| Sand (g kg–1 soil) | 17 | 20 | Plan Mapa Suelos (1998) |
| Silt (g kg–1 soil) | 667 | 662 | Plan Mapa Suelos (1998) |
| Clay (g kg–1 soil) | 316 | 318 | Plan Mapa Suelos (1998) |
| Bulk density (g cm–3) | 1.26 | 1.19 | Own data |
| Organic carbon (mg g–1 soil) | 30.5 | 18.9 | Own data |
| Total nitrogen (mg g–1 soil) | 2.8 | 1.8 | Own data |
| C:N ratio | 10.9 | 10.5 | Own data |
N. affinis, N. nigra and V. caven plants (n = 30 for each species) were sampled within a 48 ha native forests area, in February 2017–February 2019. Diameter classes were ranged in classes of 5 cm, according to maximum and minimum tree diameters (Sione et al. 2019, 2020a,b). Measured plants were felled with a chain saw and separated in size classes of stem basal diameter (BD) at 30 cm above the ground (Table 2). Woody material was partitioned into three compartments: stem (st); large branches with diameter > 5 cm (lb); and small branches (diameter ≤ 5 cm) + leaves, flowers and fruits (sbl).
| Table 2. Number of sampled trees per each diameter class size. | |||||||
| Species | Diameter classes (cm) | ||||||
| 5–10 | 10–15 | 15–20 | 20–25 | 25–30 | 30–35 | >35.0 | |
| Neltuma affinis | 6 | 6 | 6 | 6 | 6 | - | - |
| Neltuma nigra | 4 | 4 | 5 | 6 | 4 | 4 | 3 |
| Vachellia caven | 9 | 7 | 7 | 7 | - | - | - |
2.2 C and N concentrations
C and N concentrations in each compartment were determined in all harvested plants (n = 90). Subsamples of each tree compartment were selected in the field: three main stem portions (basal, central and upper), five large branches portions, and three subsamples of ~250 g were taken from the sbl compartment. Subsamples were oven-dried at 65 ± 2 °C to constant weight and milled (including bark), mixed and sieved (0.5 mm) to obtain homogeneous samples of each compartment. Approximately 20 mg of each sample was used for measuring C and N concentrations. The analysis of C and N was carried out on the LECO analyzer, model TRU SPEC (Leco Corp., St. Joseph, MI, USA), which uses the dry combustion method. C and N concentrations were expressed in mass per unit of dry mass (mg g−1 DM).
When the results indicated different C and N concentrations for compartments, it was necessary to assess how they can be used together to transform the total aboveground biomass of a tree into mass of C and N per plant. In this sense, a weighted average between the three specific C and N concentrations was used, considering the relative allocation of biomass in each compartment, as in Eq. 1 (Pelluso Rodrigues et al. 2014):

where st (C or N) = stem carbon or nitrogen concentration (mg g−1 DM); st (%) = stem biomass allocation (in percentage); lb (C or N) = carbon or nitrogen concentration in large branches (mg g−1 DM); lb (%) = large branches biomass allocation (in percentage); sbl (C or N) = carbon or nitrogen concentration of small branches, leaves, flowers and fruits (mg g−1 DM); sbl (%) = small branches, leaves, flowers and fruits biomass allocation (in percentage). Relative biomass allocated (%) to the different plant compartments was obtained from Sione et al. (2019) and Sione et al. (2020 a,b).
2.3 Statistical analysis
Relationships between compartments and C–N concentrations were tested with simple linear regressions, previous validation of regression assumptions (Quinn and Keough 2002). The differences in C and N concentrations and their ratio between species as well compartments and trees of different sizes within a species were statistically tested with Fishers Least Significant Difference (LSD) test.
To show the intraspecific variability of C:N ratios and the compartment variability of C and N stoichiometry, the coefficient of variation (CV) was calculated for each variable (Guerra Dávila 2014). According to the classification proposed by Nielsen and Bouma (1985), CV ≤ 10%, 10% < CV ≤ 100%, and CV > 100% indicated weak, moderate, and strong variability, respectively.
A Pearson correlation analysis was applied to test correlations between N and C concentrations for each species and compartment. In addition, to evaluate whether N concentrations scale isometrically with respect to C concentrations, a biometric-scaling model (Eq. 2) was used (Sterner et al. 2003; Liang et al. 2018):
![]()
where x is the C concentration (mg g−1), y is the N concentration (mg g−1), a is the intercept and b is the scaling slope.
All statistical analyses were performed using the software Statgraphics Centurion XVI version 16.1 (StatPoint Technologies 2010).
3 Results
3.1 C and N concentrations
C and N concentrations were affected by species and compartments (Table 3); N. nigra presented higher C concentrations (p < 0.05) than the other two species while N. affinis showed the highest N concentrations (p < 0.05). The C concentration ranked as st > lb > sbl; st > sbl > lb; and sbl > st > lb, in N. affinis, N. nigra and V. caven, respectively. The mean concentrations of C in sbl, lb and st across three species are 474.7; 475.0 and 481.7 mg g−1 DM, respectively. N concentration in sbl ranked as N. nigra > N. affinis > V. caven. For all species, N concentration follows an order of: sbl > lb > st, ranging from 5.0 mg g−1 DM (V. caven, st) to 22.8 mg g−1 DM (N. nigra, sbl). In st and lb, highest concentrations of C and N occurr in N. affinis, while V. caven presents the highest concentrations of C in sbl and the lowest concentrations of N in all compartments. N concentration in sbl was highest in N. nigra (p < 0.05).
| Table 3. Mean values of C and N concentrations (mg g–1 DM) for each species (Neltuma affinis, Neltuma nigra and Vachellia caven) and biomass compartment. Different letters indicate statistically significant differences (LSD Fisher p ≤ 0.05) between biomass compartments for the same species. sbl: small branches (diameter ≤ 5 cm) + leaves, flowers and fruits; lb: large branches (diameter > 5 cm); st: stem. | ||||
| Species | Biomass compartment | Carbon concentration (mg g–1 DM) | Nitrogen concentration (mg g–1 DM) | C:N ratio |
| Neltuma affinis | sbl | 457.4 ± 17.4a | 19.1 ± 2.1a | 23.8 ± 2.5a |
| lb | 481.6 ± 12.3b | 10.3 ± 3.2b | 49.0 ± 12.6b | |
| st | 484.9 ± 25.2b | 8.0 ± 3.1b | 69.2 ± 23.6c | |
| Neltuma nigra | sbl | 482.8 ± 6.0ª | 22.8 ± 2.2a | 21.4 ± 2.0a |
| lb | 474.2 ± 11.2b | 7.9 ± 1.2b | 61.3 ± 9.1b | |
| st | 485.5 ± 10.5a | 6.1 ± 1.3b | 83.4 ± 18.8c | |
| Vachellia caven | sbl | 483.8 ± 9.1ª | 18.0 ± 1.8ª | 27.1 ± 2.5a |
| lb | 468.4 ± 7.6b | 7.8 ± 3.3b | 66.0 ± 16.4b | |
| st | 476.0 ± 9.7c | 5.0 ± 1.7b | 104.8 ± 29.7c | |
C and N, in compartments and species, are shown in Table 3. A differential behavior was observed in the variability of the C and N values, resulting in a weak variation coefficient in C (CV: 3.4%) and a moderate one in N (CV: 56.1%). Balanced aboveground biomass C concentration was ranked in an order of N. nigra > V. caven > N. affinis, while balanced aboveground biomass N concentration follows an order of N. affinis > V. caven > N. nigra (Table 4).
| Table 4. Biomass allocation compartments for each species, carbon and nitrogen concentration and C:N ratio (n = 30 for each species). | ||||||
| Species | Compartments participation in aboveground biomass * (mean ± SD) | Balanced aboveground biomass carbon concentration (mg g−1 DM) | Balanced aboveground biomass nitrogen concentration (mg g−1 DM) | Balanced C:N ratio | ||
| small branches, leaves, flowers and fruits (sbl %) | large branches (lb %) | stems (st %) | ||||
| Neltuma affinis | 41.9 ± 6.8 | 25.3 ± 13.6 | 32.8 ± 10.7 | 472.6 | 13.2 | 45.1 |
| Neltuma nigra | 38.0 ± 9.9 | 34.7 ± 17.4 | 27.3 ± 12.8 | 480.0 | 12.4 | 52.2 |
| Vachellia caven | 52.8 ± 9.1 | 23.1 ± 13.9 | 24.1 ± 8.9 | 478.5 | 12.5 | 54.8 |
| * Values from Sione et al. (2019) and Sione et al. (2020a,b) | ||||||
A consistent trend in which, C concentration increases as the diameter increases, was observed. Highest C values were found in individuals with diameters over 35 cm, with a concentration of 486.2 ± 4.7 mg g–1 DM, for all species (value estimated from Eq. 1). This value was significantly higher (p ≤ 0.05) than classes 5–10, 10–15 and 15–20 cm (Supplementary file S1: Table 1). N concentration was not affected by diameter (p = 0.08). Mean balanced aboveground biomass N concentrations, varied between 12.3 mg g–1 DM (class 25–30 cm) and 14.1 mg g–1 DM (class > 35 cm), for all species (Suppl. file S1: Table 1).
Plotting N against C in compartments, two data subsets can be distinguished within each species: one is sbl and, the other is lb and st (Fig. 2). Pearson’s correlation coefficients (r) between C and N concentrations for different compartments of each species, showed that C was positively correlated with N in sbl, being significant only in N. nigra. In the other group (lb and st), the correlation between C and N concentrations was negative in all species, being significant in N. nigra and V. caven. N and C concentrations showed different scaling relationships among biomass compartments. Only in sbl compartment of N. affinis N scaled isometrically with respect to C; the scaling slope is not significantly different from 1 (Table 5), which indicate that N accumulation in sbl is in proportion to C accumulation. Therefore C:N ratios remain constant. For the rest of the species and compartments, scaling slopes of log N and log C relationship were significantly different from 1 (Suppl. file S2: Fig. 1). These results indicates that N concentrations increase higher than C concentrations in sbl of N. nigra and V. caven, therefore C:N ratios would be lower for higher values of C. For all species, there is a faster decrease of N concentration in st and lb as C concentration increases (scaling slope < 1).
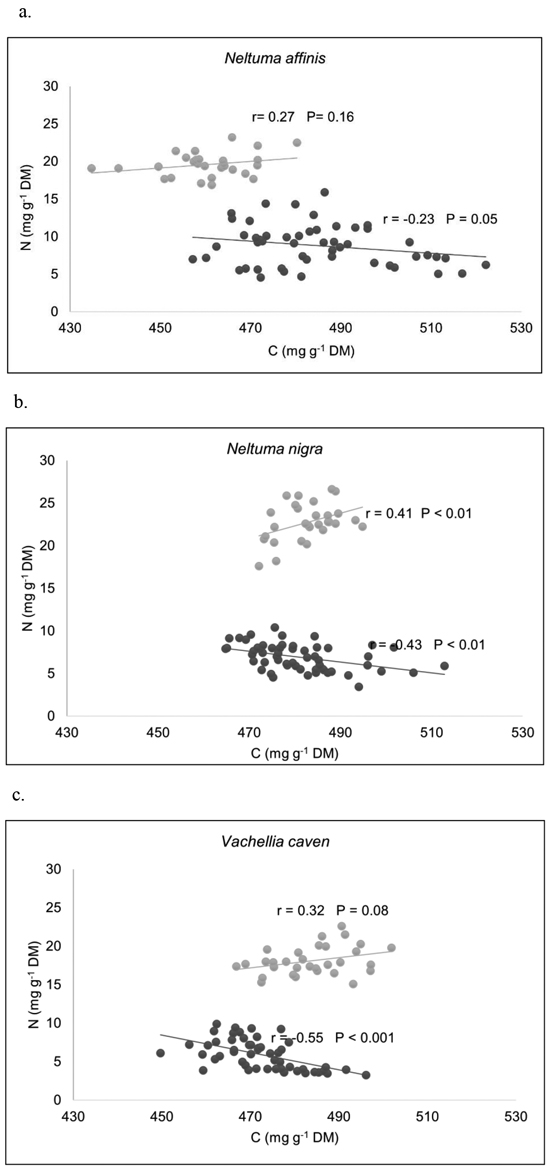
Fig. 2. Relationships between C and N concentrations among biomass compartments, for (a) Neltuma affinis, (b) Neltuma nigra, and (c) Vachellia caven. Pearson’s correlation coefficients (r) showed that C was positively correlated with N in sbl, being significant only in N. nigra. In the group made up of lb and st, the relationship between C and N concentrations resulted negative in all species, being significant in N. nigra and V. caven. DM: dry mass. Legend to a–c: ● = Small branches (diámeter ≤ 5 cm) + leaves + flowers + fruits; ● = stems + large branches.
| Table 5. Biometric-scaling model to evaluate whether N concentrations scale isometrically with respect to C concentrations among biomass compartments. lb: large branches (diameter > 5 cm); st: stem; sbl: small branches (diameter ≤ 5 cm) + leaves, flowers and fruits. Scaling slopes not significantly different from 1.0 indicates isometric C–N scaling relationships. | ||
| Species | Compartment | |
| lb + st | sbl | |
| Neltuma affinis | log N = –2.16 log C + 6.72 | log N = 0.96 log C – 1.27 |
| Neltuma nigra | log N = –4.68 log C + 13.37 | log N = 3.42 log C – 7.82 |
| Vachellia caven | log N = –9.77 log C + 26.89 | log N = 1.68 log C – 3.26 |
3.2 C:N stoichiometry in compartments
Regressing C:N ratios against C and N in whole plants (pooled across species) produced non-significant correlations for C, and significant correlations for N (r = 0.99; p < 0.001) (Fig. 3). C:N ratio and N presented a good negative potential function fit. The C:N ratios, for all compartments, were positively correlated with N concentration but did not exhibit significant association with C concentration. Analysis by species and compartments also revealed a highly significant association between C:N and N concentration, with R2 values ranging from 0.93 to 0.99 (data not shown).
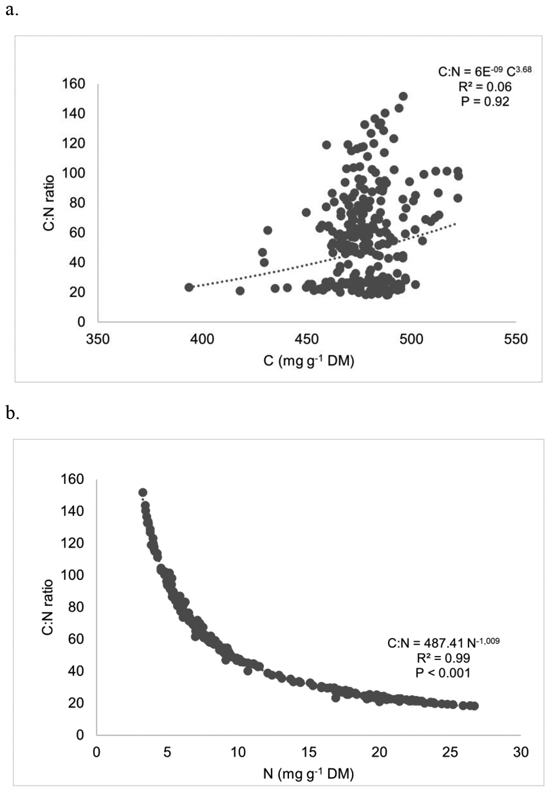
Fig. 3. Regressing C:N ratios against (a) carbon and (b) nitrogen in whole plants (all species). Each point represents a compartment (st, lb or sbl) of a certain individual (n = 254).
It can be observed that C:N ratio varied significantly considering species and compartments (Table 3), but not along tree size (Fig. 4). The sequence for C:N ratios is: V. caven > N. nigra > N. affinis. In this sequence N. affinis presented significantly lower C:N ratios (Kruskal-Wallis, p < 0.05) than the other two species, which is explained by its higher N concentration. The overall C:N ratio for compartments is st > lb > sbl. For all species the coefficients of variation were lower in the C:N ratios for sbl (CV from 9.1% to 10.5%) than those for lb (CV from 14.9% to 27.7%) and st (CV from 22.5% to 34.1%).
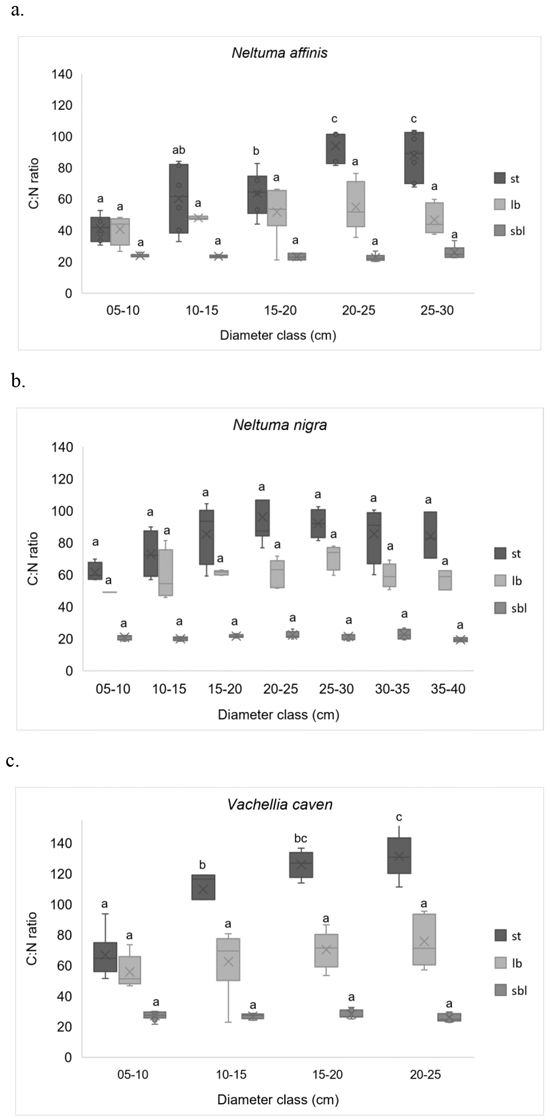
Fig. 4. C:N ratios in different compartments, by diameter classes. (a) Neltuma affinis; (b) Neltuma nigra, and (c) Vachellia caven. Different letters indicate statistically significant differences (LSD Fisher p ≤ 0.05) between diameter classes for the same compartment. sbl: small branches (diameter ≤ 5 cm) + leaves, flowers and fruits; lb: large branches (diameter > 5 cm); st: stems. The “X”s inside the boxes indicates the mean of the data being plotted.
The lowest C:N relations, for st and lb, were recorded for N. affinis; V. caven presented the highest C:N ratios for these components (Table 3). Weighted average C:N ratio was used to exclude C and N concentration differences in each compartment, they were 45.1, 52.2 and 54.8 for N. affinis, N. nigra and V. caven, respectively (Table 4). Intraspecific C:N ratio in sbl and lb did not vary significantly with tree size (Fig. 4), but a direct and significant relationship was detected between stems size and C:N ratio (p < 0.001). Only N. nigra did not exhibit significant changes associated to size in all biomass compartments (Fig. 4).
4 Discussion
In general, sbl compartment was found to be N-richer than st and lb, which is consistent with previous studies (Northup et al. 2005; Mendoza et al. 2014b; Liang et al. 2018). This could be attributed to the presence of leaves in sbl. N-fixer species exhibit 21% higher leaf N concentration than non-fixers (Taylor and Ostrowsky 2019).
C concentrations in Neltuma stems were higher than in the other compartments. Other studies also show that the C concentration varies among tissues (Yerena Yamallel et al. 2012; Jing et al. 2020; Zhang et al. 2020). This is attributed to plant organs which are composed by several organic compounds with different C concentration, such as lignin (63–66% C), cellulose (~44% C), and nonstructural carbohydrates (Poorter and Bergkotte 1992). Tree C concentration was strongly associated to tree size. C concentration increased significantly with increasing BD, being consistent with previous studies (Martin and Thomas 2013; Gao et al. 2016; Ma et al. 2019). This suggest that size-specific C concentrations should be used to obtain accurate forest C stock estimations. In general, the C concentrations obtained in our work are lower than the conversion factor of 50% suggested by IPCC to convert biomass (dry weight) to carbon equivalents (IPCC 2006); therefore, estimations presented in IPCC may overestimate C stocks in the studied area.
Overall, no isometric C–N scaling relationships were found in different compartments (modeled scaling slopes between N and C were different from 1.0), being consistent with our first hypothesis. Other authors have found no isometric C–N scaling relationships in plant organs either, which could be attributed to relatively stable C concentrations, while N concentration is more variable in plant organs. Therefore, C:N ratio variations result from N concentration rather than C concentration (Liang et al. 2018). On the other hand, some studies show that N scaled isometrically with C in different ecosystem components, such as mineral soils, foliage, litter and forest floor (McGroddy et al. 2004; Xu et al. 2016). Our analyses indicated that species-level differences in C:N ratios are mostly affected by N rather than C concentration. Direction and magnitude of the C:N in compartments changes mainly depended on N variation (Liang et al. 2018).
Supporting our second hypothesis that the different biomass compartments present different C:N ratios due to their tissue composition structure and physiological functions, we found that plant compartments differed significantly in their C:N ratio regardless of the species considered. Intraspecific C:N ratios changed significantly with both lb and st among diameter classes while kept stable in sbl. Also, C:N ratios of sbl remain relatively stable among species, with an average of 24.1 ± 3.3. Vachellia aroma (Gillies ex Hook. & Arn.) Seigler & Ebinger presented lower C:N ratios, close to 13.6 (Pérez-Harguindeguy et al. 2000). This can be attributable to the fact that, in our work, sbl compartment includes leaves and small proximal branches.
In addition, variability in C:N ratios were significantly lower in sbl than in st and lb (Fig. 4). We found that sbl C:N ratios did not change, in diameter classes, for a same species. Many studies demonstrated that intraspecific leaf N did not vary significantly with tree size (Han 2011; Liang et al. 2018), but it does across phenological phases (Mendoza et al. 2014b). The stability of C:N ratios in sbl could be attributed to leaf nutrient concentrations, which are limited within a certain range to warrant the plant survival and growth (Aerts and Chapin 2000), while asymmetrical stabilities (among tree organs) could be considered as a N use strategy for species adaptation to changing environments (Liang et al. 2018). This may indicate a trade-off in nutrient investment and allocation among plant organs (Liang et al. 2018; Wang et al. 2021). C:N ratio provides an idea of the plant ecophysiological characteristics and their biogeochemical niche (Peñuelas et al. 2019). Low C:N ratios in sbl, imply that these species have relatively fast decomposition rates (Pérez-Harguindeguy et al. 2000; Mendoza et al. 2014b). Also, N-fixer species exhibit 20% lower C:N ratios than non-fixers (Taylor and Ostrowsky 2019).
Forest litter decomposition is a critical step regulating long-term storage of C and nutrient availability and determining soil fertility which plays an important role in promoting the normal material cycle and nutrient balance (Berg and Mc Claugherty 2008; Song et al. 2008). The rate of plant debris decomposition differs among debris type (Harmon et al. 2013; Mendoza et al. 2014b). For example, non-woody debris such as foliar litter and fine woody debris decompose faster than coarse woody debris (Berbeco et al. 2012), also lower-density woody debris decomposes faster (Wang et al. 2021).
Consistent with our third hypothesis, that indicate that C:N ratios varies considering the species and with tree size, we found that N. affinis presented significantly lower C:N ratios than the other two species, which is attributable to its higher N values. However, the C:N ratio did not vary significantly with tree size. In N. affinis and V. caven stems the C:N ratios were significantly higher in older individuals. This could be attributed to that, with increasing tree size, sapwood will convert to heartwood then lead to an increase of C-rich structural components (Castaño-Santamaría and Bravo 2012; Ma et al. 2019). Woody tissues gain lignin and cellulose (which represents C in the C:N ratio) while losing proteins (which represents N in the C:N ratio) as the individual aged, so there is a tendency to increase the C:N ratio in tissues (Waliszewska et al. 2015; Lachowicz et al. 2019).
5 Conclusions
This work provided a comprehensive evaluation of variations in C and N concentrations and C:N relationship among biomass compartments and tree size in N-fixer species. Our results provide evidences of the importance of using in situ C and N concentrations per main tree species and biomass compartments, for more accurate estimates of C and N stocks in native forests. Also, C concentration variation, among tree diameter classes, suggest that tree size is one the traits that should be taken into consideration for an accurate forest C stock estimation.
C concentrations obtained in our work, are lower than the default value suggested by the IPCC to convert biomass to carbon equivalents; therefore, estimations presented in IPCC may overestimate C stock in the studied area. Our results would support different approaches related to C and N stocks quantification in native forests. For example, information about partitioning and allocation in the main plant compartments could be used for improving the models that simulate the storage of aboveground C and N. This would increase the understanding of these elements dynamics in forest ecosystems. One the other hand, the use of these results will reduce the uncertainty in accounting of C and N emissions resulting from deforestation and native forest degradation and improve information quality on the C and N stock per land cover class.
Authors’ contribution
SMJS: study design, data collection, data processing & figures preparation, writing: original draft. SGL: study design, data collection, data processing, writing: review & editing. PGA: methodology, writing: review & editing. MGW: study design, data processing, writing: review & editing.
Declaration of the availability of research materials and data
The datasets are available upon reasonable request by contacting the corresponding author.
Funding
This work was funded by projects PID UNER 2223 “Carbon capture and fixation as an environmental service of the Espinal forests”, PE INTA I046 “Dynamics of territories and production systems sustainability”, and PUE 056 CONICET “Biodiversity in forest plantation”.
References
Aerts R, Chapin FI (2000) The mineral nutrition of wild plants revisited: a re-evaluation of processes and patterns. Adv Ecol Res 30: 1–67. https://doi.org/10.1016/S0065-2504(08)60016-1.
Berbeco MR, Melillo JM, Orians CM (2012) Soil warming accelerates decomposition of fine woody debris. Plant Soil 356: 405–417. https://doi.org/10.1007/s11104-012-1130-x.
Berg B, Mc Claugherty C (2008). Plant litter: decomposition, humus formation, carbon sequestration. Berlin: Springer-Verlag. https://doi.org/10.1007/978-3-540-74923-3.
Cabrera AL (1976) Regiones fitogeográficas de Argentina. [Argentinian phytogeographics regions]. Enciclopedia Argentina de Agricultura y Jardinería. I2a. Edition. Tomo II, Fas. I. Ed. ACME, Buenos Aires, Argentina.
Castaño-Santamaría J, Bravo F (2012) Variation in carbon concentration and basic density along stems of sessile oak (Quercus petraea (Matt.) Liebl.) and Pyrenean oak (Quercus pyrenaica Willd.) in the Cantabrian Range (NW Spain). Ann Forest Sci 69: 663–672. https://doi.org/10.1007/s13595-012-0183-6.
Cools N, Vesterdal L, De Vos B, Vanguelova E, Hansen K (2014) Trees species is the major factor explaining C:N ratios in European forest soils. For Ecol Manag 311: 3–16. https://doi.org/10.1016/j.foreco.2013.06.047.
Chabi A, Lautenbach S, Tondoh J, Oladokoun Agnila Orekan V, Adu Bredu S, Kyei Bafour N, Mama V, Fonweban J (2019) The relevance of using in situ carbon and nitrogen data and satellite images to assess aboveground carbon and nitrogen stocks for supporting national REDD+programmes in Africa. Carbon Balance Manag 14, article id 12. https://doi.org/10.1186/s13021-019-0127-7.
Cheng J, Lee X, Theng BKG, Zhang L, Fang B, Li F (2015) Biomass accumulation and carbon sequestration in an age sequence of Zanthoxylum bungeanum plantations under the Grain for Green Program in karst regions, Guizhou province. Agric For Meteorol 203: 88–95. https://doi.org/10.1016/j.agrformet.2015.01.004.
Elser JJ, Fagan WF, Denno RF, Dobberfuhl DR, Folarin A, Huberty A, Interlandi S, Kilham SS, McCauleyk E, Schulz KL, Siemann EH, Sterner RW (2000) Nutritional constraints in terrestrial and freshwater food webs. Nature 408: 578–580. https://doi.org/10.1038/35046058.
Ferrari AE, Wall LG (2004) Utilización de árboles fijadores de nitrógeno para la revegetación de suelos degradados. [Utilization of nitrogen fixing trees for revegetation of degraded soils]. Revista Fac Agron 105: 63–87. http://sedici.unlp.edu.ar/bitstream/handle/10915/15679/Documento_completo.pdf?sequence=1&isAllowed=y. Accessed 1 April 2022.
Gao B, Taylor AR, Chen HYH, Wang J (2016) Variation in total and volatile carbon concentration among the major 229 tree species of the boreal forest. For Ecol Manag 375: 191–199. https://doi.org/10.1016/j.foreco.2016.05.041.
Guerra Dávila T (2014). Bioestadística. 1ª. Edición. UNAM, FES Zaragoza, México. https://doi.org/10.22201/fesz.9786070261015p.2014.
Han Q (2011) Height-related decreases in mesophyll conductance, leaf photosynthesis and compensating adjustments associated with leaf nitrogen contents in Pinus densiflora. Tree physiol 31: 976–84. https://doi.org/10.1093/treephys/tpr016.
Harmon ME, Fasth B, Woodall CW, Sexton J (2013) Carbon concentration of standing and downed woody detritus: effects of tree taxa, decay class, position, and tissue type. For Ecol Manag 291: 259–267. https://doi.org/10.1016/j.foreco.2012.11.046.
Intergovernmental Panel on Climate Change (IPCC) (2006) 2006 IPCC Guidelines for National Greenhouse Gas Inventories. Prepared by the National Greenhouse Gas Inventories Programme. Eggleston HS, Buendia L, Miwa K, Ngara T, Tanabe K (eds). IGES, Japón.
Jing G, Hu T, Liu J, Cheng J, Li W (2020) Biomass estimation, nutrient accumulation, and stoichiometric characteristics of dominant tree species in the semi-arid region on the Loess Plateau of China. Sustainability 12, article id 339. https://doi.org/10.3390/su12010339.
Justine MF, Yang W, Wu F, Khan MN (2017) Dynamics of biomass and carbon sequestration across a chronosequence 245 of masson pine plantations. J Geophys Res Biogeosci 122: 578–591. https://doi.org/10.1002/2016jg003619.
Lachowicz H, Wróblewska H, Wojtan R, Sajdak M (2019) The effect of tree age on the chemical composition of the wood of silver birch (Betula pendula Roth.) in Poland. Wood Sci Technol 53: 1135–1155. https://doi.org/10.1007/s00226-019-01121-z.
Liang X, Liu S, Wang H, Wang J (2018) Variation of carbon and nitrogen stoichiometry along a chronosequence of natural temperate forest in northeastern China. J Plant Ecol 11: 339–350. https://doi.org/10.1093/jpe/rtx008.
Liu X, Trogisch S, He J, Niklaus PA, Bruelheide H, Tang Z, Erfmeier A, Scherer-Lorenzen M, Pietsch K, Yang B, Kühn P, Scholten T, Huang Y, Wang C, Staab M, Leppert KN, Wirth C, Schmid B, Ma K (2018) Tree species richness increases ecosystem carbon storage in subtropical forests. Biol Sci 285, article id 20181240. https://doi.org/10.1098/rspb.2018.1240.
Ma S, He F, Tian D, Zou D, Yan Z, Yang Y, Zhou T, Huang K, Shen H, Fang J (2018) Variations and determinants of carbon content in plants: a global synthesis. Biogeosciences 15: 693–702. https://doi.org/10.5194/bg-15-693-2018.
Ma S, Eziz A, Tian D, Yan Z, Cai Q, Jiang M, Ji C, Fang J (2019) Tree size and age induced stem carbon content variations cause an uncertainty in forest carbon stock estimation. Biogeosciences Discuss. [preprint]. https://doi.org/10.5194/bg-2019-87.
Martin AR, Thomas SC (2013) Size-dependent changes in wood chemical traits: a comparison of neotropical 264 saplings and large trees. AoB Plants 5, article id plt039. https://doi.org/10.1093/aobpla/plt039.
MAyDS. Ministerio de Ambiente y Desarrollo Sustentable de la Nación Argentina (2020) Segundo Inventario Nacional de Bosques nativos. Informe regional Espinal y Delta e Islas del Río Paraná. [Second National Forest Inventory. Regional report Espinal and Delta and Río Paraná Islands]. Primera revisión.
McGroddy ME, Daufresne T, Hedin LO (2004) Scaling of C: N: P stoichiometry in forests worldwide: implications of terrestrial redfield-type ratios. Ecology 85: 2390–2401. https://doi.org/10.1890/03-0351.
Mendoza C, Turrión MB, Aceñolaza PG, Gallardo J, Pando V (2014a) Retranslocación de nutrientes en especies dominantes de bosques del Espinal Mesopotámico (Argentina). [Nutrient resorption in dominant species of forests in the ‘Espinal Mesopotámico’ (Argentina)]. Bosque 35: 185–193. https://doi.org/10.4067/S0717-92002014000200006.
Mendoza C, Gallardo Lancho JF, Aceñolaza PG, Turrión MB, Pando V (2014b) Temporal evolution of litterfall and potential bio-element return in a successional forest sequence of the Espinal Ecorregion, Argentina. For Syst 23: 411–424. https://doi.org/10.5424/fs/2014233-05007.
Ming A, Jia H, Zhao J, Tao Y, Li Y (2014) Above- and below-ground carbon stocks in an indigenous tree (Mytilaria laosensis) plantation chronosequence in subtropical China. Plos One 9, article id e109730. https://doi.org/10.1371/journal.pone.0109730.
Mitchard N (2018) The tropical forest carbon cycle and climate change. Nature 559: 527–534. https://doi.org/10.1038/s41586-018-0300-2.
Moreira AB, Gregoire TG, do Couto HT (2019) Estimation of the volume, biomass and carbon concentration of coarse woody debris within two forest types in the state of São Paulo, Brazil. For Int J Forest Res 92: 278–286. https://doi.org/10.1093/forestry/cpz009.
Nielsen DR, Bouma J (1985) Soil spatial variability. Pudoc, Wageningen.
Northup BK, Zitzerb SF, Archerc S, McMurtryc CR, Bouttond TW (2005). Above-ground biomass and carbon and nitrogen content of woodyspecies in a subtropical thornscrub parkland. J Arid Environ 62: 23–43. https://doi.org/10.1016/j.jaridenv.2004.09.019.
Pan P, Zhao F, Ning JK, Zhang L, Ouyang XZ, Zang H (2018). Impact of understory vegetation on soil carbon and nitrogen dynamic in aerially seeded Pinus massoniana plantations. PLoS ONE 13, article id e0191952. https://doi.org/10.1371/journal.pone.0191952.
Pelluso Rodrigues D, Hamacher C, Estrada GCD, Soares MLG (2014). Variability of carbon content in mangrove species: effect of species, compartments and tidal frequency. Aquat Bot 120: 346–351. https://doi.org/10.1016/j.aquabot.2014.10.004.
Peñuelas J, Fernández-Martínez M, Ciais P, Jou D, Piao S, Obersteiner M, Vicca S, Janssens IA, Sardans J (2019) The bioelements, the elementome, and the biogeochemical niche. Ecology 100, article id e02652. https://doi.org/10.1002/ecy.2652.
Pérez-Harguindeguy N, Díaz S, Cornelissen JHC, Vendramini F, Cabido M, Castellanos A (2000) Chemistry and toughness predict leaf litter decomposition rates over a wide spectrum of functional types and taxa in central Argentina. Plant Soil 218: 21–30. https://doi.org/10.1023/A:1014981715532.
Plan Mapa de Suelos (1998) Carta de Suelos de la República Argentina. Departamento Paraná, Provincia de Entre Ríos. [Soil Charter of República Argentina. Paraná Department, Entre Ríos Province]. Serie Relevamiento de Recursos Naturales Nº 17.
Poorter H, Bergkotte M (1992) Chemical composition of 24 wild species differing in relative growth rate. Plant Cell Environ 15: 221–229. https://doi.org/10.1111/j.1365-3040.1992.tb01476.x.
Quinn G, Keough M (2002) Experimental design and data analysis for biologists. Cambridge University Press, USA. https://doi.org/10.1017/CBO9780511806384.
Sardans J, Rivas-Ubach A, Peñuelas J (2012) The elemental stoichiometry of aquatic and terrestrial ecosystems and its relationships with organismic lifestyle and ecosystem structure and function: a review and perspectives. Biogeochemistry 111: 1–39. https://doi.org/10.1007/s10533-011-9640-9.
Schilling EM, Waring BG, Schilling JS, Powers JS (2016) Forest composition modifies litter dynamics and decomposition in regenerating tropical dry forest. Oecologia 182: 287–297. https://doi.org/10.1007/s00442-016-3662-x.
Shirato Y, Yokozawa M (2006) Acid hydrolysis to partition plant material into decomposable and resistant fractions for use in the Rothamsted carbon model. Soil Biol Biochem 38: 812–816. https://doi.org/10.1016/j.soilbio.2005.07.008.
Sione SM, Andrade-Castañeda HJ, Ledesma SG, Rosenberger LJ, Oszust JD, Wilson MG (2019) Aerial biomass allometric models for Prosopis affinis Spreng. in native forests of Argentina. Rev Bras de Eng Agricola e Ambient 23: 467–473. https://doi.org/10.1590/1807-1929/agriambi.v23n6p467-473.
Sione SM, Ledesma SG, Rosenberger LJ, Oszust JD, Andrade HJ, Maciel GO, Wilson MG, Sasal MC (2020a) Ecuaciones alométricas de biomasa aérea para Prosopis nigra Griseb. Hieron “algarrobo negro” (Fabaceae) en bosques de Entre Ríos (Argentina). [Allometric equations of aerial biomass for Prosopis nigra (Griseb.) Hieron “algarrobo negro” (Fabaceae) in forests of Entre Ríos (Argentina]. Agron Ambiente UBA: 40: 63–76.
Sione SM, Ledesma SG, Rosenberger LJ, Oszust JD, Andrade HJ, Maciel GO, Wilson MG (2020b) Modelos alométricos de biomasa aérea para Vachellia caven Mol. Molina en bosques nativos del Espinal (Argentina). [Biomass allometric models for Vachellia caven Mol. Molina in native Espinal forests (Argentina]. Quebracho 28: 20–33. https://fcf.unse.edu.ar/archivos/quebracho/v28n1a03.pdf. Accesed 24 April 2022.
Soil Survey Staff (2014) Keys to soil taxonomy, 12th ed. United States Department of Agriculture, Natural Resources Conservation Service, Washington, DC.
Song H, Jiang HL, Zhang SQ, Yu GM, Zhou YD, Ma X, Chang S (2008) A review on the effects of global environment change on litter decomposition. Acta Ecol Sin 28: 4414–4423. https://www.researchgate.net/publication/286394899_A_review_on_the_effects_of_global_environment_change_on_litter_decomposition. Accessed 22 August 2022.
StatPoint Technologies (2010) Statgraphics centurion. StatPoint Technologies Inc, Warrenton.
Sterner RW, Elser JJ (2003) Ecological stoichiometry: the biology of elements from molecules to the biosphere. Princeton University Press. https://doi.org/10.1515/9781400885695.
Taylor B, Ostrowsky L (2019) Nitrogen-fixing and non-fixing trees differ in leaf chemistry and defence but not herbivory in a lowland Costa Rican rain forest. J Trop Ecol 35: 270–279. https://doi.org/10.1017/S0266467419000233.
Waliszewska B, Prądzyński W, Zborowska M, Stachowiak-Wencek A, Waliszewska H, Spek-Dźwigała A (2015) The diversification of chemical composition of pine wood depending on the tree age. Ann Wars Univ Life Dciences SGGW For Wood Technol 91: 182–187.
Wang Z, Zhao L, Bai Y, Li F, Hou J, Li X, Jiang Y, Deng Y, Zheng B, Yang W (2021) Change in plants debris and carbon stocks across a subalpine forest successional series. For Ecosyst 8, article id 40. https://doi.org/10.1186/s40663-021-00320-0.
Xu X, Li D, Cheng X, Ruan H, Luo Y (2016) Carbon: nitrogen stoichiometry following afforestation: a global synthesis. Sci Rep 6, article id 19117. https://doi.org/10.1038/srep19117.
Yao F, Chen Y, Yan Z, Li P, Han W, Fang J (2015) Biogeographic patterns of structural traits and C:N:P stoichiometry 316 of tree twigs in China’s forests. Plos One 10, article id e0116391. https://doi.org/10.1371/journal.pone.0116391.
Yerena Yamallel JI, Jiménez P, Aguirre C, Treviño G (2012) Contenido de carbono total de especies arbóreas y arbustivas en áreas con diferente uso, en el matorral espinoso tamaulipeco, en México. [Total carbon content of the components of trees and shrubs species in areas with different use, in tamaulipan thornscrub, Mexico]. Bosque 33: 145–152. https://doi.org/10.4067/S0717-92002012000200004.
Zhang J, He N, Liu C, Xu L, Chen Z, Li Y, Wang R, Yu G, Sun W, Xiao C, Chen H, Reich P (2020) Variation and evolution of C:N ratio among different organs enable plants to adapt to N-limited environments. Glob Change Biol 26: 2534–2543. https://doi.org/10.1111/gcb.14973.
Total of 56 references.
Send to email
