Jonas Fridman  ,
Sören Holm,
Mats Nilsson,
Per Nilsson,
Anna Hedström Ringvall,
Göran Ståhl
,
Sören Holm,
Mats Nilsson,
Per Nilsson,
Anna Hedström Ringvall,
Göran Ståhl
Adapting National Forest Inventories to changing requirements – the case of the Swedish National Forest Inventory at the turn of the 20th century
Fridman J., Holm S., Nilsson M., Nilsson P., Ringvall A. H., Ståhl G. (2014). Adapting National Forest Inventories to changing requirements – the case of the Swedish National Forest Inventory at the turn of the 20th century. Silva Fennica vol. 48 no. 3 article id 1095. https://doi.org/10.14214/sf.1095
Highlights
- National Forest Inventories supply invaluable long term time series of forest state. Recent developments and international harmonization of modern NFIs widen the scope to even include ecosystem goods, e.g. biodiversity and carbon sequestration. The combination of NFI field data with remote sensing techniques can give good estimates for areas smaller than national and regional level.
Abstract
National Forest Inventories (NFIs) are becoming increasingly important worldwide in order to provide information about the multiple functions of forests, e.g. their provision of raw materials to industry, biodiversity and their capacity to store carbon for mitigating climate change. In several countries the history of NFIs is very long. For these countries a specific challenge is to keep the inventories up-to-date without sacrificing the advantages associated with long time series. At the turn of the 20th century European NFIs faced some major challenges. In this article we describe the history and the recent developments of the Swedish NFI as an example from which general observations are made and discussed. The Swedish NFI started in 1923 and has evolved from an inventory with a narrow focus on wood resources to an inventory today which aims to provide information about all major forest ecosystem services. It can be concluded that the traditional approaches of most European NFIs, e.g. to collect data through sample plot field inventories, has proved to be applicable even for a wide range of new information requirements. Specifically, detailed data about land use, trees, vegetation, and soils has found new important uses in connection with biodiversity assessments and the estimation of greenhouse gas emissions. Though time-consuming and difficult, making NFI information comparable across countries through harmonization appears to be a useful approach. The European National Forest Inventory Network (ENFIN) was formed in 2003 and has been successful in pan-European NFI harmonization.
Keywords
remote sensing;
sampling;
sample plot inventory;
forest state;
ENFIN;
harmonization
-
Fridman,
Swedish University of Agricultural Sciences (SLU), SE-901 83 Umeå, Sweden
E-mail
jonas.fridman@slu.se
- Holm, Swedish University of Agricultural Sciences (SLU), SE-901 83 Umeå, Sweden E-mail soren.holm@slu.se
- Nilsson, Swedish University of Agricultural Sciences (SLU), SE-901 83 Umeå, Sweden E-mail mats.nilsson@slu.se
- Nilsson, Swedish University of Agricultural Sciences (SLU), SE-901 83 Umeå, Sweden E-mail per.nilsson@slu.se
- Ringvall, Swedish University of Agricultural Sciences (SLU), SE-901 83 Umeå, Sweden E-mail Anna.Ringvall@slu.se
- Ståhl, Swedish University of Agricultural Sciences (SLU), SE-901 83 Umeå, Sweden E-mail goran.stahl@slu.se
Received 23 January 2014 Accepted 12 May 2014 Published 2 July 2014
Views 6103054
Available at https://doi.org/10.14214/sf.1095 | Download PDF

Supplementary Files
1 Introduction
National Forest Inventories (NFIs) are conducted in a large number of countries worldwide (Tomppo et al. 2010). Their typical purpose is to provide information for strategic level forest and environmental decisions, not only at national and sub-national level, but also at larger geographical scales since data are regularly reported to international organizations (e.g., FAO 2010; Forest Europe 2011).
Many NFIs have a long history; in the Nordic countries some NFIs started already around the 1920s (Thorell and Östlin 1931; Tomppo et al. 2010). At this time society’s main concern was the scarcity of wood resources while today the interests in forests have broadened considerably. Nowadays forests are managed to provide multiple ecosystem goods and services, such as raw materials from wood and fiber, bioenergy, biodiversity, carbon sequestration, and recreation. As a consequence, the requirement for information from NFIs has broadened and a current challenge for many NFIs is how to maintain and expand the long time series of traditional data while at the same time make modifications in order to accommodate new kinds of information. For example, over the last decades many NFIs have become important sources of information about biodiversity conditions and greenhouse gas emissions (e.g. Fridman and Walheim 2000; Cienciala et al. 2008; Tomppo et al. 2010; Corona et al. 2011; Dunger et al. 2012; Chirici et al. 2012).
The task of revising the NFIs is not trivial. In order to maintain time series that allow meaningful comparisons across different time periods there is a need to maintain definitions and assessment techniques, as well as a certain level of skill among the surveyors. Changes in any of these factors may lead to inconsistencies in data between different time periods (e.g. Wulff 2004). However, it is imperative for NFIs to adapt to new information requirements and to adopt new methods in order to be cost-efficient. Thus, changes must be made continuously or otherwise the NFIs would become outdated.
NFI development and adaptation involves several issues related to the data collection and data analysis, for example:
- New methods and techniques for data acquisition offer possibilities to: (i) reduce the cost of NFIs, (ii) acquire new types of information and to (iii) increase the precision of estimates. This includes techniques both for observation through remote sensing (e.g. Gregoire et al. 2011; Næsset et al. 2013) and through field survey. However, different methods may lead to different error structures in terms of random and systematic errors in the acquired data (e.g., Ringvall et al. 2005; Milberg et al. 2008).
- It may be necessary to modify definitions in order to conform to new information requirements or in order to make information comparable across countries (Tomppo et al. 2010). However, changes in definitions make it difficult to compare information of the same kind from different time points, unless certain harmonization methods are applied (Ståhl et al. 2012).
- New variables regularly need to be included in the NFIs to meet new information requirements. However, the inclusion of new variables in field surveys must be carefully evaluated from the point of view of time consumption and surveyor skills in order to avoid assessment errors (Ringvall et al. 2005).
NFI development involves collaboration with both national and international user groups in order to respond to new information requirements. It also needs to be well founded in everyday NFI work and requires therefore an understanding of what changes are possible to implement without sacrificing the quality of the data.
The Swedish NFI has a long history. It started in 1923 as a county-by-county field survey of sample belts, i.e. some counties were completed each year. In 1929 the work was complete for all 24 counties and national estimates could be calculated (SOU 1932). Over time, it has evolved into a sample-plot based multi-purpose inventory, which in addition to providing regional and national level statistics also produces national full-coverage forest maps by combining field and remote sensing data (Nilsson et al. 2003). Similar developments have occurred in the Nordic countries, i.e. Norway (Gjertsen 2007) and Finland (Tomppo et al. 2010; Mäkelä et al. 2011). Along with the Nordic NFIs, the American NFI was also started in the 1920s, whereas a sample-based NFI was not initiated in Canada until 1981 (Magnussen et al. 2009; Gillis et al. p. 97–111, in Tomppo et al. 2010).
The objective of this article is to identify and discuss the challenges that NFIs with a long tradition face in the transition to meet new requirements. We use the Swedish NFI as a case example and show what challenges this inventory faced at the turn of the 20th century. We describe what changes were implemented and discuss to what extent they were successful.
2 Development of the Swedish NFI 1923–2000
2.1 Scope of the NFI
The state of forest resources in Sweden has been of great interest since at least the 16th century, when a fear of local over-utilization of resources was expressed (Värmlands... 1914). In 1735 the Swedish county governors were ordered to report to the King on the state of their forests and in 1849 the first national estimates of timber consumption and growth were reported by Israel af Ström (Värmlands... 1914). Concern over unsustainable forestry practices eventually led to the initiation of the first Swedish NFI in 1923 (Thorell and Östlin 1931; SOU 1932), following major pilot studies in 1910.
The scope of the Swedish NFI, as for many NFIs, steadily has become broader since its start in 1923. Here we describe the development from the start to the situation at the turn of the century, i.e. approximately year 2000.
Initially, the NFI primary focus was the assessment of land and forest categories, growing stock, and annual growth (SOU 1932); in 1938 an inventory of stumps was introduced to facilitate the estimation of annual harvests (von Segebaden 1998). Site characteristics, including vegetation, have always been part of the inventory (e.g. Ohlsson 1975). However, starting in 1961, special emphasis was given to this area through the establishment of a separate soil inventory which was linked to the NFI. Since 1983 the Swedish Forest Soil Inventory (SFSI) has been undertaken on a sub-sample of the Swedish NFI’s permanent plots. Initially, the purpose of this inventory was to assess areas and distributions of forest soil types in Sweden, but also to obtain information about soil nutrient and mineral contents, including acidity (pH). Up until 2002 the SFSI was also responsible for undertaking a detailed vegetation assessment, including presence/absence registrations and coverage of some 270 species or species groups of trees, bushes, plants, mosses, and lichens. For example, Hägglund and Lundmark (1981) used SFSI data to develop a site classification system for Sweden. During the 1990’s the focus of the vegetation survey gradually shifted from site quality assessment towards analysis of biodiversity and effects of climate change, and from 2003 the Swedish NFI is responsible of this detailed vegetation assessment, partly financed by the Swedish Environmental Protection Agency (SEPA).
The last quarter of the 20th century has seen a global increase in interest for air pollution, biological diversity and climate change. The Convention on Long-range Transboundary Air Pollution (CLRTAP) entered into force in 1983 and brought about detailed specifications for the assessments of tree crown condition and forest damage. Although these were implemented mainly in a separate programme (ICP Forests; Lorenz 1995), the perceived importance of these issues led to the inclusion of similar assessments in the Swedish NFI. The United Nations Convention on Biological Diversity (UNCBD) and the Framework Convention on Climate Change (UNFCCC) were agreed upon and signed by Sweden in 1993 and 1998 respectively. One important consequence of this was that the Swedish forestry legislation in 1994 was modified to give an equal weight to productivity and biodiversity objectives (SKSFS 1993; Lämås and Fries 1995). Another important consequence was that the Swedish Government decided to establish specific Environmental Quality Objectives, covering all major areas where threats to the environment were perceived.
The discussion about the need for increased protection of forests was vigorous during the 1990’s, both internationally (e.g. Hansson 1992; Haila and Kouki 1994) and in Sweden (Nilsson and Götmark 1992; Liljelund et al. 1992; Berg et al. 1994). Therefore, a special inventory within forest reserves – which had so far been excluded from the NFI – was performed by the NFI in 1994 and 1997. By applying the regular NFI fieldwork protocol within forest reserves, comparisons of protected and non-protected forests became straightforward (Fridman 2000). Similarly, as deadwood was identified as an important indicator of biodiversity (e.g. Harmon et al. 1986) it was introduced in the NFI in 1994 and first results were published by Fridman and Walheim (2000). Several other adaptations were made to account for biodiversity conditions, such as special inventories of retention trees and areas set aside in connection with harvesting.
Thus, at the turn of the century, a number of recent global agreements related to air pollution, biodiversity, and climate change, were powerful drivers of forest information requirements. Concerns about the harmful effects of air-pollution and loss of biodiversity had already made some important impressions in the NFI. However, estimates of growing stock, annual growth and cuttings remained as the back-bone of the inventory.
2.2 Design of the NFI
This first NFI was carried out as a belt-survey, county-by-county, between 1923 and 1929 (Fig. 1).
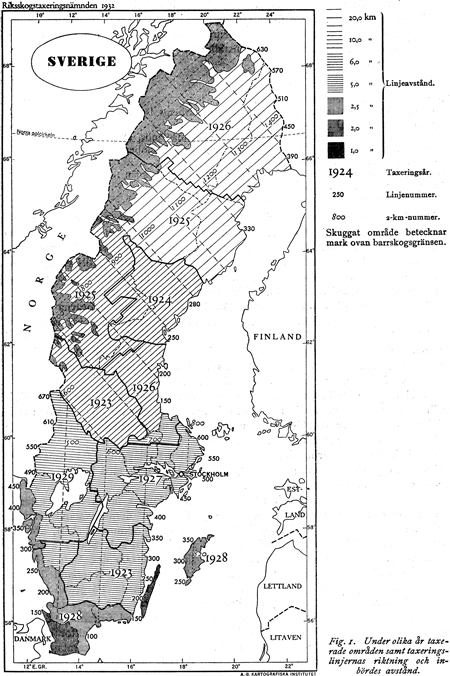
Fig. 1. The design of the first Swedish NFI (1923–1929). Delineated areas indicate counties with year of inventory and pattern within areas visualizes distance between belts and their direction.
Since 1929 the design of the NFI has been modified at several occasions (Table 1, Fig. 2). The first major changes were introduced step by step between 1938 and 1952. Due to information about the spatial autocorrelation of forest state obtained from the first NFI, the sampled area could be dramatically decreased through measuring only a limited number of sample plots which were in turn clustered into, so called, tracts. The transition from belts to sample plots within tracts, comprising approximately one day’s work, was finalized in 1952. The work to optimize the NFI design formed the background for Matérn’s (1960) ground-breaking development of spatial statistics. Another important change compared to the county-by-county inventories was that the sample from 1953 onwards covered the entire country annually (e.g. Ohlsson 1975), so that up-to-date information could be regularly obtained for the entire country each year. Further, the country was divided into five strata with decreasing sampling intensity towards the north.
| Table 1. An overview of the design of the Swedish NFI at different time points. | ||
| Period | Design | Coverage |
| 1923–29 | Sampling of temporary belts 10 m wide | County-wise |
| 1938–52 | Sampling of temporary belts combined with temporary plots positioned along the center line of the belt | County-wise |
| 1953–72 | Sampling of temporary tracts, i.e. a cluster of plots where the plots are positioned along the sides of a rectangle with varying side length depending on stratum | Whole country, 1/10th annually |
| 1973–82 | Sampling of temporary tracts, i.e. a cluster of plots where the plots are positioned along the sides of a rectangle with varying side length depending on stratum | Whole country, 1/5th annually |
| 1983–92 | Sampling of temporary and permanent tracts. Permanent tracts re-measured every 5th year | Whole country, 1/5th annually |
| 1993–02 | Sampling of temporary and permanent tracts. Varying re-measurement interval | Whole country, varying from 1/10th to 1/5th annually |
| 2003– | Sampling of temporary and permanent tracts. Permanent tracts re-measured every 5th year | Whole country, 1/5th annually |
During the 1960s and 1970s, very little was changed with regard to NFI design. In 1983, permanent tracts were introduced (Ranneby et al. 1987), mainly in order to increase the accuracy of change estimation (Schreuder et al. 1993) but also for making the data more applicable to research and for improving estimates of current state.
A visualization of Table 1 is presented in Fig. 2. The historical development is also comprehensively covered in von Segebaden (1998).
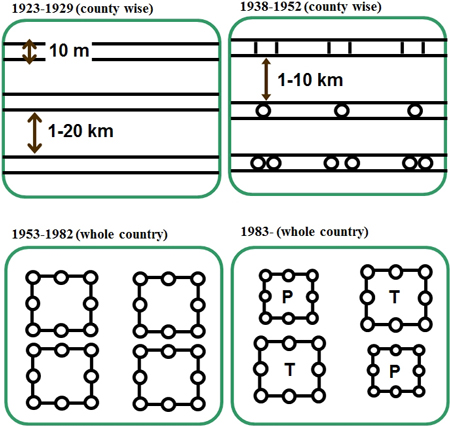
Fig. 2. The design of the Swedish NFI from 1923 onwards (T = temporary, P = permanent). The squares
are tracts (clusters of sample plots) with side-length 300–1800 m, and the circles are sample plots.
The permanent tracts were established during the years 1983 to 1987 and re-measured for the first time after five years in 1988 to 1992. The intention was to maintain a 5-year interval over time. However, the financial situation led to a decision to reduce the field work so that inventory of permanent tracts was performed only in southern Sweden in 1993 and only in northern Sweden in 1994. The disadvantages for the estimation and reporting for less than the entire country each year soon became clear. Thus, from 1995 and onwards the measurements of permanent tracts again covered the entire country annually, but the number of tracts was reduced by 50 percent. The overall effect was that the re-measurement interval was extended from 5 years to 6, 9 and 10 years for permanent tracts, depending on which year a tract had been established.
The change in configuration of the permanent plots was supplemented with modifications in measurements of trees on the plots. Between 1983 and 2003, several different plot configurations were applied, as illustrated in Fig. 3. Despite these changes due to financial problems, comparable estimates for official Swedish statistics were produced annually.
2.3 Estimation principles
Estimation of growing stock and increment has a long tradition in forest inventories. In the first Swedish NFI, sample trees were tallied within diameter classes. In each diameter class, sub-sample trees were selected with class-dependent probability, e.g. 0.01 for the smallest diameter classes to 0.2 for the largest (SOU 1932). Detailed measurements, including diameter at breast height, height, bark thickness and age, were carried out on these sub-sample trees. By applying volume and growth tables, estimation was straightforward as the probabilities of inclusion of the sub-sample trees were known.
Following the introduction of hand-held field computers, sub-sample trees were selected from the sample trees using probability proportional to size (basal area) methods. Sample trees were callipered on different plot sizes depending on the diameter at breast height (dbh) of the sample trees (Fig. 3) and estimation was model-dependent using regression models for tree volume (e.g. Näslund and Hagberg 1951, 1953).
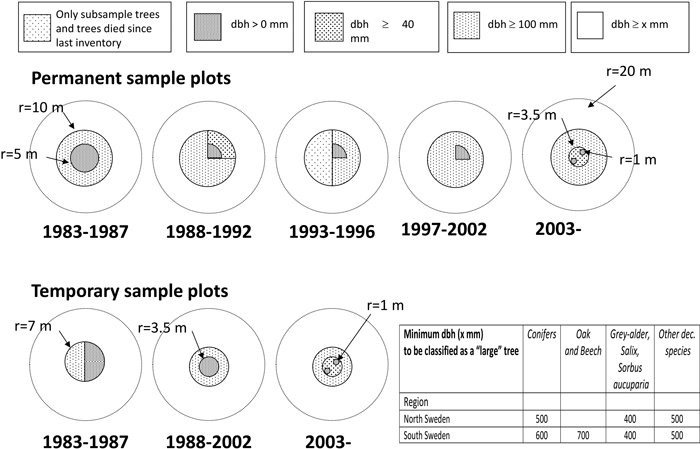
Fig 3. Changes in sample plot design from 1983 onwards for permanent (above) and temporary plots (below).
From 1973 and onwards, the estimation principle for many of the tree-related parameters has been to assign values to the sample trees, utilizing data from the sub-sample trees (Holm et al. 1979). Then, estimation proceeds as if tree characteristics such as height, growth, and volume were actually measured on all trees. While this approach fails to account for model errors in the uncertainty assessment, recent studies (e.g. Ståhl et al. 2014) have shown that the magnitude of these errors is fairly small. Different techniques have been applied for assigning characteristics to sample trees. The procedures used from about 1990 onwards are based on a large set of regression models, developed using the data from the sub-sample trees. The details are described in Appendix A.
To estimate stratum totals (e.g., total area or total volume) ratio estimators with respect to area are used. The official total area per NFI stratum is obtained from the Swedish Land Survey. Separate estimators are used for each year and each type of plot (permanent and temporary) and a weighting procedure is applied in order to obtain averages over all plots for a given number of years. The details are provided in Appendix B.
2.4 Analysis and reporting
The most common use of data from the Swedish NFI has been to report growing stock, annual increment and felling, to a wide range of stakeholders. Initially the results were mainly reported for individual counties following the completion of the survey within a given region. The first reports were produced as Swedish Government Official Reports (SOUs) which reflects the importance of these analyses. The first ever report was SOU (1932), comprising the results from the first NFI (1923–29).
The change in 1953, from a county-by-county inventory to an inventory with national coverage every year, (Table 1, Fig. 2) resulted in new possibilities for presenting statistics from the NFI. For most parameters of interest the accuracy of the estimates was good enough to present results based on five years moving averages, as an alternative to using data from full 10 year cycles (cf. Table 1). This allowed for flexible and more rapid presentation of statistics and the NFI started to produce special reports every fifth year. In 1953 the Swedish Forest Agency also started to publish The Statistical Yearbook of Forestry, with a substantial contribution from NFI-data.
Forestry scenario analysis has always been an important motivation for the collection of NFI data and the first analyses of this kind were undertaken as early as the 1857 by Israel af Ström (Värmlands... 1914). Early scenario analyses based on NFI data are presented in SOU (1933). It is interesting to note a shift from household needs at the turn of the 19th century to industrial needs in the beginning of the 20th century. This focus remained until the 1970s, i.e. the key questions related to the scenario analyses were linked to growth and potential felling from an industrial wood-consumption perspective. In later scenario analyses, e.g. AVB 1985 (Bengtsson et al. 1989), the scope of the analyses broadened.
In 1981, the Swedish NFI started to publish an annual compilation of statistics about the Swedish forests, called SKOGSDATA, which is still published annually and constitutes the primary statistics product from the NFI and is also published on the Internet. Publication of five-year reports continued in parallel with SKOGSDATA until 1992, but was then phased out and replaced by other forms of publications, such as books, thematic analyses within SKOGSDATA, and internet-based publications. From 1994 and onwards, results from the NFI are part of the Swedish official statistics, which implies that the statistics are considered of special importance for the country and have to be produced according to strict quality assurance and quality control standards.
The introduction of more user friendly analysis systems in the 1980s meant that analyses could be undertaken on a case-by-case basis and thus forest companies, several regional and national agencies, as well as NGOs became regular consumers of NFI analyses customized to their specific needs.
2.5 Technical infrastructure
Until the 1950s the NFI used field forms for data capture. In the 1960s these were replaced by punch-cards, which simplified the transfer of data to digital databases. As in all other areas of society, the introduction of computers had substantial impact on the NFI activities, ranging from the capture of data in the field to storage and analysis of data.
Since 1983 collection of field data has been made through the use of hand-held computers, for which software have been developed in-house. The software has been specifically adapted to the hardware perceived to best meet the NFI requirements, initially Micronic (450 and 900) handheld computers, then Huskey-Hunter handhelds (1993–2002), and from 2003 Juniper system Allegros. While very cost-efficient for the fieldwork, the development of software has often been quite costly.
Until 1970, analysis and reporting was largely based on manual methods, which implied that substantial efforts had to be dedicated to routines for computation and related compilation of reports. The subsequent development of databases and customized applications for the data analysis has enabled faster and more flexible reporting. It has also facilitated stricter routines for quality assurance and quality control. In the 1980s a FORTRAN-application (SkogTab) in combination with a MIMER-database was used for analysis and reporting. In the 1990s, SkogTab was replaced by a SAS-based system (SkogRed) in combination with an Ingres-database. Both systems were developed in-house and contributed substantially to making the analysis and reporting work more efficient.
2.6 Quality assurance and quality control
In the field work, as well as in the chain from raw data to finalized reports, quality assurance and control are of high priority. Already in the first NFI in 1923, several procedures for quality assessment were applied, e.g. regular checks of the width of the belt within which trees were tallied were performed by specially assigned staff. Field teams were also required to regularly completely re-measure certain sections of the belt, and the results were immediately assessed so that feed-back could be given to the field crews. It was noted that the fieldwork was generally performed with high accuracy. In addition, staff from regional NFI-offices was appointed to undertake re-calculations based on the field form registrations (SOU 1932).
From the second half of the 20th century and onwards quality assurance and control efforts have become an integrated part of all NFI activities. Some main components are:
- Training and calibration of field staff, both at the start of each field season and mid-term through each season. For the experienced field staff, this typically includes one week of pre-season training and 2–3 days of mid-season training. New staff is required to attend certain introductory training courses and then commence as supervised field trainees before becoming regular crew members.
- Logical tests for single variables and for combinations of variables are made through specific routines in the handheld field computers. Through this, many data registry mistakes can be avoided.
- During the field season a control inventory of 2–5 percent of the total sample is carried out, to assure that field work is carried out in a proper way and to assess surveyor variability and sources of bias. An example is the result from the control inventory of diameter measurements where the R2 of the linear model of the relationship between dbh according to ordinary team vs. control team was greater than 0.99 (8298 trees). However, results from the control inventory are for quality control purposes and usually not used for any kind of calibration of reported figures.
- Before data are placed in the final databases from a certain year’s NFI, extensive logical testing is performed following a given set of procedures.
- The analyses are made using software that is specifically developed for the purpose, in order to avoid estimation errors etc. due to mistakes during the analysis phase.
3 Challenges at the turn of the 20th century
3.1 Background
The major challenges which the Swedish NFI faced at the turn of the 20th century were mainly linked to:
- Further expanding the scope of the inventory to meet new demands from society
- The need to stabilize the design following a longer period of changes on the interval between measurements of permanent plots, etc
- Integrating remote sensing auxiliary information with the field based NFI in order to increase cost-efficiency and deliver new types of information from the inventory
- Increasing international collaboration to make inventories comparable across countries
- Benefitting from NFI-data digitally available from 1953 and onwards
- Updating technical infrastructures
Each of these challenges is addressed in separate sections below.
3.2 Expanding information requirements
As previously stated, the original scope of the Swedish NFI was linked to sustainable utilization of wood resources. Towards the end of the 20th century the forest information requirements from society rapidly expanded, and for the NFI this led to the introduction of several new variables related mainly to forest biodiversity conditions, e.g. Olsson and Wramner (1988). However, interest in the traditional variables remained.
At the turn of the 20th century the demands for forest information continued to increase and several fields of information were pointed out as potential areas of expansion or improvement for the NFI:
- Data for greenhouse gas reporting. Following the establishment of the UN framework convention on climate change (UNFCCC) after the Earth Summit in Rio de Janeiro in 1992, a fairly long period of uncertainty related to how to measure, report, and account greenhouse gas emissions and removals from forests and other land areas followed. In 2003 the Intergovernmental Panel on Climate Change (IPCC) presented its Good Practice Guidance for the land-use, land-use change, and forestry sector (Penman et al. 2003). From this report, it became obvious that national forest inventories had a great potential to be key sources of information. Later this was confirmed by, e.g., Cienciala et al. (2008), Dunger et al. (2012) and GFOI (2014).
- Improved data related to sustainable wood-production. Although this area had always been the main focus of the NFI, minor changes in the demands were perceived. For example, better information about timber quality was asked for as well as better assessments of damages and damaging agents. The latter issue was driven by fears of new types of damages due to a changing climate (e.g. Wulff et al. 2011). Lastly, following the development of improved Swedish forest scenario analysis systems (Heureka; Lämås and Eriksson 2003), there was a need to ensure that the NFI data would suit the requirements of these systems.
- Improved biodiversity and wildlife data. Although substantial efforts had already been made to meet the biodiversity information requirements during the 1980s and 1990s, additional information was asked for. Like the UNFCCC, the UN convention on biological diversity (CBD) was agreed upon at the Earth Summit in Rio de Janeiro in 1992. The CBD process strongly influences the work towards halting biodiversity loss in the signatory countries, and thus new information demands have emerged. Further, the Swedish populations of ungulates, mainly elk (Alces alces) and roe-deer (Capreolus capreolus) increased substantially during the second half of the 20th century raising questions about monitoring of populations (Månsson et al. 2011), browsing damages, and forage availability. Further, although reindeer (Rangifer tarandus) are domesticated, improved information related to the interaction between reindeer herding and forestry (Kivinen 2010) was also asked for.
- Publicly oriented information. Traditionally, the main users of NFI data have been governmental organizations handling forestry and environmental issues, and the forest sector. However, it has become evident that the general public is important in order to maintain credibility and secure long-term funding. Thus, an effort was needed to increase the awareness of the NFI among the general public. These ideas are however not new and even when the NFI was initiated in 1923 an information film was commissioned and shown at public cinemas to inform about the importance of forest resources and information about them through the NFI.
A challenge for the Swedish NFI was to prioritize which new variables should be introduced to answer key questions and to introduce them in the NFI without compromising the quality of the variables already included. Also, as a result of substantial new requirements it was obvious that some of the existing variables would need to be dropped and thus a review of the usage of the existing data was needed.
3.3 Stabilizing the basic design
At the turn of the 20th century, it was concluded that there was no need to change the basic design of the Swedish NFI that had been in operation since 1983, but instead to stabilize the highly variable implementation of it during the 1990s. In fact, as shown in Tomppo et al. (2010), the Swedish NFI design, dominated by field assessments, and combining temporary and permanent tracts in, so called, interpenetrating panels, has almost become an international standard towards which NFIs in other countries aim. However, regarding temporary tracts, interpenetrating panels were introduced already in 1953.
Further, changes to adapt the NFI system to new information requirements and new techniques were evaluated. The following design-related challenges were identified:
- Design stabilization. The system with varying re-measurement intervals, etc., had considerably complicated the understanding and use of NFI data and thus it was judged important to return to a stable system with re-measurements of permanent plots every 5 years.
- Increased focus on changes. It was perceived that the user needs had gradually shifted from information about current state to information about changes (e.g. IPCC 1996). In order to meet these demands, the ambition was to make slight adjustments of the design so that the NFI would deliver more precise information about changes.
- Estimation of sparse features. Some of the new information requirements, mainly related to biodiversity, concern estimates related to sparse populations. NFI-type sample plot inventories are not well suited for this purpose (e.g. Wulff et al. 2011), and therefore it was investigated if any minor changes of the basic design could improve the situation.
- Cost-effective field work. Some parts of the fieldwork are more time-consuming than other. One such part is the measurement of sub-sample trees for a large set of variables, in addition to diameter and species. It was thus investigated how the selection of temporary sub-sample trees could be modified to increase the cost-efficiency of the inventory.
3.4 Integrating remote sensing auxiliary information
The development of remote sensing offers great potential for some types of applications. However, as shown by Tomppo et al. (2008, 2010) the integration of remote sensing data in NFIs until the turn of the 20th century mainly had implied that results from NFIs – that are typically only accurate at national and large-area sub-national level – could also be provided at local level through various non-parametric regression techniques, such as kNN. However, an increasing number of international and national agencies have started to advocate the use of remote sensing as it is believed to make forest inventories cheaper. A challenge for the Swedish NFI – as for NFIs in other countries – was therefore to investigate if and how remote sensing information best could be utilized for acquiring forest information.
Auxiliary information can be used in two principal ways in connection with sample based inventories (e.g. Gregoire and Valentine 2008). Firstly, it can be used for improving the sampling design, e.g. through stratification of sampling with unequal probabilities. Secondly, auxiliary information can be used in the estimation phase, for example through post-stratification (Nilsson et al. 2003; McRoberts et al. 2006) or model-assisted estimation (Särndal et al. 1992; Vibrans et al. 2013). In the estimation phase, local level estimates can also be provided through synthetic estimation.
3.5 Increased national and international collaboration
At the national level there is a continuous need for collaboration amongst users and producers of forest information, not least in order to make the data acquisition systems efficient and avoid overlaps and duplications. During the 1990s the Swedish government appointed a number of authorities as responsible for the production of the country’s official statistics. The Swedish University of Agricultural Sciences (SLU) was in 1994 appointed as responsible for statistics about the state and change of Sweden’s forests. This responsibility involves formalized procedures for collaboration with other stakeholders within Official Statistics advisory groups. This resulted in a significant level of dialogue between the Swedish NFI and the various users and other producers of official statistics. However, the needs for international collaboration had increased considerably towards the end of the century. Major drivers were the many global conventions, to which Sweden is a party, and the entry of Sweden as a member country within the European Union (EU). The latter already had brought about a common approach to collecting information about forest damages, i.e. through EU’s implementation of ICP Forests under the Geneva Convention. Within the EU, discussions about how to acquire a broader set of common forest information have been active through both the 1990s and the 2000s. Therefore, a substantial challenge for the Swedish NFI as well as for other European NFIs was to develop the forest inventory in a fashion that facilitated the delivery of harmonized information across all the EU countries within the areas perceived to be of interest. There was an apprehension that failure to do so could lead to an implementation of a centralized EU forest information system that could eventually render national NFIs obsolete.
3.6 Benefitting from the long time series of data
It is often noted that one of the strengths of the Swedish NFI (like the NFIs in Norway, Finland and the US) is that the inventory has been undertaken under such a long time period and that therefore time series data are available for a period of about 90 years. However, at the turn of the century, the older Swedish data, i.e. from the NFIs 1923–1929 and 1938–1952, were only available in paper forms and printed reports.
In order to benefit from the long NFI time series, a challenge was to make the older data available in digital form. Due to the large amounts of data, entering the data from the field forms to digital format was estimated to require 15–20 years of effective work.
3.7 Updating the technical infrastructure
Due to the developments of information technology within society a large portion of the NFI work has become dependent on IT solutions. The amount of data handled by the NFI, from raw field data to final presentation of statistics, requires effective IT based systems for quality controlled data handling. The IT environment at the Swedish NFI at the turn of the century could be summarized as:
- Many different and often outdated computer systems
- An increase in turnover of IT staff
- An ambition to reduce the amount of manual work
- Demands for user-friendly IT systems based on standardized components
Therefore, a major challenge was to develop a coherent and modern set of IT solutions for the Swedish NFI.
4 Swedish NFI development at the beginning of the 21st century
4.1 Expanding information requirements
To address the challenges due to expanding information requirements a revised protocol for the Swedish NFI field work was developed through an exhaustive project during 1999–2002. The project included a series of seminars addressing the needs of different stakeholder groups; the ambition was to satisfy the primary requirements of all the different stakeholder groups, within the budget limits and without compromising data quality. Further, for quality reasons the measurement design for certain variables were modified, and some variables were completely removed as control surveys pointed to poor reliability.
The outcome of this revision, implemented from the field season 2003, is described in the sections below.
4.1.1 Data for greenhouse gas reporting
A major portion of the data needed for the greenhouse gas reporting for the forest and land-use sector (LULUCF) can be obtained from NFIs (Cienciala et al. 2008), since many of the ongoing measurements of land use, trees and soils can be analyzed in new ways to meet the reporting requirements (Ståhl et al. 2004; Ellison et al. 2011). However, some modifications were introduced to improve the applicability of the combined NFI and SFSI in this context:
- Recording of the year of land-use change on permanent plots, since changes between land-use categories play a major role in the greenhouse gas reporting context
- An inventory of the presence of bedrock and boulders in the soil, and measurements of the thickness of the humus layer in order to more accurately estimate the amounts and changes of soil organic carbon performed by the SFSI
Further, an additional database, specifically tailored for the purpose of greenhouse gas reporting based on NFI data, was developed. The Swedish system for greenhouse gas reporting within the LULUCF sector has proved to be successful and it has often been lifted as a forerunner among reporting systems that are based on the stock change method, i.e. that carbon dioxide emission are based on repeated measurements of carbon stocks and emissions are estimated from the stock changes.
4.1.2 Improved data related to sustainable wood-production
Great interest was expressed for improved information on the wood-quality of standing trees, especially about trees suitable for saw-timber. To collect objective information in this regard the first three variables listed in Table 2 were introduced in 2003, and the fourth was modified. For improved accuracy of estimates of annual wood harvests, a measurement of the height of stumps was also introduced. Finally, to obtain more detailed information about tree damage, several subjective assessments were replaced by new methods (see Table 2).
| Table 2. New and modified variables introduced in the Swedish NFI in 2003 for improved data related to sustainable wood-production. | ||
| New or modified variable from 2003 | Description | Method |
| Diameter on thickest branch (below 2 m of height) | Measured on sub-sample trees | Measurement with a slide (vernier) caliper |
| Presence of abrupt bend | Assessed on sub-sample trees | Measurement |
| Presence of long bend | Assessed on sub-sample trees | Ocular assessment |
| Height and crown height measurement | Measured on sub-sample trees | Registered in 0.1 m classes instead of 0.5 m classes |
| Height of stump | Measured on stumps | Measurement with a ruler |
| Objective elk-damage inventory (ÄBIN) | Assessment of damage/no damage caused by elk-grazing | Assessed on individual trees on sample plots (r = 3.5 m) |
| Stand damage | Assessment of the type of stand damage including cause of damage for existing stands, or previous stand if ruined due to damage | Assessed on sample plots (r = 20 m) |
| Tree damage | Assessment on sub-sample trees | Assessed on sub-sample trees separately for crown-, stem-, cambium- and root damages |
4.1.3 Improved data for biodiversity and wildlife
In revising the NFI fieldwork protocol a number of experts in ecology were consulted and asked to give input on ways of improving the data in terms of biodiversity-related information. The conclusions are summarized in this section.
Dead wood is an important indicator of biodiversity (e.g. Harmon et al. 1986). For example, this is pointed out within the Swedish Environmental Quality Objectives (http://miljömål.nu/sv/Environmental-Objectives-Portal/) and the NFI is expected to deliver data for the monitoring of hard dead wood. To ensure high quality data and reliable volume estimation the sampling scheme for dead wood was changed in 2003. The new scheme implies that dead standing trees are treated in a similar fashion to living trees, i.e. if the point of germination is within the plot the dead tree is included. Lying dead trees, or parts of them, where there is no point of germination to find, are included if their thickest end is within the plot and the length is at least 1.3 m. A minimum diameter threshold of 10 cm is used at breast height for standing trees and at the thick end for lying trees if breast height is impossible to identify.
Further revisions to better capture conditions for biodiversity and wildlife from 2003 onwards included:
- Continuous inventory within protected areas (National parks and Nature reserves) using an identical inventory protocol to that outside these areas. This change is motivated also for several other reasons, for example the greenhouse gas reporting which also involves protected areas.
- Ant-hills, traces of wood-pecker activity, and a selection of polyporous fungi are recorded on the sample plots. (Ant-hills are registered if the highest point is within the plot and if the hill fulfills some threshold measures of height and diameter). Traces of woodpecker activity and fungi are recorded only up to 10 m height on trees, due to visibility reasons.
- Large trees (definition in Fig. 3) and retention trees were registered on a plot with 20 meter radius between 2003 and 2007. However, concerns over poor data quality led to the removal of this registration.
In Table 3, all introduced and modified variables related to improving the NFI for wildlife and biodiversity assessment, are listed.
| Table 3. New and modified variables introduced in the Swedish NFI in 2003 for improved data on biodiversity and wildlife. | ||
| New or modified variable from 2003 | Description | Method |
| Presence of traces from woodpeckers | Presence/absence registration | Assessment on sub-sample trees and on dead wood objects |
| Presence of Polyporus fungi | Presence/absence registration including species | Assessment on sub-sample trees and on dead wood objects |
| Assessment of vegetation on dead trees and logs | Assessment of coverage | Assessment on dead wood objects |
| Assessment of distance to the ground | Measurement of distance to ground | Measurement on logs with a ruler |
| Additional class of decomposition on dead wood: Newly dead | Assesment of decomposition class | Assessment on dead wood objects |
| Bark-coverage on dead trees and logs | Assessment | Classes 0–100% |
| Ant-hills | Presence of ant-hills | Measurement of diameter and height |
| Large trees and retention trees (abandoned 2008) | Presence of large trees (definition see Fig. 3) | Registration of species and measurement of dbh |
| Presence of ground- and bottom flora | Short list of species (22 species or species groups) | Performed on 2 sub-plots (r = 0.28 m) Height above ground recorded for lichens. Flowers/berries counted on plants of Vaccinium vitis-idea and V. myrtillus |
| Crown cover | Vertical projection of tree crowns in %. Over-coverage not considered | All living trees included, bushes not included |
| Area of land-use class | To fulfill international reporting where minimum area is often included | Area based on map- and ocular studies registered |
| New sampling design for measurement of dead wood | Point of germination or thickest end defined as point of inclination | All lying objects included if point of inclination is within the sample plot, i.e. part outside plot included |
| Inventory within reserves | Ordinary field work also on plots within National parks and Nature reserves (excluded before 2003) | Identical sampling scheme as for plots outside these areas |
| Performed forestry measures registered also on unproductive forestland | Before 2003 only registered on productive forestland | Identical methods to those used for plots located on productive forestland |
| Registration of cause of felling | If felling of trees are registered on a plot, also cause is registered | Three categories: Normal felling, Clearing after severe damage, Nature conservation |
| Modified procedures for registration and assessment of tree-layers | Maximum three layers, presence of all occurring tree species in % of total number of stems or basal area (depending on height) | Regardless of how small proportion a tree species amount to, it´s occurrence is indicated registering 1% |
| Stand-attributes also registered on unproductive forestland | Stand-age, mean height, basal area, tree species composition | Identical methods to those used for plots located on productive forestland |
| Forest stands suitable for selective cutting | Included as a separate cutting class | - |
| Number of occurrences of elk-droppings | Counted (r = 3.5 m). Before 2003 r = 5.0 m | - |
4.1.4 Publicly oriented information
To be visible in today’s massive media-flow an NFI needs to find interesting ways of presenting data and to focus more on issues of general interest.
New measurements of flowers and berries for bilberry (Vaccinium myrtillus L.) and lingonberry Vaccinium vitis-idaea, see Table 3) were therefore introduced in the Swedish NFI in 2003. The idea was to undertake forecasts of berry abundances in different parts of the country by linking inventory data from the NFI with data about the developments from flowers to berries from SLU field research sites. Since 2006 the NFI has produced forecasts for the abundance of berries published annually in June (bilberry) and August (lingonberry). These forecasts have received a huge level of media interest, by far the largest media exposure for the Swedish NFI, making the NFI known, regardless of the quality of the forecasts. Due to the level of interest in the forecasts the inventory has, from 2011, been extended, and now includes data registration from all permanent and temporary plots.
Further, since 1995 the NFI has used the Internet for publication of annual statistics in form of figures, tables, and maps. Since 2005 there is also an interactive tool on the NFI web-site for anyone who wishes to make estimates based on NFI-data interactively. This tool is limited to a set of standard estimates; however, the plan is to make a sub-OLAP Cube available for the public via the NFI website, which will enable far more possibilities for producing arbitrary estimates.
4.1.5 Collaboration with other data providers
In order to avoid duplication of work it was agreed with the Swedish Forest Agency that the NFI would abandon in-depth regeneration assessments from 2002 onwards. Further, the NFI in collaboration with the Forest Agency launched a new design for assessment of elk-damages, ÄBIN, which made it possible to compare local results produced by the Forest Agency with the regional and national results produced by the NFI.
4.2 Stabilizing the basic design
4.2.1 Focus on changes
No reason was found to modify the basic sampling design, with clustered sample plots arranged in temporary and permanent tracts (Fig. 2) with regards to statistical, economical or practical reasons. However, an increasing emphasis on change estimates motivated a revision of the proportions of temporary and permanent tracts. This revision was also connected with the sample tree selection on temporary plots, and in this context also some practical aspects were considered.
Due to financial restraints a ten-year re-measurement interval was phased in from 1993 where only about one 10th, compared to one 5th 1988–1992, of the permanent tracts were inventoried each year. Since changes in forest and other parameters had become more and more important (cf. Penman et al. 2003) there was a desire to be able to provide estimates for five-year periods with high precision. A constant five-year re-measurement interval was also necessary for making efficient use of data from both permanent and temporary tracts when estimating both state and change. This was accomplished in 2003 by increasing the number of inventoried permanent tracts each five-year period to almost the same level as 1983–1992. However, due to continued financial restrictions the number of permanent plots was reduced by about 15% compared to 1983–1992. Further, since no bore-cores, needed for estimates of annual growth, are taken from trees on permanent tracts it was necessary to consider the number of temporary tracts and the total number of sub-sample trees on them.
As a results of the revision in 2003, the number of permanent plots was increased (compared to the previous period) while the number of temporary tracts was decreased.
By almost doubling the number of permanent tracts per year, from the period 1993–2002 to 2003– and onwards, the standard deviation (standard error) of the change estimator decreases by about 30 percent.
It should be noted that only 50 percent of the annual permanent tracts are included in the SFSI sample. For this inventory the re-measurement period is still 10 years. Similarly, a set of other variables related to issues with slow rates of change (e.g. ant hills, traces of woodpecker activity, boulders in the soil, and presence/absence registrations of common species) also has a 10 years interval between re-measurements. Thus, measurements on permanent plots are of two different kinds from 2003 onwards; one basic set of variables is measured every fifth year and two other sets of variables (soils and extended biodiversity variables) every tenth year. Through this approach it has been possible to introduce more registrations on the permanent plots without making the inventory too demanding from a time consumption perspective.
The permanent tracts that were abandoned in 2003 were chosen randomly but geographically dispersed. Each stratum was divided into a number of sub-areas and from each sub-area one tract was randomly chosen to be abandoned.
The positions of the temporary tracts for the period 2003–2007 were determined in the following way:
- For each region a fairly dense grid of potential tract positions was laid out (a spacing of 5 km was chosen after some tests).
- From the list of potential positions an ordered random sample was taken. Only potential positions that fulfilled restrictions on the closest distance to the nearest permanent tract (2, 3 or 4 km were tested) and to the nearest already chosen temporary tract (5, 6 or 7 km were tested) were accepted.
- The final positions chosen were those where these two distances were the largest tested (depending on stratum) and where the desired number of tracts was reached.
4.2.2 New design for selecting sub-sample trees on temporary plots
The change of the proportion of permanent and temporary tracts was closely connected to the need to find a more effective way of selecting the appropriate number of sub-sample trees from temporary tracts. On permanent plots, sub-sample trees are permanent but no bore-cores are taken from them; cores are necessary for measuring age and annual growth and are taken only from sub-sample trees on temporary plots. Uses of these measurements comprise (i) estimation of annual ring indices, used to adjust growth with respect to weather effects, (ii) simulation (imputation) of age for every callipered tree, and (iii) distribution of the five-year growth on single years. Sub-sample trees on permanent tracts are permanent, but can increase or decrease in number depending on in-growth, cuttings and natural drain. On temporary tracts sub-sample trees had, up to the year 2002, been selected by Poisson sampling with a probability proportional to tree basal area (PPS to basal area). That is, each sample tree on a plot had a probability of being selected as sub-sample tree with a larger probability for trees with greater diameters. This design is simple and causes very little problems for different calculations. However, it has a couple of serious disadvantages:
- A major proportion of the sub-sample trees have a large diameter and are selected on plots where the surrounding stand is of an older age. For example, the variation of stand conditions is smaller than desired for age simulations.
- The number of sub-sample trees per plot varied more than desired with respect to the field-work time. The field crews thus have considerable problems in planning the work, since they cannot estimate the expected number of sub-sample trees.
To overcome these disadvantages a new design for selecting sub-sample trees on temporary tracts was developed and used from 2003. The objectives of the design were:
- To obtain at least one sub-sample tree per plot on plots with the occurrence of sample trees.
- To select a maximum of three sub-sample trees on non-divided plots with a basal area above 15 m2 ha–1; at lower basal areas the number of sub-sample trees should be proportional to the basal area given that the number of trees is large enough.
- Sub-sample trees should be selected PPS to basal area, with respect to the actual basal area on the plot.
The selection procedure of the design is the following:
- The field-crew assesses a preliminary basal area (m2 ha–1) of the plot by visual inspection. This value is used to determine the number of sub-sample trees in case the plot is divided
- The desired number of sub-sample trees is multiplied by a factor to ensure a large enough number of suitable potential sub-sample trees (this factor is set to 2).
- While callipering the sample trees on the plot a sample of potential sub-sample trees is selected PPS to the tree basal area, with the number calculated in (2). The selection is made through “Unequal probability systematic sampling”, see e.g., Gregoire and Valentine (2008, p. 71).
- When all sample trees on the plot have been callipered the true basal area (m2 ha–1) is known and the number of sub-sample trees to be selected is known. The sample is taken by completely random selection among the potential sub-sample trees.
Since the potential sub-sample trees in (3) are selected PPS to tree basal area and the final subsample of sub-sample trees is selected completely random from the sample, the selection of final sub-sample trees is PPS to basal area. Small sample trees (diameter between 4 and 10 cm) are callipered only on a small plot (radius 3.5 m instead of 7 m). For those trees the basal area is multiplied by 4 in (3) and (4).
4.2.3 Estimation of sparse populations
To meet the requirements related to estimates of features linked to sparse populations, different design alternatives were evaluated. Firstly, it was evaluated whether or not line based sampling (line intersect sampling and/or distance sampling along lines) could be a useful complement to the sample plots. However, it was assessed that such methods would be too complicated to implement during the fieldwork. Instead, a selection of forest features of potential interest were merged with the Swedish National Survey of Landscapes (NILS; Ståhl et al. 2011a). The NFI and the NILS made an agreement as to which variables would be collected in the two inventories. For example, it was decided that all line-based inventories were to be conducted solely within NILS. Likewise, it was decided that forest inventory in the mountain region in northern Sweden was to be conducted by NILS rather than by the NFI as NILS already undertakes surveys in the mountain region where the costs of access are extremely high.
A large plot (20 m radius) was introduced in 2003 for large retention trees (trees left during clear-cuts). Theoretically, this would improve the precision of estimates of these tree populations which were of particular interest at the turn of the century. However, following disappointing results from control inventories, where substantial deviations were found in the estimates based on 20 m plots, compared to estimates based on the 10 m plots, this variable was abandoned in 2008.
4.3 Integrating remote sensing auxiliary information
4.3.1 Background
NFIs typically provide regional and national estimates of means and totals of variables measured on field plots; for example growing stock volume, biomass, and tree species composition. The quality of such large area estimates can be improved for some variables by combining the field data with remotely sensed data (e.g., Nilsson et al. 2003; McRoberts and Tomppo 2007; McRoberts et al. 2012). This method can also allow some of the estimates to be provided with an acceptable accuracy for smaller areas than that which is possible for estimates based on field data alone. The combined use of field data and remote sensing data also makes it possible to construct spatially explicit maps with estimated forest variables (Reese et al. 2003; Tomppo et al. 2008). Such forest maps can be used for various purposes such as habitat modeling and identifying areas with high proportion of deciduous trees or high biomass.
4.3.2 Forest maps
As a complement to ordinary statistics from a NFI, nation-wide full coverage maps with estimated forest variables such as growing stock volume, volume per tree species, tree height and stand age can be produced (see e.g. Tomppo et al. 2008 and McRoberts 2012). In Sweden such maps have been produced by combining remote sensing data and field data from the Swedish NFI using the k Nearest Neighbor (kNN) method. With this method forest variables are estimated as weighted averages of observed variable values for the k most similar plots in a feature space defined by the spectral bands in, for example Landsat imagery. Similarity is defined by the feature space distance d from pixel p to field plot i, and the weight wi,p for field plot i when estimating forest variables for pixel p is defined as:

for the k plots with the shortest feature space distance to pixel p, otherwise wi,p = 0; The estimate of a forest variable (ŷ) for pixel p is defined as:

Raster maps with 25m pixels representing the state of the forest in year 2000 (Reese et al. 2003), 2005, and 2010 have been produced using Landsat ETM+ or SPOT imagery. Maps are now being produced approximately every fifth year and made available free of charge via the Internet. The maps cover approximately 95% of all forest land, forested wetlands and mountainous forests in Sweden according to the 1:100000 scale road map produced by the Swedish Land Survey.
4.3.3 Post-stratification
The national full coverage maps with estimated forest variables produced by the NFIs can also be used to calculate statistics for small areas (see e.g. McRoberts 2010). However, several problems arise when combining satellite images and field data for mapping purposes that affect the quality of the estimates. For example, problems related to image geometry, positioning of field plots, mixed pixels, and atmospheric conditions affects the possibility of deriving accurate estimates of forest variables. In theory, most of these problems can be handled, but in practice it is difficult to avoid systematic errors, due to problems with land use classification. Thus, the Swedish NFI has decided not to use the kNN maps alone to calculate small-area (sub-county) statistics. Instead, small-area statistics for forest variables like growing stock volume are calculated using post-stratification, where kNN maps or other map products are used for stratification. Detailed algorithms for the post-stratification approach are given in Appendix C. The post-stratification procedures have been available since about 2005.
Lidar and Radar techniques, as well as automated 3D techniques based on air photos, have shown promising results for forest inventories. For example, findings by Næsset et al. (2004, 2011, 2013) has led to the LiDAR technique being widely implemented in operational forestry from about 2010 onwards in the Nordic countries. These techniques also have been evaluated as tools for making NFIs more cost-effective (e.g. Gregoire et al. 2011; Ståhl et al. 2011b; Næsset et al. 2013) but the results are inconclusive. While the techniques have a potential to considerably improve the precision of the estimates for some variables they do not improve the precision for other variables. Thus, incorporation of these techniques for improving estimates on a routine basis would, given that the total NFI budget remains unchanged, imply that the precision of some variables would be improved while for other variables it would be worse.
4.4 Increased international collaboration
In 2003 the European National Forest Inventory Network (ENFIN) was established following an initial proposal from the Swedish NFI and a later joint effort to establish ENFIN by the NFIs of Austria, Finland and Sweden. ENFIN was established after a period when the influence of the European NFIs on agreements about forest information provision at the EU level gradually had diminished; the primary reason for this diminished influence was the gradually increasing ambitions of the ICP Forests network within the EU to expand from a focus on forest condition assessments to a much broader scope, covering several aspects of forest information, thus duplicating the work of the NFIs in the European countries.
ENFIN immediately attracted substantial interest with almost all European countries with NFIs joining the network. Since definitions and methods were found to vary substantially among countries (Tomppo et al. 2010) the ENFIN network immediately engaged in ambitious harmonization efforts, firstly through the project COST Action E43 and later through COST Action FP 1001 and a project initiated and funded by EU’s Joint Research Center called E-Forest.
Other important harmonization efforts, in which the Swedish NFI as well as other NFIs contribute, includes FAOs Global Forest Resource Assessments (FAO 2010) and Forest Europe (Forest Europe 2011). Within the biodiversity field, the project Monitoring of Terrestrial Habitats makes use of data from the NFI and from NILS in order to deliver data to fulfill many of the requirements of EU’s Habitats Directive.
4.5 Benefitting from long time series
In order to make the old data available in digital format and make the data known to a broader range of researchers and other stakeholders, projects to digitize the oldest Swedish NFI-data commenced in 2006. These efforts were subsequently coordinated within the RINFI (a research infrastructure based on NFI data) project, which was funded by the Swedish Research Council in 2010. Similar projects have also been conducted in Norway and Finland.
The paper field-forms from the first Swedish NFI, stored at the Swedish National Archive, are now digitized and stored in a MS SQL-server database for easy access. Positions of the belts (Fig. 1) and sections of belts are geo-referenced using the original maps which facilitates for the possibility of presenting results for arbitrary areas. This is extremely important since administrative information that was registered on the field forms now can differ from today’s administrative boundaries. Examples of harmonized time series can be found in e.g. Skogsdata 2013. Digitizing of data from the Swedish NFI 1938–1952 has now started, mainly financed through employment measures projects.
4.6 Revised technical support systems
4.6.1 New field data collection system
Since the first computerized data collection system was introduced in the Swedish NFI in 1983, computer capacity and technique have been the restriction for field tests of consistency and completeness directly at the source of information. This has led to other ways of testing and correcting data. Traditionally, tests have been performed at the NFI headquarters with feed-back to field teams for correction. Normally the time-span between initial field-work and feedback of tests has been several days which has resulted in “best guesses” and consequently sometimes poorly corrected data.
In 2005 a project for developing a new generation of data collection system for the NFI was initiated. Here, user-friendliness and data quality assurance aspects (consistency and completeness) were the main focuses. Furthermore the system should support at least three hand-held computers to be used simultaneously at the same sample plot. The reason for this is that on the plots where the NFI and the SFSI perform fieldwork at the same time, one handheld computer is needed by each of the three crew members.
To meet the requirements the NFI developed a client solution where one of the handhelds is designated as the master-unit where all identities are registered. By WiFi data is transferred to and from the other two units. By this compilation, after completion of the fieldwork on a sample plot all three handhelds have identical databases which also serve as backups. This system was launched in 2011. Since data quality was in focus, the system was designed to graphically support the operators through a specially designed graphical interface
This interface guides the operator through which data registrations should be made on a specific sample plot and also gives the user information about when data registration is complete and valid.
4.6.2 New cartographic system
Hand in hand with the increasing possibilities to make use of digital maps, and also digital aerial ortho-photos, the NFI in 2003 started to use GIS for the production of maps. Having the digital maps as a background, the aerial ortho-photos and a link to the NFI SQL-server database with the tract- and plot coordinates as layers in a GIS, customized printouts with higher quality, especially when it comes to up-to-datedness, could be made in-house to dramatically reduced costs compared with previous methods. These maps are used for finding the best way to the tract by car and foot. Detailed navigation is then performed using hand-held GPS-devices with pre-loaded positions for the plots. Permanent plots are found by navigating to the plot and then visually locating the plot center which is discretely marked. For temporary plots, the GPS is used for navigation until it indicates that 20 m are left to the plot-center. Then the distance and bearing according to the GPS is noted and a compass and a measuring-tape are used for the final navigation and positioning of the plot center. This procedure is used to establish temporary plot-centers objectively.
4.6.3 New database structure
All data storage for data 1983 and onwards is now concentrated to one database (DB) handling system – MS SQL Server. The NFI reporting DB can shortly be described as:
- Normalized to third normal form
- Business rules, constrains and element descriptions are intrinsic in the DB-model
- All calculated variables are stored in the DB
- Metadata is stored in the DB
- Includes data from 1983
Furthermore, a supplementary function in the DB is several views for streamlining data extraction, i.e. two or more tables in the DB is virtually joined. With this technique mistakes caused by complex relationships in the DB is avoided.
4.6.4 New tools for reporting and analysis
The normalized DB described above makes it possible to use the OLAP (online analytical processing) technique which allows fast reporting and analysis of data when it comes to standard products (e.g. official national and international reporting). The Swedish NFI stores the most frequently used variables and measures in a MS Analysis Services OLAP-cube. Tools used for reporting and analyzing data from this OLAP-cube are MS Excel, MS Powerpivot and different MS Reporting Services tools (Fig. 4).
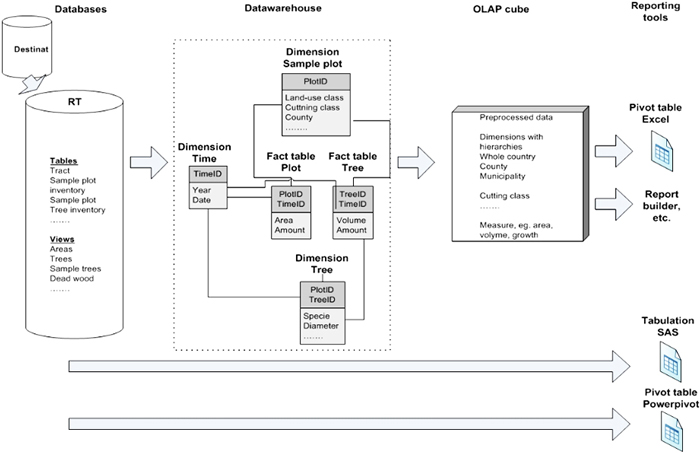
Fig. 4. Outline of the Swedish NFI reporting and analysis system. View larger in new window/tab.
For ad-hoc reporting and specific assignments the Swedish NFI uses tools from SAS institute to extract data direct from the DB and thereafter perform analysis. However, most other statistical packages can extract and handle data from a SQL server DB.
5 Discussion and conclusions
The Swedish NFI, like other NFIs with a long history (Tomppo et al. 2010), has developed in several successive steps. Currently the national and global demands for forest information are larger than ever and the NFIs are considered as vital resources in many countries. This is further emphasized by the developments towards mitigating climate change where the REDD + mechanism (Lubowski and Rose 2013) has spurred substantial efforts into establishing national forest inventories in developing countries.
As has been presented in this article, for NFIs with a long history a substantial challenge is to adapt to new requirements without sacrificing the benefits of long and consistent time series. In this context, it is interesting to note that the basic measurements of land use, trees, other vegetation and site conditions that have been conducted by NFIs for a long time can be utilized for answering a wide range of new questions linked to, for example, biodiversity conditions and greenhouse gas emissions. It was shown that the Swedish NFI could easily adapt to play a core role in the estimation of greenhouse gas emissions from forests with only a limited number of new data acquisitions. Regarding biodiversity, the requirements for new information are more demanding (Corona et al. 2011). Several basic characteristics, such as the amount of deadwood, the availability of old and broad trees and general vegetation cover can easily be handled through NFIs. However, estimates related to sparse populations and landscape spatial patterns are difficult to introduce in NFIs – although the combination of remote sensing and field plots opens up the possibility for spatial analyses based on NFI data. For example, the effort in the Swedish NFI to in a better way capture the sparse population of retention trees failed due to the poor data quality that was obtained from large sample plots.
As long as the NFIs cover a certain range of variables related to land use, trees, other vegetation and site conditions then these data can be used for a wide range of analyses, satisfying several core needs for many different stakeholder groups. However, users must understand that NFI estimates are statistical estimates that should typically only be used as averages and totals for fairly large areas (Gregoire and Valentine 2008). Sometimes this is seen as a limitation, and some users and producers of data take this as a reason for advocating the use of maps as a one-stop-shop solution for all needs, since it is claimed that map data can be aggregated to any area for which information is required. However, as pointed out by McRoberts (2011), map type products typically contain large systematic errors and they can only deliver information about a limited number of features.
The Swedish NFI was early to establish a design that each year covers the entire country with sample plots. This has become a trend among inventories, and prominent NFIs like the Finnish NFI and the French NFI (Tomppo et al. 2010) have abandoned their county-by-county inventories and adopted the same approach as Sweden. The major reason is that this approach facilitates reporting for the entire nation every year, typically through moving averages; these types of reports are increasingly being requested, not least in connection with reporting to international conventions such as the UNFCCC and the Kyoto Protocol.
Most NFIs, as well as the Swedish one, are conducted mainly through field measurements. The approach of allocating field plots in clusters has almost become an international standard (Tomppo et al. 2010). Over the last couple of decades several efforts have been made to incorporate remote sensing into the NFIs to make them more cost-efficient or to provide new kinds of information. However, while remote sensing offers many possibilities, e.g. for mapping, the technique also has many limitations. The type of auxiliary information obtained from remote sensing only is correlated with a limited number of the many variables typically included in NFIs. For example, features linked to land-use, non-tree vegetation and site conditions have proved to be very difficult to calculate from remote sensing. Still, it is likely that the inclusion of remote sensing for improving NFI estimates will remain an important development area, not least since the information from remote sensing steadily is becoming better and at the same time costs are decreasing. Still, in the foreseeable future it is clear that field measurements will remain as an important part of NFIs.
International collaboration is becoming increasingly important for the NFIs. In this endeavor, the success of individual NFIs depends on a constructive cooperative process with many other NFIs otherwise there is the risk that the NFIs will not be considered as useful sources of information for comparing forest conditions across countries. For example, within the EU current discussions evolve around how to obtain forest information at the EU level which is needed for various policy processes linked to forests. Currently the favoured approach focuses on the European NFIs as the main data providers. However, for this to be successful, all European NFIs must continue to work actively on harmonization to make estimates fully comparable and facilitate the possibility of aggregating results across the EU. The ENFIN network has a central role in promoting NFI collaboration in this context and will e.g. coordinate ENFIN applications to research and innovation programs like the EU Horizon2020 program.
Due to the quality of the data, the large spatial coverage and the long time series of data available the NFI has increasingly become involved in research studies. Examples include studies on how ecosystem services differ among forests with different number of tree species (e.g. Gamfelt et al. 2013 and Vilá et al. 2013). It is foreseen that the demand for NFI data for research is an area that will continue to expand in the future, especially as both the earliest data become available in digital form and the time series of data from the permanent plots become longer.
Substantial investments have been made to modernize the technical infrastructure for the Swedish NFI, as described above. Under the new system the work is based on holistic IT solutions stretching through the entire chain from planning the inventory to analysis and reporting. This makes the inventory cost-efficient, but it is also a challenge to keep the systems up-to-date and adapted whenever changes are implemented in the NFI.
Overall, the Swedish NFI has developed into a sophisticated and often complicated structure that requires a wide range of skills for successful operation. In this context it is interesting to discuss whether or not the most advanced solutions should always be sought in all parts of the NFI chain or if simplicity instead should be a guiding principle. We suggest that the development of NFIs always involves tradeoffs between theoretical efficiency and simplicity, and that it is important that solutions are sought that do not limit the usability of NFI-data for researchers outside the internal NFI domain.
Acknowledgements
We would like to thank SLU and the Swedish Environmental Protection Agency who finance the Swedish NFI; three referees whose comments significantly improved the manuscript; Dr Neil Cory for valuable comments and of course the field workers that each field season continue to collect the data that constitute the very foundation of a field based National Forest Inventory.
References
Bengtsson G., Holmlund J., Lundström A., Sandewall M. (1989). Long-term forecasts of timber yield in Sweden, AVB 85. Part 1 and 2. Report 44. ISSN 0348-0496. [In Swedish].
Berg Å., Ehnström B., Gustafsson L., Hallingbäck T., Jonsell M., Weslien J. (1994). Threatened plant, animal, and fungus species in Swedish forests: distribution and habitat associations. Conservation Biology 8: 718–731. http://dx.doi.org/10.1046/j.1523-1739.1994.08030718.x.
Cienciala E., Tomppo E., Snorrason A., Broadmeadow M., Colin A., Dunger K., Exnerova Z., Lasserre B., Petersson H., Priwitzer T., Sanchez G., Ståhl G. (2008). Preparing emission reporting from forests: use of National Forest Inventories in European countries. Silva Fennica 42: 73–88. http://dx.doi.org/10.14214/sf.265.
Chirici G., McRoberts R.E., Winter S., Bertini R., Braendli U.-B., Asensio I.A., Bastrup-Birk A., Rondeux J., Barsoum N., Marchetti M. (2012). National forest inventory contributions to forest biodiversity monitoring. Forest Science 58: 257–268. http://dx.doi.org/10.5849/forsci.12-003.
Corona P., Chirici G., McRoberts R.E., Winter S., Barbati A. (2011). Contribution of large-scale forest inventories to biodiversity assessment and monitoring. Forest Ecology and Management 262: 2061–2069. http://dx.doi.org/10.1016/j.foreco.2011.08.044.
Dunger K., Petersson H., Barreiro S., Cienciala E., Colin A., Hylen G., Kusar G., Oehmichen K., Tomppo E., Tuomainen T., Ståhl G. (2012). Harmonizing greenhouse gas reporting from European forests: case examples and implications for European level reporting. Forest Science 58: 248–256. http://dx.doi.org/10.5849/forsci.10-064.
Ellison D., Lundblad M., Petersson H. (2011). Carbon accounting and the climate politics of forestry. Environmental Science & Policy 14: 1062–1078. http://dx.doi.org/10.1016/j.envsci.2011.07.001.
FAO. (2010). Global forest resources assessment 2010. Main report. FAO Forestry Report 163. ISSN 0258-6150. 340 p.
Forest Europe, UNECE, FAO (2011). State of Europe’s forests 2011. Status and trends in sustainable forest management in Europe. ISBN 978-82-92980-05-7.
Fridman J. (2000). Conservation of forest in Sweden: a strategic ecological analysis. Biological Conservation 96: 95–103. http://dx.doi.org/10.1016/S0006-3207(00)00056-2.
Fridman J., Walheim M. (2000). Amount, structure and dynamics of dead wood on managed forestland in Sweden. Forest Ecology and Management 131: 23–36. http://dx.doi.org/10.1016/S0378-1127(99)00208-X.
Gamfeldt L., Snäll T., Bagchi R., Jonsson M., Gustafsson L., Kjellander P., Ruiz-Jaen M.C., Fröberg M., Stendahl J., Philipson C.D., Mikusinski G., Andersson E., Westerlund B., Andrén H., Moberg F., Moen J., Bengtsson J. (2013). Higher levels of multiple ecosystem services are found in forests with more tree species. Nature Communications 4: 1340. http://dx.doi.org/10.1038/ncomms2328.
GFOI (2014). Integrating remote-sensing and ground-based observations for estimation of emissions and removals of greenhouse gases in forests: methods and guidance from the Global Forest Observations Initiative. ISBN 978-92-990047-4-6.
Gjertsen A. (2007). Accuracy of forest mapping based on Landsat TM data and a kNN-based method. Remote Sensing of Environment 110: 420–430. http://dx.doi.org/10.1016/j.rse.2006.08.018.
Gregoire T., Valentine H. (2008). Sampling strategies for natural resources and the environment. Chapman and Hall. 492 p. ISBN 978-1-58488-370.
Gregoire T., Stahl G., Næsset E., Gobakken T., Nelson R., Holm S. (2011). Model-assisted estimation of biomass in a LiDAR sample survey in Hedmark County, Norway. Canadian Journal of Forest Research 41 (1): 83–95. http://dx.doi.org/10.1139/X10-195.
Hägglund B., Lundmark J-E. (1981). Handledning i bonitering med Skogshögskolans boniterings-system. National Board of Forestry, Jönköping, Sweden. 124 p. [In Swedish].
Hansson L. (1992). Landscape ecology of boreal forests. Tree 9: 299–302. http://dx.doi.org/10.1016/0169-5347(92)90227-3.
Harmon M.E., Franklin J.F., Swanson F.J., Sollins P., Gregory S.V., Lattin J.D., Anderson N.H., Cline S.P., Aumen N.G., Sedell J.R., Lienkaemper G.W., Cromack K. Jr., Cummins K.W. (1986). Ecology of coarse woody debris in temperate ecosystems. Advances in Ecological Research 15: 133–302. http://dx.doi.org/10.1016/S0065-2504(08)60121-X.
Haila Y., Kouki J. (1994). The phenomenon of biodiversity in conservation biology. Annales Zoologici Fennici 31: 5–18.
Holm S., Hägglund B., Mårtensson A. (1979). A method for generalizing of sample tree data from the Swedish National Forest Survey. SLU, Department of Forest Survey, Report 25. Umeå, Sweden. [In Swedish].
IPCC (1996). IPCC guidelines for national greenhouse gas inventories. IPCC WGI Technical Support Unit. United Kingdom.
Kivinen S., Moen J., Berg A., Eriksson Å. (2010). Effects of modern forest management on winter grazing resources for reindeer in Sweden. Ambio 39: 269–278. http://dx.doi.org/10.1007/s13280-010-0044-1.
Lämås T., Eriksson L.O. (2003). Analysis and planning systems for multi-resource, sustainable forestry – the Heureka research programme at SLU. Canadian Journal of Forest Research 33: 500–508. http://dx.doi.org/10.1139/x02-213.
Lämås T., Fries C. (1995). Emergence of a biodiversity concept in Swedish forest policy. Water, Air, and Soil Pollution 82: 57–66. http://dx.doi.org/10.1007/BF01182818.
Liljelund L.-E., Pettersson B., Zackrisson O. (1992). Forestry and biodiversity. Svensk Botanisk Tidskrift 86: 227–232.
Lorenz M. (1995). International co-operative programme on assessment and monitoring of air pollution effects on forests – ICP forests. Water, Air and Soil Pollution 85: 1221–1226. http://dx.doi.org/10.1007/BF00477148.
Lubowski R., Rose S. (2013). The potential for REDD+: key economic modeling insights and issues. Review of Environmental Economics and Policy 7(1): 67–90. http://dx.doi.org/10.1093/reep/res024.
Magnussen S., McRoberts R., Tomppo E. (2009). Model-based mean square error estimators for k-nearest neighbour predictions and applications using remotely sensed data for forest inventories. Remote Sensing of Environment 113: 476–488. http://dx.doi.org/10.1016/j.rse.2008.04.018.
Mäkelä H., Hirvelä H., Nuutinen T., Kärkkäinen L. (2011). Estimating forest data for analyses of forest production and utilization possibilities at local level by means of multi-source National Forest Inventory. Forest Ecology and Management 262: 1345–1359. http://dx.doi.org/10.1016/j.foreco.2011.06.027.
Månsson J., Hauser C., Andrén H., Possingham H. (2011). Survey method choice for wildlife management: the case of moose Alces alces in Sweden. Wildlife Biology 17: 176–190. http://dx.doi.org/10.2981/10-052.
Matérn B. (1960). Spatial variation – stochastic models and their application to some problems in forest surveys and other sampling investigations. Meddelanden Statens Skogsforskningsins-titut 49(5).
McRoberts R.E., Holden G.R., Nelson M.D., Liknes G.C., Gormanson D.D. (2006). Using satellite imagery as ancillary data for increasing the precision of estimates for the Forest Inventory and Analysis program of the USDA Forest Service. Canadian Journal of Forest Research 36: 2968–2980.
McRoberts R. (2011). Satellite image-based maps: scientific inference or pretty pictures? Remote Sensing of Environment 115:715–724. http://dx.doi.org/10.1016/j.rse.2010.10.013.
McRoberts R., Tomppo E. (2007). Remote sensing support for national forest inventories. Remote Sensing of Environment 110: 412–419. http://dx.doi.org/10.1016/j.rse.2006.09.034.
McRoberts R.E. (2010). Probability- and model-based approaches to inference for proportion forest using satellite imagery as ancillary data. Remote Sensing of Environment 114: 1017–1025. http://dx.doi.org/10.1016/j.rse.2009.12.013.
McRoberts R.E., Næsset E., Gobakken T. (2012). Post-stratified estimation of forest area and growing stock volume using lidar-based stratifications. Remote Sensing of Environment 125: 157–166. http://dx.doi.org/10.1016/j.rse.2012.07.002.
Milberg P., Bergstedt J., Fridman J., Odell G., Westerberg L. (2008). Observer bias and random variation in vegetation monitoring data. Journal of Vegetation Science 19: 633–644. http://dx.doi.org/10.3170/2008-8-18423.
Næsset E., Gobakken T., Holmgren J., Hyyppä H., Hyyppä J., Maltamo M., Nilsson M., Olsson H., Persson Å., Söderman U. (2004). Laser scanning of forest resources: the Nordic experience. Scandinavian Journal of Forest Research 19: 482–499. http://dx.doi.org/10.1080/02827580410019553.
Næsset E., Gobakken T., Solberg S., Gregoire T.G., Nelson R., Ståhl G., Weydahl D. (2011). Model-assisted regional forest biomass estimation using LiDAR and InSAR as auxiliary data: a case study from a boreal forest area. Remote Sensing of Environment 115: 3599–3614. http://dx.doi.org/10.1016/j.rse.2011.08.021.
Næsset E., Gobakken T., Bollandsås O.M., Gregoire T.G., Nelson R., Ståhl G. (2013). Comparison of precision of biomass estimates in regional field sample surveys and airborne LiDAR-assisted surveys in Hedmark County, Norway. Remote Sensing of Environment 130: 108–120. http://dx.doi.org/10.1016/j.rse.2012.11.010.
Näslund M., Hagberg E. (1951). Skogsforskningsinstitutets större tabeller för kubering av stående träd: tall, gran och björk i södra Sverige. Sveriges skogstillgångar, Industrins upplysningstjänst, serie C 6. Stockholm.
Näslund M., Hagberg E. (1953). Skogsforskningsinstitutets större tabeller för kubering av stående träd: tall, gran och björk i norra Sverige. Meddelanden från statens skogsförsöksanstalt, Band 42 1952/53, Nr. 3 A. Stockholm.
Nilsson C., Götmark F. (1992). Protected areas in Sweden: Is natural variety adequately represented. Conservation Biology 2: 232–242. http://dx.doi.org/10.1046/j.1523-1739.1992.620232.x.
Nilsson M., Folving P., Kennedy J., Puumalainen G., Chirici G., Corona P., Marchetti M., Olsson H., Ricotta C., Ringvall A., Ståhl G., Tomppo E. (2003). Combining remote sensing and field data for deriving unbiased estimates of forest parameters over larger regions. In: Corona P., Köhl M., Marchetti M. (eds.). Advances in forest inventory for sustainable forest management and biodiversity monitoring. Forest Sciences 76. Kluwer Academic Publishers. p. 19–32. http://dx.doi.org/10.1007/978-94-017-0649-0_2.
Ohlsson S. (1975). The national forest survey. Objectives, design, and applications. The Royal College of Forestry, Department of Forest Survey, Report 20.
Olsson D., Wramner P. (1988). Breddning av riksskogstaxeringen – en studie över förutsättningar att följa miljöförändringar mm. Arbetsrapport 4. Institut för skogstaxering, SLU, Umeå. [In Swedish].
Penman J., Gytarsky M., Hiraishi T., Krug T., Kruger D., Pipatti R., Buendia L., Miwa K., Ngara T., Tanabe K., Wagner F. (2003). Good practice guidance for land use, land-use change and forestry. ISBN 4-88788-003-0.
Ranneby B., Cruse T., Hägglund B., Jonasson H., Swärd J. (1987). Designing a new national forest survey for Sweden. Studia Forestalia Suecica 177. 29 p.
Reese H., Nilsson M., Pahlen TG., Hagner O., Joyce S., Tingelöf U., Egberth M., Olsson H. (2003). Countrywide estimates of forest variables using satellite data and field data from the national forest inventory. AMBIO. 32:542–548
Ringvall A., Petersson H., Ståhl G., Lämås T. (2005). Surveyor consistency in presence/absence sampling for monitoring vegetation in a boreal forest. Forest Ecology and Management 212: 109–117. http://dx.doi.org/10.1016/j.foreco.2005.03.002.
Särndal C-E., Swensson B., Wretman J. (1992). Model assisted survey sampling. Springer, New York. 694 p. http://dx.doi.org/10.1007/978-1-4612-4378-6.
Schreuder H.T., Gregoire T.G., Wood G.B. (1993). Sampling methods for multiresource forest inventory. John Wiley & Sons, New York. 446 p. ISBN 0-471-55245-3.
SKSFS (1993). SKSFS 1993:2, Skogsstyrelsens föreskrifter och allmänna råd till skogsvårdslagen (SFS 1979:429). Skogsstyrelsens författningssamling. Jönköping, Sweden. [In Swedish].
Skogsdata. (2013). [In Swedish with summaries and legends in English]. ISSN 0280-0543.
SOU (1932). SOU 1932:26. Uppskattning av Sveriges skogstillgångar. Stockholm, Sweden. [In Swedish].
SOU (1933). SOU 1933:2. Betänkande med förslag angående åtgärder för ett bättre utnyttjande av landets skogstillgångar. Stockholm, Sweden. [In Swedish].
Ståhl G., Boström B., Lindkvist H., Lindroth A., Nilsson J., Olsson M. (2004). Methodological options for quantifying changes in carbon pools in Swedish forests. Studia Forestalia Suecica 214: 1–46.
Ståhl G., Allard A., Esseen P.-A., Glimskär A., Ringvall A., Svensson J., Sundquist S., Christensen P., Torell A.G., Högström M., Lagerqvist K., Marklund L., Nilsson B., Inghe O. (2011a). National inventory of landscapes in Sweden (NILS) – scope, design, and experiences from establishing a multiscale biodiversity monitoring system. Environmental Monitoring and Assessment 173: 579–595. http://dx.doi.org/10.1007/s10661-010-1406-7.
Ståhl G., Holm S., Gregoire T.G., Gobakken T., Næsset E., Nelson R. (2011b). Model-based inference for biomass estimation in a LiDAR sample survey in Hedmark County, Norway. Canadian Journal of Forest Research 41: 96–107. http://dx.doi.org/10.1139/X10-161.
Ståhl G., Cienciala E., Chirici G., Lanz A., Vidal C., Winter S., McRoberts RE., Rondeux J., Schadauer K., Tomppo E. (2012). Bridging national and reference definitions for harmonizing forest statistics. Forest Science 58: 214–223. http://dx.doi.org/10.5849/forsci.10-067.
Ståhl G., Heikkinen J., Petersson H., Repola J., Holm S. (2014). Sample-based estimation of greenhouse gas emissions from forests – a new approach to account for both sampling and model errors. Forest Science 60: 3–13. http://dx.doi.org/10.5849/forsci.13-005.
Thorell K.E., Östlin E.O. (1931). The national forest survey of Sweden. Journal of Forestry 4: 585–591.
Tomppo E., Olsson H., Stahl G., Nilsson M., Hagner O., Katila M. (2008). Combining national forest inventory field plots and remote sensing data for forest databases. Remote Sensing of Environment 112: 1982–1999. http://dx.doi.org/10.1016/j.rse.2007.03.032.
Tomppo E., Gschwantner Th., Lawrence M., McRoberts R.E. (eds.). (2010). National forest inventories – pathways for common reporting. Springer. 612 p. http://dx.doi.org/10.1007/978-90-481-3233-1.
Värmlands läns skogar. (1914). Betänkande avgivet av kommisionen för försökstaxering rörande virkeskapital, tillväxt m.m. av skogarna i Värmlands län. Stockholm, Sweden. [In Swedish].
Vibrans A.C., McRoberts R.E, Moser P., Nicoletti A.L. (2013). Using satellite image-based maps and ground inventory data to estimate the area of the remaining Atlantic forest in the Brazilian state of Santa Catarina. Remote Sensing of Environment 130: 87–95. http://dx.doi.org/10.1016/j.rse.2012.10.023.
Vilà M., Carrillo-Gavilán A., Vayreda J., Bugmann H., Fridman J., Grodzki W., Haase J., Kunstler G., Schelhaas M., Trasobares A. (2013). Disentangling biodiversity and climatic determinants of wood production. PLoS ONE 8(2). http://dx.doi.org/10.1371/journal.pone.0053530.
von Segebaden G. (ed.) (1998). Rikstaxen 75 år. Utvecklingen 1923–1998. Swedish University of Agricultural Sciences, Department of Forest Resource Management and Geomatics, Report 8. Umeå, Sweden. 562 p. [In Swedish].
Wulff S. (2004). Nonsampling errors in ocular assessments – Swedish experiences of observer influences on forest damage assessments. In: Environmental monitoring. CRC Press. p. 337–346. http://dx.doi.org/10.1201/9780203495476.ch13.
Wulff S., Lindelöw Å., Lundin L., Hansson P., Axelsson A-L., Barklund P., Wijk S., Stahl G. (2011). Adapting forest health assessments to changing perspectives on threats – a case example from Sweden. Environmental Monitoring and Assessment 184(4): 2453–2464. http://dx.doi.org/10.1007/s10661-011-2130-7.
Total of 71 references
Appendices
Appendices A–C can be downloaded at http://www.silvafennica.fi/supp_files/article1095/appendices.pdf.
