Anu Akujärvi,
Ville Hallikainen,
Mikko Hyppönen  ,
Eero Mattila,
Kari Mikkola,
Pasi Rautio
,
Eero Mattila,
Kari Mikkola,
Pasi Rautio
Effects of reindeer grazing and forestry on ground lichens in Finnish Lapland
Akujärvi A., Hallikainen V., Hyppönen M., Mattila E., Mikkola K., Rautio P. (2014). Effects of reindeer grazing and forestry on ground lichens in Finnish Lapland. Silva Fennica vol. 48 no. 3 article id 1153. https://doi.org/10.14214/sf.1153
Highlights
- Both reindeer grazing and forestry affect the cover and biomass of reindeer lichens
- Reindeer grazing has bigger impact than forestry
- The lichen cover was about five-fold and the biomass about fifteen-fold in the ungrazed (fenced) sites than in the grazed ones
- The decrease of not only the biomass, but also the cover of lichens, is alarming.
Abstract
Reindeer husbandry and forestry are practiced in the same areas in northern Fennoscandia. Reindeer pastures have largely deteriorated. We aimed to quantify the separate and combined effects of reindeer grazing and forestry on the amount of ground lichens. To do this, we mapped and inventoried all larger enclosures (49) in Finnish Lapland where forest management practices were similar in both sides of the fence. The average time since fencing was 43 years. We recorded the cover and estimated dry biomass of ground lichens, as well as parameters describing forest stand characteristics. The effect of reindeer grazing on both the cover and estimated dry biomass of lichens was clear: in the ungrazed (fenced) sites, the lichen cover (35.8%) was on average 5.3-fold and the dry biomass (1929 kg ha–1) 14.8-fold compared with the corresponding estimates in the grazed sites (6.8% and 130 kg ha–1). The effect of forestry on lichens was smaller. In the grazed stands the cover and biomass of lichens were higher in the mature stands compared to the younger stand development classes, whereas in the ungrazed stands there were no significant differences between the development classes. Both reindeer grazing and forestry affect the cover and biomass of ground lichens. The influence of reindeer grazing is, however, much heavier than that of forestry. The decrease of not only the biomass, but also the lichen cover, is alarming. The decrease of lichen cover may hinder the recovery of reindeer pastures, which in the long run endangers the sustainability of reindeer husbandry.
Keywords
forest management;
timber harvesting;
reindeer herding;
pastures;
lichen cover;
lichen biomass
- Akujärvi, Finnish Environment Institute, Helsinki, Finland E-mail anu.akujarvi@ymparisto.fi
- Hallikainen, Finnish Forest Research Institute, Northern Unit, P.O. Box 16, FI-96301 Rovaniemi, Finland E-mail ville.hallikainen@metla.fi
-
Hyppönen,
Finnish Forest Research Institute, Northern Unit, P.O. Box 16, FI-96301 Rovaniemi, Finland
E-mail
mikko.hypponen@metla.fi
- Mattila, Finnish Forest Research Institute, Northern Unit, P.O. Box 16, FI-96301 Rovaniemi, Finland E-mail eero.mattila@metla.fi
- Mikkola, Finnish Forest Research Institute, Northern Unit, P.O. Box 16, FI-96301 Rovaniemi, Finland E-mail kari.mikkola@metla.fi
- Rautio, Finnish Forest Research Institute, Northern Unit, P.O. Box 16, FI-96301 Rovaniemi, Finland E-mail pasi.rautio@metla.fi
Received 25 March 2014 Accepted 28 May 2014 Published 1 July 2014
Views 212667
Available at https://doi.org/10.14214/sf.1153 | Download PDF

1 Introduction
Reindeer husbandry and forestry are socially and economically important livelihoods in northern Fennoscandia. They overlap geographically and share the natural resources provided by forests. The coexistence of these two livelihoods has not always been free from arguing and conflict (Kyllönen et al. 2006; Roturier and Roué 2009; Mustajoki et al. 2011). In fact, the roles of forestry and intensive reindeer grazing in the observed decline of ground-lichen pastures have been argued both in Finland and in Sweden (Berg et al. 2008; Roturier 2009; Rytkönen et al. 2013). At the same time, it has become clear that many factors affect the amount of terrestrial lichens (Kumpula et al. 2013) which are an essential part of the winter nutrition of semi-domesticated reindeer (Rangifer tarandus tarandus) (e.g. Kumpula 2001). Lichens contain a lot of easily digestible carbohydrates (Russell and Martell 1984) and promote the digestion of plant fibre in the rumen (Aagnes et al. 1995).
On the one hand, increased sizes of reindeer herds and lack of pasture rotation cause intensive grazing and trampling of the pastures. This has probably led to reductions in the cover, height and biomass of slowly-growing ground lichens which are the most important winter forage for reindeer (Väre et al. 1995; Eskelinen and Oksanen 2006; Kumpula et al. 2009). On the other hand, timber harvesting and site preparation also affect the occurrence of ground vegetation both in the short- and long-term (Roturier and Bergsten 2006; Kivinen et al. 2010). The success of lichens depends also on micro-climatic conditions, such as light, moisture and temperature (Jonsson Čabrajić 2009). Furthermore, global change or so called global greening has been proposed to cause increase in the area of moist sites and decrease in the dry ones which leads to continually lessening lichen pastures (Cornelissen et al. 2001; Mattila 2010).
The amount of winter forage, especially ground and arboreal lichens, is the minimum factor in the success of reindeer husbandry. To evaluate the condition of lichen pastures, repeated field inventories have been carried out in the Finnish reindeer management area since the early 1970s (e.g. Kärenlampi 1973; Kautto et al. 1986). The winter ranges have been surveyed as a part of the National Forest Inventory (NFI) several times since the late 1970s (Mattila 1981, 1988, 1996, 2006a, b, 2014). According to these inventory results, the amount of ground lichens has declined drastically since the 1970s although regional differences in the condition of pastures (denoting lichen cover and biomass) are great. Especially, the roles of reindeer grazing and forestry on the observed decline have been disputed (e.g. Rytkönen et al. 2013). Both of these livelihoods have certainly contributed to the situation, but it is difficult to quantify their respective impacts (Väre et al. 1995; den Herder et al 2003; Helle and Kojola 2004).
To date, the pasture inventories have mostly been carried out in areas where reindeer husbandry and forestry are practiced together. Lack of enclosure studies has made it nearly impossible to separate the effects of reindeer grazing and forestry on the amount of ground lichens (Hallikainen et al. 2008). According to Väre et al. (1995), many studies of reindeer grazing effects are speculative in nature because fenced enclosures have not been used. The few enclosure studies where forest management has been similar on both sides of the fences have indicated that grazing has a strong impact on the lichen biomass (e.g. Mattila 2004).
The aim of this study was to quantify the separate effects of reindeer grazing and forestry and their interaction on the cover and biomass of ground lichens in the Finnish reindeer management area. The study was carried out using fenced enclosures and statistical modelling. The stand development class and canopy cover (i.e. structure of the growing stock) as well as the cover of logging residue were used to represent the effects of forestry on lichens.
2 Materials and methods
2.1 Data collection
We mapped the Finnish reindeer management area to find fenced enclosures large enough and where forest management had been similar in both sides of the fence. The study stands had to represent different stand development classes and canopy covers. This resulted in a unique experimental set-up where the effects of forestry and reindeer grazing could be studied in parallel in a broad geographical area (Fig. 1).
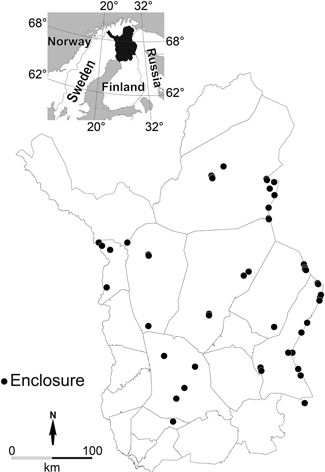
Fig. 1. Location of the study stands in the reindeer herding area in northern Finland.
The study stands were intersected by a fence. The individual stands were located that far from each other that they could be considered as independent observations. The average distance between the stands was 12 km. We found 49 study stands that met the criteria concerning the area and similarity of the stand halves on the both sides of the fence (Fig. 1). The average time since fencing was 43 years. These independent stands constituted the highest hierarchical level in the statistical models described below.
Ten large circular sample plots (radius 12.45 m, area 487 m2) were positioned in a systematic grid within each study stand (Fig. 2). Five of the plots were located on the grazed side of the fence and another five on the ungrazed one, each one of the plots at least 20 m from the fence and at least 25 m from each other. Providing that there was enough space in a stand in both sides of the fence, the distance between the plots was 30–50 m. The idea was to place the plots evenly and representatively. The distance between the plots was decided before measuring their location in the stands.
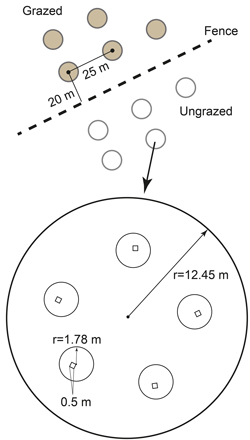
Fig. 2. Experiment set-up showing five circular (487 m2) sample plots on both sides of the fence in systematic grid. In each sample plot there are five smaller (10 m2) circular plots, and within each of these a 0.5 × 0.5 m square plot.
The basal area of the trees (diameter at breast height, d1.3 > 7.4 cm) as well as the mean, median and maximum height, diameter, and age of the trees were determined separately for Scots pine (Pinus sylvestris L.), Norway spruce [Picea abies (L.) Karst.] and deciduous trees in the larger circular plots. Smaller trees (d1.3 ≤ 7.4 cm) were counted by tree species and they were recorded as seedlings in spite of their height. In addition, soil type (moraine, sorted) and the cover of logging residue were recorded. The measurements were based on the methods used in the National Forest Inventory in Finland (Valtakunnan metsien… 2009). The succession stage and forest management history of the stands was defined using the following stand development classification: 1 = stands in regeneration phase (including temporarily treeless regeneration areas, seed-tree stands, young and advanced seedling stands); 2 = young thinning stands; 3 = advanced thinning stands; 4 = mature stands (see details Ylitalo 2013, p. 59).
Five small circular plots (radius 1.78 m, area 10 m2) were located inside the large circular plots (Fig. 2). The number of seedlings (d1.3 ≤ 7.4 cm) was counted in the small circular plots. In addition, the height of the minimum, median and maximum seedlings (based on seedling heights) was measured by tree species. To estimate the grazing intensity the number of groups of reindeer pellets was counted.
The lowest hierarchical level, the small square plots (0.5 m × 0.5 m, area 0.25 m2), one in each 10 m2 -circular plot, were used for defining the cover of ground- and field-layer vegetation. The cover of the lichens was measured using a scale from 0to 100% (1% precision). The following species were identified in the lichen cover: Cladonia (Cladina) stellaris (L.), C. rangiferina (L.), C. mitis (Sandst.), C. arbuscula (L.), C. uncialis (L.) and Stereocaulon paschale (Hoffm.). In addition to the lichen cover, the height of the living part of lichens was measured with the precision of 1 mm. The dry biomass of the lichens was estimated as a function of cover and moisture-corrected height of lichens using formula
B = a × C × H
in which
B = estimated dry biomass (kg ha–1),
a = coefficient depending on lichen species
C = lichen cover (%),
H = height of the living part of lichens (mm).
The value of the coefficient a is 1.3536 for C. stellaris and Stereocaulon paschale and 0.6288 for the other lichens. The formula has been derived from the unpublished data of Helle (see Mattila and Helle 1978, p. 11; Mattila 1981, p. 23). Height was calibrated using a coefficient depending on the moisture conditions at the moment of measurement. The moisture of the lichens was estimated manually using a three-step ordinal scale for the correction of the heights of the lichens (Kumpula et al. 2006, p. 16).
The measurements in the smaller circular plots and in the square plots were averaged for the larger circular plots. These larger circular plots were treated as the lower-level observations in the statistical models. The number of the large sample plots in the modelling was 483 after removing seven outliers (see below for details).
2.2 Statistical analysis
The used hierarchical levels in the multi-level modelling were 1) study stand (hereafter stand) and 2) larger circular sample plot (hereafter plot). The explanatory variables considered the most important in the lichen cover and biomass models were 1) the effect of grazing [ungrazed (fenced) vs. grazed], 2) the stand development class and 3) the interaction of these two. In addition, the significance of the following variables (factors and covariates) was tested in the models: altitude (m a.s.l.), average effective temperature sum (d.d.) in 1961–1990, soil type (moraine vs. sorted), time since fencing (years), grazing intensity (described by the number of reindeer pellet groups), cover of harvesting residue (%), canopy cover (scale 0–1) and site type based on the vegetation cover (Cajander 1913): barren heath sites (Cladina type, ClT), xeric sites (Myrtillus-Calluna-Cladina type, MCClT and Ericaceae-Cladina type, ErClT) and sub-xeric sites (Empetrum-Myrtillus type, EMT and Empetrum-Vaccinium type, EVT).
Canopy cover was estimated using models developed for Scots pine and Norway spruce (Korhonen et al. 2007). The average temperature sum for the stands (threshold value of five degrees centigrade) for the period of 1961–1990 was estimated using a model by Ojansuu and Henttonen (1983). For each stand, the temperature sum represents long-term, average temperature conditions.
The lichen cover model was constructed using generalized linear model with study stand as a random factor. The measured lichen cover was expressed as a proportion (0–1) and modelled using binomial distribution and logit-link function (e.g. Miina et al. 2009). Except for the study stand, other variables were treated as fixed effects in the lichen cover model. The model was estimated using R function glmmPQL in MASS-package (Venables and Ripley 2002).
The biomass model was developed using a compound Poisson linear model with study stand as a random factor. This model belongs to the Tweedie family of distributions. It is a part of a family of exponential dispersion models with power variance functions for V(μ) = μp for p ∉ (0,1), p denotes the exponent of the variance function and affects the distribution. Mathematical background and examples have been described by Smyth and Jørgensen (2002), Dunn (2004), and Dunn and Smyth (2005).
The biomass model was computed using the R package cplm (Zhang 2002). Unlike the MASS package (function glmmPQL), the cplm package does not define the p-values for the parameter estimates, only the t-values. However, we calculated the approximated p-values for the parameter estimates based on the t-distribution, similarly to glmmPQL. The denominator degrees of freedom were calculated using the method described by Pinheiro and Bates (2000, p. 91). The predictions and prediction plots of the models were made using the R package effects (Fox 2003). The package utilizes R’s lattice graphics package (Sarkar 2008) in the plotting of the model predictions. Furthermore, the R package lsmeans was used for the pairwise comparisons (Lenth 2013).
2.3 Description of the data
The average cover and biomass of ground lichens calculated from the raw data (483 plots) were 25.7% and 1460 kg ha–1, respectively. The studied forest stands were located at the average altitude of 215 m above sea level. The mean temperature sum was 733 d.d. (Table 1).
| Table 1. Description of the sample plots. The column N denotes the number and proportion (in parenthesis, %) of the sample plots where a variable has other values than 0. The values of the stand level variables have been calculated using the stand level data (same values for all the sample plots). | ||||||
| Variable/category | N (%) | Min | Max | Mean | Sd | Median |
| Sample plot level variables | ||||||
| Lichen cover, % | 482 (100) | 0.1 | 93.0 | 25.7 | 24.2 | 17.7 |
| Estimated dry biomass of lichens, kg ha–1 | 482 (100) | 0.0 | 9043.0 | 1459.5 | 1975.1 | 481.6 |
| Cover of harvesting residue, % | 330 (68) | 2.5 | 30.0 | 5.4 | 5.4 | 2.5 |
| Basal area of Scots pine, m2 ha–1 | 440 (91) | 1.0 | 29.0 | 10.6 | 5.6 | 11.0 |
| Basal area of Norway spruce, m2 ha–1 | 32 (7) | 1.0 | 6.0 | 2.3 | 1.6 | 2.0 |
| Basal area of deciduous trees, m2 ha–1 | 63 (13) | 1.0 | 11.0 | 2.4 | 2.0 | 2.0 |
| Basal area, total, m2 ha–1 | 447 (93) | 1.0 | 29.0 | 10.9 | 5.5 | 11.0 |
| Diameter1.3 of Scots pine, cm | 440 (91) | 8.1 | 51.5 | 20.5 | 7.2 | 19.8 |
| Diameter1.3 of Norway spruce, cm | 32 (7) | 10.0 | 24.0 | 17.7 | 4.8 | 16.9 |
| Diameter1.3 of deciduous trees, cm | 63 (13) | 7.8 | 38.1 | 17.7 | 6.5 | 16.4 |
| Height of Scots pine, cm | 400 (91) | 4.4 | 21.1 | 12.5 | 3.1 | 12.7 |
| Height of Norway spruce, m | 32 (6.6) | 6.5 | 17.1 | 10.3 | 2.3 | 10.4 |
| Height of deciduous trees, m | 63 (13) | 4.9 | 16.2 | 9.6 | 2.8 | 9.0 |
| Age of Scots pine, years | 440 (91) | 19.0 | 310.0 | 96.3 | 69.3 | 72.3 |
| Age of Norway spruce, years | 32 (7) | 35.0 | 230.0 | 100.8 | 61.7 | 75.0 |
| Number of Scots pine stems ha–1 | 440 (91) | 5.0 | 2210.0 | 464.7 | 417.4 | 347.5 |
| Number of Norway spruce stems ha–1 | 32 (7) | 17.5 | 442.1 | 114.5 | 97.1 | 85.2 |
| Number of deciduous stems ha–1 | 63 (13) | 14.4 | 808.4 | 153.1 | 170.9 | 72.2 |
| Total number of stems ha–1 | 447 (93) | 5.1 | 2210.5 | 487.1 | 412.0 | 370.0 |
| Number of Scots pine seedlings ha–1 | 431 (89) | 40.0 | 9800.0 | 726.2 | 1045.9 | 400.0 |
| Number of Norway spruce seedlings ha–1 | 76 (16) | 40.0 | 1280.0 | 156.8 | 257.1 | 40.0 |
| Number of deciduous seedlings ha–1 | 145 (30) | 40.0 | 4280.0 | 387.6 | 518.6 | 200.0 |
| Total number of seedlings ha–1 | 461 (95) | 40.0 | 9840.0 | 826.7 | 1053.8 | 480.0 |
| Predicted proportion of canopy cover (0–1) | 483 (100) | 0.1 | 0.98 | 0.5 | 0.2 | 0.6 |
| Number of reindeer summer pellets ha–1 | 52 (11) | 1.0 | 5.0 | 1.8 | 1.1 | 1.0 |
| Number of reindeer winter pellets ha–1 | 200 (41) | 1.0 | 38.0 | 8.1 | 0.6 | 5.0 |
| Stand level variables | ||||||
| Altitude, m.a.s.l | 49 (100) | 114.9 | 321.4 | 215.1 | 56.9 | 225.0 |
| Average temperature sum during 1961–1990, d.d. | 49 (100) | 650.5 | 924.0 | 732.7 | 62.2 | 708.0 |
| Time since fencing, years | 49 (100) | 10.0 | 90.0 | 42.9 | 3.4 | 40.0 |
The distributions of the categorical variables that were used in the models were the following:
- soil type: moraine 58.6%, sorted 41.4% of the plots
- site type: barren 32.3%, xeric 45.3%, sub-xeric 22.4%
- stand development class: stand in a regeneration phase 25.5%, young thinning stand 28.2% advanced thinning stand 19.0%, and mature stand 27.3%.
Seven (7) sample plots out of 500 were excluded in the modelling, because they deteriorated the model fits and biased the predictions. Including these sample plots in the models caused serious convergence problems in the biomass model. Excluding them did not affect the selection of the explanatory variables. All the seven excluded plots were in the ungrazed (fenced) side. The average lichen cover and biomass in the included ungrazed plots were 41% and 2698 kg ha–1, respectively. The respective averages in the excluded ungrazed plots were 80% and 12 167 kg ha–1. Six of these plots were classified as barren heath and one as xeric site. Five of the plots represented young thinning stands (stand development class 2) and two of them advanced thinning stands (class 3).
3 Results
Lichen cover
There were six statistically significant explanatory variables in the lichen cover model: grazing, development class, canopy cover, site type, soil type and cover of harvesting residue. In addition, the model included two interaction terms (Table 2). Grazing was statistically a highly significant explanatory variable even in the model where the interactions were included. When the other predictors in the model were set to their averages, the effect of reindeer grazing on the lichen cover was clear (Fig. 3a): in the ungrazed (fenced) sites, the lichen cover (35.8%) was 5.3-fold compared with the grazed sites (6.8%). The lichen cover varied also between the stand development classes (Fig. 3a). In the grazed sites, lichen cover ranged from 4.1% in class 3 to 13.8% in class 4 (i.e. 3.7-fold difference). In the ungrazed sites, the corresponding estimates were 29.9% in stand development class 3 and 41.1% in class 1, the coefficient being 1.4. In other words, the proportional effect of forestry on the lichen cover was larger, when the sites were grazed. In the ungrazed sites, the lichen cover did not significantly differ between the development classes (Fig. 3a, Table 3).
| Table 2. The parameter estimates, their standard errors, t-values and Wald chi-square tests for the terms in the lichen cover model. P-values (p) are calculated for the variables in the model based on Wald’s chi-square statistics. Reference category and the tests against the reference categories are printed in italics. Stand development classification, see Section 2.1 Data collection. | ||||
| Variable/effect | Estimate | Standard error | t-/chi-value | p |
| Fixed effects | ||||
| Intercept | –1.480 | 0.281 | –5.27/28.76 | 0.000 |
| Grazing (grazed, ungrazed) | - | - | 271.34 | 0.000 |
| – ungrazed | 2.156 | 0.133 | 16.20 | 0.000 |
| Stand development class (1,2,3,4) | - | - | 2.20 | 0.533 |
| – 2 | 0.020 | 0.384 | –0.05 | 0.958 |
| – 3 | –0.755 | 0.614 | –1.23 | 0.220 |
| – 4 | –0.460 | 0.455 | –1.01 | 0.312 |
| Canopy cover | –1.015 | 0.512 | –1.98/4.06 | 0.044 |
| Site type (barren heath, xeric, sub-xeric) | - | - | 114.99 | 0.000 |
| – xeric | –0.595 | 0.089 | –6.66 | 0.000 |
| – sub-xeric | –1.557 | 0.149 | –10.49 | 0.000 |
| Soil type (moraine, sorted) | - | - | 8.51 | 0.004 |
| – sorted | 0.584 | 0.203 | 2.87 | 0.004 |
| Cover of harvesting residue | –0.030 | 0.010 | –2.87/8.55 | 0.003 |
| Grazing * Stand development class | - | - | 36.26 | 0.000 |
| – ungrazed and 2 | 0.221 | 0.221 | 1.00 | 0.318 |
| – ungrazed and 3 | 0.136 | 0.251 | 0.54 | 0.590 |
| – ungrazed and 4 | –0.747 | 0.171 | –4.38 | 0.000 |
| Stand development class * Canopy cover | - | - | 17.56 | 0.000 |
| – 2 and canopy cover | –1.096 | 0.698 | –1.57 | 0.117 |
| – 3 and canopy cover | 0.230 | 1.025 | 0.22 | 0.884 |
| – 4 and canopy cover | 2.115 | 0.760 | 2.78 | 0.006 |
| Random effects | ||||
| Stand (intercept) | 0.477 | |||
| Residual | 0.056 | |||
| Table 3. Lichen cover model: pairwise tests and tests for the trends differing from 0 by the categories (interactions). Stand development classification, see Section 2.1 Data collection. | |||
| Variable/categories | p | Variable/categories | p |
| Site type | Ungrazed, 1 vs. 2 | 0.450 | |
| Barren heath vs. Xeric | 0.000 | Ungrazed, 1 vs. 3 | 0.370 |
| Barren heath vs. Sub-xeric | 0.000 | Ungrazed, 1 vs. 4 | 1.000 |
| Xeric vs. Sub-xeric | 0.000 | Ungrazed, 2 vs. 3 | 0.999 |
| Ungrazed, 2 vs. 4 | 0.777 | ||
| Grazing * Stand development class | Ungrazed, 3 vs. 4 | 0.463 | |
| Grazed, 1 vs. 2 | 0.260 | ||
| Grazed, 1 vs. 3 | 0.374 | Stand development class * Canopy cover | |
| Grazed, 1 vs. 4 | 0.119 | 1 * Canopy cover | 0.044 |
| Grazed, 2 vs. 3 | 1.000 | 2 * Canopy cover | 0.000 |
| Grazed, 2 vs. 4 | 0.000 | 3 * Canopy cover | 0.371 |
| Grazed, 3 vs. 4 | 0.000 | 4 * Canopy cover | 0.048 |
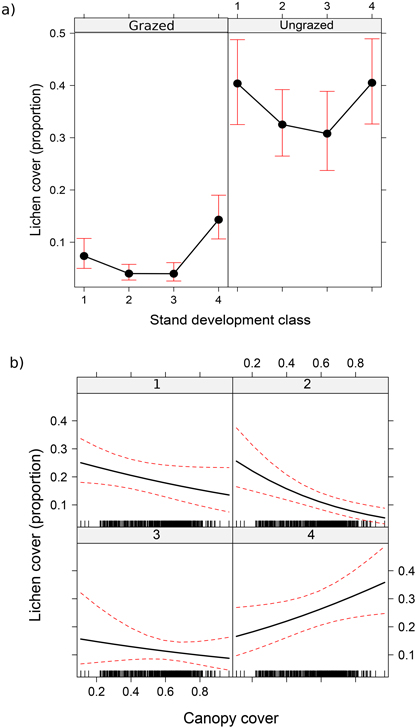
Fig. 3. Effect of grazing and stand development class (a), and canopy cover and stand development class (b) on lichen cover. Values represent predicted mean effects and 95% confidence limits.
The cover of lichens decreased significantly with increasing canopy cover only in the development class 2. In addition, the results suggested a slight negative trend in the development class 1 and a slight positive trend in the class 4 with increasing canopy cover (Fig. 3b, Table 3).
Lichen cover differed significantly between the site types (Tables 2 and 3). In barren heath sites the lichen cover was the highest (26.9%) and in sub-xeric sites it was the lowest (7.2%). In xeric sites lichen cover was 16.9%. The cover of ground lichens was higher on sorted soils than on moraines. Cover predictions on sorted soils and on moraines were 21.8% and 13.5%, respectively (Table 2).
The cover of harvesting residue had a significant effect on the lichen cover. The effect of residue cover at its mean (3.7%) caused a decrease of 1.6% in the lichen cover.
The fit of the model was fairly good when the distributions of the model predictions were compared to the distribution of the response variable (Fig. 5).
Lichen biomass
In the lichen biomass model there were six statistically significant explanatory variables: grazing, development class, canopy cover, site type, soil type, and temperature sum. In addition, there were two interaction terms (Table 4). According to the model, the effect of reindeer grazing on the estimated dry biomass of lichens was clear: in the ungrazed (fenced) sites, the estimated dry biomass (1929 kg ha–1) was 14.8-fold compared with the grazed sites (130 kg ha–1). Like lichen cover, the estimated dry biomass of lichens varied between the stand development classes (Fig. 4a, Table 5). In the grazed sites, the estimated means of dry lichen biomass ranged from 88 kg ha–1 in class 3 to 270 kg ha–1 in class 4 (i.e. 3.1-fold difference). In the ungrazed sites, the corresponding estimates were 1761 kg ha–1 in stand development class 3 and 2174 kg ha–1 in class 1, the coefficient being 1.2. The maximum lichen biomass difference between the stand development classes reflects the effect of forestry on the estimated dry lichen biomass.
| Table 4. The parameter estimates, their standard errors, t-values and Wald chi-square tests for the terms in the lichen biomass model. P-values (p) are calculated for the variables in the model based on Wald’s chi-square statistics. Reference category and the tests against the reference categories are printed in italics. Stand development classification, see Section 2.1 Data collection. | ||||
| Variable/effect | Estimate | Standard error | t-/chi-value | p |
| Fixed effects | ||||
| Intercept | 8.138 | 1.190 | 6.84/46.74 | 0.000 |
| Grazing (grazed, ungrazed) | - | - | 621.12 | 0.000 |
| – ungrazed | 2.988 | 0.120 | 24.92 | 0.000 |
| Stand development class (1,2,3,4) | - | - | 4.19 | 0.242 |
| – 2 | 0.531 | 0.342 | 1.55 | 0.122 |
| – 3 | –0.401 | 0.499 | –0.80 | 0.422 |
| – 4 | 0.119 | 0.427 | 0.28 | 0.781 |
| Canopy cover | –0.473 | 0.489 | –0.97/0.94 | 0.333 |
| Temperature sum | –0.004 | 0.002 | –2.53 /6.37 | 0.012 |
| Site type (barren heath, xeric, sub-xeric) | - | - | 74.17 | 0.000 |
| – xeric | –0.423 | 0.084 | –5.06 | 0.000 |
| – sub-xeric | –1.060 | 0.123 | –8.60 | 0.000 |
| Soil type (moraine, sorted) | - | - | 7.22 | 0.007 |
| – sorted | 0.524 | 0.195 | 2.69 | 0.007 |
| Grazing * Stand development class | - | - | 65.03 | 0.000 |
| – ungrazed and 2 | –0.053 | 0.169 | –0.31 | 0.754 |
| – ungrazed and 3 | 0.047 | 0.186 | 0.25 | 0.800 |
| – ungrazed and 4 | –1.004 | 0.155 | –6.46 | 0.000 |
| Stand development class * Canopy cover | - | - | 15.37 | 0.002 |
| – 2 and canopy cover | –1.163 | 0.631 | –1.84 | 0.066 |
| – 3 and canopy cover | 0.355 | 0.834 | 0.43 | 0.670 |
| – 4 and canopy cover | 1.544 | 0.712 | 2.17 | 0.031 |
| Random effects | ||||
| Stand (intercept) | 0.45 | |||
| Residual | 1.84 | |||
| Table 5. Lichen biomass model: pairwise tests and tests for the trends differing from 0 by the categories (interactions). Stand development classification, see Section 2.1 Data collection. | |||
| Variable/categories | p | Variable/categories | p |
| Site type | Ungrazed, 1 vs. 2 | 0.991 | |
| Barren heath vs. Xeric | 0.000 | Ungrazed, 1 vs. 3 | 0.994 |
| Barren heath vs. Sub-xeric | 0.000 | Ungrazed, 1 vs. 4 | 1.000 |
| Xeric vs. Sub-xeric | 0.000 | Ungrazed, 2 vs. 3 | 1.000 |
| Ungrazed, 2 vs. 4 | 1.000 | ||
| Grazing * Stand development class | Ungrazed, 3 vs. 4 | 0.999 | |
| Grazed, 1 vs. 2 | 1.000 | ||
| Grazed, 1 vs. 3 | 0.988 | Stand development class * Canopy cover | |
| Grazed, 1 vs. 4 | 0.001 | 1 * Canopy cover | 0.333 |
| Grazed, 2 vs. 3 | 0.999 | 2 * Canopy cover | 0.000 |
| Grazed, 2 vs. 4 | 0.000 | 3 * Canopy cover | 0.862 |
| Grazed, 3 vs. 4 | 0.000 | 4 * Canopy cover | 0.039 |
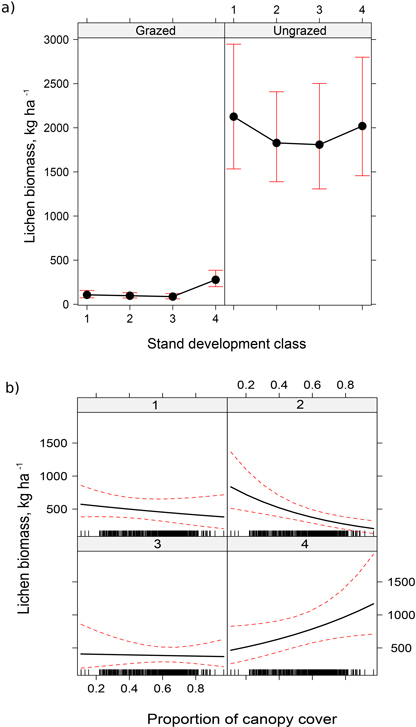
Fig. 4. Effect of grazing and stand development class (a), and canopy cover and stand development class (b) on the estimated dry biomass of lichens. Values represent predicted mean effects and 95% confidence limits.
The biomass of lichens decreased significantly with increasing canopy cover only in the development class 2. In the development class 4 the lichen biomass, on the contrary, slightly increased (Fig. 4b, Table 5).
Estimated dry lichen biomass differed also between site types (Tables 4 and 5). In barren heath sites the lichen biomass was the highest (758 kg ha–1) and in sub-xeric sites it was the lowest (262 kg ha–1). In xeric sites the biomass was 496 kg ha–1. Biomass was higher on sorted soils than on moraines. The biomass predictions for sorted soils and moraines were 671 kg ha–1 and 397 kg ha–1, respectively. In addition, the biomass was the higher the lower was the temperature (Table 4). As an example, according to the model, the biomass was 800 kg ha–1 and 250 kg ha–1 if the temperature sum was 600 d.d. and 900 d.d., respectively.
The fit of the model was fairly good when the distributions of the model predictions were compared to the distribution of the response variable (Fig. 5).
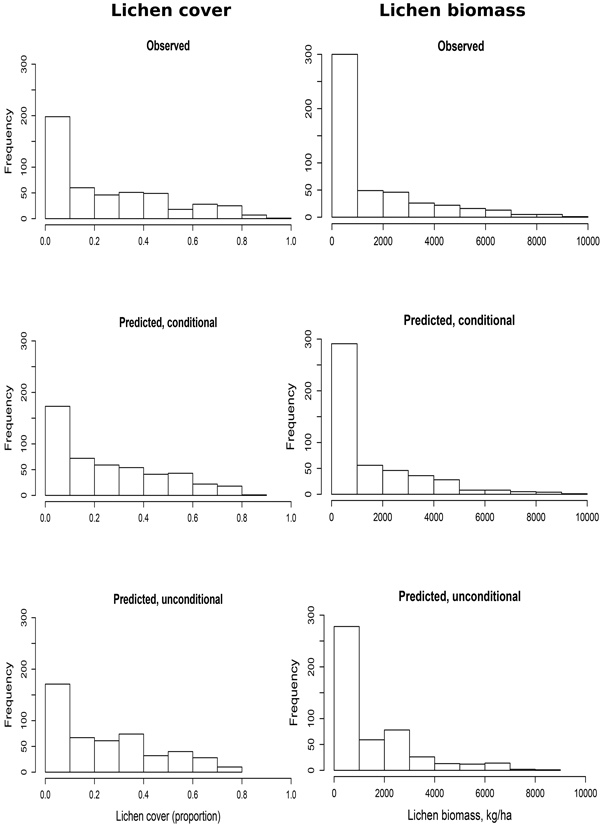
Fig. 5. Fit of the lichen cover and lichen biomass models. ‘Conditional’ denotes the estimates calculated using both fixed and random part of the model (random intercept). ‘Unconditional’ denotes the estimates calculated by using only the fixed coefficients.
4 Discussion
The condition of reindeer pastures has to date been investigated mostly in areas where reindeer husbandry and forestry are practiced together. This approach has not enabled to separate properly the effects of forestry practices and reindeer grazing on the amount of ground lichens. Consequently, it has not been possible to show without dispute how the different livelihoods affect the amount of reindeer lichens. In this study, we were able to quantify both the effects of grazing and forestry at the same time using fenced enclosures. This approach made it possible to study separately the effects of reindeer grazing and forestry as well as their interaction on the amount of lichens.
According to this study, reindeer grazing had a very strong negative effect on the amount of ground lichens. This was expected although it has not been previously possible to separate the effects of reindeer grazing from those of forestry on the observed loss of lichens (e.g. Mattila 2006a, b, 2012). The effects of heavy winter- and year-round grazing, as well as those of inadequate grazing rotation, on the ground vegetation are well known and reduction of lichens in heaths and pine forests has been reported in several studies earlier (e.g. Väre et al. 1995; Kumpula et al. 2000, 2009; den Herder et al. 2003; Eskelinen and Virtanen 2006).
In the present study, the lichen cover in ungrazed (fenced) sites was on average five-fold compared with the corresponding estimates in the grazed sites. This difference is larger than observed earlier in a large-scale enclosure study by Mattila (2004) who noticed that outside the reindeer management area, the average lichen cover was about two-fold compared with the corresponding estimate in similar sites inside the reindeer management area (Table 6).
| Table 6. Estimated lichen covers and dry biomasses according to some recent studies. | ||||
| Study | Cover, % | Biomass, dw kg ha–1 | ||
| Grazed | Ungrazed | Grazed | Ungrazed | |
| This study | 6.8 | 35.8 | 130 | 1929 |
| Mattila 2004 | 3.8 | 7.1 | 64 | 425 |
| Väre et al. 1996 | 860 | 7900 | ||
| Susiluoto et al. 2008 | 500 | 3550 | ||
| Olofsson et al. 2010 a) | 253 | 642 | ||
| Köster et al. 2013 | 900 | 3500 | ||
| a) Heavily grazed 131 kg ha–1 | ||||
In the present study, the estimated dry biomass of lichens in ungrazed (fenced) sites was approximately fifteen-fold compared with the corresponding estimates in the grazed sites. The biomass estimates vary considerably between earlier studies both in ungrazed and grazed sites (Table 6). The differences between individual studies may be due to different experiment and study designs and spatial scales. As far as we know, our estimate of the difference between the lichen biomass in the ungrazed and grazed sites is the largest observed among different studies to date (Väre et al. 1996; Mattila 2004; Susiluoto et al. 2008; Olofsson et al. 2010; Köster et al. 2013). The second highest difference was observed by Väre et al. (1996) who reported that the lichen biomass in the ungrazed sites was nine-fold compared with the estimate in the grazed sites.
In this study we used the number of reindeer droppings and the time since fencing as explanatory variables to describe recent grazing pressure but found no statistically significant effects. Reasons for non-significant effects may be that the droppings are visible only 3 to 5 years (Helle et al. 1990; Skarin 2008) and that the time since fencing was quite long (median 40 years).
It is known from several studies that forestry measures, such as harvesting and leaving harvesting residues on site and site preparation affect lichen cover and biomass (Helle et al. 1990; Suominen and Olofsson 2000; Roturier and Bergsten 2006; Berg et al. 2008; Kivinen et al. 2010). Also the landscape structure (Kumpula et al. 2013) and the structure of forest stands affect reindeer’s pasture preferences and ground vegetation (Helle et al. 1983; Matila and Kubin 1998; Kumpula et al. 2007; Boudreault et al. 2013). In the present study, stand development class and canopy cover (i.e. structure of growing stock) were used to represent the indirect effects of forestry on lichens. In the biomass model, the main effect of these variables had no statistically significant influence on lichen biomass. In the lichen cover model, however, canopy cover was a significant predictor. In both of the models, the interaction of these variables was significant meaning that the effects of forestry were different in grazed and ungrazed sites. In the grazed sites, the lichen cover and biomass were slightly higher in mature stands compared to younger ones, whereas in the ungrazed sites there were no differences between the development classes (see also Mattila 2004; Kumpula et al. 2013).
Stand development class and canopy cover had an interesting interaction. In the young thinning stands both lichen cover and biomass decreased as a function of increasing canopy cover, whereas in the mature stands lichen cover and biomass increased slightly when canopy cover increased. This opposite effect of closing canopy in young vs. mature forests was unexpected.
The effects of development class and canopy cover on lichen cover and biomass can be approached through climatic factors affecting the mat-forming lichens. According to Jonsson Čabrajić (2009), light is the most important factor affecting the height growth of lichens, reaching saturation at site openness of 40%, equivalent to a 15 m2 ha–1 basal area of the growing stock. Humidity is the second limiting factor (Jonsson Čabrajić et al. 2010; Kumpula et al. 2013). Lichens are active at the temperatures above freezing point but their growth is negatively correlated with temperature when the optimal temperature for photosynthesis (to lichens about 10 °C) is exceeded (Matila and Kubin 1998; Jonsson Čabrajić 2009; Kumpula et al. 2013). According to Matila and Kubin (1998), the optimal basal area of a pine stand related to the collection output of decorative lichen (Cladina stellaris) is 17–19 m2 ha–1 and optimal canopy cover 50%. Thus we assume that closing mature pine stands provide optimal micro-climatic conditions (light, humidity, temperature) for lichens compared to younger stands. In younger forests increasing canopy cover seems to change at least micro-climatic factors to a non-optimal level.
The effect of site type on the lichen cover and biomass was expected: the poorer was the type, the higher were the lichen cover and biomass (see Mattila 1981; Kumpula et al. 2013). This may be due to the fact that barren and xeric sites, especially if the soil is highly water permeable, are too poor and too dry for many vascular plants, and lichens can successfully compete with them (Cornelissen et al. 2001). For the same reason the lichen cover and biomass were higher on sites that were on sorted soils compared to those on moraine soils.
Regarding the condition of the reindeer pastures it is noteworthy that in addition to biomass, also lichen cover was multi-fold in the ungrazed sites compared to the cover in the grazed sites. In other words, lichens are not only getting smaller but also disappearing, which will further delay the recovery of the pastures. This can be considered as eating the capital of the reindeer herding. This is an alarming trend as global change or global greening has already been noticed to increase the amount of moist sites and at the expense of dry ones (Cornelissen et al. 2001; Mattila 2006a, 2010). This will further diminish the area that can be used for reindeer herding.
In conclusion, our results show that both reindeer grazing and forestry affect the cover and the estimated dry biomass of reindeer lichens. Reindeer herding has, however, much larger impact than forestry. The lichen cover was about five-fold and the dry biomass about fifteen-fold in the ungrazed (fenced) sites than in the grazed ones. The decrease of not only the dry biomass, but also the cover of lichens, is alarming.
Acknowledgements
The study was conducted in co-operation between Metsähallitus and the Finnish Forest Research Institute. We are grateful to these organizations and their personnel for technical and financial support. We also thank Forest Management Associations, Reindeer Herders Cooperatives and Forestry Centre of Lapland for cooperation. Jouko Kumpula deserves our special thanks for reading the manuscript and providing valuable comments and advice. Heikki Ahola, Juha Kemppainen, Matti Lappalainen, Ari Pasanen, Esko Piisilä, Jouni Puoskari, Jouni Väisänen and Pekka Välikangas collected the data, and Raija Vainio, Jouni Hyvärinen and Raimo Pikkupeura assisted with technical details. We owe them our gratitude for their valuable work. Comments by two anonymous reviewers helped to improve the paper.
References
Aagnes T., Sørmo W., Mathiesen S.D. (1995). Ruminal microbial digestion in free-living, in captive lichen-fed, and starved reindeer (Rangifer tarandus tarandus) in winter. Applied Environment Microbiology 61: 583–591.
Berg A., Östlund L., Moen J., Olofsson J. (2008). A century of logging and forestry in a reindeer herding area in northern Sweden. Forest Ecology and Management 256: 1009–1020. http://dx.doi.org/10.1016/j.foreco.2008.06.003.
Boudreault C., Zouaoui S., Drapeau P., Bergeron Y., Stevenson S. (2013). Canopy openings created by partial cutting increase growth rates and maintain the cover of three Cladonia species in the Canadian boreal forest. Forest Ecology and Management 304: 473–481. http://dx.doi.org/10.1016/j.foreco.2013.05.043.
Cajander A.K. (1913). Über Waldtypen. Acta Forestalia Fennica 1. 175 p. [In German].
Cornelissen J.H.C., Callaghan T.V., Alatalo J.M., Michelsen A., Graglia E., Hartley A.E., Hik D.S., Hobbie S.E., Press M.C., Robinson C.H., Henry G.H.R., Shaver G.R., Phoenix G.K., Gwynn Jones D., Johansson S., Chapin F.S. III, Molau U., Neill C., Lee J.A., Melillo J.M., Sveinbjönrsson B., Aerts R. (2001). Global change and arctic ecosystems: Is lichen decline a function of increases in vascular plan biomass? Journal of Ecology 89: 984–994. http://dx.doi.org/10.1111/j.1365-2745.2001.00625.x.
Dunn P. (2004). Occurrence and quantity of precipitation can be modeled simultaneously. International Journal of Climatology 24: 1231–1239. http://dx.doi.org/10.1002/joc.1063.
Dunn P., Smyth G.K. (2005). Series evaluation of Tweedie exponential dispersion model densities. Statistics and Computing 15(2005): 267–280. http://dx.doi.org/10.1007/s11222-005-4070-y.
Eskelinen A., Oksanen J. (2006). Changes in the abundance, composition and species richness of mountain vegetation in relation to summer grazing by reindeer. Journal of Vegetation Science 17: 245–254. http://dx.doi.org/10.1111/j.1654-1103.2006.tb02443.x.
Fox J. (2003). Effect displays in R for generalised linear models. Journal of Statistical Software 8(15): 1–27. http://www.jstatsoft.org/v08/i15/.
Hallikainen V., Helle T., Hyppönen M., Ikonen A., Jokinen M., Naskali A., Tuulentie S., Varmola M. (2008). Luonnon käyttöön perustuvat elinkeinot ja niiden väliset suhteet Ylä-Lapissa. Metsätieteen aikakauskirja 3/2008: 191–219. [In Finnish].
Helle T., Kojola I. (2004). Porokantojen vaihtelut Fennoskandiassa – selitykset ja niiden arviointi. Suomen Riista 50: 18–32. [In Finnish].
Helle T., Aspi J., Tarvainen L. (1983). Harmaaporonjäkälän ja mietoporonjäkälän kasvunopeus eri-ikäisissä metsissä. Rangifer 3(2): 2–5. [In Finnish].
Helle T., Aspi J., Kilpelä S.-S. (1990). The effects of stand characteristics on reindeer lichens and range used by semi-domesticated reindeer. Rangifer, Special Issue 3: 107–114.
den Herder M., Kytöviita M.-M., Niemelä P. (2003). Growth of reindeer lichens and effects of reindeer grazing on ground cover vegetation in a Scots pine forest and a subarctic heathland in Finnish Lapland. Ecography 26: 3–12. http://dx.doi.org/10.1034/j.1600-0587.2003.03211.x.
Jonsson Čabrajić A.A. (2009). Modelling lichen performance in relation to climate – scaling from thalli to landscapes. Doctoral thesis. Department of Ecology and Environmental Sciences, Umeå University. 38 p.
Jonsson Čabrajić A.A., Moen J., Palmquist K. (2010). Predicting growth of mat-forming lichens on a landscape scale – comparing models with different complexities. Ecography 33: 949–60. http://dx.doi.org/10.1111/j.1600-0587.2009.06079.x.
Kärenlampi L. (1973). Suomen poronhoitoalueen jäkälämaiden kunto, jäkälämäärät ja tuottoarviot vuonna 1972. Poromies 40(3): 15–19. [In Finnish].
Kautto A., Kärenlampi L., Nieminen M. (1986). Jäkäläisten talvilaidunten kunnon muutos Suomen poronhoitoalueella vuosina 1972–1983. Poromies 53(3): 28–34. [In Finnish].
Kivinen S., Moen J., Berg A., Eriksson Å. (2010). Effects of modern forest management on winter grazing resources for reindeer in Sweden. Ambio 39: 269–278. http://dx.doi.org/10.1007/s13280-010-0044-1.
Korhonen L., Korhonen K.T., Stenberg P., Maltamo M., Rautiainen M. (2007). Local models for forest canopy cover with beta regression. Silva Fennica 41(4): 671–685. http://dx.doi.org/10.14214/sf.275.
Köster E., Köster K., Aurela M., Laurila T., Berninger F., Lohila A., Pumpanen J. (2013). Impact of reindeer herding on vegetation biomass and soil carbon content: a case study from Sodankylä, Finland. Boreal Environment Research 18 (suppl. A): 35–42.
Kumpula J. (2001). Winter grazing of reindeer in woodland lichen pasture. Effect of lichen availability on the condition of reindeer. Small Ruminant Research 39(2001): 121–130. http://dx.doi.org/10.1016/S0921-4488(00)00179-6.
Kumpula J., Colpaert A., Nieminen M. (2000). Condition, potential recovery rate and productivity of lichen (Cladina spp.) ranges in the Finnish reindeer management area. Arctic 53(2): 152–160. http://dx.doi.org/10.14430/arctic845.
Kumpula J., Colpaert A., Tanskanen A., Anttonen M., Törmänen H., Siitari J. (2006). Developing reindeer pasture inventory – pasture inventory in the reindeer herding districts in Middle-Lapland during 2005–2006. Kala- ja riistaraportteja 397. 42 p. [In Finnish with English abstract].
Kumpula J., Tanskanen A., Colpaert A., Anttonen M., Törmänen H., Siitari J., Siitari S. (2009). Winter pastures in the northern part of the reindeer management area in Finland during 2005–2008 – changes in the state of pastures after the mid-1990s. Riista ja kalatalous – Tutkimuksia 3/2009. 48 p. [In Finnish with English abstract].
Kumpula J., Kurkilahti M., Helle T., Colpaert A. (2013). Both reindeer management and several other land use factors explain the reduction in ground lichens (Cladonia spp.) in pastures grazed by semi-domesticated reindeer in Finland. Regional Environmental Change. http://dx.doi.org/10.1007/s10113-013-0508-5.
Kyllönen S., Colpaert A., Heikkinen H., Jokinen M., Kumpula J., Marttunen M., Muje K., Raitio K. (2006). Conflict management as a means to the sustainable use of natural resources. Silva Fennica 40(4): 687–728.
Lenth R.V. (2013). lsmeans: least-squares means. R package version 1.06–05. http://CRAN.R-project.org/package=lsmean.
Matila A., Kubin E. (1998). Palleroporonjäkälä (Cladonia stellaris) keruutuotteena ja siihen vaikuttavat puustotekijät. Metsätieteen aikakauskirja – Folia Forestalia 4/1998: 531–542. [In Finnish].
Mattila E. (1981). Survey of reindeer winter ranges as a part of the Finnish National Forest Inventory in 1976–1978. Communicationes Instituti Forestalis Fenniae 99(6). 74 p.
Mattila E. (1988). Suomen poronhoitoalueen talvilaitumet. Folia Forestalia 713. 53 p. [In Finnish].
Mattila E. (1996). Porojen talvilaitumet Suomen poronhoitoalueen etelä- ja keskiosissa 1990-luvun alussa. Folia Forestalia – Metsätieteen aikakauskirja 1996(4): 337–357. [In Finnish].
Mattila E. (1997). Poronhoitoalueen etelä- ja keskiosien talvilaiduntunnukset metsäositteissa puuston ikäluokittain 1980-luvun alussa. Metsätieteen aikakauskirja – Folia Forestalia 1997(2): 201–223. [In Finnish].
Mattila E. (2004). Porojen eräiden ravintokasvien esiintyminen poronhoitoalueella Kainuun merkkipiirissä ja poronhoitoalueen ulkopuolisella alueella Kainuussa 2002–2003 – vertaileva tutkimus aluetasolla. Metsäntutkimuslaitoksen tiedonantoja 930. 42 p. [In Finnish].
Mattila E. (2006a). Porojen talvilaitumien kunto poronhoitoalueen etelä- ja keskiosien merkkipiireissä 2002–2004 ja kehitys 1970-luvun puolivälistä alkaen. Metlan työraportteja / Working Papers of the Finnish Forest Research Institute 27. 76 p. [In Finnish].
Mattila E. (2006b). Porojen talvilaitumien kunto Ylä-Lapin paliskunnissa vuonna 2004. Metlan työraportteja / Working Papers of the Finnish Forest Research Institute 28. 54 p. [In Finnish].
Mattila E. (2010). Porojen laitumia koskevia pinta-alatuloksia poronhoitoalueen etelä- ja keskiosista laskettuna valtakunnan metsien 10. inventoinnin maastoaineistosta vuosilta 2005–2008. Working Papers of the Finnish Forest Research Institute 164. 69 p. [In Finnish].
Mattila E. (2012). Porojen laitumia koskevia arviointituloksia 1970-luvulta alkaen. Neljä laidunarviointia valtakunnan metsien inventoinnin yhteydessä vuosina 1976–2004. Metlan työraportteja / Working Papers of the Finnish Forest Research Institute 238. 100 p. [In Finnish].
Mattila E. (2014). Ylä-Lapin talvilaidunarvioinnin tuloksia. Uusimmat arviot vuodelta 2012 ja vastaavia tuloksia vuodelta 2004. Metlan työraportteja / Working Papers of the Finnish Forest Research Institute 282. 55 p. [In Finnish].
Mattila E., Helle T. (1978). Inventory of winter ranges of semi-domestic reindeer in Finnish Central Lapland. Folia Forestalia 358. 31 p. [In Finnish with English abstract].
Miina J., Hotanen J.P., Salo K. (2009). Modelling the abundance and temporal variation in the production of bilberry (Vaccinium myrtillus L.) in Finnish mineral soil forests. Silva Fennica 43(4): 577–593. http://dx.doi.org/10.14214/sf.181.
Mustajoki J., Saarikoski H., Marttunen M., Ahtikoski A., Hallikainen V., Helle T., Hyppönen M., Jokinen M., Naskali A., Tuulentie S., Varmola M., Vatanen E., Ylisirniö A.-L. (2011). Use of decision analysis interviews to support the sustainable use of the forests in Finnish Upper Lapland. Journal of Environmental Management 92(2011): 1550–1563. http://dx.doi.org/10.1016/j.jenvman.2011.01.007.
Ojansuu R., Henttonen H. (1983). Estimation of local values of monthly mean temperature, effective temperature sum and precipitation sum from the measurement made by the Finnish Meteorological Office. Silva Fennica 17(2): 143–160. [In Finnish with English summary].
Olofsson J., Moen J., Östlund L. (2010). Effects of reindeer on boreal forest floor vegetation: Does grazing cause vegetation state transitions? Basic and Applied Ecology 11(2010): 550–557. http://dx.doi.org/10.1016/j.baae.2010.03.004.
Pinheiro J.C., Bates D.M. (2000). Mixed-effects models in S and S-plus. In: Chambers J., Eddy W., Härdle W., Sheather S., Tierney L. (eds.). Statistics and computing. Springer. 528 p. http://dx.doi.org/10.1007/978-1-4419-0318-1.
Roturier S. (2009). Managing reindeer lichen during forest regeneration procedures: linking Sámi herders’ knowledge and forestry. Acta Universitatis Agriculturae Sueciae 2009/84. 71 p.
Roturier S., Bergsten U. (2006). Influence of soil scarification on reindeer foraging and damage to planted Pinus sylvestris seedlings. Scandinavian Journal of Forest Research 21: 209–220. http://dx.doi.org/10.1080/02827580600759441.
Roturier S., Roué M. (2009). Of forest, snow and lichen: Sámi reindeer herders’ knowledge of winter pastures in northern Sweden. Forest Ecology and Management 258(2009): 1960–1967. http://dx.doi.org/10.1016/j.foreco.2009.07.045.
Russell D.E., Martell A.M. (1984). Winter range ecology of caribou (Rangifer tarandus). In: Olson R., Hastings R., Geddes F. (eds.). Northern ecology and resource management. Memorial essays honouring Don Gill. The University of Alberta Press. p. 117–144.
Rytkönen A.M., Saarikoski H., Kumpula J., Hyppönen M., Hallikainen V. (2013). Interactions between forestry and reindeer husbandry in Upper Lapland – synthesis of research data. Riista- ja kalatalous. Tutkimuksia ja selvityksiä 6. 39 p. [In Finnish with English abstract].
Sarkar D. (2008). Lattice: multivariate data visualization with R. Springer, New York. ISBN 978-0-387-75968-5.
Skarin A., Danell Ö., Bergström R., Moen J. (2008). Summer habitat preferences of GPS-collared reindeer Rangifer tarandus tarandus. Wildlife Biology 14: 1–15. http://dx.doi.org/10.2981/0909-6396(2008)14[1:SHPOGR]2.0.CO;2.
Smyth G.K., Jørgensen B. (2002). Fitting Tweedie’s compound Poisson model to insurance claims on decomposition, mineralization and soil biota in a dry oligotrophic Scots pine forest. Oikos 90(2): 301–310.
Suominen O., Olofsson J. (2000). Impacts of semi-domesticated reindeer on structure of tundra and forest communities in Fennoscandia: a review. Annales Zoologici Fennici 37(4): 233–249.
Susiluoto S., Rasilo T., Pumpanen J., Berninger F. (2008). Effects of grazing on the vegetation structure and carbon dioxide exchange of a Fennoscandian fell ecosystem. Arctic, Antarctic, and Alpine Research 40(2): 422–431. http://dx.doi.org/10.1657/1523-0430(07-035)[SUSILUOTO]2.0.CO;2.
Valtakunnan metsien 11. inventointi (VMI11). (2009). Maastotyön ohjeet 2009. Koko Suomi. Metsäntutkimuslaitos. 182 p. [In Finnish].
Väre H., Ohtonen R., Oksanen J. (1995). Effects of reindeer grazing on understorey vegetation in dry Pinus sylvestris forests. Journal of Vegetation Science 6(4): 523–530. http://dx.doi.org/10.2307/3236351.
Väre H., Ohtonen R., Mikkola K. (1996). The effect and extent of heavy grazing by reindeer in oligotrophic pine heaths in northeastern Fennoscandia. Ecography 19: 245–253. http://dx.doi.org/10.1111/j.1600-0587.1996.tb00233.x.
Venables W.N., Ripley B.D. (2002). Modern applied statistics with S. Fourth edition. Springer, New York. ISBN 0-387-95457-0. http://dx.doi.org/10.1007/978-0-387-21706-2.
Ylitalo E. (ed.). (2013). Stand development classes on forest land available for wood production. Finnish Statistical Yearbook of Forestry 2013. 450 p.
Zhang W. (2012). cplm: compound Poisson linear models. R package version 0.6-4. http://CRAN.R-project.org/package=cplm.
Total of 61 references
