Mikko Moilanen  ,
Jyrki Hytönen,
Hannu Hökkä,
Anssi Ahtikoski
,
Jyrki Hytönen,
Hannu Hökkä,
Anssi Ahtikoski
Fertilization increased growth of Scots pine and financial performance of forest management in a drained peatland in Finland
Moilanen M., Hytönen J., Hökkä H., Ahtikoski A. (2015). Fertilization increased growth of Scots pine and financial performance of forest management in a drained peatland in Finland. Silva Fennica vol. 49 no. 3 article id 1301. https://doi.org/10.14214/sf.1301
Highlights
- All fertilizers containing phosphorus and potassium improved the P and K status and the stem growth of Scots pine still 26 years from application
- Wood ash, containing more nutrients than other fertilizers, gave the strongest stand growth response and the highest net present value
- Ash fertilizer treatment outperformed other fertilizer treatments and control in net present value, regardless of the applied discount rate, 3%, 4% or 5%.
Abstract
The long-term effects of fertilization on the needle nutrient concentrations, growth and financial performance of a Scots pine (Pinus sylvestris L.) stand was examined in a thick-peated drained peatland forest located in Central Finland. At the trial establishment in 1985, the trees were suffering from P and K deficiencies, but their N status was good. The fertilizer treatments were Control, PK (rock phosphate + potassium chloride), ApaBio (apatite phosphorus + biotite) and wood ash, applied both with and without N and replicated six times. All treatments containing phosphorus and potassium increased foliar P and K concentrations above the deficiency limits up to the end of the study period of 26 years. The effect of the fertilization on stand volume growth of Scots pine was strong and continued still at the end of the study period. The trees on ApaBio and PK plots grew nearly two-fold and those on Ash plots over two-fold compared with the control plots. In a thinning made at the end of the study period the total logging removal on fertilized plots was 1.5–2.2 times greater and included more saw logs than on the control plots. Ash fertilizer treatment outperformed other fertilizer treatments as well as the control. With a 5% discounted equivalent annual income (EAI) of Ash fertilizer treatment was statistically significantly (p=0.009) almost three times higher than that of control. As a conclusion, fertilization (either using PK fertilizers or Ash) in N-rich drained peatlands is a financially feasible method of management.
Keywords
Pinus sylvestris;
stand growth;
peatlands;
needle nutrients;
P deficiency;
K deficiency
-
Moilanen,
Natural Resources Institute Finland, Natural resources and bioproduction, Paavo Havaksen tie 3, FI-90014 Oulu, Finland
E-mail
mikko.moilanen@luke.fi
- Hytönen, Natural Resources Institute Finland, Natural resources and bioproduction, Silmäjärventie 2, FI-69100 Kannus, Finland E-mail jyrki.hytonen@luke.fi
- Hökkä, Natural Resources Institute Finland, Natural resources and bioproduction, Eteläranta 55, FI-96301 Rovaniemi, Finland E-mail hannu.hokka@luke.fi
- Ahtikoski, Natural Resources Institute Finland, Natural resources and bioproduction, Paavo Havaksen tie 3, FI-90014 Oulu, Finland E-mail anssi.ahtikoski@luke.fi
Received 15 January 2015 Accepted 13 May 2015 Published 4 June 2015
Views 221272
Available at https://doi.org/10.14214/sf.1301 | Download PDF

1 Introduction
The nutrient contents of peatlands vary considerably between and within site types (Westman and Laiho 2003; Rydin and Jeglum 2006; Laiho et al. 2008). In contrast to upland forest soils in the Boreal zone of Finland, the peat in mires contains an abundance of nitrogen (N), but a lower amount of other nutrients such as potassium (K) and boron (B) (Laiho and Laine 1994; Laiho and Alm 2005). Furthermore, the mineralization of organic phosphorus (P) is often slower than the trees would require, due to which P deficiencies are common on peatlands (e.g. Moilanen et al. 2010).
N content is naturally high in well-humified peat, and thus abundantly available for trees in such sites. In Finland, the largest changes in timber production, as a result of peatland drainage, have been observed in these N-rich sites, which in their natural state have been treeless or sparsely forested fens or composite mire types (Hökkä and Ojansuu 2004).
The main limiting factors for tree growth on drained peatlands are the low availability of usable P, as well as the scarcity of potassium (K), and in some cases also of boron (B) (Kaunisto and Tukeva 1984; Moilanen et al. 2010). Problems for tree growth are caused by the shortage of those nutrients and the imbalance with the abundant N (Kaunisto and Tukeva 1984; Moilanen 1993; Silfverberg and Moilanen 2008; Moilanen et al. 2010). Especially the importance of K is pronounced because K bound in the tree stand may even exceed the amount of K in a 20 cm surface layer of peat (Kaunisto and Paavilainen 1988; Laiho and Laine 1995; Kaunisto and Moilanen 1998). For sustainable tree growth the need for fertilization is particularly high in originally sparsely forested sites (Silfverberg and Moilanen 2008; Silfverberg et al. 2011) which have transformed into Vaccinium vitis-idaea or Vaccinium myrtillus drained peatland types (PtkgII or MtkgII; for classification see Vasander and Laine 2008).
Deficiency of nutrients is a common practical problem in drained peatlands in Finland. In the study of Moilanen et al. (2010), every second experimental stand growing on drained peatland was suffering from a P shortage, every third stand from a N shortage, and every fourth stand from a severe K shortage; imbalances in the N:P and N:K ratios were most common in deep-peated and N-rich sites. It has been estimated (Keltikangas et al. 1986; Kaunisto 1997) that of the total 5 mill. ha of drained and forested peatland area in Finland (Hökkä et al. 2002), one fifth (i.e., 1–2 million ha) is suffering from P and K deficiencies of varying severity. Nutrient deficiencies may be so severe that fertilization is necessary to sustain tree growth until the end of rotation (e.g. Moilanen 1993; Moilanen et al. 2002; Silfverberg et al. 2011). To compensate for the deficiency problem, approximately one third of peatland forests have been fertilized with PK or NPK fertilizers in Finland during the last 60 years. Today, more than 40 000 hectares of forest are fertilized annually (Peltola 2014) and the share of peatland forest is estimated to be half of this (i.e. over 20 000 ha).
The effects of fertilization have been shown to vary depending on the site type, peat thickness, and the nutrient status of the stand at the time of fertilization, and the dosage of the applied fertilizers (Moilanen 1993; Moilanen and Hökkä 2009; Hökkä et al. 2012). PK fertilization in N-rich sites results – depending on the temperature region – in a volume growth increase of 1–3 m3 ha–1 a–1 for at least 30–40 years, whereas NPK fertilization in nitrogen-poor sites gives a modest response (0.5–1.0 m3 ha–1 a–1) for a shorter 10-year period (Hökkä et al. 2012). The effect of fertilizer P is visible in needle P concentrations of Scots pine (Pinus sylvestris L.) for at least 25–30 years, while the effect of K fertilizer is visible for 15–20 years (Silfverberg and Moilanen 2008).
Because wood ash contains considerable amounts of P, K, Ca, and Mg it has proved to be a good alternative to PK fertilizers on drained peatlands (Moilanen et al. 2002, 2004; Sikström et al. 2010; Moilanen et al. 2013). The long-lasting positive effects of wood ash on the nutrient status and growth of conifers have been reported in several studies, mostly carried out at N-rich site types (e.g. Silfverberg and Huikari 1985; Moilanen et al. 2002). Due to its liming effect, ash application increases soil pH and microbial activity and, eventually, availability of nutrients (Moilanen et al. 2002). Also the stand growth response to ash appears to be even more long-lasting than that achieved with other fertilizers used in peatland forestry (Moilanen et al. 2004).
The majority of previous fertilization studies only examine the foliar responses or magnitude of the growth response gained with fertilization, but only a few case studies (e.g. Lauhanen et al. 1997; Ahtikoski et al. 2008) have determined how much of this growth increase is harvestable in the next thinning, which is important when assessing the financial performance of the fertilization. This may be due to the lack of proper data because the fertilization effect on peatlands is longer than previously anticipated. Also the nutrient status and stand growth response to fertilization can vary considerably even within the same peatland forest type (Moilanen and Hökkä 2009). However, this variation can be utilized by incorporating fluctuation into financial assessment in a form of, e.g., confidence intervals (and further probability distribution), thus providing a tool to add risk elements (cf. Ahtikoski et al. 2010) into the analysis.
The aims of this study were to quantify the long-term effects of different commercial fertilizers on the needle element concentrations, volume growth and harvestable yield of a nutrient-deficient young Scots pine stand growing on a thick-peated N-rich drained pine fen and to determine the financial performance for each of the different fertilizers. Technically, we assessed the long-term financial performance of fertilization by calculating the equivalent annual income, EAI (e.g. Hseu and Buongiorno 1997; Raunikar et al. 2000). In brief, the EAI would yield the same net present value, NPV over t years (Duerr 1960), and it allows comparison of plots measured over different time intervals, and with different stockings.
2 Material and methods
2.1 Study site and experimental design
The study stand (9.6 ha) is located in the northern boreal coniferous zone on a drained peatland in the Siikajoki commune, Central Finland (64°41´N, 25°07´E), nearby Oulu city. The altitude was 60 m above sea level, and the annual temperature sum 1107 day-degree units (d.d., reference period 1980–2007, threshold value 5 °C) (Venäläinen et al. 2005). The mean annual temperature in the area is 2.3 °C and the mean annual precipitation 498 mm. The area was drained for forestry initially by ditch plough in 1924–1934, and complementary ditching with a tractor excavator was carried out in 1981–1982, using 25–40 m ditch spacing.
The site was thick-peated (peat thickness > 100 cm) and in its pristine state represented a “tall-sedge pine fen” (see Laine and Vasander 1996), classified as a medium productive site (Vaccinium vitis-idaea Ptkg II; see Vasander and Laine 2008). This site type represents the single most common drained forest site type in Finland (Keltikangas et al. 1986) and thus is suitable for studying the responses gained with today’s recommended dozes and fertilizers in typical conditions.
For determining the site fertility, peat samples were taken and analyzed from unfertilized plots in October 2001. In each plot, the samples were taken with a polyhedral steel corer (inner diameters 4.9 cm * 5.3 cm) at 8 sub-sampling points, which were distributed uniformly over the plot, excluding a 7.5-meter wide edge area. The sub-samples were pooled to give one composite sample per plot. The living vegetation and litter horizon on the top of the peat cores were discarded from the analyses. In the topmost 10 cm peat layer the total N concentration varied between 1.9–2.1%, and in the deeper layers (10–20 cm, 20–30 cm and 30–40 cm) between 2.6–2.8%, determined from the dry matter of the surface peat (Kjeldahl-method, see Halonen et al. 1983).
Before drainage the site was sparsely forested and in some parts almost treeless. Scots pine was the dominant tree species accompanied by naturally established downy birch (Betula pubescens Ehrh.) (< 20% of stand volume), and a few Norway spruces (Picea abies L. Karst). At the time of the experiment establishment in 1985 the dominant height of the pole stage stand (age 30–50 years) varied between 6–7 m, density between 1000–1300 stems per hectare and stand volume between 25–30 m3 ha–1. The only prior stand treatment had been a light thinning in 1981 before the experiment was established. According to visual observation of the stand, the Scots pine trees were suffering from P and K deficiencies before the experiment establishment (for symptoms, see Reinikainen at al. 1998). On the control plots, nutrient deficiencies were observed in the foliage throughout the study period.
Altogether 42 plots sized 0.1–0.2 ha were set up in spring 1985. The experimental lay-out followed the randomized block design with six replicates. The plots were treated with five different fertilizers as summarized in Table 1. The following products – also available nowadays in Finland for fertilizing drained peatland forests – were used as fertilizers: apatite, biotite, PK-fertilizer, wood ash, and ammonium nitrate. The doses in a single treatment were 110 kg ha–1 for N, from 54 to 135 kg ha–1 for P, from 102 to 225 kg ha–1 for K and 1.8 kg ha–1 for B. According to the present fertilization guidelines for practical peatland forestry, the amounts of P and K should be between 40–50 kg ha–1 and 90–110 kg ha–1, respectively. In this experiment, P and K dosages were remarkably greater, especially with the Ash treatment.
| Table 1. Fertilizer treatments and amounts of nutrients (kg ha-1) added in different treatments in the study area. | ||||||
| Nutrient | ||||||
| Treatment 1) | N | P | K | Ca | Mg | B |
| Cont | 0 | 0 | 0 | 0 | 0 | 0 |
| PK | 0 | 54 | 102 | 156 | 3 | 1.8 |
| PK+N | 110 | 54 | 102 | 172 | 6 | 1.8 |
| ApaBio | 0 | 79 | 102 | 270 | 123 | 0 |
| ApaBio+N | 110 | 79 | 102 | 286 | 126 | 0 |
| Ash | 0 | 135 | 225 | 1440 | 225 | 1.8 |
| Ash+N | 110 | 135 | 225 | 1456 | 228 | 1.8 |
| 1) PK = PK for peatlands 600 kg ha-1, (9% P, 17% K, 0.3% B); Apa =Apatite (Ca5(PO4)3(OH,F,Cl)) 385 kg ha-1, (16% P, 35% Ca, 1% Mg); Bio = Biotite (K(Fe, Mg)3AlSi3O10(F, OH)2) 1700 kg ha-1, (1% P, 6% K, 8% Ca, 7% Mg); Ash = Wood ash 4500 kg ha-1, dust-like wood ash from a heating plant in Oulu city, (3% P, 5% K, 32% Ca, 5% Mg, 0.04% B); N = Ammonium nitrate with lime 400 kg ha-1, (13% NH4-N, 13% NO3-N). | ||||||
2.2 Needle samples and analyses
Scots pine needle samples were collected from all sample plots in March 1985 (before the fertilization), in March 1994, in March 1999 and in March 2011 (i.e., 0, 9, 14 and 26 years after the fertilization treatments). Current needles were sampled with a branch cutter from 8 dominant sample trees (1–2 tips from lateral branches) per each plot from the sun-exposed upper whorls of tree crowns. Sample trees were selected from the trees standing in the plot area. The needles were dried for 48 hours at +65 °C and were analyzed after hydrochloric acid (HCL) digestion for total N concentration (the Kjeldahl method), K, Ca and Mg concentrations (atomic absorption spectrophotometer, AAS), B concentration (the azomethine-H method) and P concentration (the vanado-molybdate method) (Halonen et al. 1983).
Interpreting the needle analyses was based on the results obtained in previous research concerning the critical values, deficiency limits and optimal concentrations of different nutrients in the needles of Scots pine on drained peatlands in Finland (Paarlahti et al. 1971; Reinikainen et al. 1998):
Nutrient Poor Adequate Optimal
N, g kg–1 < 12 12 – 13 13 – 18
P, g kg–1 < 1.3 1.3 – 1.6 1.6 – 2.2
K, g kg–1 < 4.0 4.0 – 4.5 4.5 – 5.5
B, mg kg–1 < 5 5 – 10 10 – 30
In addition to needle nutrient concentrations, we examined the changes in the N:P and N:K ratios over time and between treatments. The optimal N:K ratio in Scots pine needles is considered to be 100:30–35 and the optimal N:P ratio about 100:10 (e.g. Puustjärvi 1962a,b; Ingestad 1979; Brække 1994; Brække and Salih 2002). These ratios were used as reference values when assessing the nutrient statuses and changes in them.
2.3 Tree growth assessments
The stand measurements were carried out in 2010, when 26 growing seasons had elapsed since the fertilization application. In the measurement areas (with a 7.5 m wide buffer zone), all the trees (114–294 per plot) were counted by species and breast-height (1.3 m) diameter classes (cm, minimum diameter class 6 cm). At each plot, the heights (dm) and diameters at breast height (d1.3, mm) were measured from 15–22 randomly chosen (every ith tree from tree list) sample trees of Scots pine, representing different size classes and different growing locations with respect to the distance to the ditches. The total heights of the sample trees were measured using a hypsometer to an accuracy of 1 dm. The height increments of the sample trees were measured over five-year periods prior to and after the fertilizer application using special binoculars supplied with a measuring scale. Increment cores were extracted at breast height from each sample tree to determine the development of annual radial growth microscopically, covering three pre-fertilization years and 26 post-fertilization years with the accuracy of 0.01 mm.
After the tree measurements the stand was thinned in winter 2011, following the guidelines for the management in practical forestry (Hyvän metsänhoidon … 2007). Only stemwood (logs and pulpwood) was harvested and logging residues (branches and tree tops) were left on the site. The cutting was performed with harvesting machines and the wood transported with forwarders. The remaining stand was measured after harvesting to determine the logging removal at each plot and treatment. The post-logging tree measurements were done with the same methods as before harvesting.
The stand characteristics were calculated using the KPL programme (Heinonen 1994), in which tree-level functions developed by Laasasenaho (1982) based on breast height diameter and height were used for calculating the volume of the sample trees. The standing volume stock (m3 ha–1) and the annual volume increment (m3 ha–1 a–1) was estimated for the period 1982–2010 on the basis of diameter and height measurements and increment cores taken from the sample trees.
2.4 Statistical analyses
Statistical significance of differences in needle parameters (concentrations and ratios) among treatments during the study period and tree stand characteristics at the end of the 26-year study period (total stand growth during the study period, harvest removal and retained stand volume after thinning) was tested using analysis of variance (one-way ANOVA). Mean volume growth of the trees during the 3-year period before the treatments was tested as a covariate for total stand growth to remove the effects of possible differences in stand pre-treatment growth rate. Bonferroni’s test was used in post hoc pairwise multiple comparisons. Annual growth variation over the study period was analysed graphically.
For the foliar nutrient and stand growth data, time, and treatment-by-time interaction effects were tested using the repeated measures ANOVA. In the analysis, foliar nutrient concentrations were tested at the three sampling dates (1985, 1999, 2011) after the fertilization. Differences in periodic stand growth (four 5-year periods and one 6-year period after application) between the measurement dates were used as the response variable in the growth analysis. In both repeated ANOVA models the exact Greenhouse-Geisser F-test was used when evaluating the significance of the effects. In all statistical tests the level of significance was set at p < 0.05. Tests were computed using the PASW Statistics 17.0 package (SPSS Statistics Base 17.0 User’s Guide).
2.5 Financial analyses
In this study we focused on the long-term financial performance of fertilization. The financial performance was determined by assessing the equivalent annual income, EAI (Raunikar et al. 2000). To assess the long-term effects of fertilization on financial performance, we first determined the net present value, NPV:
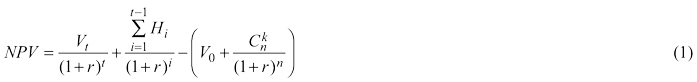
where NPV = net present value of a plot, € ha–1
Vt = the commercial value of growing stock after thinning at year t, € ha–1
Hi = the value of thinning at year i, €/ha
V0 = the commercial value of growing stock at the beginning (year t0), € ha–1
Cnk = cost of fertilizer treatment k at year n, € ha–1 (for control plots Ck = 0)
r = interest rate, here 3%, 4% or 5%
Note that n < i for all plots
In this study the NPV was expressed by equivalent annual income EAI, the constant annual income that would yield identical NPV over t years:

where EAI = equivalent annual income, € ha–1year–1.
The EAI can be interpreted as the annual rent earned by the land between the beginning of the trial, t0 and right after the thinning at year t. The financial objective is, of course, to make this rent as high as possible (Raunikar et al. 2000).
We assessed the financial performance according to Eq. 2 at constant stumpage prices and fertilization costs. The stumpage prices reflect the average of monthly prices (from January to October) in calendar year 2014 for Kainuu–Pohjanmaa region in Finland (Metinfo database 2014) and the fertilization costs are prevailing retail prices provided by a fertilizer company (which holds a relevant market share in Finland). The stumpage prices are: 52.8 € m–3 for Scots pine sawlogs and 16.09 € m–3 for pine pulpwood. The fertilization costs associated with different fertilizer treatments are: PK 502 € ha–1, PK+N 735 € ha–1. ApaBio 325 € ha–1, ApaBio +N 558 € ha–1, Ash 675 € ha–1 and Ash + N 908 € ha–1 (for further details on nutrient compositions and doses, see Table 1). All fertilization costs are based on the assumption that the treatments are executed by airplane spreading.
3 Results
3.1 Needle nutrient concentrations and ratios
In unfertilized control plots, the needle N concentration varied from 13.2 to 15.2 g kg–1, P concentration from 1.18 to 1.36 g kg–1 and K concentration from 3.00 to 3.19 g kg–1, depending on the sampling year (Table 2). During the study period of 26 years, N concentration increased and K concentration decreased, thus resulting in a significantly higher N:K ratio towards the end of the study period in control plots (Table 3). Needle P concentration seemed to have slightly increased with time, and there was no clear changes in foliar N:P ratios in control plots. The changes in the concentrations of other main and micro nutrients remained moderate among treatments or within time (Table 2).
| Table 2. Mean foliar nutrient concentrations before and 9, 14 and 26 years after the fertilization treatments. Statistically different means are marked with different letters (Bonferroni test, p-value < 0.05). See Table 1 for the information of treatments. Means below critical levels (deficiency limit) for N (12 g kg–1), P (1.3 g kg–1), K (4.0 g kg–1) (see Paarlahti et al., 1971, Reinikainen et al., 1998) are marked with bold letters. | |||||||||
| Years after fertilization | |||||||||
| 0 | 9 | 14 | 26 | ||||||
| Nutrient | Treatment | Mean | S.E. | Mean | S.E. | Mean | S.E. | Mean | S.E. |
| N, g kg–1 | Cont | 13.2 | 0.7 | 13.6 | 0.7 | 14.5 | 0.4 | 15.2 | 0.5 |
| PK | 13.1 | 0.7 | 14.1 | 0.5 | 13.9 | 0.2 | 15.5 | 0.4 | |
| ApaBio | 12.8 | 0.2 | 13.5 | 0.3 | 14.0 | 0.3 | 15.9 | 0.6 | |
| Ash | 12.5 | 0.7 | 14.0 | 0.2 | 14.4 | 0.4 | 15.3 | 0.5 | |
| P, g kg–1 | Cont | 1.18 | 0.04 | 1.23a | 0.04 | 1.36a | 0.08 | 1.24a | 0.05 |
| PK | 1.14 | 0.04 | 1.64b | 0.04 | 1.59b | 0.04 | 1.41ab | 0.02 | |
| ApaBio | 1.24 | 0.07 | 1.55b | 0.03 | 1.58b | 0.04 | 1.47b | 0.06 | |
| Ash | 1.12 | 0.05 | 1.57b | 0.03 | 1.61b | 0.01 | 1.36ab | 0.05 | |
| K, g kg–1 | Cont | 3.19 | 0.11 | 3.01a | 0.06 | 3.10a | 0.06 | 3.00a | 0.08 |
| PK | 3.26 | 0.01 | 4.34b | 0.23 | 3.99b | 0.14 | 3.70b | 0.10 | |
| ApaBio | 3.11 | 0.05 | 3.86b | 0.17 | 3.77b | 0.16 | 3.56ab | 0.17 | |
| Ash | 2.96 | 0.21 | 4.23b | 0.12 | 4.26b | 0,17 | 4.05b | 0.14 | |
| Ca, g kg–1 | Cont | 2.01 | 0.12 | 2.03 | 0.16 | 1.68 | 0.10 | 2.21 | 0.12 |
| PK | 1.96 | 0.09 | 2.11 | 0.16 | 1.73 | 0.08 | 1.94 | 0.11 | |
| ApaBio | 1.97 | 0.21 | 2.06 | 0.11 | 1.63 | 0.10 | 1.99 | 0.10 | |
| Ash | 2.03 | 0.16 | 2.08 | 0.08 | 1.74 | 0.07 | 2.15 | 0.13 | |
| Mg, g kg–1 | Cont | 1.37 | 0.05 | 1.31a | 0.04 | 1.42 | 0.04 | 1.29 | 0.03 |
| PK | 1.36 | 0.03 | 1.01b | 0.04 | 1.36 | 0.04 | 1.24 | 0.06 | |
| ApaBio | 1.37 | 0.07 | 1.17a | 0.04 | 1.35 | 0.05 | 1.23 | 0.05 | |
| Ash | 1.32 | 0.07 | 1.01b | 0.03 | 1.25 | 0.04 | 1.16 | 0.04 | |
| B, mg kg–1 | Cont | 45 | 4.1 | 26 | 0.8 | 21 | 1.1 | 22 | 1.0 |
| PK | 42 | 5.1 | 27 | 0.9 | 23 | 1.0 | 23 | 1.0 | |
| ApaBio | 46 | 9.2 | 23 | 0.8 | 20 | 07 | 22 | 0.9 | |
| Ash | 41 | 3.3 | 27 | 0.8 | 24 | 1.1 | 24 | 1.3 | |
During the first 9-year period after the application, PK, ApaBio and Ash treatments significantly increased foliar P and K concentrations (Table 2). The foliar response to the treatments continued to be significant until the end of the study period, even though slightly weakened, especially on PK and ApaBio plots. ApaBio treatment increased the foliar K concentration less than the other treatments. After 26 years from application, the foliar P and K concentrations on fertilized plots were still above the deficiency limits. Moreover, the fertilization treatments decreased the N:K ratio (Table 3). N fertilizer had no effect on foliar nutrient concentrations (data not shown). The temporal variation and treatment-by-time-interaction in the P and K concentrations was significant according to Greenhouse-Geisser F-test (Table 4).
| Table 3. The ratios of N:P and N:K in Scots pine needles by treatments during the study period of 26 years. See Table 1 for the information of treatments. Optimal values for N:P = 10–11, and for N:K = 3–4 (e.g. Puustjärvi 1962a,b; Ingestad 1979). Statistically different means between treatments are marked with different letters (Bonferroni test, p-value < 0.05). | ||||
| N:P ratio | ||||
| Years from fertilization | ||||
| Treatment | 0 | 9 | 14 | 26 |
| Cont | 11.4 | 11.2 a | 10.9 a | 12.5 |
| PK | 11.6 | 8.7 b | 8.8 b | 11.0 |
| ApaBio | 10.3 | 8.7 b | 8.9 b | 10.9 |
| Ash | 10.8 | 8.9 b | 9.0 b | 11.4 |
| N:K ratio | ||||
| Years from fertilization | ||||
| 0 | 9 | 14 | 26 | |
| Cont | 4.1 | 4.5 a | 4.7 a | 5.1 a |
| PK | 4.0 | 3.3 b | 3.5 b | 4.2 ab |
| ApaBio | 4.1 | 3.5 b | 3.8 b | 4.5 ab |
| Ash | 4.3 | 3.3 b | 3.4 b | 3.8 b |
| Table 4. Results of Greenhouse-Geisser tests in repeated measures ANOVA. Df-values, F values, and adjusted p-values for the time factor and the interaction of fertilization treatment and time. The response variables are the foliar N, P and K concentations and periodic (5 year) stand growth. | ||||
| Variable | Effect | df | F | p |
| N | Time | 1.61 | 100.2 | <0.001 |
| Time* treatment | 9.63 | 1.28 | 0.267 | |
| P | Time | 1.70 | 169.5 | <0.001 |
| Time* treatment | 10.2 | 2.15 | 0.033 | |
| K | Time | 1.90 | 91.8 | <0.001 |
| Time* treatment | 11.39 | 5.93 | <0.001 | |
| Stand growth | Time | 2.10 | 60.37 | <0.001 |
| Time* treatment | 12.58 | 4.80 | <0.001 | |
3.2 Tree growth
All the fertilizers including nutrients P and K increased the stand volume growth remarkably (Fig. 1). The fertilization effect appeared from the second (PK), from the third (Ash) or from the fourth (ApaBio) growing season after application. Thereafter, the fertilizer-induced effect gradually strengthened and reached its maximum when 20 years had elapsed since application. During the study period, the trees on control plots increased their volume growth (m3 ha–1 a–1) 1.5-fold, while the corresponding changes in PK, ApaBio and Ash treatments were 3.4, 3.9 and 5.2, respectively. All three treatments increased the total stand growth significantly during the study period. According to one-way covariance analysis the magnitude of the growth increase depended on the treatment: Ash treatment had the strongest effect and was significantly different from the PK and ApaBio treatments (Fig. 1).
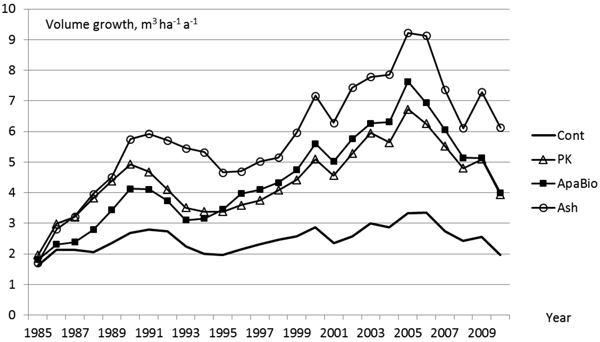
Fig. 1. The development of annual volume growth of Scots pine in 1985–2010 by covariance analysis (pre-treatment volume growth as covariate). See Table 1 for the information of treatments. The comparison between fertilizers including P and K. Statistically significant differences in the total stand growth during the study period (p < 0.05 in Bonferroni test): Control vs. PK; Control vs. ApaBio; Control vs. Ash; PK vs. Ash; ApaBio vs. Ash.
Temporal variation and treatment-by-time-interaction in the stand growth was significant according to repeated measures ANOVA with Greenhouse-Geisser F-test (Table 4). Pre-treatment three–year average volume increment as the covariate did not affect the significance of the effects and was not included.
N-fertilizer combined with PK, ApaBio or Ash did not have an effect on tree growth (Table 5). The differences between N-treated and N-untreated plots were non-significant, even though trees on the plots fertilized with Ash and N seemed in some years to have grown slower than the trees on the Ash-only plots.
| Table 5. The stand characteristics before and after cutting in 2010 and logging removals by treatments. See Table 1 for the information of treatments. Covariate adjusted values (pre-treatment volume as covariate); statistically different means are marked with different letters. | ||||||
| Treatment | Growing stock before cutting, m3 ha-1 | Removal in cutting, m3 ha-1 | ||||
| Volume | Saw logs | Total | Saw logs | Pulp wood | ||
| Cont | 93 a | 8 | 43 a | 1 | 39 | |
| PK | 148 b | 42 | 66 ac | 9 | 54 | |
| PK+N | 143 bd | 36 | 68 cbe | 10 | 54 | |
| ApaBio | 151 bd | 26 | 77 cbe | 5 | 66 | |
| ApaBio+N | 143 b | 31 | 67 ac | 8 | 55 | |
| Ash | 182 c | 60 | 93 de | 15 | 73 | |
| Ash+N | 177 cd | 56 | 83 cbe | 15 | 63 | |
| Growing stock after cutting, m3 ha-1 | ||||||
| Total | Saw logs | Pulp wood | ||||
| Cont | 48 a | 8 | 38 | |||
| PK | 79 bc | 35 | 43 | |||
| PK+N | 72 b | 26 | 45 | |||
| ApaBio | 72 b | 22 | 48 | |||
| ApaBio+N | 73 b | 25 | 47 | |||
| Ash | 90 cd | 45 | 44 | |||
| Ash+N | 93 cd | 42 | 49 | |||
3.3 Stand properties and logging removals
At the end of the study period, the total volume of growing stock varied from 93 m3 ha–1 in control plots to 143–182 m3 ha–1 in the fertilized plots (Table 5). The percentage of saw logs was remarkably greater on the fertilized plots, confirming that a considerable part of the fertilized trees had grown to a more mature stage. The effect of fertilization was seen also in the logging removal, which was on fertilized plots 1.5–2.2 times greater and included more saw logs than on control plots. The logging operation didn’t, however, remove all the fertilizer-induced tree growth. The remaining stand volume after cutting on the control plot was 48 m3 ha–1, whereas on fertilized plots it varied from 72 to 93 m3 ha–1 (Table 5).
3.4 Financial performance
Ash fertilizer treatment outperformed all other treatments as well as control in financial outcomes (Fig. 2). The EAI of Ash fertilizer treatment was almost three times higher than the EAI of control, when the discount rate was 3% (76.1 vs 28.4 € ha–1 year–1). With a 5% discount rate the EAI of Ash fertilizer treatment was one third higher than the second best fertilizer treatment (Fig. 2: 29.3 vs 19.6). Furthermore, Ash treatment was statistically significantly (Mann-Whitney U test, p = 0.009) better than the control (for simplicity, statistical testing was applied only for EAIs with a 5% discount rate). In general, adding ammonium nitrate into the base fertilizer (particularly ApaBio + N and PK + N) resulted in a considerable decrease in financial performance (EAIs) compared to the base fertilizers (without ammonium nitrate), regardless of the discount rate (Fig. 2). Interestingly, the EAI of Ash fertilizer treatment with 5% discounting was a bit higher than the corresponding of control with 3% discounting (29.3 vs 28.4). This outcome can be interpreted so that Ash fertilizer gives approximately 2% higher return per annum (5% – 3%) on fertilization investment, which originally produces ca. 30 € ha–1 annual income for the forest owner, however, the difference between Ash fertilizer and control was not statistically significant.
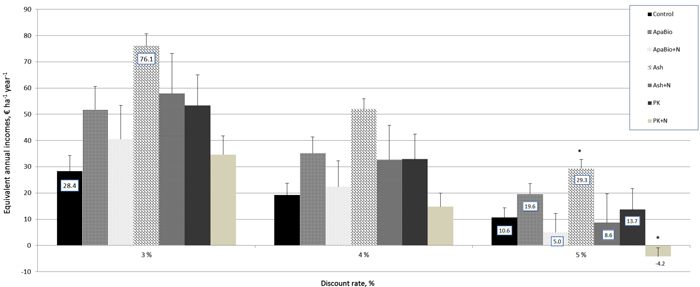
Fig. 2. Equivalent annual incomes, EAIs associated with alternative treatments, € ha–1 year–1. Discount rate 3%, 4% and 5%. Bars represent averages and line segments illustrate standard deviations divided by two (i.e. positive tops). With 5% discount rate asterisks indicate statistically significant differences (p < 0.05) compared to Control. See Table 1 for the information of treatments. View larger in new window/tab.
4 Discussion and conclusions
4.1 Stand nutrition
Both visual observations and foliar analyses confirmed the shortage of P and K in the study stand, especially in relation to available N in the peat in the study site. During the study period of 26 years, the availability of N was improved and that of K weakened in unfertilized plots. This implied that the ratio N:K further diverged from the optimal level.
According to foliar analyses, N status of the trees was at a satisfactory level and became enhanced with time. This was confirmed by the fact that N fertilization did not increase the stand growth. Beneath the root layer, at a depth of 15 cm, the peat type changed – according to visual observations – abruptly from actively decaying Sphagnum peat into well-humified Carex peat. Therefore, it is possible that the trees were able to make use of this deeper, more nitrogen-rich peat (N content 2.6–2.8%) with time. This probably explains the improved N status of Scots pine needles over time. The improvement of N status of trees over time was not due to fertilization (e.g. increased peat decomposition by ash) since N status improved also in control trees. This was verified also by the fact that N fertilization did not affect the stand growth in connection with PK, ApaBio or Ash treatments.
4.2 The changes in stand nutrition after fertilization
The pre-treatment nutrient status has been verified to have a major role as regards to the magnitude of the stand response after fertilization (Moilanen and Hökkä 2009; Moilanen and Hytönen 2014). Thus, determining the nutrient status of the stands grown on peatlands is of great importance also from the point of view of practical forestry. In the studied area the visual symptoms of nutrient deficiencies were seen at the time of fertilization.
All fertilization treatments (excluding N) improved the nutrient status of trees and significantly increased foliar P and K concentrations above the deficiency limits until the end of the 26-year study period. Moreover, the fertilization treatments balanced the nutrient status of trees, especially N:K ratio. Ash treatment induced the strongest changes in the nutrient status of trees. Also the effects of PK and ApaBio were evident for the whole of the study period, although they seemed to have faded in the last 10 years.
The effect of phosphorus fertilization on tree nutrition – regardless of the solubility of the phosphorus compound – may last at least 30–40 years on drained peatlands (Silfverberg and Hartman 1999; Silfverberg et al. 2011). A similar result was obtained in this study: needle P concentrations in the fertilized plot increased still after 26 years from application.
The effect of potassium application on the foliar K concentration generally lasts for 15–20 years (Kaunisto and Tukeva 1984; Moilanen 1993; Silfverberg and Hartman 1999; Silfverberg and Moilanen 2008). The applied K in the PK treatment was in the form of KCl, which is easily available to trees, but as a mobile element it also leaches easily (Ahti 1983; Malcolm and Cuttle 1983; Wells and Williams 1996). In the last decades, also slowly soluble forms of K compounds (e.g. biotite and phlogopite) have been available as an alternative fertilizer. Therefore, biotite was included also in this study. In earlier studies biotite has increased the K concentration in the tree’s needles more slowly than KCl during the first 4–9 years from application (Kaunisto et al. 1993). However, in the long run (21–24 years from application), biotite has been found to raise the foliar K concentration more than KCl (Pietiläinen et al. 2005). A similar result was obtained in this study with respect to the volume growth of trees: the effect of biotite was slower but continued for longer than the effect of KCl. However, during the whole study period the differences remained insignificant.
In ApaBio treatment both P and K were in slow-soluble form, which was probably reflected in the foliar and stand responses, which were weaker than with other treatments during the first 10 years. Thereafter, trees on ApaBio plots were growing slightly better than trees on PK plots, but still weaker than trees on Ash plots. The result was in accord with previous studies concerning the differences between biotite and potassium chloride as regards to stand responses after fertilization (Kaunisto et al. 1993, 1999; Moilanen et al. 2005).
4.3 Stand growth response to fertilization
The average growth of 2–3 m3 ha–1 a–1 in the control plots was of similar magnitude or slightly lower than indicated by growth models for the same site (2–4 m3 ha–1 a–1) as reported by Kojola (2009) (cf. Moilanen and Hytönen 2014). Based on that, the results of this study can be generalized to the Vaccinium vitis-idaea site type in Central Finland. However, Moilanen and Hytönen (2014) found that there were remarkable differences in the nutrient status and potential growth conditions within the peatland forest site type which is similar to the site in this study (Ptkg II).
The effect of the phosphorus and potassium fertilization on Scots pine stand volume growth was strong and long-lasting. The fertilizer-induced effect on the stand growth gradually strengthened and was continuing still at the end of the study period. During the whole study period of 26 years, the trees on ApaBio and PK plots grew nearly two-fold and those on Ash plots over two-fold compared with trees on control plots. The reason for the ash treatment’s stronger growth increase is likely the higher dose of nutrients contained in the Ash treatment. Earlier comparative studies with PK and ash have shown that as long as the applied amounts are similar, there is no major difference in the growth response (Moilanen et al. 2004, 2005).
The effect of PK-fertilization on stand growth has been stronger on nitrogen-rich sites than on nitrogen-poor sites (Moilanen 1993; Silfverberg and Moilanen 2008; Silfverberg et al. 2011; Saarsalmi et al. 2014). Also the effect of ash on the growth of trees is known to be the stronger the more the peat contains plant available nitrogen (Silfverberg and Huikari 1985; Moilanen 2002; Moilanen at al. 2013).
The results of our study proved clearly that N fertilization is unnecessary on the PtkgII (Vaccinium vitis-idaea) site type. This result agrees with earlier studies comparing PK and NPK treatments on similar sites: additional N has increased growth only at the most barren sites (e.g. Moilanen 1993), and on nitrogen-rich sites, adding N in the fertilizer can even cause adverse effects (e.g. Paavilainen and Pietiläinen 1983).
In previous studies, the positive effects of PK or Ash treatments on stand growth on peatland sites have lasted for several decades (Moilanen et al. 2002; Hökkä et al. 2012). Based on earlier research, we expect the nutrient status in the stand of this study to remain satisfactory for the coming 10–15 years, after which K will become a limiting nutrient (Moilanen et al. 2002). The stand growth of fertilized plots is expected to remain higher than in the control plots where it is expected to remain the same for the rest of the rotation, e.g., 20–30 years, even despite the gradually diminishing status of K (see Moilanen et al. 2002).
4.4 Financial performance of fertilization
Contradicting earlier studies (stating that the growth increase due to fertilization is fully realized in the subsequent thinning; e.g. Rantala and Moilanen 1993), this study evidenced for the first time that some of the growth response due to fertilization is available also after the thinning. The result is, however, conditional to thinning intensity which is determined according to certain recommended thresholds of density and dominant height. So, even though the logging removal is greater in volume, so must be the density and dominant height of the remaining trees, simply because the trees are larger on fertilized plots compared to the control.
This was the case in the present study. At the end of the study period, the total volume of growing stock and the percentage of saw logs were in the fertilized plots 1.6–2.1 times the corresponding values of the control plots. Also the logging removal was 1.5–2.4 times greater on fertilized plots than on the control plots.
After a thinning operation, the growing stock in fertilized plots consisted of larger trees with higher saw log proportion than in unfertilized plots. Therefore the rotation period in the fertilized plots can be expected to be shorter.
With a 5% discounting the EAI for Ash treatment was statistically significantly higher than the EAI for control. Further, with a 3% discount rate all fertilization treatments outperformed control in financial outcome. We applied these relatively low interest rates (from 3% to 5%) in the financial analyses since recent literature (e.g. Weitzman 2010; Tahvonen et al. 2013) supports the idea of applying low discount rates for long-term (> 20 yrs) investment decisions, as was the case here. With respect to adding ammonium-nitrate into the base fertilizer the results were also straight-forward: the financial performance dropped when ammonium nitrate was added. However, present results from N-rich sites are not applicable to cases (e.g. initial N-shortage areas) where the ammonium-nitrate is required in order to achieve any kind of positive growth response.
One interesting aspect related to the financial performances assessed in this study is the possible underestimation of the growth response due to fertilization treatment. Namely, the commercial value of growing stock right after the thinning (see Eq. 1) might slightly underestimate the actual financial value of the potential growth response which still exists in trees remaining after thinning. This, however, requires that some of the remaining trees after thinning in fertilized plots still possess higher growth rate than those of control plots. There is some evidence in the literature that this might be the case, i.e. that the fertilization-induced response of trees is longer-lasting than the study period of 26 years in this study (Moilanen et al. 2002; Silfverberg et al. 2011; Hökkä et al. 2012).
The intensification of forest biomass utilization has increased the interest to develop silvicultural methods to ensure balanced tree growth also in peatland forests. Especially we need to investigate the nutrient status and growth of Scots pine stands growing on nitrogen-rich peatlands, which have high potential for biomass production but can be seriously restricted by mineral nutrient deficiencies. At the same time, we have to assess the profitability of fertilization treatment during the life span of the stand as well as the consequent impacts on land use decisions in drained peatlands. According to the present study, it is possible with a single fertilizer application to achieve a long-lasting soil amendment effect, as well as to increase stand growth remarkably and to improve financial performance by both increasing equivalent annual income and by shortening the rotation time of the stand.
4.5 Conclusions
The beneficial long-term influence of PK fertilization on Scots pine nutrition and growth in N-rich peatlands has been shown in several previous studies conducted with different fertilizers. This study confirmed the positive foliar and growth responses and complemented the earlier observations with thinning yield data which indicated significantly higher thinning outturn from fertilized stands compared to unfertilized stands. The financial analysis showed that fertilization with PK or Ash resulted in significantly better financial performance than control with a 3% discount rate for the period from fertilization to thinning. Adding N was not a feasible option. Furthermore, part of the fertilization yield remained in the residual growing stock suggesting increased productivity (both timber and finance) of the fertilized stands for the rest of the rotation. Based on the results of this study, PK-fertilization (either using commercial fertilizers or Ash) in N-rich drained peatlands is a financially feasible method of management.
References
Aarnio J. (2006). Suometsätalouden kannattavuus yksityismetsissä. [The profitability of peatland forestry in private ownership]. In: Ahti E., Kaunisto S., Moilanen M., Murtovaara I. (eds.). Suosta metsäksi. Suometsien ekologisesti ja taloudellisesti kestävä käyttö. Tutkimusohjelman loppuraportti. Metsäntutkimuslaitoksen tiedonantoja - The Finnish Forest Research Institute, Research Papers 947: 194–201. [In Finnish].
Ahti E. (1983). Fertilizer-induced leaching of phosphorus and potassium from peatlands drained for forestry. Communicationes Instituti Forestalis Fenniae 111. 20 p.
Ahtikoski A., Kojola S., Hökkä H., Penttilä T. (2008). Ditch network maintenance in peatland forest as a private investment: short- and long-term effects on financial performance at stand level. Mires and Peat 3(3): 1–11.
Ahtikoski A., Moilanen M., Hökkä H. (2008). Profitability of fertilization of Scots pine on a drained peatland – a case study. In: After wise use – the future of peatlands. Proceedings of the 13th international peat congress, 8–13 June 2008, Tullamore, Ireland. International Peat Society, Jyväskylä, Finland. p. 460–462.
Ahtikoski A., Alenius V., Mäkitalo K. (2010). Scots pine stand establishment with special emphasis on uncertainty and cost-effectiveness, the case of northern Finland. New Forests 40(1): 69–84. http://dx.doi.org/10.1007/s11056-009-9183-2.
Brække F.H. (1994). Diagnostiske grenseverdier for næringselementer i gran- og furunåler. [Diagnostic concentrations of nutrient elements in Norway spruce and Scots pine needles]. Aktuelt fra skogforsk 15/94: 1–11. [In Norwegian].
Braekke F.H., Salih N. (2002). Reliability of foliar analyses of Norway spruce stands in a Nordic gradient. Silva Fennica 36(2): 489–504. http://dx.doi.org/10.14214/sf.540.
Duerr W.W. (1960). Fundamentals of Forest Economics.Mc-Graw-Hill, New York. 579 p.
Friedlob G.T., Plewa F.J. (1996). Understanding Return On Investment. John Wiley & Sons, New York, 233 p.
Halonen O., Tulkki H., Derome J. (1983). Nutrient analysis methods. Metsäntutkimuslaitoksen Tiedonantoja 121. 28 p.
Heinonen J. (1994). Koealojen puu- ja puustotunnusten laskentaohjelma KPL. Käyttöohje. [Calculation program for tree and stand characteristics. Instructions]. Metsäntutkimuslaitoksen Tiedonantoja 504. [In Finnish].
Hseu J-S., Boungiorno J. (1997). Financial performance of Maple-Birch stands in Wisconsin: value growth rate versus equivalent annual income. Northern Journal of Applied Forestry 14(2): 59–66.
Hökkä H., Ojansuu R. (2004). Height development of Scots pine on peatlands: describing change in site productivity with a site index model. Canadian Journal of Forest Research 34: 1081–1092. http://dx.doi.org/10.1139/x03-275.
Hökkä H., Kaunisto S., Korhonen K.T., Päivänen J., Reinikainen A., Tomppo E. (2002). Suomen suometsät 1951–1994. [Peatland forests in Finland 1951–1994]. Metsätieteen aikakauskirja 2A/2002: 201–357. [In Finnish].
Hökkä H., Repola J., Moilanen M. (2012). Modelling volume growth response of young Scots pine (Pinus sylvetris) stands to N, P, and K fertilization in drained peatland sites in Finland. Canadian Journal of Forest Research 42(7): 1359–1370. http://dx.doi.org/10.1139/x2012-086.
Hyvän metsänhoidon suositukset turvemaille 2007. Metsätalouden kehittämiskeskus Tapio. 51 p. [In Finnish].
Ingestad T. (1979). Mineral nutrient requirement of Pinus sylvestris and Picea abies seedlings. Physiologia Plantarum 45: 373–380.
Kaunisto S. (1992). Effect of potassium fertilization on the growth and nutrition of Scots pine. Suo – Mires and Peat 43(2): 45–62.
Kaunisto S. (1997). Suometsien kasvu turvattava metsänparannus- ja metsänhoitotoimilla. [Ensuring peatland forest growth with forest amelioration methods]. Metsäntutkimuslaitoksen tiedote 27.11.1997. [In Finnish].
Kaunisto S., Moilanen M. (1998). Kasvualustan, puuston ja harvennuspoistuman sisältämät ravinnemäärät neljällä vanhalla ojitusalueella. [Nutrient contents in the substratum and the stand and nutrient removal caused by thinning in a four-year old drainage site]. Metsätieteen aikakauskirja – Folia Forestalia 3/1998: 393–410.
Kaunisto S., Paavilainen E. (1988). Nutrient stores in old drainage areas and growth of trees. Communicationes Instituti Forestalis Fenniae 145. 39 p.
Kaunisto S., Tukeva J. (1984). Kalilannoituksen tarve avosoille perustetuissa riukuvaiheen männiköissä. [Summary: Need for potassium fertilization in pole stage pine stands established on bogs]. Folia Forestalia 585. 40 p.
Kaunisto S., Moilanen M., Issakainen J. (1993). Apatiitti ja flogopiitti fosfori- ja kaliumlannoitteina suomänniköissä. [Summary: Apatite and phlogopite as phosphorus and potassium fertilizers in peatland pine forests]. Metsätieteen aikakauskirja – Folia Forestalia 810. 30 p.
Keltikangas K., Laine J., Puttonen P., Seppälä K. (1986). Vuosina 1930–1978 metsäojitetut suot: ojitusalueiden inventoinnin tuloksia. [Summary: Peatlands drained for forestry during 1930–1978: results from field surveys of drained areas]. Acta Forestalia Fennica 193: 1–94. [In Finnish with English summary].
Kojola S. (2009). Kohti hyvää suometsien hoitoa – harvennusten ja kunnostusojitusten vaikutus ojitusaluemänniköiden puuntuotokseen ja metsänkasvatuksen taloustulokseen. Disserationes Forestales 83. 67 p. ISBN 978-951-651-256-6. http://dx.doi.org/10.14214/df.83. [In Finnish].
Laasasenaho J. (1982). Taper curve and volume functions for pine, spruce and birch. Communicationes Instituti Forestalis Fenniae 108: 1–74.
Laiho R., Laine J. (1994). Nitrogen and phosphorus stores in peatlands drained for forestry in Finland. Scandinavian Journal of Forest Research 9: 251–260.
Laiho R., Laine J. (1995). Changes in mineral element concentrations in peat soils drained for forestry in Finland. Scandinavian Journal of Forest Research 10: 218–224.
Laiho R., Alm J. (2005). Turvemaiden ravinnevarat. [The development of peatland forest nutrient status following drainage]. In: Ahti E., Kaunisto S., Moilanen M., Murtovaara I. (eds.). Suosta metsäksi. Suometsien ekologisesti ja taloudellisesti kestävä käyttö. Tutkimusohjelman loppuraportti: 40–45. [In Finnish].
Laiho R., Sarkkola S., Kaunisto S., Laine J., Minkkinen K. (2008). Macroscale variation in peat element concentrations in drained boreal peatland forestes. Silva Fennica 42(4): 555–570. http://dx.doi.org/10.14214/sf.233.
Laine J., Vasander H. (1996). Ecology and vegetation gradients of peatlands. In: Vasander H. (ed.). Peatlands in Finland: 10–20. Finnish Peatland Society, Helsinki. ISBN 952-90-7971-0.
Lauhanen R., Moilanen M., Silfverberg K., Takamaa H., Issakainen J. (1997). Puutuhkalannoituksen kannattavuus eräissä ojitusaluemänniköissä. [Summary: The profitability of wood ash-fertilizing of drained peatland Scots pine stands]. Suo - Mires and Peat 48(3): 71–82.
Malcolm D.C., Cuttle S.P. (1983). The application of fertilizers to drained peat. I. Nutrition losses on drainage. Forestry 56: 155–176.
Metinfo Database (2014). Stumpage prices retrieved on 24th November 2014. http://www.metla.fi/metinfo/tilasto/puukauppa/.
Moilanen M. (1993). Lannoituksen vaikutus männyn ravinnetilaan ja kasvuun Pohjois-Pohjanmaan ja Kainuun ojitetuilla soilla. [Summary: Effect of fertilization on the nutrient status and growth of Scots pine on drained peatlands in northern Ostrobothnia and Kainuu]. Metsätieteen aikakauskirja – Folia Forestalia 820. 37 p.
Moilanen M., Hökkä H. (2009). PK-lannoituksella aikaansaadun kasvureaktion suuruus riippuu ojitusaluemännikön ravinnetilasta. [Summary: The growth response of Scots pine to PK fertilization depends on the nutrient status of the stand on drained peatlands]. Suo - Mires and Peat 60(3–4): 111–120.
Moilanen M., Hytönen J. (2014). Männyn ravinnetilan pitkäaikainen vaihtelu ojitetuilla rämeillä – koesarjan esittely ja alustavia tuloksia. Metlan työraportteja/Working Papers of the Finnish Forest Research Institute 301. 40 p. ISBN 978-951-40-2482-5. http://www.metla.fi/julkaisut/workingpapers/2014/mwp301.htm.
Moilanen M., Silfverberg K., Hokkanen T.J. (2002). Effects of wood-ash on the growth, vegetation and substrate quality of a drained mire: a case study. Forest Ecology and Management 171: 321–338. http://dx.doi.org/10.1016/S0378-1127(01)00789-7.
Moilanen M., Silfverberg K., Hökkä H., Issakainen J. (2004). Comparing effects of wood ash and commercial PK fertiliser on the nutrient status and stand growth of Scots pine on drained mires. Baltic Forestry 10(2): 2–10.
Moilanen M., Pietiläinen P., Issakainen J. (2005). Long-term effects of apatite and biotite on the nutrient status and stand growth of Scots pine (Pinus sylvestris L.) on drained peatlands. Suo - Mires and Peat 56(3): 115–128.
Moilanen M., Saarinen M., Silfverberg K. (2010). Foliar nitrogen, phosphorus and potassium concentrations of Scots pine in drained mires in Finland. Silva Fennica 44(4): 583–601. http://dx.doi.org/10.14214/sf.129.
Moilanen M., Saarsalmi A., Kukkola M., Issakainen J. (2013). Effects of stabilized wood ash on nutrient status and growth of Scots pine - Comparison between uplands and peatlands. Forest Ecology and Management 295: 136–144. http://dx.doi.org/10.1016/j.foreco.2013.01.021.
Paarlahti K., Reinikainen A., Veijalainen H. (1971). Nutritional diagnosis of Scots pine stands by needle and peat analysis. Communicationes Instituti Forestalis Fenniae 74(5): 1–58.
Paavilainen E., Pietiläinen P. (1983). Foliar responses caused by different nitrogen rates at the refertilization of fertile pine swamps. Communicationes Instituti Forestalis Fenniae 116: 91–104.
Peltola A. (ed.) (2014). Finnish Statistical Yearbook of Forestry 2014. Finnish Forest Research Institute. 426 p.
Pietiläinen P., Moilanen M., Vesala H. (2005). Nutrient status and growth of Scots pine (Pinus sylvestris L.) on drained peatlands after potassium fertilisation. Suo - Mires and Peat 56(3): 101–113.
Puustjärvi V. (1962a). Suometsien fosforiravitsemuksesta ja neulasten P/N-suhteesta neulasanalyysin valossa. [On the phosphorus nutrition of wet peatland forests and on the P/N ratio of their needles]. Suo – Mires and Peat 13: 21–24. [In Finnish with English summary].
Puustjärvi V. (1962b). Suometsien kaliumravitsemuksesta ja neulasten N/K-suhteesta neulasanalyysin valossa. [On the potassium nutrition of wet peatland forests and on the N/K ratio of the needles in the light of needle analysis]. Suo – Mires and Peat 13: 36–40. [In Finnish with English summary].
Rantala T., Moilanen M. (1993). Nuorten suomänniköiden lannoituksen kannattavuus Pohjois-Pohjanmaalla. [Summary: Profitability of fertilization of young pine stands in northern Ostrobothnia]. Metsätieteen aikakauskirja – Folia Forestalia 821. 20 p.
Raunikar R., Buongiorno J., Prestemon J.P., Abt K.L. (2000). Financial performance of mixed-age naturally regenerated loblolly-hardwood stands in the south central United States. Forest Policy and Economics 1: 331–346.
Reinikainen A., Veijalainen H., Nousiainen H. (1998). Puiden ravinnepuutokset - Metsänkasvattajan ravinneopas. [A nutrient guide for the forester: nutrient deficiencies in trees]. Metsäntutkimuslaitoksen tiedonantoja 688. 44 p. [In Finnish].
Rydin H., Jeglum J. (2006). The biology of peatlands. Biology of Habitats Series, Oxford University Press, New York. http://dx.doi.org/10.1093/acprof:oso/9780198528722.001.0001.
Saarsalmi A., Smolander A., Moilanen M., Kukkola M. (2014). Wood ash in boreal, low-productive pine stands on upland and peatland sites: long-term effects on stand growth and soil properties. Forest Ecology and Management 327: 86–95. http://dx.doi.org/10.1016/j.foreco.2014.04.031.
Sikström U., Almquist C., Jansson G. (2010). Growth of Pinus sylvestris after the application of wood ash or P and K fertilizer to a peatland in southern Sweden. Silva Fennica 44(3): 411–425. http://dx.doi.org/10.14214/sf.139.
Silfverberg K., Hartman M. (1999). Effects of different phosphorus fertilisers on the nutrient status and growth of Scots pine stands on drained peatlands. Silva Fennica 33(3): 187–206. http://dx.doi.org/10.14214/sf.656.
Silfverberg K., Huikari O. (1985). Tuhkalannoitus metsäojitetuilla turvemailla. [Wood-ash fertilization on drained peatlands]. Folia Forestalia 633. 25 p. [In Finnish with English Summary].
Silfverberg K., Moilanen M. (2008). Long-term nutrient status of PK fertilized Scots pine stands on drained peatlands in North-Central Finland. [PK-lannoituksen vaikutus männyn ravinnetilaan Pohjois-Pohjanmaan ojitusalueilla]. Suo - Mires and Peat 59(3): 71–88.
Silfverberg K., Issakainen J., Moilanen M. (2011). Growth and nutrition of Scots pine on drained and fertilized purple moor grass fens in Central Finland. Baltic Forestry 17(1): 91–101.
SPSS Statistics Base 17.0 User’s Guide. 616 p. ISBN-13: 978-1-56827-400-3. http://www.jou.ufl.edu/archive/researchlab/SPSS-Statistcs-Base-Users-Guide-17.0.pdf.
Statistics Finland (2013). Consumer price index, prices and costs 2014. Appendix table 2: cost-of-living index 1951:10 = 100. Helsinki 14.1.2014. 10 p. http://www.stat.fi/til/khi/index_en.html.
Tahvonen O., Pihlainen S., Niinimäki S. (2013). On the economics of optimal timber production in boreal Scots pine stands. Canadian Journal of Forest Research 43: 719–730. http://dx.doi.org/10.1139/cjfr-2012-0494.
Vasander H., Laine J. (2008). Site type classification on drained peatlands. In: Korhonen R., Korpela L., Sarkkola S. (eds.). Finland – Fenland: research and sustainable utilisation of mires and peat. Finnish Peatland Society, Maahenki Ltd., Helsinki. p. 146–151. ISBN 978-952-5652-47-5.
Weitzman M.L. (2010). Risk-adjusted gamma discounting. Journal of Environmental Economics and Management 60: 1–13. http://dx.doi.org/10.1016/j.jeem.2010.03.002.
Venäläinen A., Tuomenvirta H., Pirinen P., Drebs A. (2005). A basic Finnish climate data set 1961–2000 – description and illustrations. Finnish Meteorological Institute, Reports No. 2005:5. 27 p.
Westman C.J., Laiho R. (2003). Nutrient dynamics of peatland forests after waterlevel draw-down. Biogeochemistry 63(3): 269–298. http://dx.doi.org/10.1023/A:1023348806857.
Total of 65 references
