Jonathan Sheppard  ,
Christopher Morhart,
Heinrich Spiecker
,
Christopher Morhart,
Heinrich Spiecker
Bark surface temperature measurements on the boles of wild cherry (Prunus avium) grown within an agroforestry system
Sheppard J., Morhart C., Spiecker H. (2016). Bark surface temperature measurements on the boles of wild cherry (Prunus avium) grown within an agroforestry system. Silva Fennica vol. 50 no. 3 article id 1313. https://doi.org/10.14214/sf.1313
Highlights
- Widely spaced trees within agroforestry systems are at risk of sun induced damages
- Bark surface temperature on the south western bole face reached nearly 50 °C in summer and experienced a maximum range of 38 °C within a 24 hour period in spring
- Maximum and minimum daily bark surface temperatures are modelled using climatic and solar position data
- The application of white paint to stems reduces the bark surface temperature.
Abstract
Growing Prunus avium L. within an agroforestry system (AFS) may result in sun damage to cambial tissues on sun-exposed bole faces. There are two periods of risk of damage caused by insolation to exposed tree boles, the summer, when cambial temperatures become too high, or during winter, when the frozen dormant cambium tissue thaws and then rapidly re-freezes, a phenomenon commonly referred to as sunscald or southwest disease. Damage on the south western bole face was observed on a number of P. avium within an AFS. Five trees were sampled to assess the period in time that damage occurred. To retrospectively investigate such damage, bark surface temperature data were collected over a two year period for a further five P. avium and analysed. It was shown that bark surface temperature on the south western bole face reached nearly 50 °C during summer and experienced a maximum range of 38 °C within a 24 hour period in spring. A specially formulated white paint was applied to two trees, thus, testing a method to reduce the risk of sun damage. Two models were constructed to predict maximum and minimum daily bark surface temperature using maximum, minimum and mean daily air temperature, daily sum of sunshine hours, cloud cover, wind speed, relative humidity, maximum solar elevation and height on the tree bole as predictor variables. The damage occurred during winter 2009/2010. The models were used to identify maximum and minimum bark surface temperatures during that winter enabling the identification of possible damage events.
Keywords
valuable timber;
sunscald;
sunburn;
southwest disease;
cambium;
alley cropping
-
Sheppard,
Chair of Forest Growth and Dendroecology, Albert-Ludwigs-University Freiburg, Tennenbacher Straße 4, 79106 Freiburg, Germany
 http://orcid.org/0000-0002-4959-7069
E-mail
jonathan.sheppard@iww.uni-freiburg.de
http://orcid.org/0000-0002-4959-7069
E-mail
jonathan.sheppard@iww.uni-freiburg.de
-
Morhart,
Chair of Forest Growth and Dendroecology, Albert-Ludwigs-University Freiburg, Tennenbacher Straße 4, 79106 Freiburg, Germany
http://orcid.org/0000-0003-1874-5011
E-mail
christopher.morhart@iww.uni-freiburg.de
- Spiecker, Chair of Forest Growth and Dendroecology, Albert-Ludwigs-University Freiburg, Tennenbacher Straße 4, 79106 Freiburg, Germany E-mail instww@uni-freiburg.de
Received 6 February 2015 Accepted 20 April 2016 Published 27 April 2016
Views 137840
Available at https://doi.org/10.14214/sf.1313 | Download PDF

1 Introduction
The broad range of agroforesty systems (AFS) provide multiple opportunities for production by the combination of a woody component with agricultural cropping. One permutation is the production of valuable timber within AFS as described by Mary et al. (1998), Balandier and Dupraz (1999) and Morhart et al. (2014), the latter specifically emphasising the establishment of widely spaced broadleaved tree species such as Prunus avium L. planted in rows with an intercrop between. By design, the tree component within AFS has little or no natural shading, and therefore, is exposed to greater climatic extremes than trees within closed canopy forests. Such extremes include larger temperature ranges, increased insolation (incoming solar radiation) and wind speed. In addition to the absent shade that would be provided by neighbouring trees in forests, the application of pruning treatments for the production of valuable timber escalates the amount of insolation received on the tree bole. This is especially true during early developmental stages as the tree is unable to provide sufficient self-shading for the lower parts of the bole.
Sun damage usually appears on south (S) or south western (SW) side of the basal portion of the bole (Huberman 1943; Sakai 1966; Wulf and Kehr 2009). The SW side of the bole is most vulnerable due to its orientation towards the highest levels of insolation i.e. when the sun is more likely to be at its peak elevation throughout the day and year (Wagner and Kuhns 2011), at the same time, the lower portion of the bole receives the least self shading by the tree. Such damage is in most cases insufficient to kill the tree, but can severely diminish the value of the log and in extreme cases can render the log worthless (Huberman 1943). One sun damage event is possibly sufficient to totally devalue the entire tree, as once a tree is damaged, wounds are vulnerable to fungal and insect attack (Vasilev 1950; Roppolo and Miller 2001). Regarding P. avium fungal species such as Phellinus tuberculosus Baumg. and Trametes spp. (Seifert et al. 2010) may enter through the site of damage and can spread throughout the entire tree. Wounds may callus during the summer months but often these wounds do not completely seal. Calloused areas are also reported to be particularly susceptible to repeat sun damage (Vasilev 1950). Determining the time of damage can be problematic, it can be assumed that there are two periods of risk for sun exposed tree boles. Perceptibly, during summer, when cambial temperatures become too high (Huber 1935; Levitt 1980) due to direct solar radiation, this effect is known as sunburn or high temperature injury (HTI) (Leers 2013), or during winter, a phenomenon referred to as sunscald (Chandler 1913; Huberman 1943; Roppolo and Miller 2001; Wagner and Kuhns 2011). Sunscald damage is suggested to occur when cambial temperatures fluctuate during cold but bright winter days. Frozen dormant cambium tissue thaws and then rapidly re-freezes; this ruptures the cambial cells when the ambient temperature falls at dusk or due to fast moving cloud cover during the day (Harvey 1923a; Huberman 1943; Roppolo and Miller 2001). Winter sunscald is also an effect that can be exacerbated by the reflective presence of snow cover (Sakai 1966).
Insolation can be defined as the total amount of radiated solar energy received on a known surface area during a specified time expressed as W m–2. Stoutjesdijk (1977) measured direct incoming insolation (including diffuse and reflected energies) in Arnham, Netherlands (latitude: 51°90´N). He reported irradiance values measured perpendicular to the plane of incoming energy of 500 W m–2 in December rising to near 1000 W m–2 during March, at the same time also recording a value of 850 W m–2 on a vertical surface. In comparison, insolation is relatively low on a horizontal surface at this time of year (560 W m–2, Stoutjesdijk 1977). Vertically inclined surfaces such as the boles of trees receive a more intense level of insolation than that received at any other time of the year due to their (near) vertical orientation coupled with the low elevation of the sun. For this reason late winter and spring are cited as high risk periods for winter sunscald damages (Krenn 1933; Huber 1935; Derby and Gates 1966; Stoutjesdijk 1977; Wagner and Kuhns 2011).
Cambial frost damage takes place when intracellular freezing occurs, ice crystals are rapidly formed within the protoplast and the cell cytoplasm is destroyed (Olien 1967; Larcher 2003). Frost damage is usually avoided through supercooling mechanisms (i.e. the process of cooling a substance below a phase-transition temperature without the transition occurring; see Burke et al. 1976; Larcher 2003) the resultant freezing within plant tissues is extracellular, and therefore, temperatures lower than –30 °C are survivable. Hardening is a process that allows a plant to better withstand freezing temperatures. Frost hardiness is increased by gradual chilling of the plant (Sakai 1966). Three stages of the hardening process at a cellular level have been described in detail by Levitt (1980) and Larcher (2003). The first stage is described as pre-hardening; here the plant is exposed to temperatures marginally above 0°C for a number of days. During this time the protoplasm accumulates sugars and protective substances. During a second stage a gradual lowering of ambient temperature brings about further hardening where cell structures and proteins adapt to the loss of water brought about by a frost event. The final stage is an uninterrupted period with temperatures below –5 °C which cement the plant’s resistance to frost damage. A slow rate of temperature decrease until and beyond the point that plant tissues freeze has a positive effect on plant survival, while repeated and rapid thaw/freeze cycles within plant tissues can have an amplifying effect on injury (Burke et al. 1976). Once growth commences in the spring or during warmer ambient air temperatures during midwinter, accumulated hardening effects can be partially or completely lost (Harvey 1923a; Levitt 1980; Larcher 2003).
Sakai (1966) and Nicolai (1986) both suggest that the temperature of small plant parts such as leaves and twigs are tightly coupled with ambient air temperature, whereas the temperature of larger tree parts such as the bole differ greatly. This can be considered especially true on days with strong insolation with few clouds, low wind and low humidity. Huberman (1943) demonstrated that air temperature is the most important factor influencing changes in bark surface and cambial temperature. Yet damages on the SW bole face suggest that insolation is a considerable contributory factor, consequently the duration of sunshine and the position of the sun in sky are also important causal parameters. The surface temperature of tree bark is dependent on its colour, texture and thickness, the intensity of sunlight, the amount of heat radiated away from the bark surface (Stefan-Bolzmann law), the rate of conduction of heat inwards and the diameter of the bole (Harvey 1923a; Sakai 1966; Leers 2013). Nicolai (1986) measuring bark temperature proposed that there are four types of bark occurring in central Europe namely: smooth, white, fissured and scaly. He concluded that smooth and thin barked boles are not adapted to avoid overheating. This concurs with other research suggesting that sun induced damage is more likely to occur on trees with thin (Burke et al. 1976; Litzow and Pellett 1983; Nicolai 1986; Roppolo and Miller 2001; Wagner and Kuhn 2011) and/or dark coloured bark (Harvey 1923b; Sakai 1966). P. avium can be considered both a smoothed bark species (Nicolai 1986) with a thin (Pryor 1988; Morhart et al. 2016) and dark coloured bark, especially during early developmental stages, and therefore, at high risk of sun damage especially in exposed locations, such as those characterised by AFS. As the tree matures this problem may resolve itself as bark thickens (Wulf and Kehr 2009) and the tree canopy extends, although it has been suggested that species within the Prunus genus become even more susceptible to sun damages with age (Wagner and Kuhns 2011).
Beside physical bark characteristics, there are other factors that can heavily influence the occurrence of sun damage. Sun damage is often linked to a sudden exposure to light (Huberman 1943; Roppolo and Miller 2001; Ghosh 2013). Trees at recently created boundaries such as clear-cuts, wind throws or roadways without a shading understory are more susceptible to damage. A comparable effect due to a sudden exposure to insolation can be seen after pruning operations. A high incidence of sun damage has been reported on trees which have been heavily (Huberman 1943) or incorrectly (Roppolo and Miller 2001) pruned, or have sustained damage (Roppolo and Miller 2001). It has also been suggested that water stress may play a role (Roppolo and Miller 2001) especially for transplanted trees with immature root systems.
Due to instances of damage on the basal portions of P. avium stems located within a widely spaced agroforestry system, this paper aims to present the measurement and modelling of the maximum and minimum daily bark surface temperature imposed on bole surfaces of trees within an AFS. Secondly, we intend to explore the presented models and apply them to the potential time periods during which observed damages have been assumed to be caused.
2 Materials and methods
2.1 Study site
Investigations were conducted within an AFS research site situated in southern Germany (48°07´N, 07°59´E; 182 m a.s.l.). The site was established on abandoned agricultural land in 1997. P. avium and other broadleaved species were planted with a spacing of 1.5 m within the rows and 7.5/15.0 m between. The region has a climate dominated by warm summers and mild winters. Based on the 1961 to 1990 Climate Normals (Vogtsburg-Oberrotweil: 48°09´N, 07°63´E, 223 m a.s.l., DWD 2015) the mean annual precipitation sum is 705 mm (May to September: 385 mm) while mean annual air temperature is 10.1 °C (May to September: 16.9 °C) this is bounded by an average annual minimum air temperature of –0.2 °C and an average annual maximum temperature of 19.6 °C. The 20 year (1996–2015) mean annual temperature variation of the site ranges between a maximum of 35.0 °C and a minimum of –10.5 °C.
2.2 Sampling
A total of five P. avium with suspected sun induced damage present on the SW bole face were sampled in order to date the damage. The trees were felled in November 2012 (n = 3) and in June 2014 (n = 2). One sample disc was recovered from each tree at breast height (1.3 m) and the surface prepared using 240 grit sandpaper. For the determination of the date of damage a microscope (SMZ 745T; Nikon Corp.) was used to analyse the tree rings.
2.3 Recording bark surface temperature
In order to produce valuable timber within an AFS a dense initial within row distribution is not commonly utilised (Morhart et al. 2014). In order to measure five trees with similar dimensions in close proximity, five P. avium (mean DBH = 12.4 cm (±1.4 cm), mean height ≈ 11 m) were selected and released from surrounding natural regeneration consisting of mixed broadleaf forest of comparable age in February 2013. This resulted in a clearing extending 15 m to the south of their location to the adjacent planted tree row, thus simulating the between row distribution of trees within a functioning AFS. This also ensured that the trees were not previously exposed to insolation and potential indeterminable sun damage events that could negatively influence observations. Two of the five sample trees were painted white utilising a specialist paint system formulated for minimising thermal damages (Arbo-Flex including primer coat LX60; Flügel GmbH). A total number of 24 sensors were affixed to the five study trees at three heights (1.0 m, 3.0 m and 5.5 m) in two cardinal directions (SW and NE; see Fig. 1). The SW faces of the bole being the most exposed to the sun and the NE bole faces constituting a control measurement. Temperature on the surface of the bark was measured using an insulated type-K thermocouple with an exposed welded tip (RS Components Ltd.) to reduce direct solar heating effects. The thermocouple was supported with elastic straps and knotted in a way to provide sustained pressure of the thermocouple tip against the bark surface. Data were transferred to a logger station (CR23X micrologger; Campbell Scientific Inc.) through a multiplexer (AM25T solid state multiplexer; Campbell Scientific Inc.) providing up to 25 measurement channels. Thermocouple wire relies on a dielectric current passing through two strands of wire composed of differing metals (metal choice is based upon the desired sensing range), a current is generated when there is a temperature gradient between both ends of the thermocouple wire. Thermocouple wire is generally shielded/insulated so only the welded tip is exposed to changes in temperature.
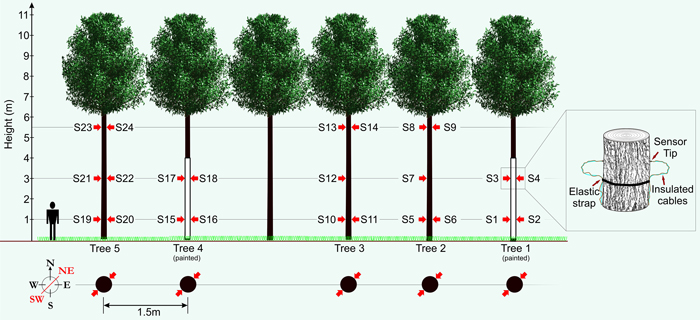
Fig. 1. Schematic showing experimental set-up with sensor (S1–S24) layout (red arrows). View larger in new window/tab.
Equipment was checked every four weeks to check for faults, to download data and replenish auxiliary battery power supply. Stem surface temperature data were collected and analysed for a two year period between 14th March 2013 and 22nd April 2015 and correlated with air temperature recorded during the same period. Air temperature was measured using a dedicated probe (HMP45C temperature and relative humidity probe; Campbell Scientific Inc.) located on a mast at 10 metres from the ground fitted with a solar radiation shield. Continuous air temperature measurements recorded every five minutes have been made since 2008 on this site. Additionally hourly cloud coverage (Okta), hourly sunshine data (minutes of sunshine in the hour), and hourly mean wind speed (m sec–1) were retrieved from the German Meteorological Service from a nearby weather station (Freiburg: 48°02´N, 07°83´E; 236 m a.s.l., DWD 2015).
2.4 Data analysis
Data analysis was carried out using SPSS for Windows 22.0 software (IBM 2013). The level of significance was set at p = 0.05 for all analyses. Normality was tested with a Shapiro-Wilk test. ANOVA (Analysis of Variance) was conducted with a post-hoc Tukey HSD (honestly significant difference) test to examine whether there were differences between temperature data at differing heights on the bole, between SW and NE bole faces and application of stem protection paint.
Ordinary least squares regression was performed to model a) the maximum daily bark surface temperature, and b) the minimum daily bark surface temperature on the SW bole face on unpainted trees. Bark surface temperature measurements from unpainted trees recorded during the study period were used as dependent variable with air temperature combined with other parameters outlined in Table 1. Independent predictor variables were included within the model in a stepwise fashion ensuring significance. Residuals were assessed for homoscedasticity by visual analysis of the studentised residuals against predicted values, a normal distribution was assessed utilising normal Q–Q plots. A Durbin-Watson test was carried out to assess whether there was autocorrelation between residuals and the resultant Variance Inflation Factor (VIF) evaluated in order to assess multicolliniarity. The Akaike Information Criterion (AIC) was utilised to reinforce the choice of model, AIC values can be seen in Table 2. The derived model followed the form of Eq. 1 where Tbark equals the daily maximum or minimum bark surface temperature and X the respective independent predictor variables with associated beta values (β) as derived from the regression analysis.
| Table 1. Independent predictor variables used to model bark surface temperature. | |||
| Independent Variable | Unit | Data Source | |
| Max temperature (Tmax) | Maximum daily temperature | °C | In situ measurements |
| Min temperature (Tmin) | Minimum daily temperature | °C | In situ measurements |
| Mean air temperature (Tmean) | Mean daily temperature | °C | In situ measurements |
| Sunshine (Sun) | Daily sum of sunshine hours | hr | DWD 2015 |
| Cloud cover (Cloud) | Mean daily cloud cover | Okta | DWD 2015 |
| Wind speed (Wind) | Mean daily wind speed | m sec–1 | DWD 2015 |
| Relative humidity (RH) | Mean daily relative humidity | % | DWD 2015 |
| Solar elevation (Elev) | Maximum daily solar elevation | Degrees from horizontal | NOAA 2015 |
| Height | Height on tree bole | m | In-situ measurements |
| Table 2. Model parameters: maximum and minimum daily bark surface temperature as a function of max. temperature (Tmax), min. temperature (Tmin), mean air temperature (Tmean), sunshine duration (Sun), cloud cover (Cloud), wind speed (Wind), relative humidity (RH), solar elevation (Elev) and Height. | ||||||||
| Model | Included Variables | F | df | R | r2adj | p | AIC | |
| Maximum | 1.1 | Tmax | 23052.0 | 1,4979 | 0.907 | 0.822 | <0.001 | 15543.9 |
| 1.2 | Tmax, Sun | 22205.0 | 2,4978 | 0.948 | 0.899 | <0.001 | 12723.7 | |
| 1.3 | Tmax, Sun, Height | 15746.7 | 3,4977 | 0.951 | 0.905 | <0.001 | 12447.3 | |
| 1.4 | Tmax, Sun, Height, Wind | 12162.4 | 4,4976 | 0.952 | 0.907 | <0.001 | 12315.7 | |
| 1.5 | Tmax, Sun, Height, Wind, Elev | 9944.2 | 5,4975 | 0.953 | 0.909 | <0.001 | 12218.3 | |
| 1.6 | Tmax, Sun, Height, Wind, Elev, RH | 8296.5 | 6,4974 | 0.953 | 0.909 | <0.001 | 12214.1 | |
| Minimum | 2.1 | Tmin | 113926.5 | 1,4979 | 0.979 | 0.958 | <0.001 | 2151.5 |
| 2.2 | Tmin, Cloud | 59781.8 | 2,4978 | 0.980 | 0.960 | <0.001 | 1921.8 | |
| 2.3 | Tmin, Cloud, Tmean | 45176.1 | 3,4977 | 0.982 | 0.965 | <0.001 | 1322.0 | |
| 2.4 | Tmin, Cloud, Tmean, RH | 34677.8 | 4,4976 | 0.983 | 0.965 | <0.001 | 1211.5 | |
| 2.5 | Tmin, Cloud, Tmean, RH, Wind | 28256.3 | 5,4975 | 0.983 | 0.966 | <0.001 | 1124.2 | |
| 2.6 | Tmin, Cloud, Tmean, RH, Wind, Elev | 24164.9 | 6,4974 | 0.983 | 0.967 | <0.001 | 1000.5 | |
| 2.7 | Tmin, Cloud, Tmean, RH, Wind, Elev, Height | 20730.5 | 7,4973 | 0.983 | 0.967 | <0.001 | 997.5 | |
3 Results
3.1 Retrospective analysis
Instances of sun damage have been observed within the study AFS. Tree ring analysis conducted on all five sample trees suggest that damage occurred during the winter 2009/2010, this conclusion was based on the microscopic detection of a full tree ring produced during the 2009 growing season with no subsequent growth in the 2010 growing season. Fig. 2 shows two examples of sun damage and the internal effect on wood quality. These samples were derived from the study site and underwent retrospective ring analysis. Fig. 2b and 2d are schematic representations of Fig 2a and 2c respectively, in order to highlight ring boundaries and areas of decay. Fig. 2a and 2b demonstrate an example of a sun damage induced wound that is almost completely occluded; still the presence of extensive decay within the heartwood and fungal bodies must be noted. It can be suggested that approximately 12% of the circumferential cambial area in the SW direction died in winter 2009/2010 (Fig. 2b blue line). In Fig. 2c and 2d a sample tree with a larger diameter (DBH) of approximately 20 cm showed extensive decay as result of sun induced injury. It was found that 25% of the cambial area was destroyed during winter 2009/2010 resulting in a progressively flattening of the SW bole face as subsequent rings developed in the remaining cambium. The bark has become detached providing no protection to further ingress of damaging agents and fungal bodies, evidence of insect attack is present in both samples. Both primary sun damage and subsequent sun damage events on calloused tissues occluding the primary wound in successive years can be seen in Fig. 2c and 2d, this area is highlighted in Fig. 3. The primary sun damage event that is assumed to have taken place during the winter/early spring 2009/2010 is evident (red line) as the largest site of cambial cell death, there is limited occlusion of the wound in the subsequent year. Calloused tissues from the 2010 ring are seen to be damaged further (i.e. secondary damage: green line), the same process is observed to be repeated in the winter 2011/2012 forming a third instance of sun induced damage (tertiary damage: blue line). Repeated damage to the cambium excludes the possibility of wound occlusion resulting in a flattened bole face on the SW side, prior to further deterioration due to secondary influences such as insects or fungi, thus threatening the longevity of the tree and in most cases either severely devaluing or even rendering the log worthless.
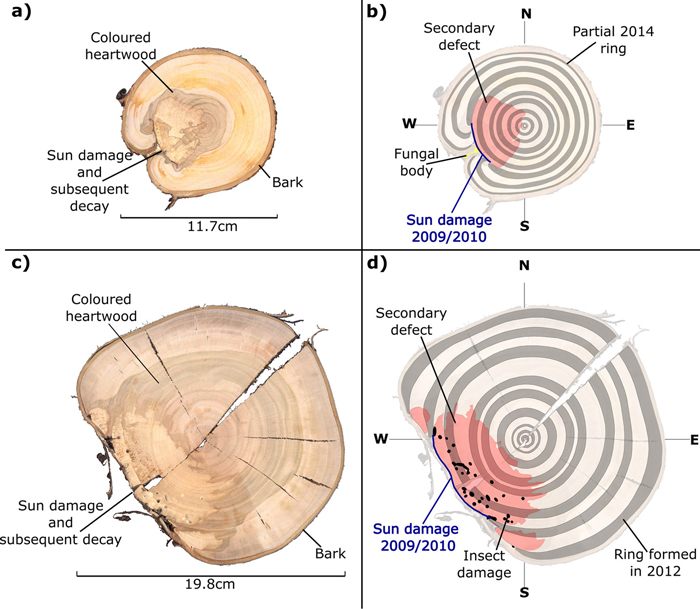
Fig. 2. Stem discs (at 1.3 m above ground level) taken from sun damaged Prunus avium grown within an AFS. True colour images (a and c) and false colour images to highlight tree rings and damaged regions (b and d).
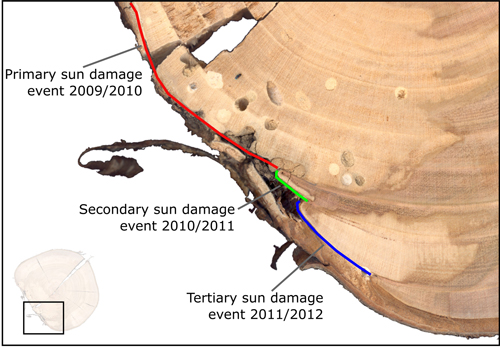
Fig. 3. Enlarged image displaying primary (red) cambium damage with associated decay, also with secondary (green) and tertiary (blue) damages to cambium tissues in subsequent years.
A period of potential damage was suggested to have occurred during the winter 2009/2010, this was deduced by the presence of a full tree ring for the 2009 growing season within all discs taken from trees with pre-existing damage on the SW bole face.
3.2 Temperature measurements
Mean maximum and minimum values were used in this instance to provide statistically robust values for comparison of sensor location on the tree bole (i.e. SW vs. NE at differing heights). Fig. 4 shows the results of the data analysis of mean maximum daily temperature utilising a Tukey HSD test. This post hoc test defined five significantly distinct groups (see Fig. 4; groups a – e, F = 12.9.5; df = 9,7272; p = <0.001). A clear contrast was observed between values recorded on the SW and NE bole faces particularly with the influence of height of the temperature sensor. All locations in a NE aspect and at 5.5 m in a SW direction are suggested to display similar temperature readings. Air temperature remained statistically different from all other recorded values. Mean minimum daily temperature can be considered significantly similar forming only one distinct group (F = 4.1; df = 9,7272; p = <0.001), with a mean value of approximately 6.5 °C. Fig. 4 also shows absolute maximum and minimum temperature readings from within the study period (grey bars). Data analysis showed that SW sensors at 1 m and 3 m in height did not only have the highest mean temperatures but also the maximum recorded temperatures on unpainted trees as shown in Fig. 4 and Table 3. Absolute minimum temperature measurements did not vary significantly between SW and NE aspects nor between painted and unpainted trees and ambient air.
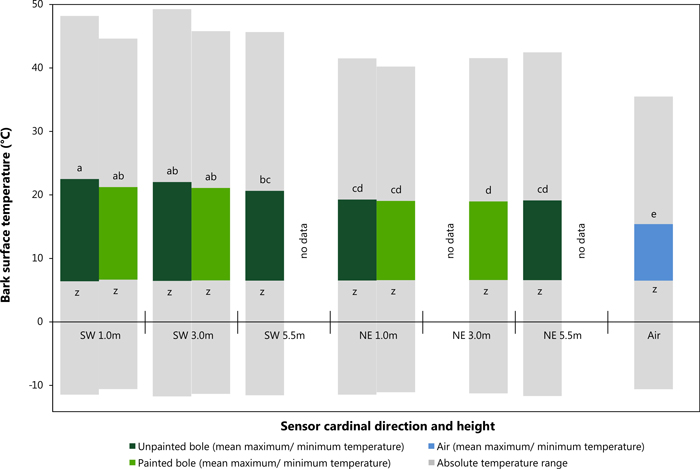
Fig. 4. Average maximum and minimum bark surface temperature values with absolute maximum and minimum temperature records between sensor direction and height (Tukey HSD, significance level p < 0.05, Maximum: p-values: a = 0.159, b = 0.172, c = 0.054, d = 0.999 e = 1.000; Minimum: p-values: z = 0.998). View larger in new window/tab.
| Table 3. Regression parameters Model 1.6: maximum SW bark surface temperature and model 2.7: minimum SW bark surface temperature using max. temperature (Tmax), min. temperature (Tmin), mean air temperature (Tmean), sunshine duration (Sun), cloud cover (Cloud), wind speed (Wind), relative humidity (RH), solar elevation (Elev) and Height as predictor variables. | |||||||
| Dependent Variable | Independent Variables | Unstandardised coefficients | t | p | |||
| β | SE | ||||||
| Max. Daily Bark Surface Temp. | |||||||
| Model 1.6 | Intercept | 5.786 | 0.653 | 8.863 | <0.001 | ||
| Tmax | 0.990 | 0.010 | 94.914 | <0.001 | |||
| Sun | 0.798 | 0.017 | 46.097 | <0.001 | |||
| Height | –0.455 | 0.026 | –17.351 | <0.001 | |||
| Wind | –0.444 | 0.038 | –11.576 | <0.001 | |||
| Elev | 0.041 | 0.004 | 9.325 | <0.001 | |||
| RH | –0.016 | 0.006 | –2.489 | 0.013 | |||
| Min. Daily Bark Surface Temp. | |||||||
| Model 2.7 | Intercept | –6.361 | 0.225 | –28.291 | <0.001 | ||
| Tmin | 0.663 | 0.011 | 59.100 | <0.001 | |||
| Cloud | 0.222 | 0.011 | 19.924 | <0.001 | |||
| Tmean | 0.301 | 0.011 | 26.327 | <0.001 | |||
| RH | 0.037 | 0.002 | 17.039 | <0.001 | |||
| Wind | 0.148 | 0.013 | 11.759 | <0.001 | |||
| Elev | 0.018 | 0.002 | 11.284 | <0.001 | |||
| Height | 0.019 | 0.008 | 2.252 | 0.024 | |||
The greatest daily amplitude was found to total 38 °C on the SW bole face of unpainted trees, painted trees presented a maximum daily amplitude of 4.2 °C less as seen in Table 4. Likewise, the greatest difference between SW and NE bole faces was observed to be 14.7 °C on unpainted trees, while on painted trees the maximum difference was less, recorded at 10.2 °C. Temperature data for NE bole faces and at 5.5 m on the SW face were not significantly different and closely correlated with air temperature. Maximum bark temperatures on the SW bole face at a height of 1m are reduced by the application of white paint during critical periods of potential sun damage. For example a reduction of 8.8 °C was observed in the early afternoon during early March 2014 with concurrent ambient air temperatures of 10.3 °C (Fig. 5) when the unpainted tree bole reached 31.8 °C. When insolation was low it was observed that SW bole surface measurements between painted and unpainted trees are closely correlated (Fig. 5: 03/03/2014 and 04/03/2014). It was also noted that the application of white paint marginally increased the minimum temperature experienced overnight (up to 0.5 °C), thus further reducing the amplitude of night-day temperature fluctuations. Elevated bark surface temperatures during summer months on the SW bole face was reduced by approximately 3.5 °C by the application of white paint under ambient air temperatures above 30 °C. Little difference was observed between painted and unpainted trees on NE bark surface temperatures.
| Table 4. Summary of extreme temperature measurements. | ||||
| Parameter | Bark Surface Temp. (Air Temp.*) (°C) | Height on tree bole (m) | Sensor(s) Nr. | Date and Time of occurrence |
| Unpainted Trees | ||||
| Max. (SW) | 49.1 (31.1) | 3.0 | 12 | 22.07.13 / 14:25 |
| Max. (NE) | 42.3 (34.8) | 5.5 | 14 | 27.07.13 / 14:30 |
| Min. (SW) | –11.8 (–10.5) | 5.5 | 13 | 29.12.14 / 05:35 |
| Min. (NE) | –11.7 (–10.6) | 3.0 | 22 | 29.12.14 / 05:45 |
| Greatest difference (SW/NE) | 14.7 (10.2) | 1.0 | 5/6 | 02.03.14 / 14:45 |
| Max. range within 24hrs (SW) | 38.0 (17.1) | 1.0 | 5 | 17.04.14 / 24hrs |
| Painted Trees | ||||
| Max. (SW) | 45.6 (31.1) | 3.0 | 3 | 22.07.13 / 14:55 |
| Max. (NE) | 41.4 (34.8) | 3.0 | 4 | 27.07.13 / 14:30 |
| Min. (SW) | –11.4 (–10.5) | 3.0 | 3 | 29.12.14 / 05:35 |
| Min. (NE) | –11.3 (–9.9) | 3.0 | 4 | 29.12.14 / 06:25 |
| Greatest difference (SW/NE) | 10.2 (4.0) | 3.0 | 17/18 | 15.03.13 / 14:50 |
| Max. range within 24hrs (SW) | 33.8 (22.6) | 1.0 | 1 | 15.04.15 / 24hrs |
| Air temperature during study period: mean 10.7 °C, maximum 35.4 °C, minimum: –10.6 °C * Concurrent air temperature measurement | ||||
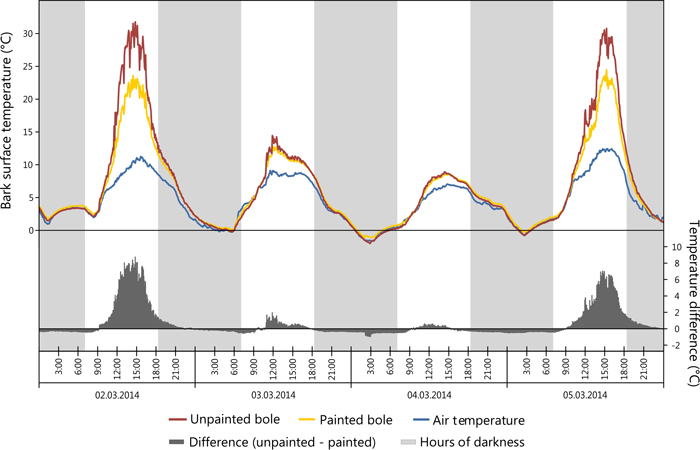
Fig. 5. Comparison of painted (sensor 1) vs. unpainted (sensor 5) tree boles in regards to bark surface temperature. View larger in new window/tab.
To demonstrate the variability and extremes in bark surface temperature within a one year period, Fig. 6 highlights three events occurring at a pair of sensors located on one tree at the same height: sensor 5 (on the SW bole face) and sensor 6 (on the NE bole face). A maximum bark surface temperature of 48.0 °C was recorded in July 2013 on the SW face (see Fig. 6a; red line) concurrently the NE bole face reached a maximum temperature of 40.2 °C suggesting that ambient air temperature (max. 33.8 °C) and indirect solar heating (i.e. conduction) through the bole may present an effect on the temperature in all cardinal directions. Fig. 6b (red line) shows the most extreme temperature range within 24 hours for a sensor located on the SW bole face. Here, a temperature range totalling 38.0 °C was observed while, ambient air temperature ranged 17.1 °C during the same period. Fig. 6c outlines an event possibly important to winter sunscald, a temperature range of 18.9 °C with rapid reduction in temperature from positive temperature values to negative (Fig. 6c; red line) as observed in November 2013. Here, bark surface temperature rose from –5.3 °C at sunrise (08:00 CET) to 13.5 °C at 14:20 CET, before rapidly falling past 0°C at sunset. Overnight a minimum temperature of –4.1 °C at 21:55 CET was reached. During the entire day the ambient air temperature remained below 0°C (Fig. 6c; blue line).
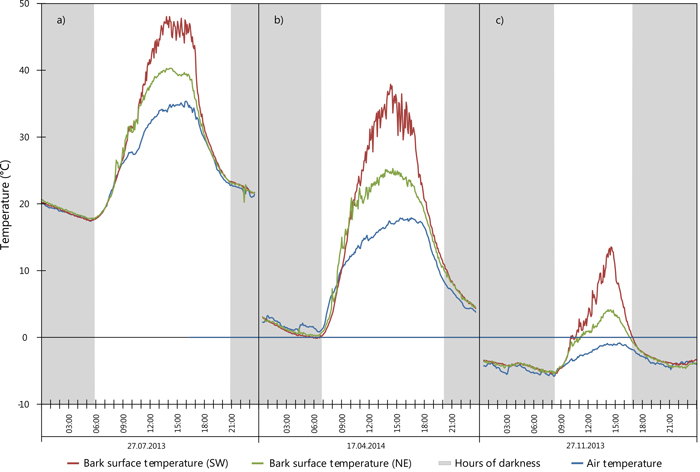
Fig. 6. Extreme values for SW (sensor 5) and NE (sensor 6) surface temperature during selected 24 hour periods: a) maximum recorded temperature; b) maximum range; c) large SW temperature variation including sub-zero temperatures. View larger in new window/tab.
3.3 Modelling bark surface temperature
Modelling was carried out using nine independent predictor variables, as outlined in Table 1, namely maximum, minimum and mean daily air temperature, daily sum of sunshine hours, mean daily cloud cover, mean daily wind speed, mean daily relative humidity, maximum daily solar elevation and height on tree bole.
A large number of data points (n = 5042) was observed for all models, furthermore, a highly significant correlation was distinguished between the dependent and independent variables for the prediction of both daily maximum and daily minimum bark surface temperature. The resulting six models from the stepwise regression to describe maximum daily bark surface temperature are shown in Table 2. A high value for the adjusted coefficient of determination (r2adj) was observed for all derived models. Model 1.6 presenting the lowest AIC value was chosen to compute maximum daily bark surface temperature within the retrospective analysis. Mean daily cloud cover and mean daily air temperature were excluded from the model as they did not contribute statistical significance. In Table 3 it is evident that maximum daily air temperature and daily sum of sun hours provide the backbone of the model, the other independent variables contribute less. For modelling minimum bark surface temperature the same approach was chosen, here, model 2.7 was selected. In this model daily minimum air temperature provided the core (Table 3). Fig. 7 shows predicted values plotted against observed values for a randomly chosen sub-set of the original dataset reserved especially for model validation (n = 1681, representing 25% of total observations). A Root Mean Square Error (RMSE) of 0.09 and 0.01 was calculated for the prediction of maximum and minimum daily bark surface temperature respectively.
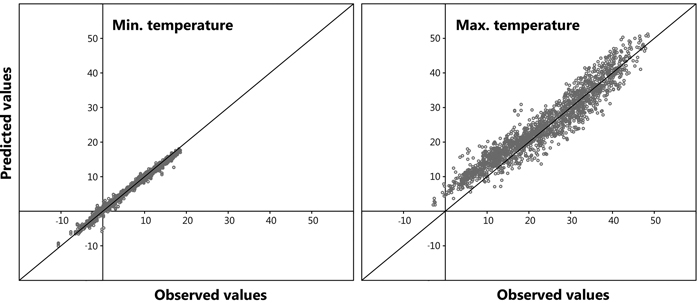
Fig. 7. Model validation: predicted vs. observed values.
Subsequently the developed models were applied to climatic and solar data from the winter seasons between November 2008 and April 2011, encompassing the assumed period of damage. In cases where in-situ air temperature measurements were missing data were substituted from a nearby weather station (Freiburg). A Pearson’s correlation coefficient calculated against data from January 2014 showed a high correlation between the two datasets (r = 0.93, n = 744, p = <0.001) thus validating the substitution. Fig. 8 shows winter periods (November to April) for the winters 2008/09, 2009/10 and 2010/11, the winter 2009/10 constituting the identified potential sun damage year on the study site. It is assumed that high risk days are those with a large daily temperature range that additionally cross 0°C (i.e. the freezing point of water). Furthermore, Fig. 8 shows that the study site does not experience extended periods below freezing point during the given study years, this is typical for the location of the study site. Air temperature shows a diurnal fluctuation, often with a range >20 °C.
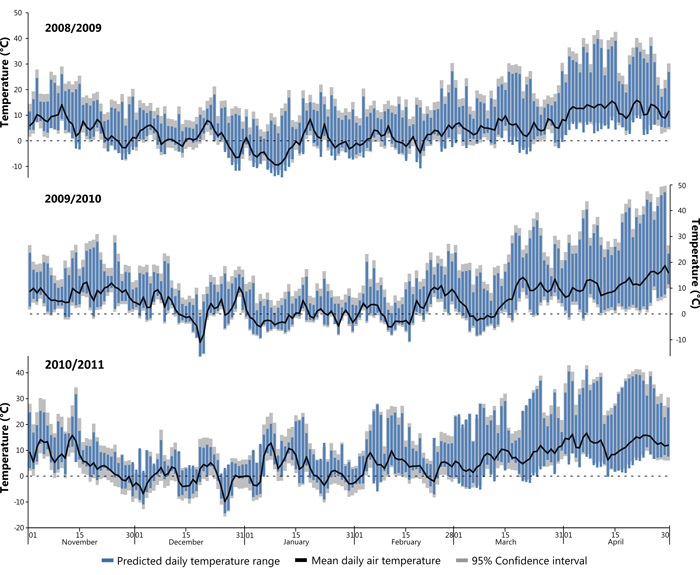
Fig. 8. Modelled daily temperature range for the three successive winters (Nov–Apr) in 2008/09, 2009/10 and 2010/11. View larger in new window/tab.
4 Discussion
Measurements within this study were made on the surface of the bark using K-type thermocouple wire. Nicolai (1986) using measurements made on Fagus sylvatica L. in May remarked that there is little or no temperature difference between surface and cambial temperatures per unit solar radiation for thin barked trees. Measured bark thicknesses of P. avium were in accordance with that described by Prior (1988) and Morhart et al. (2016) presenting bark thicknesses of 3 mm on a single bole face. This ensures the relevance of the external bark surface measurements conducted within this investigation. It is assumed that direct heating was limited as thermocouple wire was insulated leaving only an exposed tip against the measurement site. Nicolai (1986) states that errors in data collected using this method maybe negligible.
Maximum bark surface temperature was recorded to reach 49.1 °C in summer on the SW bole face. Other investigations have also measured extreme maximum temperatures within the cambial tissues of trees: 55 °C on the SW side of spruce (Picea spp.) (Sorauer 1921), 43 °C on P. strobus (Huberman 1943) and 40 °C on F. sylvatica (Nicolai 1986). A prolonged exposure to high temperatures may damage cambium tissues during the growing season. Larcher (2003) suggests a threshold value of 50 °C to cause sun induced damages. A threshold value is likely to be coupled with tree species, its provenance and location, nevertheless, high bark surface temperature on SW facing bole portions present a higher risk of sun induced damage.
This study agrees with both Huberman (1943) and Sakai (1966) who suggest that the temperature on the NE bole face deviates less from air temperature than those bole faces in a SW aspect. In addition the recorded data at 5.5 m on the SW bole face correlates with data recorded on the NE bole face (Fig. 4). This suggests that the critical areas for elevated bark surface temperatures are below 5.5 m on the SW surface. It is possible that the crown under both leaf-on and leaf-off conditions shades the upper parts of the bole and is therefore comparable with the NE bole face which receives no direct insolation. The differences between the SW and NE bole faces were found to reach a maximum of approximately 15 °C on unpainted trees. These results are lower than values reported in the literature. Mix (1916) measured differences of 25 °C on Malus domestica Borkh. in February, Sorauer (1921) found a difference of 16–18 °C on Picea spp. in August, Huber (1935) 30 °C on Pinus spp. during June and July, Hubermann (1943) approximately 20 °C on Pinus Strobus L. in February and Sakai (1966) >15 °C on Kalopanax septemlous (Thunb.) Koidz. in January. However, such measurements present a large range which is dependent on tree species, dimension, location and silvicultural aspects. It is plausible that there was a degree of indirect heating through the bole during exceptionally warm days, thus, raising the temperature of the NE bole face above the temperature that would normally be observed due to ambient air temperature alone. It can also be assumed that this effect will be greater for small diameter boles, often, but not exclusively, younger trees. This may explain elevated maximum temperature recorded on the NE bole face. This corresponds with previous work by Huber (1935) who measured temperature differences at differing depths in a spruce bole. Cambial temperature on the northern face increased during the hours of daylight (i.e. solar influence), but remained close to the recorded ambient air temperature throughout the day. The rate of conduction through the bole will depend on the rate of internal heat transfer a factor influenced by bark properties, wood density and moisture content. Instances where ambient air temperature is warmer than the measured bark surface are possibly attributed to radiative cooling effects, where a warmed surface emits long wave radiation to the sky (Brunt 1932; Gandia 1985), thus cooling it below ambient temperature.
Large within day temperature amplitudes were observed (38.0 °C) see Fig. 6b. Such an event may produce a lessening of the accumulated hardening effect. Increase in temperature must be rapid, coupled with a swift return to temperatures below freezing point such as that observed by Mix (1916) where cambial temperatures fell at a rate of 0.23 °C min–1. It was suggested these circumstances may predispose sunscald damage. Observations from 2013/2014 show that the time of sunrise has a profound effect on the heating of the bark on the SW bole face indicating that insolation is a large contributing factor when considering the temperature of bark on sun exposed bole faces. Temperature fluctuations within the day may provide sufficient lessening of the hardening effect as a contributory causal agent of damage caused by rapid freezing of plant tissues. This may be critical during vulnerable periods such as spring or autumn with the onset or cessation of the growing season. Repeated thaw/freeze events may prove catastrophic for exposed stem faces.
The conditions that provide the potential to induce sun damage to the bark of trees are dependent on specific factors. The major contributing factor is sufficient change in air temperature to cause bark surface temperature on the SW bole face to rise above 0°C after sunrise and return to a sub-zero temperature soon after dusk, this is influenced by the duration of direct solar isolation, the elevation of the sun in the sky, position on the tree bole and is also influenced by climatic variables such as the amount of cloud cover, relative humidity and wind speed. In extreme cases, one or more rapid fluctuations of stem temperature from above to below 0°C and vice versa is possible within one day, this was reported by Harvey (1923a). The rate of temperature decrease past the freezing point is especially crucial, compared to the rate of thawing which is not considered problematic in relation to sun damage (Göppert 1830). In overwintering deciduous trees (i.e. without leaves) Sakai (1966) suggested that the freezing of plant tissues commences at temperatures of –2 to –4 °C, however, the rate of tissue mortality is most likely dependent on the rate of freezing. Chandler (1913) showed that plant tissues derived from fruit trees that were rapidly frozen were demonstrated to be killed at temperatures 4.5 °C higher than those tissues frozen at slower rates. The required range of temperatures and the speed of the thaw/freeze cycle that predispose winter sunscald damages for P. avium is not known, therefore, a set of criteria were proposed to highlight potential sunscald events.
Either ambient temperature remains above 0°C meaning little or no hardening is accrued. Alternatively a normal accumulation of the hardening effect with sub-zero temperatures is achieved but is followed by a warmer period for a number of days where SW bark surface temperature rises above freezing point, thus inducing a loss/reduction of winter hardening. This can be due to high levels of insolation. Finally and most importantly, there must be one or more events within one 24 hour period, where the SW surface bark temperature rises above freezing point on a bright sunny day (with low cloud cover and wind speeds) and rapidly refreezes (Göppart 1890; Harvey 1923a; Wagner and Kuhns 2011). The absence of hardening in combination with a rapid freezing leads to the rupture of the cambial cells causing the damage known as sunscald.
Fig. 8 insinuates a short period in December 2009 where bark surface temperatures on the SW bole face are suggested to sink to –16 °C, the coldest temperature predicted by the models. This event lasting only a couple of days follows a warmer period with average daily air temperature recorded exclusively above 0°C. The study trees are assumed to be under full winter dormancy conditions (leafless with minimal sap flow) at this time, which most likely means that there was no negative effect, nevertheless, it should be pondered as to whether a fully hardened status of the (theoretically dormant) cambial tissues was achieved as a result of such extreme and sudden temperature changes. Events that fell within the late winter/early spring period are considered at a high risk of winter sunscald damage. In these cases the hardening effect is most vulnerable to external influences, while tree boles are exposed to the most intense insolation within the year due to the low angle of the sun (Krenn 1933; Huber 1935; Derby and Gates 1966). Relevant to this is a period during the 2009/10 winter season where a cooler episode is evident during early March (Fig. 8) bounded by minimum temperatures above 0°C followed by a number of potential late frost events in April. The onset of bud burst in spring has been observed to persistently take place during the first half of April (DWD 2015). The consequence of leaves unfurling suggests that sap flow has commenced after winter dormancy and that all remnants of hardening has been lost. A late frost with a large daily range as seen in Fig. 8 during April 2010 may present a high risk period for sunscald damages. It was evident that the winter 2009/2010 was a particularly mild winter, temperatures did not remain below –5 °C for long periods of time and therefore possibly did not accomplish the suggested 3rd stage of hardening. Similar can also be suggested for both the preceding and following years shown within Fig. 8. It is assumed that the presence of snow cover may influence the risk of sunscald damages due to increased reflectance, however, this assumption could not be tested within the study period due to an absence of snow cover. Temperature thresholds predisposing sun damage events are difficult to estimate, as damage is a factor of both cambial temperature and length of exposure (Leers 2013). It is not known if the period of de-hardening was sufficient to cause much loss of frost resistance during late frost events. Besides, Sakai (1966) suggests that damage will not occur unless the temperature drop exceeds the limit of what the tree can withstand, a variable with both genetic and environmental contributing factors.
The application of pruning treatments is of upmost necessity for the production of valuable timber within an AFS (Oosterbaan 2009; Springmann et al. 2011; Morhart et al. 2014), especially when utilising a tree species such as P. avium which does not naturally self-prune well (Pryor 1988; Spiecker and Spiecker 1988; Hein 2009; Springmann et al. 2011). However, the application of such a treatment increases the chance of sun damage by exposing the boles of trees to insolation. A number of methods have been advocated for the mitigation of sun damage risk, often in orchard and urban tree plantings (Mix 1916; Vasilev 1950; Litzow and Pellett 1983; Wagner and Kuhns 2011; Leers 2013). These include physical barriers to prevent insolation raising the temperature of the bole such as boards or matting or a white paint so the bole absorbs less heat. Within this investigation it was seen that the application of white paint, can decrease temperatures at lower heights on the SW face of the tree bole by 3.5 °C during summer periods with high daytime temperatures (Table 3). In early spring differences between painted and unpainted tree boles are more pronounced during peak daytime temperatures. These differences were seen to reach 9 °C, thus, helping to reduce peak temperatures that may cause sun damage. Such large differences may only be seen on days where sunscald damages are most relevant i.e. high levels of insolation, with low cloud cover. By increasing the reflectance of tree boles HTI can be prevented, this management operation is commonly practiced within orchard production systems, at present, less so within AFS. During summer, painted boles present marginally lower maximum temperatures on the NE face, thus suggesting that the reduction in temperature on the SW side may also affect the temperature of the entire bole by a reduction of heat conduction through the bole. Minimum winter bark surface temperatures were unchanged by the application of white paint in both cardinal directions, comparable values between corresponding sensor locations on both painted and unpainted trees can be seen in Fig. 4. Sakai (1966) in Sapporo, northern Japan (latitude: 43°06´N) demonstrated that white paint applied to tree boles reduced the temperature by 12 °C (from 14 °C on untreated stems to 2 °C on sections painted white) in midwinter. The author noted that the application of white paint mimicked white barked birch (Betulus spp.) which was rarely warmed above ambient air temperature.
The use of white paint within AFS although costly and time consuming to apply remains an effective and interesting option to reduce peak bark surface temperatures on trees. Although not explicitly explored within this work, the mitigation of sun damage risk for widely spaced valuable timber trees established within an AFS may also be undertaken utilising silvicultural best practice. Shade casting trees or shrubs may also be retained where possible, the utilisation of shade casting shrubs planted within tree buffer strips in AFS is one further possible solution to mitigate the risk of damage within an AFS by directly shading the bole of crop trees. Most importantly, a considered species choice must be made to match crop trees (i.e. physical bark properties) with projected site conditions under the given management regime.
Acknowledgements
This research was supported by EU FP7 project StarTree (Grant Agreement Number 311919) and the German Federal Ministry of Food and Agriculture (BMEL) within the project Agro-Wertholz (support code 22031112). The authors would like to especially thank Felix Baab for the assembly of measuring devices and their ongoing maintenance in the field and Olaf Grobbel for data download and management. The authors also thank Martin Schinker for valuable assistance with sensor calibration, Jens Lamping of Campbell Scientific Ltd. for technical advice, the two anonymous reviewers whose comments greatly improved this manuscript, and finally to Flügel GmbH for the supply of the Arbo-Flex sun protection paint and LX60 preparation coat. The authors would like to assert no commercial linkage to this or any other commercial organisations mentioned within this manuscript.
References
Balandier P., Dupraz C. (1999). Growth of widely spaced trees. A case study from young agroforestry plantations in France. Agroforestry Systems 43(1): 151–167. http://dx.doi.org/10.1007/978-94-017-0679-7_10.
Brunt D. (1932). Notes on radiation in the atmosphere. I. Quarterly Journal of the Royal Meteorological Society 58(247): 389–420. http://dx.doi.org/10.1002/qj.49705824704.
Burke M.J., Gusta L.V., Quamme H.A., Weiser C.J., Li P.H. (1976). Freezing and injury in plants. Annual Review of Plant Physiology 27 (1): 507–528. http://dx.doi.org/10.1146/annurev.pp.27.060176.002451.
Chandler W.H. (1913). The killing of plant tissue by low temperature. Research Bulletin No 8. University of Missouri, College of Agriculture, Columbia, Missouri. 309 p. http://dx.doi.org/10.5962/bhl.title.17385.
Derby R.W., Gates D.M. (1966). The temperature of tree trunks-calculated and observed. American Journal of Botany 53(6): 580–587. http://dx.doi.org/10.2307/2440008.
DWD (Deutscher Wetterdienst) (2015). Web-based weather request and distribution system (WebWerdis). http://www.dwd.de/webwerdis. [Cited 15 June 2015].
Gandia S., Melia J., Segarra D. (1985). Application of a radiative cooling model to daily minimum temperature prediction. Journal of Climatology 5(6): 681–686. http://dx.doi.org/10.1002/joc.3370050610.
Ghosh D. (2013). Living on the bark. Resonance 18(1): 51–66. http://dx.doi.org/10.1007/s12045-013-0007-5.
Göppert J. (1830). Über die Wärmeentwicklung in den Pflanzen, deren Gefrieren und die Schutzmittel gegen dasselbe. Josef Max and Comp., Breslau. 273 p.
Harvey R.B. (1923a). Cambial temperatures of trees in winter and their relation to sun scald. Ecology 4(3): 261–265. http://dx.doi.org/10.2307/1929049.
Harvey R.B. (1923b). Relation of the color of bark to the temperature of the cambium in winter. Ecology 4(4): 391–394. http://dx.doi.org/10.2307/1929185.
Hein S. (2009). Modeling natural pruning of common ash, sycamore and wild cherry. In: Spiecker H., Hein S., Makkonen-Spiecker K., Thies M. (eds.). Valuable broadleaved forests in Europe. European Forest Institute research report 22. Brill, Leiden, Boston. p. 103–122.
Huber B. (1935). Der Wärmehaushalt der Pflanzen. Volume 17. Dr FP Datterer & Cie, Freising. 148 p.
Huberman M.A. (1943). Sunscald of eastern white pine, Pinus Strobus L. Ecology 24(4): 456–471. http://dx.doi.org/10.2307/1930557.
IBM (2013). SPSS statistics for Windows. Version 22.0. IBM Corp., Armonk, NY.
Krenn K. (1933). Die Bestrahlungsverhältnisse stehender und liegender Stämme. Wiener Allgemeine Forst- und Jagd Zeitung 51: 50–51.
Larcher W. (2003). Physiological plant ecology. Ecophysiology and stress physiology of functional groups. 4th ed. Springer, Berlin, New York. 513 p. http://dx.doi.org/10.1007/978-3-662-05214-3.
Leers M. (2013). Tree establishment in the urban environment. In: G. Williams (ed.). The 14th National Street Tree Symposium, Adelaide, 4th and 5th September 2013. p. 53–67.
Levitt J. (1980). Responses of plants to environmental stresses. Volume 1: chilling, freezing and high temperature stresses. 2. ed. Physiological ecology. Academic Press, New York. 497 p.
Litzow M., Pellett H. (1983). Materials for potential use in sunscald prevention. Journal of Arboriculture 9(2): 35–38.
Mary F., Dupraz C., Delannoy E., Liagre F. (1998). Incorporating agroforestry practices in the management of walnut plantations in Dauphiné, France: an analysis of farmers‘ motivations. Agroforestry Systems 43(1–3): 243–256. http://dx.doi.org/10.1023/A:1026425307959.
Mix A.J. (1916). Sun scald of fruit trees – a type of winter injury. Cornell University. Bulletin 382: 283–284. http://dx.doi.org/10.5962/bhl.title.37253.
Morhart C., Sheppard J.P., Schuler J.K., Spiecker H. (2016). Above-ground woody biomass allocation and within tree carbon and nutrient distribution of wild cherry (Prunus avium L.) – a case study. Forest Ecosystems 3(4). http://dx.doi.org/10.1186/s40663-016-0063-x.
Morhart C.D., Douglas G.C., Dupraz C., Graves A.R., Nahm M., Paris P., Sauter U.H., Sheppard J., Spiecker H. (2014). Alley coppice – a new system with ancient roots. Annals of Forest Science 71(5): 527–542. http://dx.doi.org/10.1007/s13595-014-0373-5.
Nicolai V. (1986). The bark of trees: thermal properties, microclimate and fauna. Oecologia 69(1): 148–160. http://dx.doi.org/ 10.2307/4217921.
NOAA (U.S. Department of Commerce, National Oceanic & Atmospheric Administration, NOAA Research. Earth System Research Laboratory, Global Monitoring Division) (2015). NOAA Solar Calculator. http://www.esrl.noaa.gov/gmd/grad/solcalc/. [Cited 15th June 2015].
Olien C.R. (1967). Freezing stresses and survival. Annual Review of Plant Physiology 18(1): 387–408. http://dx.doi.org/10.1146/annurev.pp.18.060167.002131.
Oosterbaan A., Hochbichler E., Nicolescu N.V., Spiecker H. (2009). Silvicultural principles, goals and measures in growing valuable broadleaved tree species. Die Bodenkultur 60(3): 45–51.
Pryor S.N. (1988). The silviculture and yield of wild cherry. Forestry Commission Bulletin No 75. Her Majesty’s Stationery Office, London. 23 p.
Roppolo D.J., Miller R. (2001). Factors predisposing urban trees to sunscald. Journal of Arboriculture 27(5): 246–254.
Sakai A. (1966). Temperature fluctuation in wintering trees. Physiologia Plantarum 19(1): 105–114. http://dx.doi.org/10.1111/j.1399-3054.1966.tb09080.x.
Seifert T., Nickel M., Pretzsch H. (2010). Analysing the long-term effects of artificial pruning of wild cherry by computer tomography. Trees – Structure and Function 24(5): 797–808. http://dx.doi.org/10.1007/s00468-010-0450-9.
Sorauer P. (1921). Handbuch der Pflanzenkrankheiten. Die nichtparasitären Krankheite, Vol. 1. Parey, Berlin. 959 p.
Spiecker M., Spiecker H. (1988). Erziehung von Kirschenwertholz. AFZ-DerWald 20: 562–565.
Springmann S., Rogers R., Spiecker H. (2011). Impact of artificial pruning on growth and secondary shoot development of wild cherry (Prunus avium L.). Forest Ecology and Management 261(3): 764–769. http://dx.doi.org/10.1016/j.foreco.2010.12.007.
Stoutjesdijk P. (1977). High surface temperatures of trees and pine litter in the winter and their biological importance. International Journal of Biometeorology 21(4): 325–331. http://dx.doi.org/10.1007/BF01555192.
Vasilev I.M. (1950). Winter and spring ”burn” of fruit trees and its control. Sad i Ogorod 1: 15–17.
Wagner K., Kuhns M.R. (2011): Sunscald injury or southwest injury on deciduous trees. Utah State Univ., Extension Forest Facts, NR/FF/021 (pr). 4 p.
Wulf A., Kehr R. (2009). Diseases, disorders and pests of selected valuable broadleaved tree species. In: Spiecker H., Hein S., Makkonen-Spiecker K., Thies M. (eds.). Valuable broadleaved forests in Europe. European Forest Institute research report 22. Brill, Leiden, Boston. p. 61–87. http://dx.doi.org/10.1163/ej.9789004167957.i-256.
Total of 39 references.
