Hanne K. Sjølie  ,
Hans Asbjørn Kårstad Sørlie,
Bjørn Tveite,
Birger Solberg
,
Hans Asbjørn Kårstad Sørlie,
Bjørn Tveite,
Birger Solberg
The performance of two Swedish N fertilization functions evaluated on data from Norwegian fertilization experiments
Sjølie H. K., Sørlie H. A. K., Tveite B., Solberg B. (2015). The performance of two Swedish N fertilization functions evaluated on data from Norwegian fertilization experiments. Silva Fennica vol. 49 no. 4 article id 1330. https://doi.org/10.14214/sf.1330
Highlights
- The performance of two predictive Swedish fertilization growth response functions was assessed on data from Norwegian fertilization experiments
- One function performed well on the full dataset, but overpredicted the growth response in spruce plots and underpredicted in pine plots
- The second function performed well in pine stands, but overestimated the growth response in spruce and in total.
Abstract
This study compares the responses of two Swedish 5-year predictive stand-level functions with the observed responses in 721 fertilization experiment plots in Norway fertilized with nitrogen (N). All plots are single-species consisting of Norway spruce (Picea abies (L.) H. Karst.) or Scots pine (Pinus sylvestris L.) fertilized with ammonium nitrate (AN) or urea. The correlations between the observed and the two predicted responses were 0.34–0.40 for all plots taken together. One response function performed well on average, but underestimated the response in pine plots and overestimated the response in spruce plots. The second function overpredicted the response on the full dataset, in spruce plots and old forest, but performed well in pine plots. Both functions overestimated the growth response in high-productive plots. Higher N deposition in Norway than in Sweden may count for parts of the deviations. Testing of fertilization functions on new datasets is rare, but important part of the evaluation of functions. As the functions are not well fit for predicting the growth response in spruce and high-productive plots in our sample, new functions that include N deposition are welcome.
Keywords
Pinus sylvestris;
Picea abies;
forest production;
forest fertilization;
predictive functions
-
Sjølie,
Department of Ecology and Natural Resource Management, Norwegian University of Life Sciences, NO-1432 Ås, Norway
E-mail
hanne.sjolie@nmbu.no
- Sørlie, Department of Ecology and Natural Resource Management, Norwegian University of Life Sciences, NO-1432 Ås, Norway E-mail hans.asbjorn.sorlie@slf.dep.no
- Tveite, Norwegian Forest and Landscape Institute, P.O. Box 115, NO-1431 Ås, Norway E-mail bjorn.tveite@skogoglandskap.no
- Solberg, Department of Ecology and Natural Resource Management, Norwegian University of Life Sciences, NO-1432 Ås, Norway E-mail birger.solberg@nmbu.no
Received 6 March 2015 Accepted 10 June 2015 Published 24 June 2015
Views 83293
Available at https://doi.org/10.14214/sf.1330 | Download PDF

Supplementary Files
1 Introduction
A key factor affecting the productivity in boreal forests is the amount of available nitrogen in the soil (Tamm 1991). Across the Nordic countries, nitrogen (N) fertilization has been shown to increase growth in plots of Norway spruce (Picea abies (L.) H. Karst.) and Scots pine (Pinus sylvestris L.) (Rosvall 1980; Kukkola and Saramäki 1983; Sture 1984; Pettersson 1994).
Suitable predictive functions of growth response to fertilization are important for assessing profitability and thus aiding forest owners to prioritize investments, in addition to evaluate carbon sequestration effects. The two response functions Rosvall (1980) and Pettersson (1994) predict the growth response over the first five years and are much used in the Nordic countries. To our best knowledge, no assessments of how these functions perform on new datasets have been carried out. However, model validation is important part of model evaluation (Rykiel 1996).
Numerous fertilization experiments were established in Norway during the 1950s and 1960s (Nilsen 2001). However, only parts of the experiments were reported and analyzed, mainly in Brantseg et al. (1970) and Sture (1984), and no predictive functions were developed. Swedish functions are dominating, in both research and commercial forestry in Norway. The Rosvall response functions are included in the stand simulator Gaya (Hoen and Eid 1990; Raymer et al. 2009). Gaya is much applied for forest policy and economics analyses, notable the domestically important study of climate change mitigation potentials “Klimakur” (Norwegian Ministry of Food and Agriculture 2009), and has also been used in commercial forest planning (Trømborg and Bergseng 2003). A recent governmental report on forest fertilization (Norwegian Ministry of Climate and Environment 2012) bases its assessments on inter alia the Rosvall (1980) and Pettersson (1994) functions.
The objective of the study underlying this research note was to evaluate how two Swedish stand-level response functions perform on a new dataset. The test data stem from Norwegian forest fertilization experiments as parts of a large dataset that only to a limited degree have been used for analyses.
2 Material and methods
2.1 Dataset for testing
The two response functions investigated in this study, Rosvall (1980) and Pettersson (1994), predict the growth response the first five years succeeding fertilization. The tested functions are described in the supplementary file and presented in Table S1. Throughout the paper, all volumes are reported with bark.
A large fertilization experiment was established by the Norwegian Forest and Landscape Institute in the timespan 1959–1971 consisting of 68 experimental sites with a total of 1892 plots located on mineral soils in various places in Eastern and Central Norway. The experiments were established as bloc trials with each bloc consisting of 6 to 16 plots, one of which was control. Nitrogen was added in the form of urea or ammonium nitrate (AN), either alone or in combination with potassium (K) and phosphorus (P). The data have been published by Sture (1984). We included the plots that had been fertilized once with known fertilizer and dosage, totaling 721 plots from 51 sites. All plots consisted of one tree species, 420 plots of pine and 301 plots of spruce; 521 plots were fertilized with AN and 200 with urea (Table 1).
| Table 1. Description of the data used for testing the fertilization functions. Basal area, volume, age and current annual increment (CAI) refer to values at time of fertilizer application. AN is ammonium nitrate. Observed response (m3 ha–1 5 yr–1) is over bark. View in new window/tab. |
2.2 Calculation of response to N fertilizer
We used the response to fertilization as calculated by Sture (1984) and validated by Mønness (1991), comparing each experimental plot to an unfertilized control plot in the same bloc. Because of unexplained differences in volume growth between the control and test plot prior to fertilization, the growth response was calculated by adjusting for differences in basal area growth between the plots by using the quotient method. The volume increment was assumed to be proportional to the basal-area increment (NLH 1987). The effect of the fertilization on stand growth over five years (E5 in m3 ha–1 5 yrs–1) is thus

where VI is the observed volume increment on the fertilized plot (m3 ha–1 5 yrs–1), VIc the observed volume increment (m3 ha–1 5 yrs–1) in the control plot. Dg5 is the observed basal-area increment (m2 ha–1 yr–1) in the experimental plot and Dg5c the observed basal-area increment (m2 ha–1 yr–1) in the control plot, both over the last five years prior to treatment.
The Norwegian H40 classification system refers to the average height of the 100 trees with the largest stem diameter per hectare at breast height age of 40 years (NLH 1987), while the Swedish H100 system uses the dominant tree height at total stand age of 100 years as reference (Eriksson and Johansson 1993). To convert the site index from H40 to H100, Tveite’s (1980) conversion functions were used:
Spruce: H100 = 2.947*H400.7812
Pine: H100 = 2.2401*H400.8619
The predicted responses were compared to the observed responses in several ways: visual inspection, Pearson correlation coefficients, regression, standard deviations and two-sided t-tests of the mean differences between the predicted and observed values with significance level set to 0.05. The procedures were repeated for subsets of the data.
3 Results
The correlation coefficients between the observed and predicted responses r for the entire dataset equaled 0.40 for Pettersson and 0.34 for Rosvall. Both models overestimated the growth in our sample, by 0.75 and 0.13 m3 ha–1 5 yrs–1 for the Pettersson and Rosvall function, respectively (Table 2), with the mean of the Pettersson predicted responses differing significantly from the mean of the observed values. The standard deviations of the mean errors were about the same for most subsets, varying from 3.87 to 5.26 m3 ha–1 5 yrs–1. The scatterplot of predicted versus observed responses are presented in Fig. 1.
| Table 2. Means and standard deviations (SD) of observed 5-year response, and means and SD of differences between the predictive Pettersson (1994) and Rosvall (1980) functions’ responses and observed responses for all plots and subset of plots. “Difference” in bold indicates significant difference between mean 5-year predicted and observed response (p < 0.05). r = correlation coefficient. Means and SD in m3 ha–1 5 yrs–1 above bark. AN is ammonium nitrate. | |||||||||
| 5 year observed response | Pettersson | Rosvall | |||||||
| Dataset | N | Mean | SD | Difference | SD | r | Difference | SD | r |
| All plots | 721 | 5.12 | 4.63 | 0.75 | 4.57 | 0.40 | 0.13 | 4.64 | 0.34 |
| Spruce | 301 | 4.24 | 4.53 | 1.64 | 5.04 | 0.19 | 1.36 | 5.2 | 0.16 |
| Pine | 420 | 5.76 | 4.61 | 0.11 | 4.09 | 0.53 | -0.80 | 3.97 | 0.52 |
| AN | 521 | 5.4 | 4.64 | 0.67 | 4.56 | 0.42 | 0.03 | 4.63 | 0.37 |
| Urea | 200 | 4.42 | 4.57 | 0.95 | 4.62 | 0.30 | 0.39 | 4.66 | 0.23 |
| Spruce AN | 214 | 4.66 | 4.56 | 1.28 | 5.02 | 0.23 | 1.02 | 5.26 | 0.19 |
| Spruce Urea | 87 | 3.2 | 4.31 | 2.52 | 5.00 | 0.07 | 2.22 | 4.98 | 0.06 |
| Pine AN | 307 | 5.91 | 4.62 | 0.25 | 4.16 | 0.54 | -0.70 | 4.01 | 0.53 |
| Pine Urea | 113 | 5.35 | 4.56 | -0.26 | 3.91 | 0.53 | -1.01 | 3.87 | 0.53 |
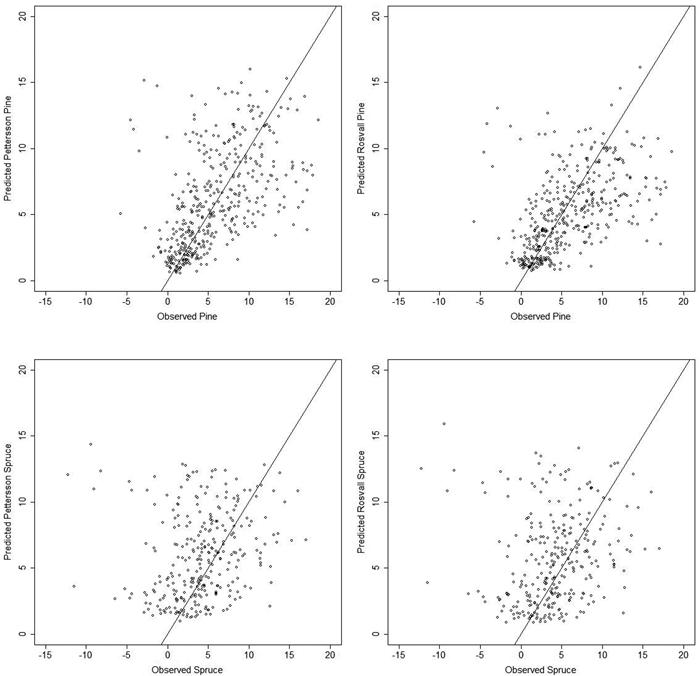
Fig. 1. Scatterplot for 5-year predicted response versus 5-year observed response to N fertilization, all numbers in m3 ha–1 5 yrs–1 above bark. Predicted functions from Pettersson (1994) (Left) and Rosvall (1980) (Right), observed Pine responses top and observed Spruce responses bottom. View larger in new window/tab.
For both functions, the correlation coefficients were 0.52–0.54 for the whole set of pine plots as well as for the subsamples of pine plots fertilized with AN or urea. However, the Rosvall function significantly underestimated the response in pine plots, with the mean error ranging from -0.70 to -1.01 m3 ha–1 5 yrs–1. Both functions overpredicted the response in spruce plots, in particular those fertilized with urea, where the mean differences from the observed values were greater than 2 m3 ha–1 5 yrs–1 and the correlation coefficients 0.06–0.07.
The tested functions do not include combination of N with other fertilizers as explanatory variable. It was, thus, of interest to test how the functions performed on plots that had been fertilized only with N compared to plots fertilized with N in combination with P and K. T-tests of the observed mean responses did not suggest significant differences between the plots only fertilized with N and those fertilized with NPK combinations. The same t-tests that were performed on the entire sample were executed on the plots that were fertilized only with N (data not shown). Compared to the samples fertilized with NPK combinations, the main trends of differences between the observed and predicted responses’ means were maintained in the subsamples fertilized only with N, with a few exceptions. Rosvall’s significant underpredictions of the pine stands and Pettersson’s significant overprediction of the urea subsample were turned into non-significant differences.
Alternative tests of goodness-of-fit where each predictive response was regressed on the observed response (Rose and Smith 1998) confirmed the correlation results. The coefficients of determination r2 were 0.16 for the Pettersson function and 0.12 for Rosvall when regressed on the observed responses of the entire sample. For the pine sample, the r2 were 0.29 for the Pettersson function and 0.27 for Rosvall. The corresponding numbers for the spruce sample were 0.03 and 0.04, respectively.
The mean differences between the predicted and observed responses were compared across levels of continuous variables (Fig. 2). The Pettersson function overestimated the response in old forest (115 years or older, N = 108) by 1.7 m3 ha–1 5 yrs–1, which counted for a large part of the overprediction in the full dataset of 0.75 m3 ha–1 5 yrs–1 (Table 2). Removing these old-growth plots from the sample reduced the overestimation to 0.58 m3 ha–1 5 yrs–1; however, the mean error was still significant. 78% of the old-forest plots in the sample consisted of pine. Both predictive functions overestimated considerably the response in plots with high volumes, increment and site index. T-tests on the subset of 643 plots where current annual increment (CAI) < 6 m3 ha–1 yr–1 and H100 < 25 indicated that the predicted means were not significantly different from the observed means in low-to-medium productive plots.
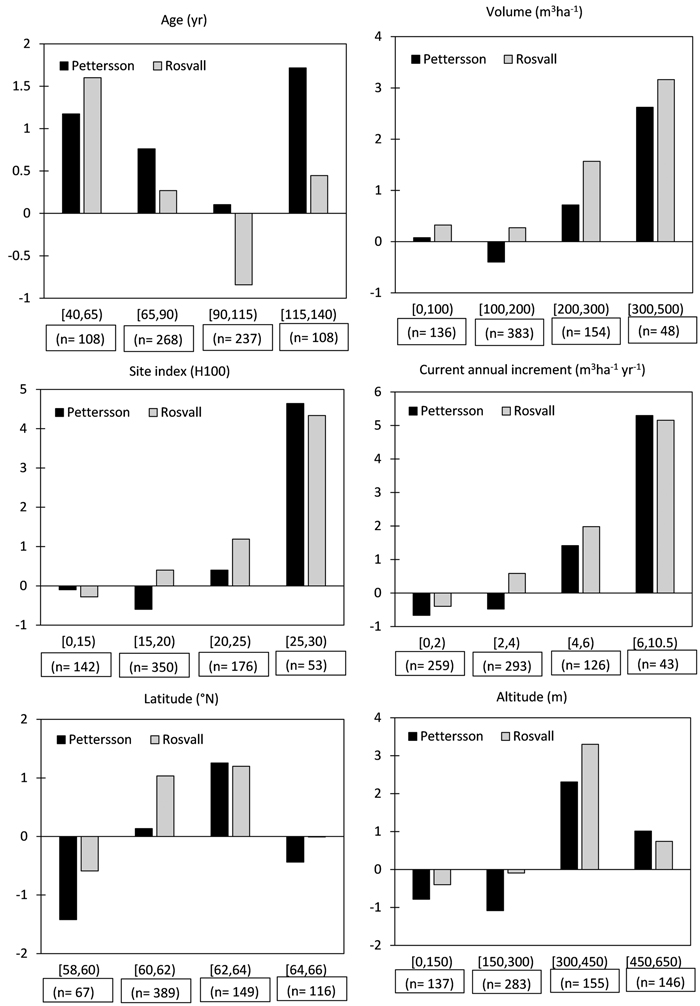
Fig. 2. Mean differences between predicted response to fertilization by the Pettersson and Rosvall functions and observed values, within levels of variables. All y axes are in m3 ha–1 5 yrs–1 above bark.
4 Discussion
The Pettersson function fitted well the observed results for pine, but predicted too high response for spruce and old forest. Rosvall overpredicted the response in spruce plots and underpredicted in pine plots; these partly offset each other and Rosvall’s function yielded the smallest mean error on all plots together.
On average, the Pettersson function predicted 0.62 m3 ha–1 5 yrs–1 higher response than the Rosvall function; this is in contrast to earlier findings of the Pettersson predictions being slightly lower than the Rosvall’s (Pettersson 1994). This may be explained by the fact that the Norwegian plots consist of relatively old forest, where the Pettersson function predicts the highest response.
N deposition in Norway varied during the 1990s from 20 kg ha–1 yr–1 on the southwestern corner to less than 2 kg ha–1 yr–1 in the inland (Solberg et al. 2004). These levels are considerably higher than in Sweden (Lövblad 2000) and may have led to 25% increase in forest growth in southernmost Norway (Solberg et al. 2004); thus potentially contribute to the lower observed effects of fertilization. The response functions reports (Rosvall 1980; Pettersson 1994) provide limited information regarding the selection of sample plots and for which use the functions were intended and Sture (1984) does not notify which volume functions were used for the response calculations. New predictive functions providing more information of sampling and methods based on Norwegian experimental plots would thus be welcome, in particular for spruce and high-productive forest. Such models should ideally include N deposition. In addition, more assessments of the tested fertilization models would be appreciated in order to gain wider knowledge of their performance on new datasets.
References
Brantseg A., Brekka A., Braastad H. (1970). Fertilization experiments in spruce and pine forest. [Gjødslingsforsøk i gran- og furuskog]. Meddr. norske Skogfors Ves. 27: 537–607. Norwegian Forest and Landscape Institute, Ås, Norway. [In Norwegian].
Eriksson H., Johansson U.L.F. (1993). Yields of Norway spruce (Picea abies (L.) Karst.) in two consecutive rotations in southwestern Sweden. Plant and Soil 154(2): 239–247. http://dx.doi.org/10.1007/BF00012529.
Hoen H.F., Eid T. (1990). A model for analysis of treatment strategies for a forest applying standvice simulations and linear programming. [En modell for analyse av behandlingsalternativer for en skog ved bestandssimulering og lineær programmering]. Report 9/90. Norwegian Forest Research Institute, Ås, Norway. 35 p. [In Norwegian].
Kukkola M., Saramäki J. (1983). Growth response in repeatedly fertilized pine and spruce stands on mineral soils. Communicationes Instituti Forestalis Fenniae 114: 1–55.
Lövblad G. (2000). Nitrogen deposition now and in the future. In: Bertills U., Näsholm T. (eds.). Effects of nitrogen deposition on forest ecosystems. Report 5067. Swedish Environmental Protection Agency, Stockholm, Sweden. p. 21–28.
Mønness E.N. (1991). Estimating annual increment response to forest fertilization: a comparison of methods by uniformity trials. Forest Science 37(1): 123–135.
Nilsen P. (2001). Fertilization experiments on forest mineral soils: a review of the Norwegian results. Scandinavian Journal of Forest Research 16(6): 541–554. http://dx.doi.org/10.1080/02827580152699376.
NLH (1987). Handbok for planlegging i skogbruket. [Hand book for forestry planning]. Institutt for skogtaksasjon, Institutt for skogøkonomi, Norges Landbrukshøgskole. [Norwegian University of Life Sciences]. 223 p. [In Norwegian].
Norwegian Ministry of Climate and Environment (2012). Norwegian climate policy. [Norsk klimapolitikk]. White paper No. 21 2011–2012. [In Norwegian].
Norwegian Ministry of Agriculture and Food (2009). Climate challenges – agriculture part of the solution. [Klimautfordringene - landbruket en del av løsningen]. White paper No. 39 2008–2009.
Pettersson F. (1994). Predictive functions for impact of nitrogen fertilization on growth over five years. Report 3. The Forestry Research Institute of Sweden. 56 p.
Raymer A.K., Gobakken T., Solberg B., Hoen H.F., Bergseng E. (2009). A forest optimisation model including carbon flows: application to a forest in Norway. Forest Ecology and Management 258(5): 579–589. http://dx.doi.org/10.1016/j.foreco.2009.04.036.
Rose K.A., Smith E.P. (1998). Statistical assessment of model goodness-of-fit using permutation tests. Ecological Modelling 106: 129–139. http://dx.doi.org/10.1016/S0304-3800(97)00188-9.
Rosvall O. (1980). Predictive equations for the estimation of fertilizer responses in Sweden. [Prognosinstrument för gödslingseffekter]. Information Gödling NR 1. The Forestry Research Institute of Sweden. 9 p. [In Swedish].
Rykiel E.J. (1996). Testing ecological models: the meaning of validation. Ecological Modelling 90: 229–244. http://dx.doi.org/10.1016/0304-3800(95)00152-2.
Solberg S., Andreassen K., Clarke N., Tørseth K., Tveito O.E., Strand G.H., Tomter S. (2004). The possible influence of nitrogen and acid deposition on forest growth in Norway. Forest Ecology and Management 192 (2–3): 241–249. http://dx.doi.org/10.1016/j.foreco.2004.01.036.
Sture S. (1984). Fertilization experiments in spruce and pine forest. [Gjødslingsforsøk i gran- og furuskog]. Norwegian Forest and Landscape Institute, Ås, Norway. [In Norwegian].
Tamm C.O. (ed.). (1991). Nitrogen in terrestrial ecosystems, questions of productivity, vegetational changes, and ecosystem stability. Ecological Studies No. 81. Springer, Berlin. 115 p.
Trømborg E., Bergseng E. (2003). Forest management adapted to markets and value added. [Markedstilpasset skogbehandling og verdiskapning]. Project report, Prevista. Kongsberg, Norway. 60 p. [In Norwegian].
Tveite B. (1980). Relationship between Swedish site index system (H100) and Norwegian site index system (H40). [Samband mellom svensk boniteringssystem og (H100) og norsk boniteringssystem (H40)]. Internal Note. Norwegian Forest and Landscape Institute, Ås, Norway. [In Norwegian].
Total of 20 references
