Abolfazl Daneshvar,
Mulualem Tigabu  ,
Asaddollah Karimidoost,
Per Christer Oden
,
Asaddollah Karimidoost,
Per Christer Oden
Single seed Near Infrared Spectroscopy discriminates viable and non-viable seeds of Juniperus polycarpos
Daneshvar A., Tigabu M., Karimidoost A., Oden P. C. (2015). Single seed Near Infrared Spectroscopy discriminates viable and non-viable seeds of Juniperus polycarpos. Silva Fennica vol. 49 no. 5 article id 1334. https://doi.org/10.14214/sf.1334
Highlights
- Near Infrared (NIR) Spectroscopy discriminates viable and non-viable (empty, insect-attacked and shriveled) seeds of J. polycarpos with 98% and 100% accuracy, respectively
- The origins of spectral differences between non-viable and viable seeds were attributed to differences in seed coat chemical composition and storage reserves
- The results demonstrate that NIR spectroscopy has great potential as seed sorting technology to ensure precision sowing.
Abstract
A large quantity of non-viable (empty, insect-attacked and shriveled) seeds of Juniperus polycarpos (K. Koch) is often encountered during seed collection, which should be removed from the seed lots to ensure precision sowing in the nursery or out in the field. The aims of this study were to evaluate different modelling approaches and to examine the sensitivity of the change in detection system (Silicon-detector in the shorter vis-a-vis InGsAs-detector in the longer NIR regions) for discriminating non-viable seeds from viable seeds by Near Infrared (NIR) spectroscopy. NIR reflectance spectra were collected from single seeds, and discriminant models were developed by Partial Least Squares – Discriminant Analysis (PLS-DA) and Orthogonal Projection to Latent Structures – Discriminant Analysis (OPLS-DA) using the entire or selected NIR regions. Both modelling approaches resulted in 98% and 100% classification accuracy for viable and non-viable seeds in the test set, respectively. However, OPLS-DA models were superb in terms of model parsimony and information quality. Modelling in the shorter and longer wavelength region also resulted in similar classification accuracy, suggesting that prediction of class membership is insensitive to change in the detection system. The origins of spectral differences between non-viable and viable seeds were attributed to differences in seed coat chemical composition, mainly terpenoids that were dominant in non-viable seeds and storage reserves in viable seeds. In conclusion, the results demonstrate that NIR spectroscopy has great potential as seed sorting technology to upgrade seed lot quality that ensures precision sowing.
Keywords
NIRS;
OPLS;
seed sorting;
Iran;
juniper;
near infrared spectroscopy
- Daneshvar, Swedish University of Agricultural Sciences, Southern Swedish Forest Research Centre, P.O. Box 49, SE-230 53, Alnarp, Sweden; (permanent address) Department of Natural Resources, Gonbad Kavous University, Shahid Fallahi Street, P.O. Box 163, Gonbad, Iran E-mail abolfazl.daneshvar@slu.se
-
Tigabu,
Swedish University of Agricultural Sciences, Southern Swedish Forest Research Centre, P.O. Box 49, SE-230 53, Alnarp, Sweden
E-mail
mulualem.tigabu@slu.se
- Karimidoost, Agriculture and Natural Resources Research Center of Golestan Province, Beheshti Ave. P.O. Box 4915677555, Gorgan, Iran E-mail karimidoost@yahoo.com
- Oden, Swedish University of Agricultural Sciences, Southern Swedish Forest Research Centre, P.O. Box 49, SE-230 53, Alnarp, Sweden E-mail per.oden@slu.se
Received 13 March 2015 Accepted 24 August 2015 Published 3 September 2015
Views 115301
Available at https://doi.org/10.14214/sf.1334 | Download PDF

1 Introduction
Pollination failure and post-zygotic degeneration are common phenomena in many conifers, including juniper, which eventually results in production of a large quantity of empty and dead-filled seeds (Slobodník and Guttenberger 2000; Ahani et al. 2013). These seeds generally lack the miniature plant – embryo – and hence fail to produce seedlings when sown. Insect attack is another factor that reduces the quality of seed lots by consuming entirely or partly the storage reserves and embryos (Schelin et al. 2004; Tigabu et al. 2007), resulting in germination failure when sown. Environmental conditions during seed development, such as temperature extremes, also result in post-zygotic degeneration, culminating at production of dead-filled or shriveled seeds (Gutterman 2000). As a result, a substantial quantity of empty, insect-attacked, shriveled and dead-filled seeds is often encountered in seed bulks during seed collection. These non-viable seeds should be removed from the seed bulk during seed clean stage in order to produce the desired quantity of seedlings when sown in the nursery or directly out in the field.
The quality of a given seed lot can be upgraded using a variety of seed sorting techniques. Flotation on liquid media, such as the Incubation, Drying and Separation (IDS) technique, is proven successful for some conifer (Simak 1984; Downie and Wang 1992; Demelash et al. 2002) and broad-leaved species (Demelash et al. 2003). However, the success of the flotation method is species-specific and complete separation is far from being achieved due to differences in water uptake by dry seeds, water holding capacity of individual seeds during drying, and the inadequacy of density gradient during separation (Tillman-Sutela and Kauppi 1995; Tigabu and Odén 2003). Thus, there is still a large scope for further improvement of seed sorting technology that possibly ensures complete separation across species.
Near infrared (NIR) spectroscopy would be the best candidate technique for single seed sorting, as the technique is extremely rapid and non-destructive (Agelet and Hurburgh 2014). It works on the principle of absorption of near infrared radiation by bonds between light atoms, such as C – H, O – H and N – H in biological samples that result in overtones and combination bands detectable in the 780–2500 nm wavelength region (Workman and Weyer 2012). Previous studies have demonstrated the feasibility of NIR spectroscopy for sorting insect-infested seeds (Tigabu and Odén 2002; 2003a; 2004; Tigabu et al. 2004; 2007), empty seeds (Tigabu and Odén 2003b; 2004), and dead-filled seeds of few tree species (Lestander and Odén 2002; Soltani et al. 2003). Further testing of the technique on several tree species is paramount to establish NIR spectroscopy as a potent seed sorting technique.
To our knowledge, there is no study that attempted to apply NIR technology for simultaneously sorting filled-viable, empty, insect-attacked and shriveled seeds of juniper, except the study by Tigabu et al. (2007) that reported discrimination of sound and insect-damaged seeds of Juniperus procera Hochst. ex Endl. with 90% accuracy using Visible + NIR spectroscopy. The present study is unique in that NIR spectroscopic data were modelled for simultaneous discrimination of viable and non-viable seeds of Juniperus polycarpos (K. Koch).
J. polycarpos is one of the six native juniper species in Iran, naturally distributed along the southern slopes of Alborz mountain chain, Northeastern Iran at altitudes ranging from 750 to 3400 m above sea level. In its natural habitat, juniper populations are extremely small and fragmented due to anthropogenic disturbance and insufficient natural regeneration due to poor seed lot quality (Aliahmad-Korouri and Khoshnevis 2000; Ahani et al. 2013). Owing to its ecological and economic importance, there is a great interest to restore the juniper forests in Iran, which in turn needs methods for upgrading seed lot quality that ensure artificial regeneration of juniper forest (Ahani et al. 2013). Thus, the aims of this study were to evaluate different modelling approaches for discriminating non-viable seeds from viable seeds by NIR spectroscopy, and to examine the sensitivity of the change in detection system (Silicon-detector in the shorter vis-a-vis InGsAs-detector in the longer NIR regions) in discrimination of J. polycarpos seeds based on viability.
2 Materials and methods
2.1 Preparation of seed samples
Juniper cones were collected from 40 phenotypically superior trees (1 kg per tree) with well-developed crown and abundant cones on Alborz mountain chain in Northeastern Iran. The cones were de-pulped, and seeds were extracted manually; thereafter cleaned with detergent to remove the resin, air-dried and stored in separate plastic bags at 5 °C in a refrigerator until the study was carried out. A random sample of 500 seeds was drawn from 20 trees and thoroughly mixed to serve as a working sample. Seeds of J. polycarpos were sorted into viable, empty, insect-attacked and shriveled seeds by taking a series of X-ray images. Seeds with visible embryonic axis and megagametophyte (storage organ) were considered as filled-viable, seeds devoid of megagametophyte and embryo were considered as empty, seeds with visible exit holes made by the emerging insect were considered as insect-attacked and seeds with a mass of undifferentiated black tissue were considered as shriveled seeds.
After NIR analysis, the viability of seeds in the different seed lot fractions was further attested by topographical tetrazolium test (TTC) following the standard procedure (International Seed Testing Association 2010). TTC test is a well-established method for quickly estimating the viability of seeds, particularly dormant seeds that need dormancy breaking treatments to germinate. Note that seeds of J. polycarpos have morpho-physiological dormancy and methods for breaking this dormancy is still under investigation. The general principle of TTC is that when seeds are soaked in a colorless soluble 2,3,5 triphenyl tertrazolium chloride solution for a given time in darkness (24 hours in our case), viable seeds convert the compound into a stable and non-diffusible red compound (2,3,5 triphenyl formazan); hence viable and non-viable seeds can easily be differentiated based on red staining. A total of 400 seeds (100 seeds per each seed lot fraction) were correctly identified by X-ray analysis and TTC test and used for NIR spectroscopic analysis. For validating the discriminant models, a random sample of 200 seeds were drawn from seed lots of the remaining 20 trees and sorted into different seed lot fraction in the same way as described above. A total 160 seeds (40 seeds per seed lot fractions) were correctly identified and scanned separately to serve as test set.
2.2 Acquisition of NIR Spectra
NIR reflectance spectra from single seed, expressed in the form of log (1/R), were collected with XDS Rapid Content Analyzer (FOSS NIRSystems, Inc.) from 400 to 2498 nm with a spectral resolution of 0.5 nm. Individual seeds were directly placed at the center of the scanning glass window of the instrument with 9 mm aperture, and then covered with the instrument’s lid that had black background. Prior to scanning seed samples, reference measurement was taken on standard built-in reference of the instrument. For every seed, 32 monochromatic scans were made at stationary position that allowed collection of radiation reflected from the entire surface of the seed, and then the average value of 32 scans was recorded for each individual seed.
2.3 Development of multivariate discriminant models
The calibration set was composed of 400 NIR spectra (100 spectra per seed lot fraction) and the test set was composed of 160 NIR spectra (40 spectra per seed lot fraction). Two modelling approaches were used to discriminate filled-viable, empty, insect-attacked and shriveled seeds by NIR spectroscopy: Partial Least Squares-Discriminant Analysis (PLS-DA) and Orthogonal Projection to Latent Structures-Discriminant Analysis (OPLS-DA). The OPLS-DA modelling approach integrates facilities for both data pre-processing to remove unwanted systematic noise in the spectra and subsequent modelling. It is well known that NIR spectroscopic data are not usually amenable for direct analysis due to unwanted systematic variation in the spectra that has no correlation with the response variable (class membership in our case) due to light scattering, base line shift, instrumental drift, and path length differences (Tigabu and Odén 2004; Tigabu et al. 2004). Basically, OPLS-DA modelling separates predictive from non-predictive (Y-orthogonal) variation in the spectra and uses only the predictive variation for fitting the model. To do this, it uses information in the categorical response matrix Y (a matrix of dummy variables in our case) to decompose the X matrix (the NIR spectral data) into three distinct parts: (1) the predictive score matrix and its loading matrix for X, (2) the corresponding Y-orthogonal score matrix and its loading matrix, and (3) the residual matrix of X (Trygg and Wold 2002). Unlike other spectral pre-processing methods (Næs et al. 2002), OPLS-DA provides dimensionally less complex models, and additional facilities for interpretation of inter- and intra-class variability, causes of unwanted systematic variation in the spectra and relevant spectral variation accounted for class discrimination by examining the score and loading plots of predictive and orthogonal components (Pinto et al. 2012).
Initially four-class PLS-DA and OPLS-DA models were developed using the absorbance values in the full NIR spectral region (780–2500 nm) as regressor and a matrix of dummy variables as regressand (1 for member of a given class, 0.0 otherwise). The discriminant models were also fitted using the shorter (780–1100 nm) and longer (1100–2500 nm) NIR spectral regions to examine whether prediction of class membership is sensitivity to the change in detection system (Silicon-detector in the shorter and InGsAs-detector in the longer NIR regions). Since the classification accuracy of the four-class models was limited, particularly for non-viable seed lot fractions, we merged empty, insect-attacked and shriveled seeds together to form a non-viable class while keeping the filled-viable seeds as a separate class, and then two-class PLS-DA and OPLS-DA models were developed to discriminate non-viable and filled-viable seeds. To examine if the unbalanced number of samples in the calibration set (n = 300 for non-viable and n = 100 for viable seeds) influenced model stability and prediction accuracy, we performed PLS-DA and OPLS-DA on balanced sample size for each viability class (99 spectra per viable and non-viable class each), and compared the performance of the models developed using unbalanced number of samples. It appeared that the modeled (90%) and predicted (99%) class memberships for data sets with unbalanced and balanced sample size for each viability class were similar. Thus, the final discriminant models were developed using unbalanced number of samples. We believed that sufficiently large number of samples for each class of non-viable seeds (empty, Insect-attacked and shriveled seeds) captures more the variability in individual seeds within each class than small number of sample size.
All calibrations were developed on mean-centered data sets and the numbers of significant model components were determined by a seven-segment cross validation. A component was considered significant if the ratio of the prediction error sum of squares (PRESS) to the residual sum of squares of the previous dimension (SS) is statistically smaller than 1.0 (Eriksson et al. 1999). Finally, the predictive ability of the fitted models was evaluated using independent test set that was drawn from seed lots not included in the calibration. Seeds were considered as member of a given class if predicted values were greater than an acceptance threshold (≥ 0.5), and the classification accuracy was computed as the proportion of number of samples in a given class predicted correctly to the total number of samples in that class.
The spectral region accounted for the discrimination of filled-viable and non-viable seeds was determined using a parameter called Variable Influence on Projection (VIP). VIP is a weighted sum of squares of the PLS/OPLS weights, taking into account the amount of explained Y-variance of each dimension. Its major advantage is that there will be only one VIP-vector, summarizing all components and Y-variables; thereby enabling us to identify absorption bands influencing the discriminant models. A cut-off around 0.7 – 0.8 has been suggested to discriminate between relevant and irrelevant predictors (Eriksson et al. 1999); and in our case the cut-off was set at 0.75. All calculations were performed using Simca-P+ software (Version 13.0.0.0, Umetrics AB, Sweden).
3 Results
3.1 Overview of NIR spectra
The average uncorrected absorbance values for viable, insect-attacked, empty and shriveled seeds of J. polycarpos showed a similar spectral profile with major peaks at 1500 nm and 1960 nm with small bumps around 1250 nm and beyond 2100 nm (Fig. 1A). The absorbance values for empty and shriveled seeds were slightly higher than filled-viable seeds across the whole NIR spectral region while insect-attacked seeds had slightly higher absorbance value than filled-viable seeds in part of the shorter NIR region. The difference spectrum, obtained by subtracting the mean spectrum of non-viable seeds from that of viable seeds, shows that the non-viable seeds had higher absorbance values in the 780 – 1250 nm with broad peaks at 876 nm, 943 nm and 1084 nm as well as in 1250 – 1470 nm with a major peak at 1270 nm, and smaller peaks at 2134 nm, 2268 nm and 2324 nm. The viable seeds had a slightly higher absorbance values in the longer NIR region with small peaks at 1890 nm and 1996 nm (Fig. 1B). As a whole, the NIR spectra carried sufficient information to discriminate viable and non-viable seeds of J. polycarpos.
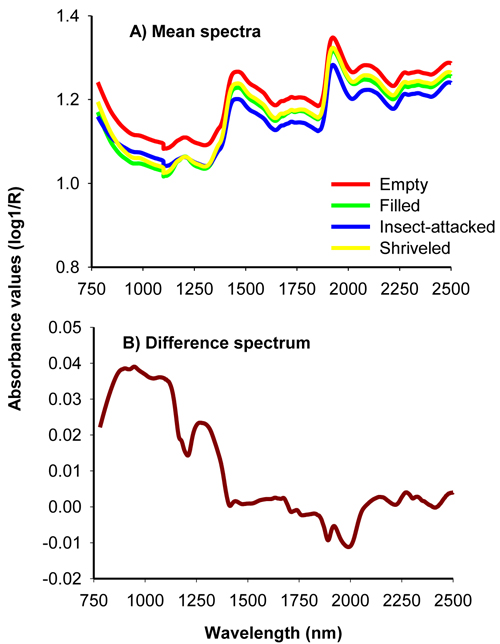
Fig. 1. Average uncorrected NIR spectra of filled-viable, empty, insect-attacked and shriveled seeds of J. polycarpos (A) and difference spectrum of non-viable and viable seeds (B).
3.2 Discrimination of seed lot fractions by four-class models
The four-class PLS-DA models computed to simultaneously discriminate empty, insect-attacked, shriveled and filled-viable seeds of J. polycarpos employed 99.9% of the spectral variation (R2X) to model more than 69.9% of the variation among seed lot fractions in the calibration set (R2Y), depending on the NIR region analyzed (Table 1A). On the contrary, the OPLS-DA models employed 27.4% – 28.9% of the predictive spectral variation (R2XP) to model 67.1% – 69.8% of the class variation (R2Y) in the calibration set (Table 1B). The Y-orthogonal spectral variation that was uncorrelated to the classes (R2Xo) constituted 71.1% – 72.6% of the total spectral variation. The prediction accuracy (Q2cv) according to cross validation was 66% for both PLS-DA and OPLS-DA models but it was slightly improved for test set by OPLS-DA model. As a whole, the OPLS-DA modelling approach didn’t improve much the modelled and predicted class membership compared to PLS-DA models, but it reduced the number of components needed to build the models (A = 12 for PLS-DA and 3 for OPLS-DA; Table 1).
| Table 1. A statistical summary of four-class models developed using the full (780–2500 nm) shorter (780–1100 nm) and longer (1100–2500 nm) NIR regions for simultaneously classifying empty, insect-attacked, shriveled and filled-viable seeds of J. polycarpos. | ||||||
| A) PLS-DA | ||||||
| Spectra (nm) | A | R2X | R2Y | Q2 cv | Predtest (%) | |
| 780–2500 | 12 | 0.999 | 0.722 | 0.658 | 66 | |
| 780–1100 | 10 | 0.999 | 0.699 | 0.669 | 71 | |
| 1100–2500 | 14 | 0.999 | 0.750 | 0.686 | 70 | |
| B) OPLS-DA | ||||||
| Spectra (nm) | A | R2Xp | R2Xo | R2Y | Q2 cv | Predtest (%) |
| 780–2500 | 3 + 8 | 0.274 | 0.726 | 0.695 | 0.664 | 69 |
| 780–1100 | 3 + 6 | 0.289 | 0.711 | 0.698 | 0.667 | 71 |
| 1100–2500 | 3 + 8 | 0.275 | 0.725 | 0.671 | 0.638 | 64 |
| A = number of significant components to build the model (for OPLS-DA models , the first value is for predictive component and the second value is for the orthogonal component), R2X = the explained spectral variation (1 – SS(E)/SS(X)), R2Y = the variation between seed classes explained by the model (1 – SS(F)/SS(Y)), R2Xp = the predictive spectral variation; R2Xo = Y-orthogonal variation (spectral variation uncorrelated to class discrimination), Q2cv = the predictive power (the predicted variation) of a model according to cross validation, and Predtest = the overall prediction accuracy of the models for the test set. | ||||||
For test set samples, the PLS-DA models developed using the entire NIR region (780–2500 nm) correctly assigned filled-viable and insect-attacked seeds to their respective class with 95% and 78% accuracy, respectively (Table 2A). However, the accuracy of predicted class membership for empty and shriveled seeds was low, with misclassification of 30% of empty seeds into insect-attacked class, 10% into shriveled class, 7.5% into both classes and 12.5% of empty seeds as having no class. Likewise, 17% of shriveled seeds were wrongly assigned as empty seeds, 25% as belonging to both empty and shriveled seed classes and 5% as having no class. When the four-class PLS-DA model was fitted in the shorter NIR region (780–1100 nm), the accuracy of predicted class membership for shriveled seeds was substantially improved to 70% without much change in classification accuracy for the other seed lot fractions (Table 2B). The accuracy of predicted class membership was still higher for filled-viable and insect-attacked seeds than empty and shriveled seeds for the PLS-DA model computed using the longer NIR region (Table 2C). The OPLS-DA models also resulted in similar classification accuracy as the PLS-DA models, in which filled-viable and insect-attacked seeds in the test set were correctly assigned to their respective class with 95% – 98% and 78% – 83% accuracy, respectively, depending on the NIR regions analyzed (Table 2).
| Table 2. A matrix of predicted class membership of seed lot fractions in the test set (n = 40 for each seed lot fraction) by four-class PLS-DA and OPLS-DA (values in parenthesis) models developed using different NIR spectral regions. View in new window/tab. |
3.3 Discrimination of viable and non-viable seeds by two-class models
When two-class models were fitted to the spectral data to discriminate between viable and non-viable seeds, the modeled (R2Y) and predicted (Q2cv) class membership of the calibration set were improved substantially (more than 90%) for both PLS-DA and OPLS-DA models compared to the four-class models (Table 3). The prediction accuracy for the test set was also improved to 99% compared to the four-class models. However, the OPLS-DA models required only one significant component for modelling 89–93% of the class variation (R2Y) using small fraction of the total spectral variation (R2Xp = 1.2% – 6.8%), depending on the NIR region analyzed (Table 3).
| Table 3. A statistical summary of two-class models developed using the entire (780–2500 nm) shorter (780–1100 nm) and longer (1100–2500 nm) NIR regions for discriminating viable and non-viable seed of J. polycarpos. | ||||||
| A) PLS-DA | ||||||
| Spectra (nm) | A | R2X | R2Y | Q2 cv | Predtest (%) | |
| 780–2500 | 11 | 0.999 | 0.913 | 0.871 | 99 | |
| 780–1100 | 6 | 0.999 | 0.927 | 0.915 | 99 | |
| 1100–2500 | 7 | 0.999 | 0.914 | 0.888 | 99 | |
| B) OPLS-DA | ||||||
| Spectra (nm) | A | R2Xp | R2Xo | R2Y | Q2 cv | Predtest (%) |
| 780–2500 | 1 + 10 | 0.0312 | 0.969 | 0.916 | 0.905 | 99 |
| 780–1100 | 1 + 9 | 0.0683 | 0.932 | 0.927 | 0.920 | 99 |
| 1100–2500 | 1 + 8 | 0.0121 | 0.988 | 0.892 | 0.878 | 99 |
| A = number of significant components to build the model (for OPLS-DA models , the first value is for predictive component and the second value is for the orthogonal component), R2X = the explained spectral variation, R2Y = between-class variation explained by the model, R2Xp = the predictive spectral variation; R2Xo = spectral variation uncorrelated to class discrimination, Q2cv = the predictive power of a model according to cross validation, and Predtest = the overall prediction accuracy of the models for the test set. | ||||||
The score plot for the first predictive component (tp[1] showed clear differentiation of viable seeds from non-viable seeds while the first orthogonal component (to[1] simply showed within class variability (Fig. 2A). The predictive loading (P1[p] plot showed that absorption peaks at 878 nm and 1270 nm were positively correlated with non-viable seed class while that at 1890 nm and 1996 nm were positively correlated with viable seeds (Fig. 2B). The orthogonal loading (P1[o] plot did not show any vivid absorption peaks that were unrelated to class discrimination, but rather displayed systematic noise across the entire wavelength range (Fig. 2C).
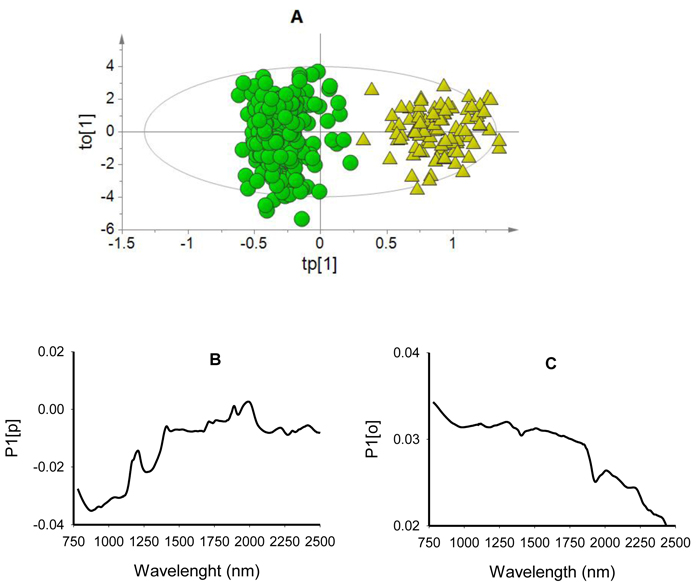
Fig. 2. Score plot for the first predictive (tp[1]) versus orthogonal (to[1]) components showing clear clusters of non-viable (green dots) and viable (yellow triangles) seeds (panel A); loading plot for the first predictive component (P1[p]) showing absorption bands correlating to seed classes (panel B); and loading plot for the first orthogonal component (P1[o]) showing absorption bands that are not correlated to class discrimination (panel C) of OPLS-DA model developed using the entire NIR spectral range (780–2499 nm).
The two-class PLS-DA models assigned samples in the test set correctly to viable and non-viable classes, except one viable seed that was misclassified as non-viable seed (Table 4). The overall classification accuracy was 98% for filled-viable seeds and 100% for non-viable seeds (empty, insect-attacked and shriveled seeds). The OPLS-DA models also resulted in similarly higher classification accuracy for the test set (Fig. 3).
| Table 4. Discrimination of non-viable (empty, insect-attacked and shriveled) and viable seeds in the test set by two-class PLS-DA modelling of different NIR spectral region. | |||||||
| Spectra (nm) | Class | Members | 1 | 2 | No class | 1 & 2 | Correct |
| 780–2500 | Non-viable (1) | 120 | 120 | 0 | 0 | 0 | 100% |
| Viable (2) | 40 | 1 | 39 | 0 | 0 | 97.5% | |
| 780–1100 | Non-viable (1) | 120 | 120 | 0 | 0 | 0 | 100% |
| Viable (2) | 40 | 1 | 39 | 0 | 0 | 97.5% | |
| 1100–2500 | Non-viable (1) | 120 | 120 | 0 | 0 | 0 | 100% |
| Viable (2) | 40 | 1 | 39 | 0 | 0 | 97.5% | |
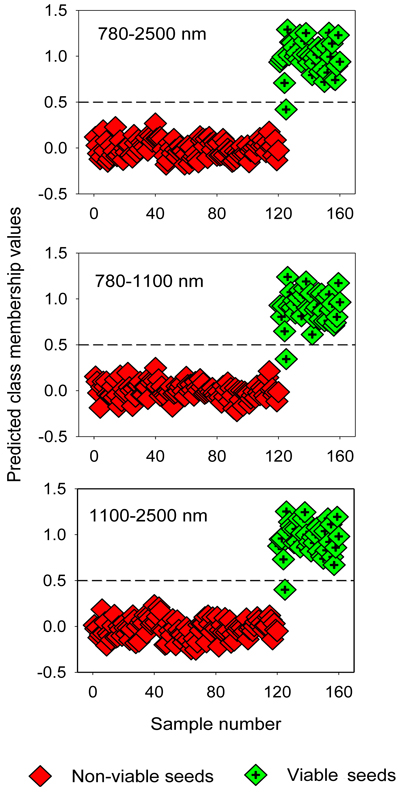
Fig. 3. Discrimination of non-viable (empty, insect-attacked and shriveled) and viable seeds in the test set by two-class OPLS-DA modelling of different NIR spectral regions. The horizontal dotted line is the class limit (Ypredicted > 0.5) for assigning the test sets into viable seed class.
3.4 NIR spectra accounted for discrimination of viable and non-viable seeds
The VIP plot shows that absorption band in 780–1200 nm with broad peaks centered around 876 nm, 943 nm and 1084 nm as well as a small bump at 1176 nm had a strong influence on the discrimination of viable and non-viable seeds (Fig. 4A). Spectral region between 1208 nm and 1410 nm with a broad peak centered at 1270 nm had also accounted for class discrimination. Note that a variable with VIP value greater than one has a strong influence on the model, which in turn accounted for discrimination of seed lot fractions. Other regions of interest in the longer wavelength range appeared at 2136 nm, 2268 nm and 2324 that contributed fairly well (close to 0.5 VIP value) for class discrimination. A plot of the regression coefficients for the viable seed class also revealed that absorption peaks at 926 nm, 1048 nm, 1168 nm, 1210 nm and 1892 nm contributed for discriminating viable seeds from non-viable ones (Fig. 4B).
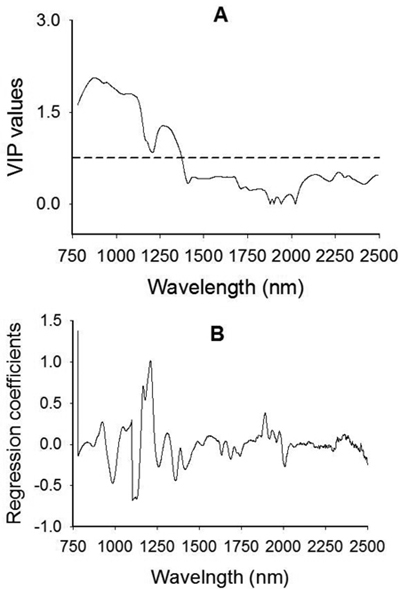
Fig. 4. Plots of Variable Influence on Projection, VIP, (A) and regression coefficients (B) showing spectral regions that influenced the discrimination of viable from non-viable (empty, insect-attacked and shriveled) J. polycarpos seeds. The horizontal dotted line in the VIP plot is the cut-off limit (0.75) for discriminating relevant and irrelevant predictors. The regression coefficient plot is for the viable seeds class.
4 Discussion
The results demonstrate that NIR spectroscopy can discriminate viable and non-viable seeds of J. polycarpos successfully, although the success of discriminating among the non-viable seed lot fractions (empty, insect-attacked and shriveled seeds) was limited. Cutting and examining the internal content of the non-viable seed lot fractions confirmed that some of the insect-attacked seeds were totally devoid of its contents while some were partially consumed; whereas the shriveled seeds differed in the content of the black undifferentiated mass of tissues from a quarter to half the size of the seed. This divergence in the internal content of insect-attacked and shriveled seeds might not be large enough compared with the empty seeds that are totally devoid of stored reserves, and hence limited the success of discriminating fully among the non-viable seed lot fractions.
Both OPLS-DA and PLS-DA modelling approaches result in identical predictive capacity of class membership of the test set samples, however the OPLS-DA models were superb in terms of dimensional complexity. By extracting irrelevant spectral variations that are not useful for class discrimination, the OPLS-DA modelling resulted in parsimonious models (A = 1 for OPLS-DA versus A = 10 for PLS-DA). Dimensional complexity is an important factor in the interpretation of multivariate analysis and parsimonious models with few components are often highly preferred (Trygg and Wold 2002). In the present study, the proportion of spectral variation that was uncorrelated to class discrimination is larger than the predictive spectral variation, which could be attributed to spectral redundancy, light scattering and path length difference. Our NIR instrument measures the absorbance values at 0.5 nm wavelength resolution, thus it is obvious to expect a high degree of redundancy in the absorbance values at this scale of resolution. Furthermore individual seeds vary in size, moisture content and chemical composition, and hence induce path length difference and light scattering that are uncorrelated to class discrimination (Tigabu et al. 2007). This is further evidenced from the Y-orthogonal score and loading plots (Fig. 2) where the non-viable seed lot fractions was more dispersed than the filled-viable seeds and where no major absorption peaks that were unrelated to class discrimination was discerned. Nonetheless, NIR spectroscopy is highly sensitive and sufficiently detects subtle differences as low as 0.1% of the total concentration of the analyte (Osborne et al. 1993) while multivariate analysis is powerful in extracting such information from the spectra unlike univariate analysis (Næs et al. 2002).
Absorption bands that were highly relevant for discriminating viable and non-viable seeds appeared in 780–1200 nm and 1210–1389 nm regions (Fig. 4). Both the difference spectrum (Fig. 1B) and the predictive loading plot (Fig. 2B) also revealed that non-viable seeds had higher absorbance values in 780–1200 nm and 1210–1389 nm whereas the viable seeds had a slightly higher absorbance values in the longer spectral region with small peaks at 1890 nm and 1996 nm. Interpretation of NIR absorption bands is not straightforward due to the overlapping nature of NIR spectra and the complex chemical composition of seeds. However, an attempt was made to analyze the chemical ‘fingerprints’ of the observed absorption bands based on previous studies and assignment of bands to functional groups. The absorption bands in 780–1100 nm and 1200–1389 nm are characterized by third and second overtone of C – H stretch, respectively due to absorption by methyl and methylene (the common molecular moieties in fats and oils), and benzene (Osborne et al. 1993; Workman and Weyer 2012). In addition, the 780–1100 nm is a region characterized by the O – H stretching second overtone where absorption spectra of aliphatic and aromatic hydroxyl groups as well as starch and water overlap.
Previous studies have shown that juniper berries are rich in essential oils with 15–74 different components; the dominant being monoterpenes (α-pinene, myrcene, sabinene, limonene and β-pinene), followed by small amounts of sesquiterpenes and non-terpene components such as undecanone-2 and tricyclene (Okasaka et al. 2006; Rezvani et al. 2009; Sela et al. 2011; Höferl et al. 2014). As the non-viable seeds are totally devoid of storage reserves due to consumption by insect larvae (insect-attacked seeds) and developmental arrest of the storage organs and seed filling (empty and shriveled seeds), the spectral signature is presumably dominated by surface reflectance from the seed coats, which have terpenoids as chemical constituent. Furthermore, studies on chemical composition of different seed parts have shown that phenolic compounds and starch are the dominant compounds in the pericarp-testa (Bewley and Black 1994; Copelands and McDonald 2001).
The viable seeds showed unique absorption in the longer wavelength regions (1850–2000) with small but notable peaks at 1890 nm and 1996 nm. While the absorption band around 1900 nm is characterized by O–H stretch and combination of C–O stretch due to absorption by molecular moieties of protein and starch, the absorption band around 2000 nm is typical of N–H, O–H and C–H bond vibrations due to absorption by protein, lipid and carbohydrate moieties (Shenk et al. 2001). Thus, the discriminant models utilized spectral difference attributed to seed coat chemical compositions coupled with storage reserves as a basis to discriminate viable and non-viable seeds of J. polycarpos. Tigabu et al. (2007) have also found these regions as useful for discriminating sound and insect-damaged seeds of J. procera.
Our attempt to discriminate viable and non-viable seeds of J. polycarpos using the shorter (780–1100 nm) and longer (1100–2500 nm) NIR regions has resulted in similar prediction accuracy of class membership of test set samples as the full NIR region. This suggests that discrimination of J. polycarpos seeds according to their viability using NIR spectroscopy is not sensitivity to the change in detection system from Silicon-detector in the shorter to InGsAs-detector in the longer NIR regions. This finding sheds light on the prospect of developing cost-effective automated sorting system for large-scale seed handling operations. In conclusion, OPLS-DA modelling of single seed NIR spectra results in parsimonious models that can successfully discriminate viable and non-viable seeds of J. polycarpos.
Acknowledgement
Financial support for the first author from the Iranian Government Science and Technology Scholarship Program is gratefully acknowledged. We thank the employees of Iranian Agricultural and Natural Resources Research Center (Golestan Province) for their help during the seed collection and Mostafa Farhadi for assistance in seed cleaning and interesting discussion.
References
Agelet L.E., Hurburgh C.R. (2014). Limitations and current applications of Near Infrared Spectroscopy for single seed analysis. Talanta 121: 288–299. http://dx.doi.org/10.1016/j.talanta.2013.12.038.
Ahani H., Jalilvand H., Hosseini Nasr S.M., Soltani K.H., Ghazi M.R., Mohammadzadeh H. (2013). Reproduction of Juniperus polycarpos in Khorasan Razavi, Iran. Forest Science and Practice 15(3): 231–237. http://dx.doi.org/10.1007/s11632-013-0307-6.
Aliahmad Koruri S., Khoushnevis M., Matinizadeh M. (2011). Comprehensive studies of Juniper species in Iran. Publication of Pooneh, Forest & Ranges and Watershed Organization of Iran. 554 p.
Bewley J.D., Black M. (1994). Seeds: physiology of development and germination. 2nd edn. Plenum press, New York. 445 p. http://dx.doi.org/10.1007/978-1-4899-1002-8.
Copelands L.O., McDonald M.B. (2001). Principles of seed science and technology. Kluwer Academic Publishers, Boston/Dordrecht/London. 467 p. http://dx.doi.org/10.1007/978-1-4615-1619-4.
Demelash L., Tigabu M., Odén P.C. (2002). Separation of empty and dead-filled seeds from a seed lot of Pinus patula with IDS technique. Seed Science and Technology 30: 677–681.
Demelash L., Tigabu M., Odén P.C. (2003). Enhancing germinability of Schinus molle L. seed lot from Ethiopia with specific gravity and IDS techniques. New Forest 26: 33–41. http://dx.doi.org/10.1023/A:1024486204058.
Downie B., Wang B.S.P. (1992). Upgrading germinability and vigor of jack pine, logdepole pine, and white spruce by the IDS technique. Canadian Journal of Forest Research 22: 1124–1131. http://dx.doi.org/10.1139/x92-149.
Eriksson L., Johansson E., Wold N.K., Wold S. (1999). Introduction to multi- and megavariate data analysis using projection methods (PCA & PLS). Umetrics AB, Umea.
Gutterman Y. (2000). Maternal effects on seeds during development. In: Fenner M. (ed.). Seeds: the ecology of regeneration in plant communities. 2nd edn. CABI Publishing, Wallingford. p. 59–84. http://dx.doi.org/10.1079/9780851994321.0059.
Höferl M., Stoilova I., Schmidt E., Wanner J., Jirovetz L., Trifonova D., Krastev L., Krastanov A. (2014). Chemical composition and antioxidant properties of juniper berry (Juniperus communis L.) essential oil. Action of the essential oil on the antioxidant protection of Saccharomyces cerevisiae model organism. Antioxidants 3: 81–98. http://dx.doi.org/10.3390/antiox3010081.
ISTA, International Seed Testing Association (2010). International rules for seed testing. Bassersdorf, Switzerland.
Lestander T.A., Odén P.C. (2002). Separation of viable and non-viable filled Scots pine seeds by differentiating between drying rates using single seed near infrared transmittance spectroscopy. Seed Science and Technology 30: 383–392.
Næs T., Isaksson T., Fearn T., Davies T. (2002). A user friendly guide to multivariate calibration and classification. NIR Publications, Chichester, UK. 344 p.
Okasaka M., Takaishi Y., Kashiwada Y., Kodzhimatov O.K., Ashurmetov O., Lin A.J., Consentino L.M., Lee K-H. (2006). Terpenoids from Juniperus polycarpus var. seravschanica. Phytochemistry 67: 2635–2640. http://dx.doi.org/10.1016/j.phytochem.2006.07.020.
Osborne B.G., Fearn T., Hindle P.H. (1993). Practical NIR spectroscopy: with applications in food and beverage analysis. 2nd edition. Longman Scientific and Technical, Harlow, UK. p. 13–35.
Pinto R.C., Trygg J., Gottfries J. (2012). Advantages of orthogonal inspection in chemometrics. J. Chemometrics 26: 231–235. http://dx.doi.org/10.1002/cem.2441.
Rezvani S., Rezai M.A., Mohammodi N. (2009). Terpenoids from dried fruits of Juniperus polycarpos from lowest part of the mountains in Golestan of Iran. Asian Journal of Chemistry 21(4): 3295–3297.
Schelin M., Tigabu M., Eriksson I., Sawadogo L., Odén P.C. (2004). Predispersal seed predation in Acacia macrostachya, its impact on seed viability and germination responses to scarification and dry heat treatments. New Forest 27: 251–267. http://dx.doi.org/10.1023/B:NEFO.0000022225.75095.41.
Sela F., Karapandzova M., Stefkov G., Kulevanova S. (2011). Chemical composition of berry essential oils from Juniperus communis L. (Cupressaceae) growing wild in Republic of Macedonia and assessment of the chemical composition in accordance to European Pharmacopoeia. Macedonian pharmaceutical bulletin 57(1, 2): 43–51.
Shenk J.S., Workman J.J., Westerhaus M.O. (2001). Application of NIR spectroscopy to agricultural products. In: Burns D.A., Ciurczak E.W. (eds.). Handbook of near-infrared spectroscopy. Marcel Dekker Inc., New York. p. 419–474.
Simak M. (1984). A method for the removal of filled~dead seeds from a sample of Pinus contorta. Seed Science and Technology 12: 767–775.
Slobodník B., Gutternberger H. (2000). Ovule, megaspores and female gametophyte formation in Larix decidua Mill. (Pinaceae). Acta Biologica Cracoviensia 42: 93–100.
Soltani A., Lestander T.A., Tigabu M., Odén P.C. (2003). Prediction of viability of oriental beechnuts, Fagus orientalis using near infrared spectroscopy and partial least squares regression. Journal of Near Infrared Spectroscopy 11: 357–364. http://dx.doi.org/10.1255/jnirs.387.
Tigabu M., Odén P.C. (2002). Multivariate classification of sound and insect-infested seeds of a tropical multipurpose tree, Cordia africana, with near infrared reflectance spectroscopy. Journal of Near Infrared Spectroscopy 10:45–51. http://dx.doi.org/10.1255/jnirs.320.
Tigabu M., Odén P.C. (2003a). Near infrared spectroscopy-based method for separation of sound and insect-damaged seeds of Albizia schimperiana, a multipurpose legume. Seed Science and Technology 31: 317–328. http://dx.doi.org/10.15258/sst.2003.31.2.09.
Tigabu M., Odén P.C. (2003b). Classification of viable and empty seeds of Pinus patula Schiede & Deppe with near-infrared spectroscopy and multivariate analysis. New Forests 25: 163–176. http://dx.doi.org/10.1023/A:1022916615477.
Tigabu M., Odén P.C. (2004). Simultaneous detection of filled, empty and insect-infested seeds of three Larix species with single seed near infrared transmittance spectroscopy. New Forests 27: 39–53. http://dx.doi.org/10.1023/A:1025037408922.
Tigabu M., Odén P.C., Shen T.Y. (2004). Application of near infrared spectroscopy for the detection of internal insect infestation in Picea abies seed lots. Canadian Journal of Forest Research 34: 76–84. http://dx.doi.org/10.1139/x03-189.
Tigabu M., Fjellström J., Odén P.C., Teketay D. (2007). Germination of Juniperus procera seeds in response to stratification and smoke treatments, and detection of insect-damaged seeds with VIS + NIR spectroscopy. New Forests 33: 155–169. http://dx.doi.org/10.1007/s11056-006-9020-9.
Tillman-Sutela E., Kauppi A. (1995). The morphological background to imbibition in seeds of Pinus sylvestris L. of different provenances. Trees 9: 123–133. http://dx.doi.org/10.1007/BF02418201.
Trygg J., Wold S. (2002). Orthogonal projections to latent structures (O-PLS). Journal of Chemometrics 16(3): 119–128. http://dx.doi.org/10.1002/cem.695.
Workman J., Weyer L. (2012). Practical guide and spectral atlas for interpretive near-infrared spectroscopy. 2nd edition. CRC Press, Taylor & Francis Group. http://dx.doi.org/10.1201/b11894.
Total of 33 references.
