Tomáš Kolář  ,
Kyriaki Giagli,
Miroslav Trnka,
Emílie Bednářová,
Hanuš Vavrčík,
Michal Rybníček
,
Kyriaki Giagli,
Miroslav Trnka,
Emílie Bednářová,
Hanuš Vavrčík,
Michal Rybníček
Response of the leaf phenology and tree-ring width of European beech to climate variability
Kolář T., Giagli K., Trnka M., Bednářová E., Vavrčík H., Rybníček M. (2016). Response of the leaf phenology and tree-ring width of European beech to climate variability. Silva Fennica vol. 50 no. 2 article id 1520. https://doi.org/10.14214/sf.1520
Highlights
- The timing of leaf phenological phases in European beech is controlled by temperature
- Tree-ring width variations in European beech positively reflect growing season precipitation and soil water availability
- The water availability in the top 40 cm of soil layer is more important for European beech growth than that in the deeper layers
- Extension of the phenological growing season does not increase tree-ring width.
Abstract
Various environmental conditions (heat waves and drought events) strongly affect leaf and xylem phenology. Disentangling the influence of temperature, precipitation and soil moisture content (AWR) on the forest productivity remains an important research area. We analyzed the impact of climate variability on the leaf phenology (10 sample trees) and radial growth (17 sample trees) of European beech (Fagus sylvatica L.). The study was conducted on 130-year-old European beech trees growing in a temperate forest stand in the Czech Republic. Detailed 20-year phenological monitoring was performed at the study site (1992–2011). As expected, leaf phenological events were mainly driven by the growing season temperatures. Leaf unfolding was highly affected positively by spring temperatures and the top-layer (to 40 cm) AWR in March. The correlation of tree-ring width with the interpolated climate data was positive significant for the growing season AWR and precipitation signal. Furthermore, the water availability in the top soil layer was found to be an important predictor of tree growth and extremely low growth occurrence. The extended phenological growing season, which was caused by a temperature increase, was not followed by an increased tree-ring width. The examined relationships point out the significance of the water availability in the top soil layer in European beech stands.
Keywords
dendroclimatology;
Fagus sylvatica;
temperature;
soil moisture;
radial increment
-
Kolář,
Department of Wood Science, Faculty of Forestry and Wood Technology, Mendel University in Brno, Zemědělská 3, 613 00 Brno, Czech Republic; Global Change Research Institute, The Czech Academy of Sciences, Bělidla 986/4a, 603 00 Brno, Czech Republic
E-mail
koldatom@gmail.com
- Giagli, Department of Wood Science, Faculty of Forestry and Wood Technology, Mendel University in Brno, Zemědělská 3, 613 00 Brno, Czech Republic E-mail giagli@node.mendelu.cz
- Trnka, Global Change Research Institute, The Czech Academy of Sciences, Bělidla 986/4a, 603 00 Brno, Czech Republic; Department of Agrosystems and Bioclimatology, Faculty of Agronomy, Mendel University in Brno, Zemědělská 1, 613 00 Brno, Czech Republic E-mail mirek_trnka@yahoo.com
- Bednářová, Institute of Forest Ecology, Faculty of Forestry and Wood Technology, Mendel University in Brno, Zemědelská 3, 61300 Brno, Czech Republic E-mail bednarov@mendelu.cz
- Vavrčík, Department of Wood Science, Faculty of Forestry and Wood Technology, Mendel University in Brno, Zemědělská 3, 613 00 Brno, Czech Republic E-mail vavrcik@mendelu.cz
- Rybníček, Department of Wood Science, Faculty of Forestry and Wood Technology, Mendel University in Brno, Zemědělská 3, 613 00 Brno, Czech Republic; Global Change Research Institute, The Czech Academy of Sciences, Bělidla 986/4a, 603 00 Brno, Czech Republic E-mail michalryb@post.cz
Received 9 November 2015 Accepted 25 February 2016 Published 15 March 2016
Views 209827
Available at https://doi.org/10.14214/sf.1520 | Download PDF

Supplementary Files
1 Introduction
Trees promptly respond to changing weather conditions by shifting the timing of leaf and xylem phenological phases (Menzel and Estrella 2001; Rossi et al. 2014). Thus, monitoring leaf and xylem phenology data can reveal species’ responses to local and/or regional climate conditions (Chmielewski and Rötzer 2001; Rossi et al. 2008). In temperate climates, the timing of the phenological phases is especially dependent on the combination of temperature (Vitasse et al. 2011) and photoperiodic cues (Way and Montgomery 2015). The temperature increase in recent decades has shifted the phenological phases, resulting in a lengthening of the potential growing season (Piao et al. 2008). The autumn phenological phases usually exhibit limited intra-annual variations (Chmielewski and Rötzer 2001); therefore, the lengthening of the growing season can be attributed to variability in the spring phases (Vitasse et al. 2011). A longer growing season and greater photosynthetic activity can lead to enhanced carbon sequestration (Piao et al. 2008) or higher rates of photosynthesis and affect plant–animal interactions (Polgar and Primack 2011). Keenan et al. (2014) suggested a current and possible future enhancement of forest carbon uptake resulting from changes in phenology. However, a close relationship between the length of the phenological growing season and tree-ring width (TRW) was denied by Čufar et al. (2015), who tested this hypothesis in European beech (Fagus sylvatica, L.) in Slovenia. Nevertheless, Rossi et al. (2014) determined that, from a xylogenetic perspective, the expected global warming might also lead to increased xylem growth.
European beech TRW sensitivity to precipitation and soil moisture content (AWR) has been reported in several studies (e.g., Grundmann et al. 2011; Tegel et al. 2014). Nevertheless, European beech grows in a wide range of soil types (Ellenberg 1996), and the species optimally requires moist summers and mild winters (Giesecke 2007) and immediately responds to sudden AWR changes (van der Werf et al. 2007). Therefore, warmer and drier conditions have been reported to lead to narrower TRW formation (e.g., Peterken and Mountford 1996; Geßler et al. 2007; Scharnweber et al. 2011; Michelot et al. 2012; Mölder and Leuschner 2014). Moreover, European beech trees growing in dry sites were more sensitive to drought than those growing in mesic sites (Weber et al. 2013), especially in the current growing season climate conditions (Michelot et al. 2012). Severe drought drastically influenced mature European beech trees, causing extreme growth depressions for many years or even death (Peterken and Mountford 1996).
Climate models predict a significant annual temperature increase and a summer precipitation decrease for Central Europe in the next century (e.g., IPCC 2013; Dubrovský et al. 2015). Foresters fear that the growth decline of European beech is likely to become more dramatic in the coming decades (Gerard and Breda 2014), leading to crucial fluctuations in the distribution limits (e.g., geographical/ecological range, altitudinal shift) (Tegel et al. 2014). Our study was motivated by the following hypotheses: 1) temperature is the key climate factor controlling leaf phenology; 2) based on the results of previous studies of Norway spruce (Rybníček et al. 2012) and sessile oak (Rybníček et al. 2015) in this area, we assumed that TRW growth is driven by precipitation and water availability in the soil; and 3) the extended phenological growing season significantly influences the TRW.
2 Materials and methods
2.1 Study site characteristics
The research was conducted in the Drahany Highlands (Drahanská vrchovina) (Fig. 1a) on a permanent research plot (49°28´N, 16°41´E) consisting of 130-year-old European beech (Fagus sylvatica L.) trees. The research plot (630 m a.s.l.) was regarded as a representative growing area for the species because it was centrally located in the European beech distribution area in Europe (Fig. 1b). Forestland covers 55% of the total area. Deciduous trees represent 27% of the total forest species composition, including 12% of European beech. The percentage gives the proportion of stand area the tree species takes up in the territory; the stand area is defined based on tabular density (relative density of trees in the stand – degree of the trees’ exploitation of the area).
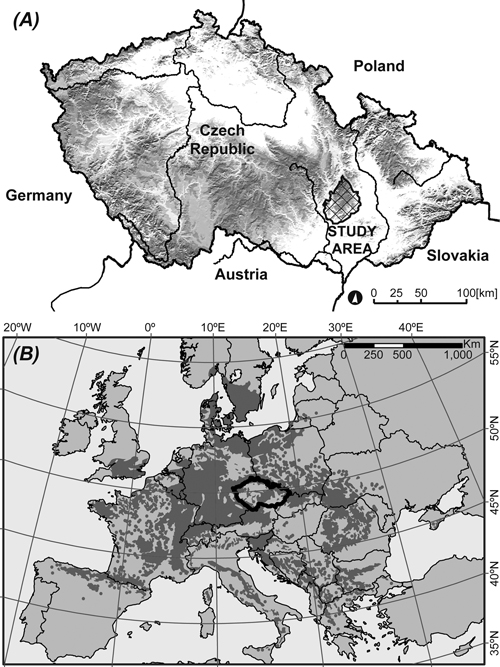
Fig. 1. (A) Study area in the Czech Republic (630 m a.s.l.). (B) The natural distribution of European beech (Fagus sylvatica L.) (http://www.euforgen.org) is shown in the darker shade of gray.
The area is characterized as relatively warm and moderately dry with frequent high-temperature episodes. Climate fluctuations manifested by extreme droughts accompanied by increasing mean monthly temperatures, particularly in the summer period, are characteristic for this forest area (OPRL 2001). Based on derived data (chapter 2.4), we characterize the climate conditions for the site during the study period (1961–2011) as follows. The mean annual air temperature was 7.6 °C (during the April–August growing season, it was 14.1 °C). The annual precipitation ranged between 500 and 950 mm. The significant increase in the growing season temperature was not accompanied by changes in the precipitation and relative soil water content (AWR) in the first 1.3 m of the soil profile but the AWR in the top 0.4 m of the soil decreased (Fig. 2).
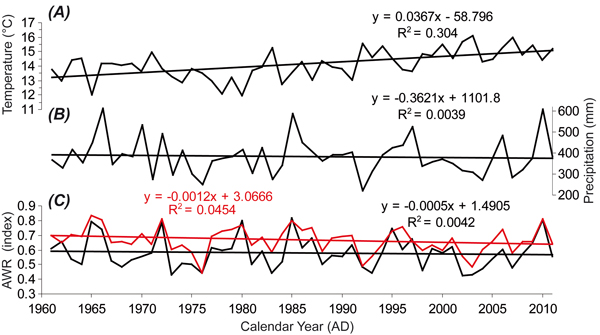
Fig. 2. (A) Mean temperature (°C), (B) Precipitation total (mm) and (C) Soil moisture content (AWR; depth 0–1.30 m in black and depth 0–0.40 m in red) during growing season (April–August) calculated (details in chapter 2.4) for the study site from 1961 to 2011.
2.2 Leaf phenological data
Ten healthy dominant European beech trees were selected to monitor the leaf phenological phases (leaf unfolding and leaf coloring). Leaf phenological data were collected for 20 years (1992–2011) using the methodology applied by the Czech Hydrometeorological Institute (Czech Hydrometeorological Institute 1987; Coufal and Houška 2004). Leaf unfolding was defined when 100% of the leaves were partially unfolded (midrib visible, leaf blade fully developed, and leaf area starting to increase). Leaf coloring was defined based on the color of all stipules in the crown (yellow, brown or any other color). The individual phases of leaf phenology were assessed at daily intervals during the spring and weekly during the remaining growing season. The growing season was defined as the time between leaf unfolding and leaf coloring, i.e., the number of days with green leaves (DGL). All trees were selected in the center of the closed-canopy stand to exclude the stand edge effect. The day ordinal number from the beginning of the calendar year (DOY) was assigned to the dates of the particular phenological phases for each tree. The beginning of each phenological stage for the study site was determined as the mean value calculated from all observed trees.
2.3 Tree-ring width sampling and chronology development
We used 17 healthy dominant European beech trees for dendrochronology. Ten of these trees were also used to monitor leaf phenology. Sampling (one core per tree) was performed using a Pressler borer at breast height along the contour line, and the sampling was not influenced by the presence of tension wood. The samples were measured using a VIAS TimeTable measuring system (©SCIEM, Austria) with 0.01-mm accuracy. The measuring and cross-dating of TRW series were performed using PAST4 (©SCIEM, Austria) and COFECHA (Grissino-Mayer 2001). The correlation coefficients and the coefficient of agreement (Eckstein and Bauch 1969) were used to assess coherency among the individual TRW series.
Non-climatic, tree-age-related growth trends of individual TRW series were removed using ARSTAN (Grissino-Mayer et al. 1992). The cubic smoothing spline with 50% frequency cut-off at 100 years (Fritts et al. 1969) was selected because it preserves the inter-annual to multi-decadal growth fluctuations (Büntgen et al. 2008). Tree-ring width indices (TRWi) were calculated as residuals after the appropriate power transformation of the raw data to minimize end-effect problems (Cook and Peters 1997). The mean chronology was calculated using a biweight robust mean. The expressed population signal (EPS; Wigley et al. 1984) and inter-series correlation (Rbar) were calculated to assess the internal signal strength of the chronology.
2.4 Climate data
Climate data were derived from the 500-m-resolution gridded daily dataset for the study site based on the interpolation from a set of nearby weather stations by applying the local weighted regression and accounting for the effect of the altitude. The original station series were subjected to quality control and homogenization using ProClimDB (Štěpánek 2007) and included 268 meteorological (providing fully range of weather parameters) and 787 precipitation stations (proving daily precipitation data only) representing the territory of the Czech Republic. All observations of the weather variables were tested for outliers and breaks using a detailed homogenization sequence, and the gaps of missing data were filled (Štěpánek et al. 2009; Štěpánek et al. 2011). All weather elements could be interpolated using the high-density network for the sampling site (Štěpánek et al. 2011). The database for the research area included daily data on the maximum and minimum temperature, precipitation and global radiation totals and the daily mean wind speed and water vapor pressure. Using the AgriClim (Trnka et al. 2012) and SoilClim (Hlavinka et al. 2011) software packages, the daily soil moisture content (expressed as relatively water availability – AWR) in two layers below the soil surface (0–0.4 m, AWR1 and 0.4–1.3 m, AWR2) was calculated. The AWR is estimated for a daily time step accounting not only for the balance between evapotranspiration, precipitation and the antecedent AWR, but also for the snow presence/absence, aspect and slope of the site, critical soil water holding properties, and the phenological stage of the canopy (See Supplementary file 1 for more details). This routine was based on the approach proposed by Allen et al. (1998) and has been described in detail by Hlavinka et al. (2011) and Trnka et al. (2015).
2.5 Analysis of the climate-leaf phenology-tree-ring width growth relationships
The regional residual TRWi chronology was correlated with the climatic time series in DendroClim2002 (Biondi and Waikul 2004) for the common period from 1961–2011. The monthly and seasonal means of the previous years and the years of tree-ring formation (referred to as “the given year”) were considered. The period from March to August should exert the highest influence on the radial growth in this area (Vavrčík et al. 2013). Climate-leaf phenology relationships were determined using Pearson’s correlation coefficient to reveal the most significant climate factors (monthly or seasonally) for tree growth and phenological phases from 1992–2011.
The detected climate factors were tested according to negative/positive extremes to determine the severity of their influence on European beech tree behavior and to calculate the probability of the extremes occurring at a given value of each climate factor. The negative/positive extremes were determined for years in which phenological phases (leaf unfolding, leaf coloring, DGL) and residual TRWi chronology (period replicated >10 TRWi series) exceeded ±1.0 standard deviation (SD). The threshold value was arbitrarily defined to yield a sufficient number of extreme years (at least 3). Fewer than 3 extremes were identified for leaf coloring and DGL. The relationships were determined using a logistic regression (Quinn and Keough 2002), for which the binary response was coded as a “normal” year (value zero) or a negative/positive extreme year (value 1). Thresholds of the climate factors were calculated when the probability of negative/positive extremes occurring was 0.5. When the parameter values exceeded the threshold, a higher probability of the extreme occurring was indicated. Leaf coloring and DGL factors were not tested by logistic regression because of the low number of the extremes.
Models were verified in the first step using Wald’s test for regression parameters and goodness of fit (Quinn and Keough 2002) at the 0.1 significance level. In the second step, only significant models were tested using the likelihood ratio test. The model was considered if one of these tests reached the 0.05 significance level.
The relationship between the phenological growing season (expressed by DGL) and TRW was tested using t-tests according to Baillie and Pilcher (1973; TBP) and Hollstein (1980; THO) and the coefficient of agreement (Eckstein and Bauch 1969).
3 Results
3.1 Leaf phenology
A 20-year-old leaf phenological dataset (1992–2011) revealed different trends for spring and autumn events (Fig. 3). Leaf unfolding was constant over time and usually occurred at the end of April or the beginning of May. However, the DOY of leaf coloring increased. In the last year of the observation period (2011), this event occurred on November 8, i.e., on a day when leaves had already fallen in the most of the previous years. These trends slightly extended the period, during which trees had green leaves. The number of DGL ranged between 162 (in 2004) and 194 (in 2011). At least three positive and negative extremes were identified in the leaf coloring data only, and the earliest onset of the stage was in 2007 (111 DOY) and the latest in 2004 (131 DOY).
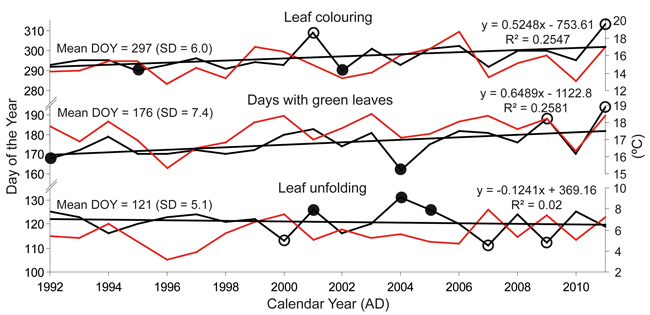
Fig. 3. Trends in leaf unfolding, leaf coloring and days with green leaves for the study site. Red lines show the trend of the climate factor which correlates best with the particular leaf phenological phase (leaf unfolding – March-April average temperature, day with green leaves – March-October maximum temperature, leaf coloring – September-October maximum temperature). Positive (full circles) and negative (empty circles) extremes are indicated.
3.2 Tree-ring width chronology
The reliable TRW chronology (EPS above the frequently used threshold of 0.85; Wigley et al. 1984) representing the study area covers the period 1888–2011 (Fig. 4). The high first-order autocorrelation (AC1; 0.73) of the raw TRW chronology displays large temporal memory. The raw TRW chronology indicates a suppressed period in the first half of the 20th century and a subsequent release in the late 1950s. The TRW (and TRWi) chronology showed a very slightly decreasing trend since 1982, when radial growth was maximized in the last 100 years. Furthermore, the Rbar value (maintained above the reliable value of 0.45) markedly decreased to 0.30 (Fig. 4b). This decrease indicated that the well-fitted inter-series correlation began to unexpectedly fluctuate in the late 1990s. Since 1901, when the TRW chronology was based on at least 10 series, 16 negative and 10 positive extremes occurred. The most significant negative extremes were observed in 1947, 1976 and 2000. Conversely, the positive extremes occurred in 1958 and 1982 (Fig. 4a).
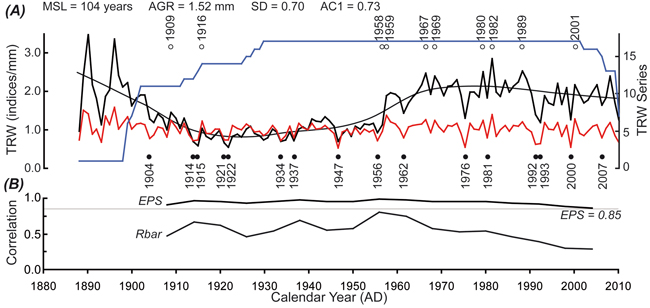
Fig. 4. (A) Growth trend of the raw tree-ring width (TRW) chronology (black) smoothed by Lowess curves, detrended TRW chronology by cubic smoothing spline with 50% frequency cut-off at 100 years (red), replication of the chronology (blue), positive extremes (full circles), negative extremes (empty circles) and basic statistical parameters (MSL – mean segment length; AGR – average growth rate; SD – standard deviation; AC1 – first-order autocorrelation). (B) Expressed population signal (EPS) and inter-series correlation (Rbar) calculated over 12-year windows lagged by 6 years.
3.3 Climate–leaf phenology relationship
Pearson’s correlation coefficient indicates that temperature (minimum, average and maximum) significantly influences leaf phenology (Fig. 5). Spring temperatures (individual months March and April and the means of March−May) play an essential role after the leaves have unfolded. The increased temperature in this period accompanied by the high AWR cause an earlier onset of this stage. Results of the logistic regression (Table 1; Fig. 6) supported the crucial impact of the spring minimum temperature on the very early onset of leaf unfolding (positive extreme). The positive extreme occurs with 50% probability when the average minimum temperature exceeds 4.22 °C in March–May or 0.62 °C in March. The significant positive correlation between leaf coloring and the maximum September–October temperature indicates later yellowing of leaves during warmer autumns. The entire period with green leaves is positively affected by the growing season temperature.
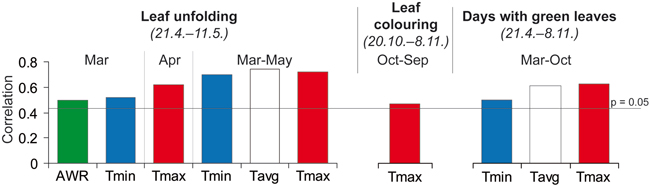
Fig. 5. Pearson’s correlation coefficient of the phenological phases (calendar days shown in italics under the title) with climate factors for the period of 1992–2011. Only significant correlations are listed. Tmin – average monthly minimum temperature, Tavg – average monthly temperature, Tmax – average monthly maxima temperature and AWR – relative water availability in the soil depth 0–1.3 m.
| Table 1. Logistic regressions between the positive and negative extremes (years in which values exceeded ±1.0 standard deviation) of leaf unfolding and the most significant climate factors (Tmin = temperature minimum, Tavg = temperature average, Tmax = temperature maximum, AWR = relatively available water in the soil depth 0–1.3 m) for the period of 1961–2011. Months are represented by their first three letters: Mar is March, Apr is April, Mar–May is March–May. Only the statistics of the independent variables are listed. | ||||||
| Extremes | Climatic Parameter | Estimate | Std.Error | z value | p (>|z|) | Likelihood ratio test |
| Negative | AWR (Mar) | –1.572 | 5.098 | –308.000 | 0.758 | − |
| Tmin (Mar) | –0.250 | 0.379 | –0.661 | 0.508 | − | |
| Tmax (Apr) | –0.158 | 0.325 | –0.486 | 0.627 | − | |
| Tmin (Mar–May) | –0.750 | 0.872 | –0.860 | 0.390 | − | |
| Tavg (Mar–May) | –0.647 | 0.729 | –0.888 | 0.375 | − | |
| Tmax (Mar–May) | –0.497 | 0.578 | –0.859 | 0.390 | − | |
| Positive | AWR (Mar) | 15.930 | 12.700 | 1.254 | 0.210 | − |
| Tmin (Mar) | 1.723 | 1.027 | 1.678 | 0.093 | 0.014 | |
| Tmax (Apr) | 47.100 | 38094.900 | 0.001 | 0.999 | − | |
| Tmin (Mar–May) | 4.350 | 2.276 | 1.911 | 0.056 | 0.002 | |
| Tavg (Mar–May) | 1300.000 | 205354.000 | 0.006 | 0.995 | − | |
| Tmax (Mar–May) | 5.320 | 4.093 | 1.300 | 0.194 | − | |
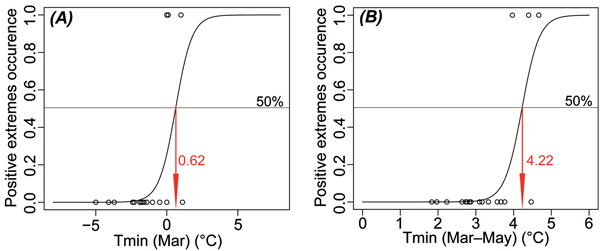
Fig. 6. Results of logistic regression presenting critical values of minimum temperatures (Tmin) in March (A) and March–May period (B) when positive extremes (values exceeding +1.0 standard deviation) of the leaf unfolding occur with 50% probability.
3.4 Climate–tree-ring width growth relationship
The TRW was found to be negatively influenced by the temperature of a given year and that of the previous year. The maximum temperature during the growing season (April–August) seems to highly affect European beech TRW growth. The correlation coefficients were slightly higher at the beginning of the growing season in April than in the summer months. Accordingly, TRW responded negatively to the preceding late summer temperature (July–September), and Pearson’s correlation coefficient was maximized in this period (Tavg = –0.48; Fig. 7a).
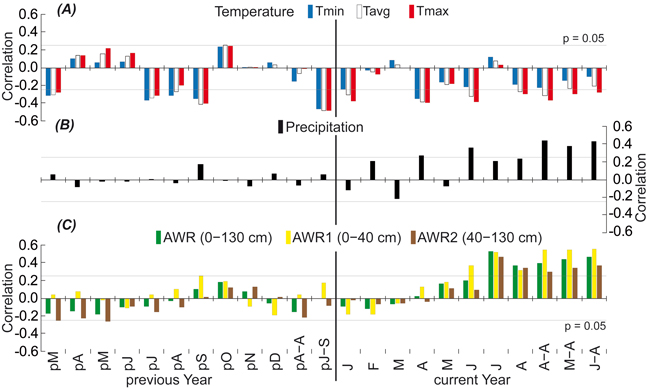
Fig. 7. Response of the regional residual tree-ring index chronology to (A) temperature (Tmin = minimum, Tavg = average, and Tmax = maximum), (B) precipitation and (C) relatively available water in different deep soil profile (AWR = 0–130 cm, AWR1 = 0–40 cm, and AWR2 = 40–130 cm) for the period of 1961–2011. The correlations are presented from March of the previous year (pM) to August of the current year (A) and various seasonal periods. Each month is represented by its first letter: A–A is April–August, J–S is July–September, M–A is May–August, and J–A is June–August. Thin lines indicate the 0.05 significance level.
Overall, TRW growth was more sensitive to precipitation (Fig. 7b) and AWR (Fig. 7c) than temperature. The slightly negative effect, especially that of AWR2, during the preceding growing season gradually became a strong positive effect for all moisture characteristics throughout the growing season of the given year. This change reached significance in June and was maximized in July, at which point the correlation coefficient (0.53) for the individual month was also maximized. The TRW was found to be more influenced by AWR than precipitation during the growing season. Moreover, the correlations were stronger for AWR1 than for the deeper AWR2 during the same time period (Fig. 5c).
Negative extremes of TRW growth and the probability of their occurrence are strongly influenced by the availability of soil moisture and precipitation totals during the growing season (Table 2, Fig. 8). In accordance with the results presented in Fig. 7, AWR1 more strongly affects TRW than AWR2. The negative extreme occurs with 50% probability when one of the significant climate factors reaches the critical value (Fig. 8). AWR1 and the precipitation totals, as two of the most important factors, should decrease during the growing season (April–August) to 0.525 and 275 mm, respectively. None of the models for the temperature effects reached the 0.05 significance level (Table 2) and was consequently not considered further.
| Table 2. Logistic regression between the positive and the negative extremes (years in which values exceeded ±1.0 standard deviation) of the tree growth and the most significant climate factors (Tmin = temperature minimum, Tavg = temperature average, Tmax = temperature maximum, Prec = precipitation and relatively available water in different deep soil profile – AWR = 0–130 cm, AWR1 = 0–40 cm, and AWR2 = 40–130 cm) for the period of 1961–2011. Months are represented by their first three letters: Apr is April, Apr–Aug is April–August. Only the statistics of the independent variables are listed. | ||||||
| Extremes | Climatic Parameter | Estimate | Std.Error | z value | p (>|z|) | Likelihood ratio test |
| Negative | AWR1 (Apr−Aug) | –20.432 | 7.462 | –2.738 | 0.006 | 0.0002 |
| AWR2 (Apr−Aug) | –4.949 | 3.696 | –1.339 | 0.181 | − | |
| AWR (Apr−Aug) | –11.441 | 5.482 | –2.087 | 0.037 | 0.013 | |
| Prec (Apr−Aug) | –0.030 | 0.011 | –2.709 | 0.007 | 0.0003 | |
| Tmin (Apr) | 0.344 | 0.329 | 1.046 | 0.296 | − | |
| Tavg (Apr) | 0.407 | 0.257 | 1.582 | 0.114 | − | |
| Tmax (Apr) | 0.350 | 0.195 | 1.794 | 0.073 | 0.066 | |
| Positive | AWR1 (Apr–Aug) | 4.012 | 4.869 | 0.824 | 0.410 | − |
| AWR2 (Apr–Aug) | 1.284 | 2.807 | 0.457 | 0.647 | − | |
| AWR (Apr–Aug) | 2.129 | 3.506 | 0.607 | 0.544 | − | |
| Prec (Apr–Aug) | 0.000 | 0.005 | 0.080 | 0.936 | − | |
| Tmin (Apr) | –0.604 | 0.374 | –1.614 | 0.106 | − | |
| Tavg (Apr) | –0.588 | 0.339 | –1.735 | 0.083 | 0.056 | |
| Tmax (Apr) | –0.464 | 0.274 | –1.692 | 0.091 | 0.061 | |
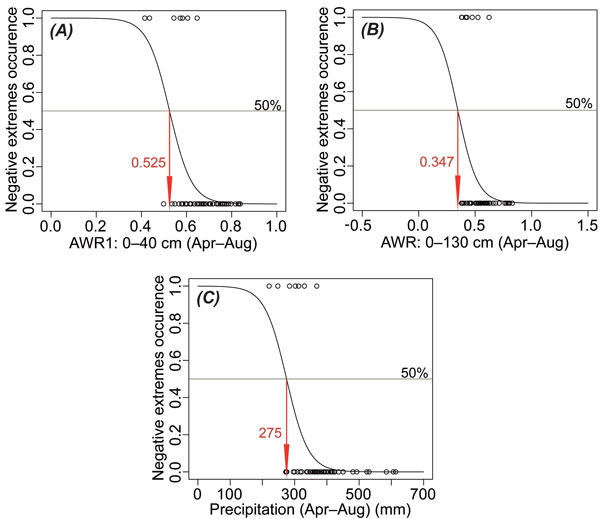
Fig. 8. Results of logistic regression presenting critical values of relative water availability in the soil depth 0–40 cm (AWR1; A) and 0–130 cm (AWR; B) and precipitation (C) all during growing season (April–August) when negative extremes (values exceeding –1.0 standard deviation) of the tree-ring width occur with 50% probability.
3.5 Tree-ring width growth–leaf phenology relationship
The variation in leaf phenology dates does not affect the raw TRW series. Very low t-test values (TBP = 1.28; THO = 0.50) and a low coefficient of agreement (65%) revealed a non-significant relationship. A low dependence supported a high number (50%) of measurements lying outside of the 95% confidence interval. This result suggests that the relatively stable dates of leaf unfolding and delayed dates of leaf coloring, which extend the phenological growing seasons, do not significantly affect the TRW growth of European beech.
4 Discussion
4.1 Climate–leaf phenology relationship
The study area was located well within the center of the European beech distribution area (Fig. 1b) and in the middle of the altitudinal range of the Czech Republic. Therefore, the presented analysis represents the relationships in an ecologically optimal environment for beech growth. Several studies have reported that earlier spring and later autumn onsets of phenological phases (longer growing season) resulted from the global temperature increase (e.g., Chmielewski and Rötzer 2001; Körner and Basler 2010; Davi et al. 2011), including in the Czech Republic (e.g., Bartošová et al. 2010 or Bauer et al. 2010). The leaf unfolding timing is mainly regulated by the temperature because a period of chilling temperatures (–5 to +10 °C) followed by a period of forcing temperatures (>0 °C) are both required to induce leaf unfolding in temperate tree species (Kramer 1996; Dittmar and Elling 2006). Our results gave evidence of a strong dependence of leaf unfolding on temperature. The earliest onsets of leaf unfolding observed in 2000, 2007 and 2009 coincided with the highest average March–April temperatures (Fig. 3). Davi et al. (2011) noted that the minimum temperatures are more strongly related to leaf unfolding in European beech than the average temperatures. Logistic regression analysis showed that the minimum temperature in the months (March–May) before leaf unfolding was crucial for the onset of positive extreme years (very early onset; Table 1 and Fig. 6). This relationship was in contrast to the negative influence of the spring temperature (mainly April; Fig. 7) on TRW growth. Increasing temperatures combined with a limited water supply (from winter) can decrease the water availability in soil. Additionally, the temperature impact combined with that of AWR. Vavrčík et al. (2013) also highlighted the impact of temperature and AWR on the onset of cambial activity in European beeches growing in the same area.
According to our research, leaf yellowing was usually observed in October/early November. This timing was in line with the phenological observations in most locations in Central and Western Europe (e.g., Estrella and Menzel 2006; Delpierre et al. 2009; Bednářová et al. 2010). Leaf yellowing has been reported to be mainly driven by the mean September–October (Delpierre et al. 2009) or September (Estrella and Menzel 2006) temperatures. Nevertheless, we found that the maximum temperature had the highest impact on leaf unfolding (Fig. 5), without excluding other triggering factors.
The observed earlier onset of leaf unfolding and the pronounced delay in leaf coloring prolonged the growing season in the Drahany Highlands (Fig. 3). Several studies confirmed this extension based on the spring shift (e.g., Chmielewski and Rötzer 2001 or Čufar et al. 2012, at higher altitudes of approximately 1000 m a.s.l.), the autumn shift (Delpierre et al. 2009), or both (Hájková et al. 2010). A longer growing season and a consequently longer photosynthetically active period should increase forest productivity. However, a comparison of the phenological growing season with TRW did not reveal a significant relationship. This finding corroborates those of Čufar et al. (2015), who performed a similar study of 15 different sites in Slovenia over a longer period. Therefore, a longer growing season can result in the consumption of assimilates and shortening of the dormancy period. A long-term extension can disturb physiological processes and subsequently result in tree decline (Bednářová et al. 2010).
4.2 Climate– tree-ring width growth relationship
The climate–TRW relationships indicated strong positive effects of precipitation and AWR during the growing season and a significant negative influence of temperature (mainly during previous July–September and April–August of the given year) on TRW growth. Several dendroclimatological studies of European beech trees growing in Central Europe and in the Mediterranean region showed similar results, highlighting the negative effect of drought on European beech growth (e.g., Scharnweber et al. 2011; Weber et al. 2013; Tegel et al. 2014). Accordingly, our results identified the growing season AWR as a key factor influencing TRW growth. Specifically, the July AWR had the most significant effect on TRW, whereas the effect of temperature was negligible. A comparison of the AWR impacts at different depths revealed that the effect of AWR1 was more significant than that of AWR2.
The importance of AWR1 for European beech growth is supported by this species’ fine root system, which controls its soil water and nutrient exploitation (Bolte and Villanueva 2006; Bruner et al. 2015). The fine roots of European beech are mostly distributed in the uppermost soil layers (to 40 cm), whereas the root density decreases with the soil depth (Meier and Leuschner 2008; Leuschner et al. 2004). During a drought, the fine root biomass decreases because of reductions in the transpiration and respiration rates (Brunner et al. 2015). A drought spell in the top soil layer (0–0.4 m) can influence forest productivity. Our results showed that the surface soil layer plays a key role, even in the case of negative extremes of TRW growth. The growing season AWR1 and precipitation are more closely linked to these negative extremes than AWR2 (Table 2, Fig. 8). The most significant negative TRW growth extremes in 1947, 1976, 1992, 1993 and 2000 corresponded to extreme drought years in the Czech Republic (Brázdil et al. 2009). Nevertheless, other negative extremes can be related to severe drought spells, as described by Brázdil et al. (2009; 2015), e.g., 1904, 1922, 1934 or 2007. Conversely, the extraordinarily hot and dry summer of 2003 across Europe (Fischer et al. 2007) was not reflected as the negative extreme year in our chronology. A drastically low AWR2 (mainly since June) was recorded in this year (Fig. 2), but values of AWR1 were only slightly substandard in the growing season, and the precipitation totals were significantly above average at the beginning of the growing season compared with the long-term means. Additionally, the wettest conditions in 1926 and 1965 (Brázdil et al. 2009) were not reflected in our data. Six positive extremes (1967, 1969, 1980, 1982, 1989 and 2001) were identified during the study period (1961–2011). In these six years, temperature, precipitation and AWR ranged around the long-term average.
Climate fluctuations (e.g., alternating drought extremes and floods) in recent decades could result in different responses in individual trees. Declining growth rates in recent years have been related to drier conditions (e.g., Scharnweber et al. 2011). Since, European beech is one of the most drought-susceptible species, therefore, suitable alternative solutions for species growth could be considered. European beech should be allowed to grow for at least 120–150 years, which is its felling age in the Czech Republic. One suggested possible solution is mixed forest composition (e.g., fir, birch or maple), which will reduce forestry risks related to climate changes during the next century in Central Europe (Geßler et al. 2007; Čermák and Holuša 2011).
5 Conclusion
We concluded that European beech stands growing in the ecological optimum remain significantly affected by droughts and increasing temperatures. The timing of leaf phenological phases is specifically controlled by the minimum temperatures. TRW is primarily affected by the AWR1 and precipitation totals (as for the spruce and oak in the same area), and adaptation of the surface fine root system is probably crucial for this species’ resistance to water stress. The extension of the phenological growing season resulting from the global temperature increase does not increase radial increment. However, scenarios of drought evolution in the next century (Brázdil et al. 2015) should be cause for serious concern in terms of the future of beech trees in the forests of Central Europe.
Acknowledgements
The paper was prepared within the Ministry of Education, Youth and Sports of CR within the National Sustainability Program I (NPU I), grant number LO1415; the “Frameworks and possibilities of forest adaptation measures and strategies connected with Climate change” (no. EHP-CZ02-OV-1-019-2014); Czechadapt – System for Exchange of Information on Climate Change Impacts, Vulnerability and Adaptation Measures on the Territory of the Czech Republic (no. EHP-CZ02-0V-1-066-01-2014); the Czech Republic Grant Agency through the grant numbered 13-04291S; and the project CZ.1.07/2.3.00/30.0031, Postdoc contracts at MENDELU technical and economic research, with the financial contribution of EC and the state budget of the Czech Republic.
References
Allen R.G., Pereira L.S., Raes D., Smith M. (1998). Crop evapotranspiration. Guidelines for computing crop water requirements. FAO Irrigation and Drainage Paper No. 56. 290 p.
Baillie M.G.L., Pilcher J.R. (1973). A simple cross-dating program for tree-ring research. Tree-Ring Bulletin 33: 7–14.
Bartošová L., Bauer Z., Trnka M., Štěpánek P., Žalud Z. (2010). Climatic factors and their influence on onset and duration of phenological phases of chosen plants at locations south Moravia during 1961–2007. Acta Universitatis Agriculturae et Silviculturae Mendelianae Brunensis 58(2): 35–44. http://dx.doi.org/10.11118/actaun201058020035.
Bauer Z., Trnka M., Bauerová J., Možný M., Štěpánek P., Bartošová L., Žalud Z. (2010). Changing climate and the phenological response of great tit and collared flycatcher populations in floodplain forest ecosystems in Central Europe. International Journal of Biometeorology 54: 99–111. http://dx.doi.org/10.1007/s00484-009-0259-7.
Bednářová E., Kučera J., Merklová L. (2010). The onset and duration of vegetative phenological stages in European beech (Fagus sylvatica L.) under changing conditions of the environment. Acta Universitatis Agriculturae et Silviculturae Mendelianae Brunensis 58(4): 2–30. http://dx.doi.org/10.11118/actaun201058040023.
Biondi F., Waikul K. (2004). DendroClim2002: AC++ program for statistical calibration of climate signals in tree ring chronologies. Computers & Geosciences 30: 303–311. http://dx.doi.org/10.1016/j.cageo.2003.11.004.
Bolte A., Villanueva I. (2006). Interspecific competition impacts on the morphology and distribution of fine roots in European beech (Fagus sylvatica L.) and Norway spruce (Picea abies (L.) Karst.). European Journal of Forest Research 125(1): 15–26. http://dx.doi.org/10.1007/s10342-005-0075-5.
Brázdil R., Trnka M., Dobrovolný P., Chromá K., Hlavinka P., Žalud Z. (2009). Variability of droughts in the Czech Republic, 1881–2006. Theoretical and Applied Climatology 97: 297–315. http://dx.doi.org/10.1007/s00704-008-0065-x.
Brázdil R., Trnka M., Mikšovský J., Řezníčková L., Dobrovolný P. (2015). Spring-summer droughts in the Czech Land in 1805–2012 and their forcings. International Journal of Climatology 35(7): 1405–1421. http://dx.doi.org/10.1002/joc.4065.
Brunner I., Herzog C., Dawes M.A., Arend M., Sperisen C. (2015). How tree roots respond to drought. Frontiers in Plant Science 6(547). http://dx.doi.org/10.3389/fpls.2015.00547.
Büntgen U., Frank D.C., Wilson R., Carrer M., Urbinati C., Esper J. (2008). Testing for tree-ring divergence in the European Alps. Global Change Biology 14: 2443–2453. http://dx.doi.org/10.1111/j.1365-2486.2008.01640.x.
Čermák P., Holuša O. (2011). Forestry adaptation measures at the decline of Norway spruce (Picea abies Karst.) stands as exemplified by the Silesian Beskids, Czech Republic. Acta Universitatis Agriculturae et Silviculturae Mendelianae Brunensis 59(1): 293–302. http://dx.doi.org/10.11118/actaun201159010293.
Chmielewski F.M., Rötzer T. (2001). Response of tree phenology to climate change across Europe. Agricultural and Forest Meteorology 108: 101–112. http://dx.doi.org/10.1016/S0168-1923(01)00233-7.
Cook E.R., Peters K. (1997). Calculating unbiased tree-ring indices for the study of climatic and environmental change. Holocene 7: 361–370. http://dx.doi.org/10.1177/095968369700700314.
Coufal L., Houška V. (2004). Fenologický atlas. [Fenological Atlas]. Publishing house of Czech Hydrometeorological Institute, Praha. 264 p. ISBN 80-86690-21-0.
Čufar K., de Luis M., Saz M.A., Črepinšek Z., Kajfež-Bogataj L. (2012). Temporal shifts in leaf phenology of beech (Fagus sylvatica) depend on elevation. Trees – Structure and Function 26: 1091–1100. http://dx.doi.org/10.1007/s00468-012-0686-7.
Čufar K., de Luis M., Prislan P., Gričar J., Črepinšek Z., Merela M., Kajfež-Bogataj L. (2015). Do variations in leaf phenology affect radial growth variations in Fagus sylvatica? International Journal of Biometeorology 59(8): 1127–1132. http://dx.doi.org/10.1007/s00484-014-0896-3.
Czech Hydrometeorological Institute (1987). Metodologická príručka č. 10: Návod pro činnost meteorologických stanic – Lesní rostliny. [Methodology No. 10: instructions for meteorological stations – forest plants]. Publishing house of Czech Hydrometeorological Institute, Prague, Czech Republic. 111 p.
Davi H., Gillmann M., Ibanez T., Cailleret M., Bontemps A., Fady B., Lefèvre F. (2011). Diversity of leaf unfolding dynamics among tree species: new insights from a study along an altitudinal gradient. Agricultural and Forest Meteorology 151(12): 1504–1513. http://dx.doi.org/10.1016/j.agrformet.2011.06.008.
Delpierre N., Dufrêne E., Soudani K., Ulrich E., Cecchini S., Boé J., François C. (2009). Modelling interannual and spatial variability of leaf senescence for three deciduous tree species in France. Agricultural and Forest Meteorology 149(6–7): 938–948. http://dx.doi.org/10.1016/j.agrformet.2008.11.014.
Dittmar C., Elling W. (2006). Phenological phases of common beech (Fagus sylvatica L.) and their dependence on region and altitude in Southern Germany. European Journal of Forest Research 123: 181–188. http://dx.doi.org/10.1007/s10342-005-0099-x.
Dubrovský M., Trnka M., Holman I.P., Svobodová E., Harrison P.A. (2015). Developing a reduced-form ensemble of climate change scenarios for Europe and its application to selected impact indicators. Climatic Change 128: 169–186. http://dx.doi.org/10.1007/s10584-014-1297-7.
Eckstein D., Bauch J. (1969). Beitrag zur Rationalisierung eines dendrochronologischen Verfahrens und zur Analyse seiner Aussagesicherheit. Forstwissenschaftliches Centralblatt 88: 230–250. http://dx.doi.org/10.1007/BF02741777.
Ellenberg H. (1996). Vegetation Mitteleuropas mit den Alpen, 5th ed. Ulmer, Stuttgart. 1095 p.
Estrella N., Menzel A. (2006). Responses of leaf colouring in four deciduous tree species to climate and weather in Germany. Climate Research 32(3): 253–267. http://dx.doi.org/10.3354/cr032253.
Fischer E.M., Seneviratne S.I., Vidale P.L., Lüthi D., Schär C. (2007). Soil moisture–atmosphere interactions during the 2003 European summer heat wave. Journal of Climate 20: 5081–5099. http://dx.doi.org/10.1175/JCLI4288.1.
Fritts H.C., Mosimann J.E., Bottorff C.P. (1969). A revised computer program for standardizing tree – ring series. Tree Ring Bulletin 29: 15–20.
Gerard B., Breda N. (2014). Radial distribution of carbohydrate reserves in the trunk of declining European beech trees (Fagus sylvatica L.). Annals of Forest Science 71: 675–682. http://dx.doi.org/10.1007/s13595-012-0240-1.
Geßler A., Keitel C., Kreuzwieser J., Matyssek R., Seiler W., Rennenberg H. (2007). Potential risks for European beech (Fagus sylvatica L.) in a changing climate. Trees – Structure and Function 21: 1–11. http://dx.doi.org/10.1007/s00468-006-0107-x.
Giesecke T., Hickler T., Kunkel T., Sykes M.T., Bradshaw R.H.W. (2007). Towards an understanding of the Holocene distribution of Fagus sylvatica L. Journal of Biogeography 34: 118–131. http://dx.doi.org/10.1111/j.1365-2699.2006.01580.x.
Grissino-Mayer H.D. (2001). Evaluating crossdating accuracy: a manual and tutorial for the computer program COFECHA. Tree-Ring Research 57(2): 205–221.
Grissino-Mayer H.D., Holmes R., Fritts H.C. (1992). International tree–ring data bank program library. Version 1.1. Laboratory of Tree–Ring Research, University of Arizona, Tucson.
Grundmann B.M., Bolte A., Bonn S., Roloff A. (2011). Impact of climatic variation on growth of Fagus sylvatica and Picea abies in Southern Sweden. Scandinavian Journal of Forest Research 26(S11): 64–71. http://dx.doi.org/10.1080/02827581.2011.564392.
Hájková L., Nekovár J., Richterová D. (2010). Assessment of vegetative phenological phases of European beech (Fagus sylvatica L.) in relation to effective temperature during period of 1992–2008 in Czechia. Folia Oecologica 37(2): 125–135. http://www.highbeam.com/doc/1P3-2276485981.html.
Hlavinka P., Trnka M., Balek J. (2011). Development and evaluation of the SoilClim model for water balance and soil climate estimates. Agricultural Water Management 98(8): 1249–1261. http://dx.doi.org/10.1016/j.agwat.2011.03.011.
Hollstein E. (1980). Mitteleuropäische Eichenchronologie. Trierer dendrochronologische Forschungen zur Archäologie und Kunstgeschichte. Trierer Grabungen und Forschungen 11. Mainz am Rhein. 273 p.
IPCC (2013). Climate change 2007: the physical science basis. Technical report. In: Solomon S., Qin D., Manning M., Chen Z., Marquis M., Averyt K.B., Tignor M., Mille H.L. (eds). Contribution of working group I to the fourth assessment report of the intergovernmental panel on climate change. Ambridge University Press, Cambridge, United Kingdom and New York, NY, USA. 996 p.
Keenan T.F., Gray J., Freidl M.A., Toomey M., Bohrer G., Hollinger D.Y., Munger J.W., O’Keefe J., Schmid H.P., Wing I.S., Yang B., Richardson A.D. (2014). Net carbon uptake has increased through warming-induced changes in temperate forest phenology. Nature Climate Change 4: 598–604. http://dx.doi.org/10.1038/nclimate2253.
Körner C., Basler D. (2010). Phenology Under Global Warming. Science 327: 1461–1462. http://dx.doi.org/10.1126/science.1186473.
Kramer K. (1996). Phenology and growth of European trees in relation to climate change. Thesis Landbouw Universiteit Wageningen. 210 p. ISBN 90-5485-464-2.
Leuschner C., Hertel D., Schmid I., Koch O., Muhs A., Hölscher D. (2004). Stand fine root biomass and fine root morphology in old-growth beech forests as a function of precipitation and soil fertility. Plant and Soil 258: 43–56. http://dx.doi.org/10.1023/B:PLSO.0000016508.20173.80.
Meier I.C., Leuschner Ch. (2008). Belowground drought response of European beech: fine root biomass and carbon partitioning in 14 mature stands across a precipitation gradient. Global Change Biology 14: 2081–2095. http://dx.doi.org/10.1111/j.1365-2486.2008.01634.x.
Menzel A., Estrella N. (2001). Plant phenological changes. In: Walther G.R., Burga C.A., Edwards P.J. (eds.). ‘Fingerprints’ of climate change – adapted behaviour and shifting species ranges. Kluwer Academic/Plenum Publishers, New York. p. 123–137. http://dx.doi.org/10.1007/978-1-4419-8692-4_8.
Michelot A., Bréda N., Damesin C., Dufrêne E. (2012). Differing growth responses to climatic variations and soil water deficits of Fagus sylvatica, Quercus petraea and Pinus sylvestris in a temperate forest. Forest Ecology and Management 265: 161–171. http://dx.doi.org/10.1016/j.foreco.2011.10.024.
Mölder I., Leuschner C. (2014). European beech grows better and is less drought sensitive in mixed than in pure stands: tree neighbourhood effects on radial increment. Trees – Structure and Function 28: 777–792. http://dx.doi.org/10.1007/s00468-014-0991-4.
OPRL (2001). Oblastní plány rozvoje lesů, přírodní lesní oblasti ČR. [Regional Plans of Forest Development, natural forest areas of the Czech Republic]. ÚHÚL – Ústav pro hospodářskou úpravu lesů Brandýs nad Labem. ISBN: 80-86386-24-4.
Peterken G.F., Mountford E.P. (1996). Effects of drought on beech in Lady Park Wood, an unmanaged mixed deciduous woodland. Forestry 69(2): 125–136. http://dx.doi.org/10.1093/forestry/69.2.125.
Piao S.L., Ciais P., Friedlingstein P., Peylin P., Reichstein M., Luyssaert S., Margolis H., Fang J.Y., Barr A., Chen A., Grelle A., Hollinger D.Y., Laurila T., Lindroth A., Richardson A.D., Vesala T. (2008). Net carbon dioxide losses of northern ecosystems in response to autumn warming. Nature 451: 49–52. http://dx.doi.org/10.1038/nature06444.
Polgar C.A., Primack R.B. (2011). Leaf-out phenology of temperate woody plants: from trees to ecosystems. New Phytologist 191: 926–941. http://dx.doi.org/10.1111/j.1469-8137.2011.03803.x.
Quinn G.P., Keough M.J. (2002). Experimental design and data analysis for biologists. Cambridge University Press, Cambridge, U.K. 537 p. http://dx.doi.org/10.1017/cbo9780511806384.
Rossi S., Deslauriers A., Gričar J., Seo J.W., Rathgeber C.W.G., Anfodillo T., Morin H., Levanič T., Oven P., Jalkanen R. (2008). Critical temperatures for xylogenesis in conifers of cold climates. Global Ecology and Biogeography 17(6): 696–707. http://dx.doi.org/10.1111/j.1466-8238.2008.00417.x.
Rossi S., Girard M., Morin H. (2014). Lengthening of the duration of xylogenesis engenders disproportionate increases in xylem production. Global Change Biology 20: 2261–2271. http://dx.doi.org/10.1111/gcb.12470.
Rybníček M., Kolář T., Čermák P., Žid T., Hadaš P. (2012). Dendrochronological analysis and habitual stress diagnostic assessment of Norway spruce (Picea abies) stands in the Drahany Highlands. Wood Research 57(2): 189–206. http://dx.doi.org/10.2478/s13386-012-0003-7.
Rybníček M., Čermák P., Žid T., Kolář T., Trnka M., Büntgen U. (2015). Exploring growth variability and crown vitality of sessile Oak (Quercus petraea) in the Czech Republic. Geochronometria 42: 17–27. http://dx.doi.org/10.1515/geochr-2015-0003.
Scharnweber T., Manthey M., Criegee Ch., Bauwe A., Schröder Ch., Wilmking M. (2011). Drought matters – declining precipitation influences growth of Fagus sylvatica L. and Quercus robur L. in north-eastern Germany. Forest Ecology and Management 262: 947–961. http://dx.doi.org/10.1016/j.foreco.2011.05.026.
Štěpánek P. (2007). ProClimDB – software for processing climatological datasets. CHMI, regional office Brno. http://www.climahom.eu/ProcData.html.
Štěpánek P., Zahradníček P., Skalák P. (2009). Data quality control and homogenization of air temperature and precipitation series in the area of the Czech Republic in the period 1961–2007. Advances in Science and Research 3: 23–26. http://dx.doi.org/10.5194/asr-3-23-2009.
Štěpánek P., Zahradníček P., Huth R. (2011). Interpolation techniques used for data quality control and calculation of technical series: an example of Central European daily time series. Idöjárás 115(1–2): 87–98.
Tegel W., Seim A., Hakelberg D., Hoffmann S., Panev M., Westphal T., Büntgen U. (2014). A recent growth increase of European beech (Fagus sylvatica L.) at its Mediterranean distribution limit contradicts drought stress. European Journal of Forest Research 133(1): 61–71. http://dx.doi.org/10.1007/s10342-013-0737-7.
Trnka M., Olesen J.E., Kersebaum K.C., Skjelvag A.O., Eitzinger J., Seguin B., Peltonen-Sainio P., Rötter R., Iglesias A., Orlandini S., Dubrovsky M., Hlavinka P., Balek J., Eckersten H., Cloppet E., Calanca P., Gobin A., Vucetic V., Nejedlik P., Kumar S., Lalic B., Mestre A., Rossi F., Kozyra J., Alexandrov V., Semeradova D., Zalud Z. (2012). Agroclimatic conditions in Europe under climate change. Global Change Biology 17(7): 2298–2318. http://dx.doi.org/10.1111/j.1365-2486.2011.02396.x.
Trnka M., Brázdil R., Možný M., Štěpánek P., Dobrovolný P., Zahradníček P., Balek J., Semerádová D., Dubrovský M., Hlavinka P., Eitzinger J., Wardlow B., Svoboda M., Hayes M., Žalud Z. (2015). Soil moisture trends in the Czech Republic between 1961 and 2012. International Journal of Climatology 35: 3733–3747. http://dx.doi.org/10.1002/joc.4242.
van der Werf G.W., Sass-Klaassen U., Mohren G.M.J. (2007). The impact of the 2003 summer drought on the intra-annual growth pattern of beech (Fagus sylvatica L.) and oak (Quercus robur L.) on a dry site in the Netherlands. Dendrochronologia 25: 103–112. http://dx.doi.org/10.1016/j.dendro.2007.03.004.
Vavrčík H., Gryc V., Menšík L., Baar J. (2013). Xylem formation in Fagus sylvatica during one growing season. Dendrobiology 69(1): 69–75. http://dx.doi.org/10.12657/denbio.069.008.
Vitasse Y., François C., Delpierre N., Dufrêne E., Kremer A., Chuine I., Delzon S. (2011). Assessing the effects of climate change on the phenology of European temperate trees. Agricultural and Forest Meteorology 151(7): 969–980. http://dx.doi.org/10.1016/j.agrformet.2011.03.003.
Way D.A., Montgomery R.A. (2015). Photoperiod constraints on tree phenology, performance and migration in a warming world. Plant, Cell & Environment 38(9): 1725–36. http://dx.doi.org/10.1111/pce.12431.
Weber P., Bugmann H., Pluess A.R., Walthert L., Rigling A. (2013). Drought response and changing mean sensitivity of European beech close to the dry distribution limit. Trees – Structure and Function 27: 171–181. http://dx.doi.org/10.1007/s00468-012-0786-4.
Wigley T.M.L., Briffa K.R., Jones P.D. (1984). On the average value of correlated time series, with applications in dendroclimatology and hydrometeorology. Journal of Applied Meteorology and Climatology 23: 201–213. http://dx.doi.org/10.1175/1520-0450(1984)023<0201:OTAVOC>2.0.CO;2.
Total of 67 references.
