Miguel Angel Salinas-Melgoza  ,
Margaret Skutsch,
Jon C. Lovett,
Armonia Borrego
,
Margaret Skutsch,
Jon C. Lovett,
Armonia Borrego
Carbon emissions from dryland shifting cultivation: a case study of Mexican tropical dry forest
Salinas-Melgoza M. A., Skutsch M., Lovett J. C., Borrego A. (2017). Carbon emissions from dryland shifting cultivation: a case study of Mexican tropical dry forest. Silva Fennica vol. 51 no. 1B article id 1553. https://doi.org/10.14214/sf.1553
Highlights
- Under REDD+, shifting cultivation should be considered degradation rather than deforestation
- Carbon stocks in old fallows (>20 years) are higher than those in old growth forests which have never been used for shifting cultivation
- Extending length of fallows increases rates of carbon emissions
- Shortened fallow cycles result in higher carbon stocks and lower emissions at the landscape level
- Cycle lengths could be optimized for carbon sequestration in a land sharing approach.
Abstract
The article considers the relation of shifting cultivation to deforestation and degradation, and hence its impacts in terms of carbon emissions and sequestration potential. There is a need to understand these relationships better in the context of international policy on Reduced Emissions from Deforestation and Forest Degradation (REDD+). The article reviews the way in which shifting cultivation has been incorporated in global and national estimations of carbon emissions, and assembles the available information on shifting cultivation in Tropical Dry Forests (TDF) in Mexico, where it is widely practiced. It then takes the case of two villages, Tonaya and El Temazcal, which lie within the basin of the River Ayuquila in Jalisco, Mexico. Field data for the typical carbon stocks and fluxes associated with shifting cultivation are compared with stocks and fluxes associated with more intensive agricultural production in the same dry tropical forest area to highlight the carbon sequestration dynamics associated with the shortening and potential lengthening of the fallow cycles. The biomass density in the shifting cultivation system observed can reach levels similar to that of old growth forests, with old fallows (>20 years) having higher carbon stocks than old growth forests. Per Mg of maize produced, the biomass-related emissions from shifting cultivation in the traditional 12 year cycle are about three times those from permanent cultivation. We did not, however, take into account the additional emissions from inputs that result from the use of fertilizers and pesticides in the case of permanent agriculture. Shortening of the fallow cycle, which is occurring in the study area as a result of government subsidies, results in higher remaining stocks of carbon and lower emissions at the landscape level.
Keywords
carbon stocks;
slash-and-burn;
swidden cultivation;
REDD ;
land sparing;
Borlaug hypothesis
-
Salinas-Melgoza,
University of Twente, Drienerlolaan 5, 7522 NB Enschede, the Netherlands
 http://orcid.org/0000-0003-3209-1659
E-mail
ma.masm@gmail.com
http://orcid.org/0000-0003-3209-1659
E-mail
ma.masm@gmail.com
-
Skutsch,
Universidad Nacional Autónoma de México (CIGA-UNAM), Antigua Carretera a Pátzcuaro No. 8701, Col. Ex-Hacienda de San José de la Huerta, Campus Morelia, C.P. 58190, Michoacán, Mexico
http://orcid.org/0000-0001-6120-4945
E-mail
mskutsch@ciga.unam.mx
- Lovett, University of Leeds, Leeds, LS2 9JT, UK E-mail j.lovett@leeds.ac.uk
- Borrego, CONACYT-Centro de Investigaciones en Geografía Ambiental, Antigua Carretera a Pátzcuaro No. 8701, Col. Ex-Hacienda de San José de la Huerta, Campus Morelia, C.P. 58190, Michoacán, México E-mail aborrego@ciga.unam.mx
Received 22 January 2016 Accepted 23 February 2017 Published 2 March 2017
Views 285340
Available at https://doi.org/10.14214/sf.1553 | Download PDF

Supplementary Files
1 Introduction
Shifting cultivation (SC), also known as swidden cultivation or slash and burn, is a traditional continuous cyclic agricultural system that is still widely used, and studied, in tropical countries (Grigg 1974; Aweto 2013a; Nigh and Diemont 2013). It entails rotation between cultivated plots and regenerating fallow/secondary forest (Kass et al. 1993; Kleinman et al. 1995; Aweto 2013b). Forest or secondary vegetation is cut, the debris is burned, and a cultivation phase of two or three years starts, with very limited use of pesticides or fertilizers. After a few years of cultivation the yield falls and the farmer moves on, clearing new land. The old cultivated plot is fallowed, leaving the vegetation to recover and allowing secondary forest re-growth. Shifting cultivators often return to re-cultivate the fallowed plot some time later; the rest period may range from 5 to 50 years (Aweto 2013a).
During the colonial period, shifting cultivation was generally considered “wasteful” and “primitive” (Geertz 1963; Spencer 1966; KucheImeister 1993). Despite the fact that during the last 25 years many scientific articles have vigorously contested the negative effect of shifting cultivation (Rambo 1990; Fox et al. 2000; Ickowitz 2006), this point of view is still very common. Shifting cultivation has been blamed as a leading cause of tropical forest cover loss (Geist and Lambin 2001, 2002) and thus, in the context of climate change, for the associated carbon emissions (Houghton 2012; Nigh and Diemont 2013). That opinion is reflected in many national policy documents relating to mitigation, as submitted to the Forest Carbon Partnership Facility of the World Bank (e.g. Democratic Republic of Congo 2016, Ghana 2015, Dominican Republic 2015).
The aim of this paper is to consider the impact of shifting cultivation on carbon stocks and fluxes, and its potential for carbon sequestration in the context of the policy on Reduced Emissions from Deforestation and Forest Degradation (REDD+), and to compare this with alternative forms of production of maize. We focus on one ecosystem, tropical deciduous forest, typified for the case of Mexico by selva baja caducifolia (Miranda and Hernández-Xolocotzi 1963) and commonly known as Tropical Dry Forest (TDF). This is a dryland vegetation type, similar to the cerrado of Brazil and the miombo of East Africa. We examine the impact of maize production on carbon stocks, and consider the related carbon sequestration potential in TDF in Mexico, based on a detailed study in two villages, El Temazcal and Tonaya, in Jalisco state, Mexico.
We set out to answer three questions based on this case study: (1) per Mg of maize produced, how much carbon is emitted in shifting cultivation systems as compared to a permanent cultivation system and what are the remaining carbon stock levels in each case; (2) what would be the effects on carbon emission rates and stocks of shortening or lengthening the fallow period; and (3) what is the potential for carbon sequestration in these dry land farming systems. While the answers to these questions may be of immediate relevance to policy makers designing interventions for national REDD+ programmes, they are also of scientific interest in relation to the Borlaug hypothesis (Angelsen and Kaimowitz 2001; Lobell et al. 2013). This posits that switching to sedentary agriculture (e.g. more intensive cultivation with higher yield per unit area) will ´spare´ more forest for conservation purposes.
2 Literature review
2.1 Carbon stocks in shifting cultivation systems
Although many studies have discussed possible schemes, challenges and opportunities for SC in the context of reducing carbon emissions and increasing carbon sequestration (Mertz 2009; Hett et al. 2012; Antunes et al. 2013; Aryal et al. 2014), few studies have quantified the emissions from SC in the context of REDD+ (Mertz 2009). It is obvious that during clearance there will be emissions, not only as a result of loss of the woody vegetation but also because carbon concentrations in soil are lowered as a result of soil oxidation and because the litter supply to the soil is temporarily disrupted. Carbon stocks would be expected to increasing during the fallow phases due to accumulation of organic matter in soil (Antunes et al. 2013), although the time needed to reach the original stock levels may vary greatly (Lebrija-Trejos et al. 2008). For example, Detwiler and Hall (1988) found a loss of 18% in soil carbon (including both mineral and soil organic carbon, SOC) during the clearance phase, and Don et al. (2011) found increases of between 38% and 50% in SOC when the land is in the fallow or secondary succession stage, between 7 and 37 years after cultivation. There is little doubt about the general nature of these dynamics, although the cycle lengths of shifting cultivation systems vary from location to location. What is more in doubt are the effects of different fallow lengths on carbon stocks. It is commonly suggested that longer fallow lengths are associated with higher levels of above-ground biomass and higher concentrations of soil carbon (Read and Lawrence 2003; Lebrija-Trejos et al. 2008). We argue that both a space and a time frame are needed to analyze this properly, since it is emissions over time, not stocks, that are of primary interest in the context of REDD+.
Under a shifting cultivation regime, the landscape is a mosaic of forests of different ages in a continuum of forest succession (Aweto 2013a). Shortening the SC cycles is usually thought to result in lower average above-ground biomass (Lawrence et al. 2010; Schmook 2010). We argue that this depends on the context and rationale for the shortened cycle. Cycles may be shortened as a result of population pressure and the need to bring a higher proportion of the total area into cultivation at any one time, but they may also be shortened as a result of policy measures, such as subsidies. If as a result of shortened cycles other areas that were earlier part of the cultivation cycle are abandoned completely, it is quite possible that over the entire area, average carbon stocks will rise. The case of Programa de Apoyos Directos al Campo (PROCAMPO), a grant paid to small farmers all over Mexico, is an example; farmers may register land for this scheme, but the money is paid only provided the land is under cultivation or pasture (Sadoulet et al. 2001). In the first three years of fallow following the cultivation period the land may be counted as pasture because re-growing trees have not yet reached a height of more than a couple of meters, and the area is used for grazing. Once the trees become taller and denser the area will no longer be eligible for the subsidy. Since registration of land was on a one-off basis, it is in farmers´ financial interest to bring the plot back into cultivation after three years of fallow. In addition to PROCAMPO, farmers have in recent years been able to obtain subsidies for inputs such as fertilizers and herbicides, which may reduce their dependence on the natural recovery processes of long fallows. In our study area, farmers mentioned that an additional reason for shortened cycles is to reduce the labour requirements, since clearing fallow of 3 or 4 years growth is much less burdensome than clearing old fallows.
Another factor to be considered is the carbon that may potentially be sequestered in forest in which stocks have been temporarily lowered by farming. Hence, continuous “harvesting” of the trees, such that the average tree population remains youthful, may result in higher average annual uptake of carbon. Recent research in humid tropical forests (rainforest in the Maya region of Central America, Amazon and Panama) has suggested that shifting cultivation is much less damaging to carbon stocks than had been earlier thought (Pelletier et al. 2012; Nigh and Diemont 2013). Whether the new plot is cut in previously un-touched (primary) forest or in a secondary forest may, however, have important consequences for CO2 emissions and carbon sequestration (Detwiler and Hall 1988; Fukushima et al. 2008; Lawrence et al. 2010).
Clearly, there are different pathways of vegetation change in tropical dry forest succession (Romero-Duque et al. 2007; Lebrija-Trejos et al. 2010). Cyclical use of forest resources may result in a steady state, with carbon stocks that are sustained, even if they are lower than they would be in “intact” forest (Lawrence et al. 2010; Antunes et al. 2013). However, it could also result in continuous loss of stocks as a result of over-exploitation from additional activities, such as timber harvesting, fire wood collection and grazing (Morales-Barquero et al. 2014). This could also be a result of increasing pressure of shifting cultivation due to need to bring more of the total area into production (Eaton and Lawrence 2009; Lawrence et al. 2010). The spatial-cyclical character of SC thus necessitates analysis at the level of the management unit (i.e. the whole area used in the cycle), not the pixel or the individual patch currently under cultivation, and the time horizon should be long (e.g. 20 years)
2.2 Definitions of deforestation and degradation under REDD+
Under UNFCCC policy (the Marrakech Accords) a forest is considered to become non-forest when it falls below a certain threshold for canopy cover (crown density), and remains so on a permanent basis (> 20 years) (UNFCCC 2001).The threshold lies between 10% and 30% and is selected by each country to meet its own requirements. Mexico has selected 30%, whereas Ghana for example has selected 15%. Following definitions used by FAO, an area that is temporarily destocked, but which is expected to revert to forest at the threshold level, is considered forest. Degradation has not been formally defined in UNFCCC documents up to now, although for the purposes of REDD+, it is understood to mean a lowering of biomass (and hence carbon) stocks while the forest retains a canopy cover above the selected threshold (FAO 2011). One can therefore argue that temporary de-stocking (e.g. in areas that are managed using a sustainable logging cycle with replanting) is a form of degradation. In SC systems, one part of the management unit is under cultivation while the rest is under successional forest re-growth. The canopy cover may be temporarily below the threshold in one patch, but will return within a few years; on average, the tree cover remains above the level required to be considered forest. Depending on the length of the cultivation and fallow cycles, and the growth rates of the trees during the fallow periods, SC may not lead to a continued decline in stocks, only to an average stocking level that is lower than that of the “intact” forest. What is clear is that in most cases SC does not lead to permanent (> 20 years) removal of tree cover, which is what is implied by “deforestation” in the context of REDD+. For the purposes of REDD+ it is therefore more appropriate to consider SC as a cause of forest degradation rather than of deforestation (Houghton 2012; Pelletier et al. 2012).
Shifting cultivation has been a stable and popular cultivation system throughout agricultural history, mainly because, although yields per hectare are low, it gives relatively high returns to labour (Raintree and Warner 1986; Seidenberg et al. 2003), and requires little capital. As such it is an efficient and sustainable food production system as long as population densities are low and the potential area for cultivation is abundant, so that the fallow period matches or exceeds the time necessary for recovery of the sites. However, much higher yields per hectare could be achieved with use of inputs such as fertilizers and pesticides.
Reduced Emissions from Deforestation and Forest Degradation policies commonly assume that intensification of agriculture would raise yields in areas already under production, reducing the need for further expansion into the forests (land sparing), thus reducing forest carbon emissions (Carter et al. 2015; Salvini et al. 2014). Higher yields might at the same time reduce the cultivation area needed and enable some cultivation areas to recover their forest status, thus increasing carbon sequestration (Carter et al. 2015). A switch from traditional shifting cultivation systems to permanent agriculture is often suggested as part of such a strategy (West et al. 2010). This has been modeled following optimization approaches that would allocate resources in the most efficient way, using a binary view of landscapes (agriculture/forest) to spare land and reduce deforestation (Pirard and Belna 2012; Byerlee et al. 2014), following the so-called Borlaug hypothesis (Angelsen and Kaimowitz 2001; Lobell et al. 2013). This kind of proposal is widely propagated in policy documents associated with REDD+, for example, in the Regional Strategy for REDD+ in the Yucatan Peninsula (ECOSUR 2012) and Mexico has been identified as one of the six priority countries with the potential to mitigate agriculture-driven deforestation emissions through such land sparing (Perfecto and Vandermeer 2010; Carter et al. 2015). On the other hand, fallow periods are shortening in some Mexican tropical dry forest (Chávez 1983; Lambert 1996; Abizaid and Coomes 2004; Cuanalo and Uicab-Covoh 2005; Dalle and de Blois 2006), and a reversal of this trend has also been proposed as a route to increasing carbon stocks and lowering emissions.
Thus, both intensification of agriculture (sedentarization) and de-intensification (extending fallow periods) are being proposed for improved environmental management in general and for the mitigation of carbon emissions in particular. Policy makers must understand the conditions that have given rise to shortened cycles before conclusions can be drawn about the carbon outcomes of different intervention options
2.3 Carbon characteristics of Tropical Dry Forest
Tropical dry forest (TDF) is widely distributed in Mexico (Miranda and Hernández-Xolocotzi 1963; Rzedowski 1978) in the drylands along the Pacific Ocean coast, the Gulf of Mexico and in some regions of the eastern coast (Fig. 1). It currently covers 60% of the total area of tropical vegetation (Trejo and Dirzo 2000), although earlier it was much more widespread. Multiple-stemmed trees account for 58.0% of total basal area (Durán et al. 2006; Álvarez-Yépiz et al. 2008). A characteristic of the carbon pools in many tropical dryland ecosystems is that above-ground biomass in living trees represents only a small part of the total carbon, with soil carbon often being the larger part (Scharlemann et al. 2014). Shrubs, litter and woody debris hold a very small proportion (Gibbs et al. 2007), and this has been confirmed in Mexico (Hughes et al. 1999; Jaramillo et al. 2003).
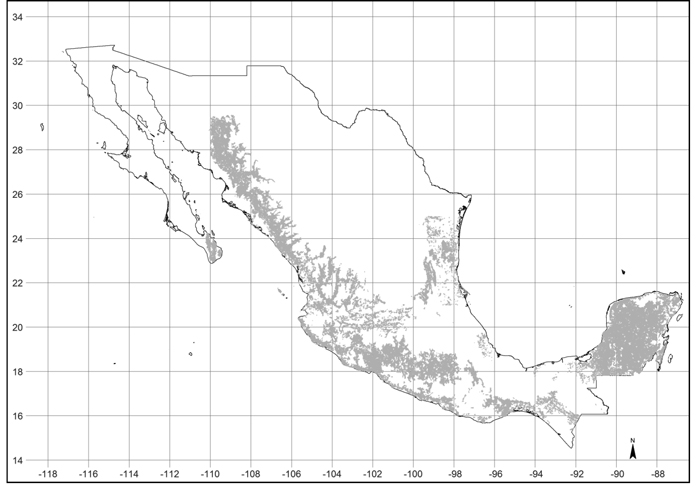
Fig. 1. Geographical distribution of tropical dry forest in Mexico (gray area). Data: INEGI 2010.
The most recent estimations of total forest carbon stocks in primary tropical dry forest in Mexico show wide variations: 46.7 to 571 Mg ha–1 (Delaney et al. 1997; Jaramillo et al. 2003, 2011; Vargas et al. 2008; Kauffman et al. 2009). Tropical Dry Forest has lower total carbon content than does tropical moist forest, even taking into account the high levels of carbon in the soil (Lai 2004). Above-ground carbon stocks in much Mexican TDF are well below those in the intact forest, because so much of this forest is degraded (Trejo and Dirzo 2000; Morales-Barquero et al. 2015). However, the few studies of the distribution of carbon have shown that in secondary TDF soil carbon levels are almost as high as in primary forest (INECC 2010).
2.4 Shifting cultivation in Mexico
Shifting cultivation is common in Mexico, often practiced by farmers as a secondary, extensive, production activity to complement the more intensive cultivation of rainfed or irrigated permanent plots (Hernández-Xolocotzi 1988; Hernández-Xolocotzi et al. 1995; Moreno-Calles et al. 2014). The better-quality, low-lying agricultural lands suited to permanent, and particularly to irrigated, agriculture are limited in availability, and the more marginal areas on the hillsides are usually used in a cyclic system with a long fallow period. Shifting cultivation is known by different names in different regions (e.g. milpa, coamil, ecuaro, tlacolol and tamagua); in the study area (Jalisco state) the term “coamil” is used. However, the geographic extent and distribution of shifting cultivation in Mexico is not clear. Government statistics, in Mexico as elsewhere, record areas under agriculture but do not differentiate between permanent (irrigated or rainfed) and shifting cultivation (Mertz 2009).
The shifting cultivation system in the state of Jalisco takes place on slopes or stony areas that are naturally covered by TDF. A piece of land is cleared, the majority of standing trees are removed from the plot, the debris is dried for one to five months and then burned. Then the farmer makes planting holes using a wooden stick with an iron blade (coa), into which the maize seeds are placed, often in combination with beans and squash. Shifting cultivation plots are usually used to produce maize for two years and then left fallow for periods ranging from 5 to 10 years, (Chávez 1983; Gerritsen 2002; Borrego and Skutsch 2014). Cattle are frequently allowed to graze on the area during the fallow, and occasionally the cleared areas are turned into permanent pastures and never return to cultivation. Shifting cultivation plots are usually found on hillsides with slopes > 12% and not on the plains (Chávez 1983). The nature of the terrain forces farmers to use hand tools rather than ploughs pulled by horses or tractors. The use of chemical inputs (fertilizers, herbicides) is much less than on permanent plots, not least because of the initial fertilizing effect of the burning, but in general yields per hectare are lower than on permanent plots, although the returns to labour are relatively high.
3 Case study
3.1 Study area
The villages of Tonaya and El Temazcal lie in the center of the basin of the River Ayuquila in Jalisco state (19°42´N, 103°54´W), western Mexico (Fig. 2), at approximately 990 m a.s.l., in an area where the natural vegetation is tropical dry forest, with some oak and coniferous forests on the higher slopes. The area is semi-arid with rainfall of approximately 650 mm per annum, falling almost entirely between June and September (Jardel et al. 2012). Regosols and lithosols account for ~80% of the surface area in Tonaya and 93% for El Temazcal: these soil types have little organic matter. Regosols predominate; they are young soils with depths > 20 cm, but with a layer that becomes hard and crusty when vegetation is removed, preventing the penetration of water. Lithosols are shallow (depth < 20 cm), and not well suited for agriculture.
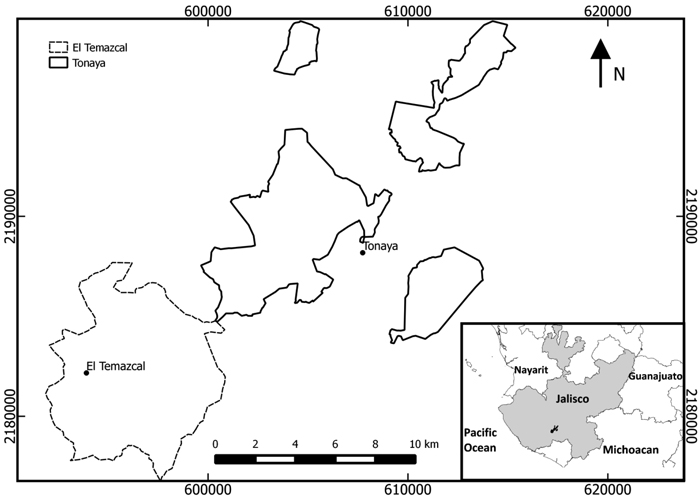
Fig. 2. Location of communities in Jalisco state, western Mexico in which shifting cultivation was investigated (EPSG projection: 32613-wgs84/utm zone 13N).
Many of the farmers have a plot for permanent agriculture (PA) in the valley. These fields are cultivated either once or twice a year, year in year out, with considerable use of chemical fertilizers and other inputs (Gerritsen 2002; Borrego and Skutsch 2014). They may also have a forest plot on the slopes for shifting cultivation (SC). In the terrain that is used for SC there is a mosaic of forest states; areas that have recently been slashed and burned and are now being cropped, combined with plots at various stages of the fallow cycle (FP). Shifting cultivation plots in the study area are usually between 0.24 and 0.72 ha (Chávez 1983). The older fallows that had been under fallow for 10–20 years may be considered secondary forests (Jardel et al. 2012). Some hill slopes have been cleared for permanent pastureland (PL). There are also a few patches of old growth (primary) forest (OG). These are areas which have never been used for SC and where big trees have never been felled, although there may be small scale extractive activities: e.g. for poles and firewood. The way in which the hill slope landscape is managed varies between communities.
In Tonaya the farmers select tree species to retain in the shifting cultivation plots, leaving in particular a few individuals of hardwood species with straight trunks and large branches, which are well suited for fence posts and house supports and construction materials. The root stocks of these species are left intact which allows rapid regeneration by coppicing. In El Temazcal in addition to cutting trees for firewood and fence posts, there is an active selection of tree species and in the fallow patches they remove species with small crowns and allow a few larger-crowned species to gain space in the canopy, thereby increasing shade for cattle in the fallow period.
3.2 Materials and methods
3.2.1 Data collection
Data on biomass and soil carbon (including both mineral carbon and SOC) were obtained in a survey carried out in August 2013 and March 2014. Plots were set up in FP and OG, where above-ground biomass was measured and soil samples taken for laboratory analysis of carbon content. Soil carbon data were also obtained from SC, and for comparison, also from permanent agriculture plots (PA) and permanent pasture land (PL).
A total of 23 FP sites were identified where maize had been grown in the previous 10 years, 10 in Tonaya and 13 in El Temazcal, and in addition 5 sites of PA, 4 of shifting cultivation plots (the cultivation phase), 6 of OG and 6 of PL were sampled. In addition, we have data on above-ground biomass on 15 plots in old fallow (OF). For these we do not have soil carbon data, but we conservatively assume that this is not higher than that of fallows of 10 years (FP3). The 23 FP sites were of different ages up to 20 years, which we divided into three age categories (FP1: years 3–6, FP2: years 7–9 and FP3: years 10–20, in each case following two years of cultivation), with 8, 5 and 10 sampling plots respectively for the FP1, FP2 and FP3 classes. Information on plot age was obtained from the owners. Old-fallow forest plots (fallows older than 20 years) supply information on the level of carbon stocks that could be achieved within the next 20 years if SC were to be halted; these were used as a reference (baseline) level.
Sites were selected with the assistance of local farmers to represent the different stages of the SC cycle. Within each of these areas, a sampling plot was laid out in a central location. Circular sample plot of 11.28 m radius (area 400m2) were used following IPCC guidance (Penman et al. 2003); circular plots are easy to lay out accurately and have the smallest circumference/area ratio (de Vries 1986). Diameter at breast height (DBH: 1.3 m height) was measured for all the trees with DBH > 2.5 cm, using diameter tapes or calipers, and the species and genus was identified; in case taxonomic identity for individuals cannot determined, individuals were labeled and grouped based on morphological sameness. Trees of less than 2.5 cm DBH were counted as woody stems. The dry above-ground biomass of trees was estimated using the general allometric equation of Martínez-Yrízar et al. (1992) (Eq. 1). Above-ground biomass of multi-stemmed trees was calculated separately for each stem if the split was below 1.3 m. To obtain estimates of the above-ground carbon (AGC), we used a conversion factor of 0.5. For details of the species in each category see Supplementary file 1, Table S1.
![]()
where B is above-ground dry biomass in kg, BA is stem basal area (cm2).
Sites with essentially no shrubs or trees (permanent pasture sites, cultivation phase of shifting cultivation plots and permanent agriculture sites) were considered to have zero AGC. This gives a conservative estimate of AGC stocks for the cultivation stage of the shifting cultivation system since, as mentioned above, it is common for farmers to leave one or two trees standing. Grass, litter and belowground biomass were not measured.
Data on soil carbon were obtained by collecting four soil cores from the top 10 cm (ca. 16–44 g each, with a bulk density of 0.59–1.58 g cm–3) at the northern, southern, eastern and western limits of each sampling plot. The four samples from each site were pooled to form a single sample and were sent for laboratory analysis, which followed the OHHW protocol with the CHNS/O Perkin Elmer 2400 Series II Elemental Analyzer in CHN mode (Ryu and Tenney 2005). Total carbon was obtained for each plot as the summation of AGC and soil carbon.
3.2.2 Statistical analysis of field data
We used analysis of variance to examine differences in carbon storage in the cultivation phase of shifting cultivation (CP) and fallow stages of shifting cultivation (FP), in old fallow (OF), in permanent agricultural plots (PA), permanent pasture land (PL), and old-growth forest (OG). Above-ground C and soil carbon were considered dependent variables, with land-use class as the independent variable. The fallow phases were analyzed in two ways, first as three phases of different ages (FP1, FP2 and FP3) and then as a single category (FP). Aboveground and soil C values were log and square root transformed when necessary to meet ANOVA assumptions regarding the homogeneity of error variances and distribution of residuals. The normality of the data distribution for AGC and soil carbon was tested separately for each class using the Shapiro-Wilk test while homogeneity of variances was evaluated using Bartlett’s test. The data set for AGC with the fallow phase considered as a single factor, and the other dependent variables, all fulfilled ANOVA assumptions (one-way ANOVA). Soil carbon and AGC analyzed as three separate fallow phases, and AGC with fallow phases as a group did not meet the ANOVA assumptions and so the Kruskal-Wallis One-Way ANOVA on Ranks was run instead, reporting the Kruskal-Wallis chi-squared approximation values (MacFarland and Yates 2016). In order to identify the treatments which are responsible for significant variation, two type of post hoc test were performed, a Tukey’s HSD when distribution was normal and pairwise comparisons using Tukey and Kramer (Nemenyi) test with Tukey-Dist approximation for independent samples when the distribution was non-normal. All the statistical tests were performed using the libraries stats and PMCMR of the R software (R Core Team 2013; Pohlert 2014) and were performed at a 0.05 significance level.
The differences in carbon stocks for AGC were tested at two levels of plot aggregation: (1) all plots in the fallow stage versus old growth sites, (2) the plots in fallow stage were grouped by age class categories. Soil carbon was analyzed in a similar way. To show the relation between soil carbon density and AGC density across the different wooded land uses, the mean ratios for both were calculated for FP1, FP2, FP3 and OF.
3.2.3 Estimation of carbon balance for production of 1 Mg of maize
Before the introduction of the PROCAMPO subsidy, the SC cycle in the study areas typically consisted of 2 years of cultivation phase followed by 10 years in fallow phases. Farmers who do not receive PROCAMPO may still follow this model. We compared: (a) the carbon stocks and emissions that would in the long run pertain in this shifting cultivation system (12-year cycle) compared with those in a permanent cultivation system over the same time period; (b) the average carbon emissions and stocks in different SC production regimes (6-year, 12-year and 24-year cycles, with 2 years cropping in each), under the assumption that the shortened cycles are not due to pressure on the land (which is the situation today in the study area; the six year cycle appears to be a response to the PROCAMPO intervention) and (c) a six-year SC system under land pressure, i.e. in which the shortened cycles are the result of an increase in demand for land (a hypothetical situation). To create a fair basis for comparison all calculations were made for production of one Mg of grains maize, holding land area constant within each comparison, and using old fallow (OF) as the baseline, since this represents the state of forests in the area when shifting cultivation is no longer practiced. The calculations are made on the basis of the long run proportion of land which would be under cultivation and under each fallow phase in the different systems (i.e. weighted by the length of each of these phases). All losses of carbon were annualized over a nominal period of 20 years. This is not in any way related to cycle lengths, but is used to as a common base to model the long run annual emissions that would result for each farming system.
Responses of 39 farmers to a questionnaire indicated average maize yields of 1.684 Mg ha–1 for SC and 3.768 Mg ha–1 for PA. Estimation of the carbon stock in parcels of SC and PA were based on the area needed to produce 1 Mg of maize in each system. In the 12 year SC system this is 0.60 ha for cultivation and 3.00 ha fallow, since the cultivation plot is used for 2 years, rotated 6 times; the total area required is therefore 3.60 ha. On average, at any one time 0.6 ha will be in cultivation, 1.20 will be under FP1 (years 3–6), 0.9 under FP2 (years 7–9) and 0.9 under FP3 (years 10–12). The larger area under FP1 is because FP1 is a four year phase while FP2 and FP3 last for 3 years. For PA the cultivation area is continuously 0.27 ha and to allow a fair comparison we assume that the farmer keeps the remaining part of the 3.60 (3.33 ha) in its baseline state (OF).
3.2.4 Estimating carbon impacts of shifting cultivation versus permanent agriculture
Using the carbon levels measured in the field we obtained the average annual carbon sequestered in each system for the production of 1 Mg maize per year, taking into account an equal area of land and using OF as the baseline. Using calculations shown in Suppl. file 2 (Table S2, second page of spreadsheet), and as explained in section 3.2.3, we then calculated the annualized emissions from PA and SC. The AGC for the CP of SC and for PA was considered to be zero, although in practice in SC a little woody vegetation is left in the cultivation area. The only carbon pool considered for permanent agriculture was the soil carbon, while for SC the carbon stocks were estimated as the weighted values of those of the CP and the different FP stages (see Table 1).
| Table 1. Mean and standard deviation (in parenthesis) of carbon stocks and other characteristics of sampled sites for shifting cultivation plots and different forest categories in study areas. | |||||||
| Class | No. of sites | Soil C (Mg ha–1) | AGC (Mg ha–1) | Total C (Mg ha–1) | DBH (cm) | No. of trees/ha with DBH ≥ 2.5cm | No. of stems/ha (includes multi-stemmed trees) |
| FP | 23 | 52.22 (18.51) | 7.03 (3.73) | 59.25 (23.16) | 9.1 (8.8) | 1096 (533) | 2202 (1110) |
| FP1 | 8 | 40.65 (9.81) | 6.46 (3.41) a | 47.12 (8.57) | 7.4 (6.3) | 1318 (407) | 2278 (907) |
| FP2 | 5 | 53.23 (22.66) | 7.97 (4.85) a, b | 61.21 (20.30) | 8.6 (8.5) | 1025 (86) | 1725 (1124) |
| FP3 | 10 | 60.97 (27.85) | 7.01 (3.71) a | 67.99 (29.21) | 11.2 (10.7) | 955 (407) | 2380 (1283) |
| OG | 6 | 44.37 (16.03) | 24.31 (6.95) b | 68.68 (14.46) | 40.4(34.0) | 1154 (140) | 1750 (466) |
| OF | 15 | 60.97 (27.85) 1 | 9.66 (4.51) a, b | 70.63 | 10.7 (1.0) | 1221 (497) | 2658 (1144) |
| CP | 4 | 62.72 (15.85) | NA | 62.72 (15.85) | NA | NA | NA |
| PL | 6 | 53.69 (17.08) | NA | 53.69 (17.08) | NA | NA | NA |
| PA | 5 | 24.33 (7.40) | NA | 24.33 (7.40) | NA | NA | NA |
| FP = mean over entire fallow phase of shifting cultivation; FP1 = fallow phase years 3–6; FP2 = fallow phase years 7–9 ; FP3 = fallow phase years 10–20; OG = old–growth forest; OF = Old fallow forest; CP = cultivation phase of shifting cultivation; PL = permanent pasture; PA = permanent agriculture; AGC = above-ground carbon; DBH = mean diameter at breast height; NA = not available. 1 Without field data on soil carbon in the OF plots, we can assume, conservatively, that the soil carbon in OF will be the same as in FP3. Means sharing the same superscript (a and b) in AGC column show results of Nemenyi test (P < 0.05), which indicate classes statistically not different from each other. | |||||||
3.2.5 Estimating carbon impacts of changing lengths of fallow
Tests of the effect of different lengths of SC fallows on carbon stocks assumed that the farmer is essentially free to select his cycle length (i.e. his choice is not constrained or forced by pressure on the land). To grow 1 Mg of maize requires 0.60 ha in cultivation per year. In a 24-year cycle, this would require a total area of 7.20 ha, of which on average 6.60 ha would always be in various stages of fallow. We assume that yields (Mg ha–1) would remain constant at the different cycle lengths modeled; in reality farmers use some application of fertilizers in the shortened cycles to maintain yields. We have not included the carbon values of this either in permanent agriculture or in shortened cycles since we were unable to find reliable information available about quantities used in these different systems. We made calculations (see Suppl. file 2, Table S3, third page of spreadsheet) over this area also for the 12 and 6-year cycles, assuming that the unused areas would retain their OF vegetation.
3.2.6 Estimating effect of land under pressure
Finally we created a scenario (Suppl. file 2, Table S3, fourth page of spreadsheet) in which the shortened cycle length (6 years) is due to (hypothetical) increased demand for land to be brought into production (i.e. population growth is forcing more farmers onto the same area of land). In this case, there are 4 sets of a 6-year SC system distributed over the same 7.20 ha, and no land is left under OF.
3.3 Results
3.3.1 Soil carbon stocks
Overall, soil carbon makes a much larger contribution to total carbon (50.44 ± 3.10 Mg ha–1) than does AGC (11.31 ± 1.53 Mg ha–1) in all the land cover types examined (Table 1). The highest average soil carbon levels were found in the CP and in FP3 (fallow in years 10–20 of the cycle); the lowest were in the sites under permanent agriculture. Within the shifting cultivation system, soil carbon accounts for around 85–87% of total carbon in fallow stages. The high soil carbon levels in the CP appear to fall by about one-third in the first fallow period and then increase gradually, but there is a very high variation between sites (Fig. 3a). In old-growth (OG) sites, soil carbon forms 64% of the total carbon stock.
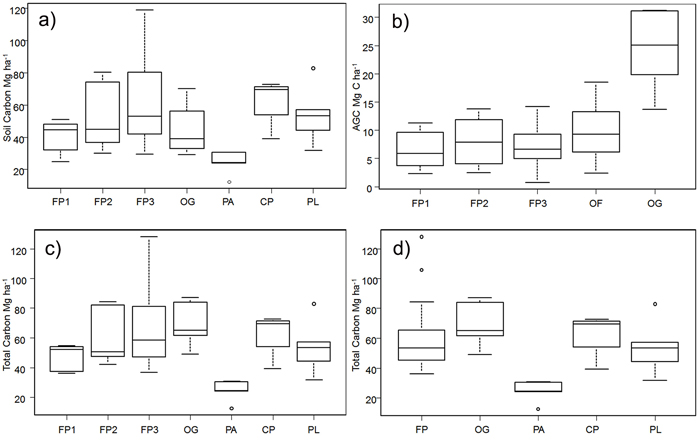
Fig. 3. Carbon stocks in the study area for shifting cultivation plots and different forest categories: a) Above-ground C split by the fallow age classes, b) Soil carbon split by the fallow age class, c) Total carbon split the fallow age class and d) Total carbon in the three separate fallow phases; FP1 = fallow phase of shifting cultivation years 3–6; FP2 = fallow phase of shifting cultivation years 7–9; FP3 = fallow phase of shifting cultivation years 10–20; FP = all fallow phases of shifting cultivation; OF = old–fallow forest (> 20 years); CP = cultivation phase of shifting cultivation; OG = old growth forest; PA = permanent agriculture; PL = permanent pasture; AGC = Above-ground C. For each plot, the horizontal lines forming the top and bottom of each box respectively indicate the 25th and 75th percentiles (interquartile range) of the dataset and the horizontal middle one indicates the median. The whiskers of each plot extend to ±1.5 interquartile range, to show variability outside the 25th and 75th quantiles and statistical outliers are represented by a dot. View larger in new window/tab
The differences in log values of soil carbon in the different land uses were statistically significant (F = 2.82, df = 6, p < 0.05). FP2, FP3, CP and PL all had significantly greater soil carbon density than PA (Tukey HSD test, p < 0.05). On average, there was about 10% more carbon in soils under the shifting cultivation regime than in OG forests.
3.3.2 Above-ground carbon stocks
Above-ground C is the highest in OG forest, and as would be expected is much lower in land under fallow, again with a high degree of variation between sites (Fig. 3b).
Fallow phase 3 was distinctive in having small trees with DBH ≥ 2.5 cm, but at the same time it harbors the highest number of stems and has the highest average DBH of the three fallow phases. Old fallow shows the highest number of stems per hectare, but has fewer individual trees than FP3, owing to the coppicing characteristics of the species involved (Table 1).
There were statistically significant differences in overall AGC (Kruskal-Wallis chi-squared = 17, df = 4, p < 0.05). Old-growth forest has a significantly higher AGC carbon density than FP1 and FP3 (Nemenyi test, p < 0.05). In general, the stocks of above-ground carbon in areas within the shifting cultivation system (12-year cycle) are about 30% of those in OG and about 40% of those in the extended SC system (OF), which is in line with the findings of Houghton (2005).
3.3.3 Total carbon stocks
In aggregate, PA shows the lowest total carbon density (Table 1), and includes the site with the lowest carbon in the whole sample (12.38 Mg ha–1). The site with the highest carbon level (128.04 Mg ha–1) was in the FP3 set.
The log of total carbon stock differed significantly with land use (F = 7.3, df = 6, p < 0.05); in particular, the stocks in the second and third age classes of fallow phases (FP2 and FP3), CP and PL were higher than those in PA (Tukey HSD test, p < 0.05) (Fig. 3c). There were differences (F = 9.26, df = 4, p < 0.05) in the log of total carbon density as well when the three fallow age classes were grouped into one class (Fig 3d). Permanent agriculture had significantly lower C stocks than the other land use classes (FP1, FP2 and FP3, taken individually, FP as a whole, CP, OG, OF and PL) (Tukey HSD test, p < 0.05) (Fig. 3d).
Average carbon stocks in areas under shifting cultivation regimes (including the fallow areas) are only about 14% lower than those of OG, and 16% lower than those in the OF.
3.3.4 Carbon stocks and fluxes under different maize production scenarios.
The total area (cultivation plot plus fallow plots) required to produce 1 Mg maize in a 12-year SC system is 3.60 ha. The total carbon stocks over this area would be 210 Mg, taking into account the varying amounts of carbon in the different fallow stages (Table 2). The carbon stocks associated with production of 1 Mg maize through PA in this same area would be 242 Mg, taking into account that most of the area would remain under OF forest (the “land sparing” scenario). Our results thus indicate that in the process of producing 1 Mg maize annually, the total carbon stocks in the permanent agriculture system are higher than those in shifting cultivation (Table 2).
| Table 2. Carbon impacts of shifting cultivation versus permanent agriculture for production of 1 Mg yr–1 of maize. See Suppl. file 2, Table S2 for calculation details. | ||
| PA | SC | |
| Maize yield (Mg ha–1) | 3.76 | 1.68 |
| Cropping area needed to produce 1 Mg maize (ha) | 0.27 | 0.60 |
| Area required for fallow (ha) | - | 3.00 |
| Total area required for agricultural system (ha) | 0.27 | 3.6 |
| Land spared for OF (ha) | 3.33 | - |
| Carbon stock in cultivated area (Mg) | 6.47 | 37.63 |
| Carbon stock in fallow areas (Mg) | - | 172.82 |
| Carbon stock in OF area (Mg) | 235.20 | - |
| Total carbon stock (Mg) | 241.67 | 210.46 |
| Total carbon stock in baseline (absence of any farming) (Mg) | 254.27 | 254.27 |
| Loss of carbon stock (Mg) | 12.60 | 43.81 |
| Annual carbon loss, over nominal production period of 20 years for production on 1Mg maize per year (Mg) | 0.63 | 2.19 |
| OF = old fallow plot; PA = permanent agriculture; SC = shifting cultivation. | ||
The stock in an equivalent area of OF would be 254 Mg, thus the loss in stock if this land were converted from OF to SC and PA would be 43 Mg C and 12 Mg C respectively. To calculate an emission rate (annualized losses), an arbitrary (and conservative) time horizon of 20 years was used. This results in yearly emissions of 2.19 Mg C for 1 Mg maize per year for SC and 0.63 Mg C for 1 Mg maize per year for PA (Table 2).
For the case of different fallow lengths under absence of land pressure, we consider a unit of land of 7.20 ha, which is what is needed for the operation of a 24-year SC to produce 1 Mg maize. The scenario with the longest cycle (24 years) has the lowest total carbon stocks (458 Mg C), because apart from the small patch that is under cultivation in any one year, the rest of the area is all under fallow. The shortest cycles show the highest carbon stocks (476 Mg C); since only a small part of the remaining area is under fallow, while most of the land remains as OF forest (Table 3). Against the baseline of OF forest, losses would be 50.15, 43.82 and 32.96 Mg C respectively for the 24-year, the 12-year and the 6-year cycle and the associated emissions would be 2.51, 2.19 and 1.65 Mg C per Mg maize per year respectively, annualized over an arbitrary period of 20 years.
| Table 3. Carbon impacts of changing lengths of fallow. Average carbon stocks for shifting cultivation plots over three different fallow lengths (6-year, 12-year and 24-year cycles). See Suppl. file 2, Table S3 for calculation details. | |||
| SC 6-year cycle | SC 12-year cycle | SC 24-year cycle | |
| Maize yield (Mg ha–1) | 1 | 1 | 1 |
| Rotation 1 | 3 | 6 | 12 |
| Cultivation area needed per year for production of 1 Mg maize (ha) | 0.60 | 0.60 | 0.60 |
| Area under fallow (ha) | 1.20 | 3.00 | 6.60 |
| Area remaining under OF (ha) | 5.40 | 6.60 | 0.00 |
| Total area including fallow plots (ha) | 1.80 | 3.60 | 7.20 |
| Carbon stock in cultivation area (Mg) | 37.63 | 37.63 | 37.63 |
| Carbon stock in fallowed area (Mg) | 56.54 | 172.82 | 420.76 |
| Carbon stock in OF area (Mg) | 381.40 | 254.27 | 0.00 |
| Total carbon stock (Mg) | 475.58 | 464.72 | 458.39 |
| Carbon stock in baseline (absence of any farming) (Mg) | 508.54 | 508.54 | 508.54 |
| Loss in carbon stock (Mg) | 32.96 | 43.82 | 50.15 |
| Annual carbon loss, over nominal production period of 20 years for production on 1 Mg maize per year (Mg) | 1.65 | 2.19 | 2.51 |
| OF = old fallow; SC = shifting cultivation system. 1 Plot is cultivated for 2 years, so in a 24-year cycle there are 12 cohorts. | |||
The final scenario considers what would happen if cultivation cycle were to be shortened in response to a need to produce more food from the same area, i.e. as a result of increased population pressure, but still using the same basic technology (i.e. without use of fertilizers, etc). We assume that instead of 1 Mg maize, 4 are required from the same area, such that four shifting cultivators, each operating a 6-year SC cycle, are working at the same time in the 7.20 ha area described in the example above. This would result in long-run carbon stocks of 377 Mg, for the production of 4 Mg maize (Table 4). Annual emissions would be 1.65 Mg C per 1 Mg maize per year. The emission factor is the equivalent to that of the 6 year cycle without land pressure, despite the fact that later stages of fallow are excluded. This results from the fact that there is much more land in the relatively carbon-rich cultivation phase in the land pressure scenario, which compensates for the carbon in OF.
| Table 4. Effect of land under pressure on carbon stocks and emissions when maize production rate increased by a factor of 4 over the shifting cultivation area. See Suppl. file 2, Table S4 for calculation details. | |
| SC 6 years with four farmers | |
| Cropping area per year needed to produce 1 Mg of maize (ha) | 0.60 |
| Total production area needed (ha) | 7.20 |
| Area under cultivation (ha) | 2.40 |
| Area fallowed (ha) | 4.80 |
| Carbon stocks in cultivation area (Mg) | 150.53 |
| Carbon stocks in fallowed area (Mg) | 226.18 |
| Total carbon stocks (Mg) | 376.70 |
| Carbon stock in baseline (absence of any farming) (Mg) | 508.54 |
| Carbon loss due to cultivation | 131.83 |
| Carbon loss per Mg maize produced (Mg) | 32.96 |
| Emissions per Mg maize year–1, annualised over nominal 20 years (Mg) | 1.65 |
| SC = shifting cultivation system. | |
4 Discussion
This study contributes to understanding on carbon emissions from shifting cultivation and the carbon sequestered in dryland systems under both intensification and de-intensification of this agricultural system. Based on our results and consistent with previous studies (Hett et al. 2012; Mertz 2009; Rambo 1990; Ickowitz 2006), we argue that shifting cultivation does not result in deforestation (forest cover loss), but in temporary removal of trees, modifying the vegetative cover to a mosaic landscape of secondary growth forests (Fox et al. 2000). The quantitative estimations of carbon emissions obtained in this study provide tangible evidence that shifting cultivation should be considered as forest degradation, not deforestation. Although the role of this agricultural system on emissions has been widely discussed in the literature in the context of deforestation (Houghton et al. 2003; Houghton and Goodale 2004; Nigh and Diemont 2013), the forest succession characteristics which shifting cultivation involve have not been fully taken into account in estimating emissions and our study provides some information to fill this gap.
Dry tropical forest in Mexico shows wide variations in forest biomass (Delaney et al. 1997; Jaramillo et al. 2003; Vargas et al. 2008; Kauffman et al. 2009; Jaramillo et al. 2011). Above-ground biomass for the study area is at the lower end of the scale, as a result of the fact that the area has been impacted by human uses like agriculture and cattle ranching at least since Mexico’s colonial era and heavily used for shifting cultivation over the last fifty years. Our results agree with other reports that above-ground carbon stocks increase rapidly in the years following cultivation, the early forest successional stages (Read and Lawrence 2003; Chazdon et al. 2007; Lebrija-Trejos et al. 2010; Williams-Linera et al. 2011; Pelletier et al. 2012). Where the fallow phase is long, the carbon stocks would reach levels similar to those of old growth forests after 20 years, although more of this carbon is in the soil and less in the above-ground pools. This trend shows the high potential of this dryland farming system for sequestering carbon. In addition, the time needed for carbon level to recover to the levels found in these forests is in reality highly variable (Lawrence and Foster 2002; Lebrija-Trejos et al. 2008).
The finding that soil carbon forms such a large proportion of the total carbon in the TDF ecosystem is not new (Delaney et al. 1997; Jaramillo et al. 2003, 2011; Vargas et al. 2008; Kauffman et al. 2009; Scharlemann et al. 2014). Soil carbon is the largest carbon pool in the terrestrial biosphere (Jobbágy and Jackson 2000), and for tropical dry forest the amount of carbon contained in soils varies greatly (Post et al. 1982; Jaramillo et al. 2003; Marín-Spiotta and Sharma 2013; Campo et al. 2016). Values approaching those we found in our case studies are reported for TDF in Mexico by the Instituto Nacional de Investigaciones en Cambio Climático (INECC 2010). However, most of this carbon is in the upper layers of the soil; TDF soils are in general shallow (Trejo and Dirzo 2000), and their exposure, for example through the creation of fields for permanent cultivation, can result in rapid loss of much of this carbon, as our data show.
Our study reveals, however, that the presence of so much soil carbon mitigates or helps to balance the losses of carbon in above-ground vegetation when the clearance is only temporary as in shifting cultivation. The burning produces charcoal and ash that increase soil carbon, as in the very high levels we observed in the cultivation phase of shifting cultivation. These values then drop in the first fallow period but increase rapidly in the second fallow phase; faster, indeed, than the recovery of the above-ground carbon stocks. In the case of permanent agriculture on the other hand, soil carbon levels are rapidly depleted and do not recover. In all, the case study provides evidence to support findings in other studies that the rate of recapture of carbon stocks in the fallow periods following cultivation is high (Pelletier et al. 2012; Nigh and Diemont 2013). Moreover, we show that the secondary forest which develops on the fallows if they are left for over 20 years bears more total carbon stock than old growth forest which has never been in the SC cycle.
This has important implications as regards climate policy in areas of the kind we were studying, which are dominated by small scale and subsistence production. Shortened cycles are frequently blamed for increased levels of deforestation and degradation and for increased carbon emissions (Houghton 2012; Nigh and Diemont 2013; Geist and Lambin 2001, 2002; see also the analysis of drivers in many of the REDD+ Readiness documents, Salvini et al. 2014). However, our study indicates that shortened cycles do not result in increased emissions, but rather in decreased emissions, even when the reason for the shortened cycle is increased pressure on the land, i.e. when a larger proportion of the land is brought into production. In reality, cycles in the study area have been shortening in the past decade for various reasons other than land pressure, including government subsidy programmes and may also in part be a labour saving strategy. However, as with our analysis of permanent agriculture, we did not take account of the emissions that would result from the (limited) use of fertilizers in the most shortened cycles. We were not able to make a quantitative longitudinal analysis of the impacts of repeated cycles of SC, which have been observed to result in lowered soil carbon levels in some parts of Mexico, such as the Yucatán (Eaton and Lawrence 2009) but note that many of the plots we studied had been in a SC cycle for generations, without noticeably reduced soil carbon levels. We have not made a detailed analysis of the impact on biodiversity, which might also be affected.
Our results therefore have relevance to the debate on land sparing. Agricultural intensification is the most common intervention proposed in the readiness documents of 43 REDD+ countries to tackle agriculture-driven deforestation and forest degradation (Salvini et al. 2014), and is regularly advocated as a means of reducing deforestation in general (Carter et al. 2015). It is also being advocated in Mexico in the context of climate change mitigation and REDD+ (ECOSUR 2012; Quintana Roo 2016; Chiapas 2016; JIRA 2015). The idea of “land sparing” through agricultural intensification (the Borlaug hypothesis) is, however, controversial. At the local level, intensification could have the perverse effect of increasing deforestation if it results in improved profitability, as this could raise the demand for land, illustrating the Jevons paradox (Angelsen and Kaimowitz 2001; Rudel et al. 2009; Perfecto and Vandermeer 2010; Gockowski and Sonwa 2011; Pirard and Belna 2012; Byerlee et al. 2014). However the Borlaug hypothesis is widely supported (e.g. Grau and Aide 2008) and there is evidence that at the global level technology-driven (rather than market driven) intensification may be correlated with lower deforestation rates (Andersen et al. 2002; Byerlee et al. 2014). We believe that the intensification we observed in the case study area, which has led to lower emissions rates, is neither the result of population pressure nor market driven but mainly the unintended result of a government subsidy programme, PROCAMPO, as well as the availability of subsidies for fertilizers and changes in farmers´ time budgets.
Our study also adds to the discussion around the Borlaug hypothesis in that the modeling of outcomes demonstrates lower emissions from agricultural systems based on intensive crop production (permanent agriculture) than from shifting cultivation, for a given level of production of food. We must underline however that this does not take into account the much higher energy inputs that intensive crop production requires in the form of fertilizers and pesticides and the long time scales they require for recovery of soil physical status. An analysis of this would be needed to make a fair comparison, but was beyond the scope of this study.
The alternative strategy sometimes proposed in the context of improved environmental management (Dalle and de Blois 2006; Eaton and Lawrence 2009) is to lengthen shifting cultivation cycles (de-intensification of agriculture). We have shown that at least in our case study area this will increase, rather than reduce emissions.
Despite the fact that our results show lower emissions under permanent agriculture, and lower emissions under shortened SC systems than under traditional cycle lengths, we urge caution in the promotion of policies to curtail shifting cultivation and to move towards more intensified “spatially segregated” landscapes in which there is permanent agriculture and untouched forest (van Noordwijk et al. 2012). In part this is because as noted above we did not include in our calculations the emissions from fuel and fertilizers that would undoubtedly be associated with permanent cropping systems. There are however other reasons. Under land sparing schemes the goals are strictly separated; agricultural production is maximized in some areas, and other areas are set aside for carbon sequestration (Perfecto and Vandermeer 2010). The alternative, land sharing (Perfecto and Vandermeer 2010), which aims at both objectives on the same area of land, may in the long run be a better solution. We have shown that shifting cultivation with shortened cycles may be a good step towards intensification and towards reduced emissions. The values of carbon stocks we found in the cultivation and fallow phases indicate that there may be room to optimize total carbon stocks in shifting cultivation systems, and reduce emission rates, by managing the lengths of the cycle better. Decreases of the amount of land under cultivation in SC could also be achieved by improving local management strategies (for a case in the Yucatan, Mexico, see Pascual (2005)).
5 Conclusion
Our study shows that shifting cultivation results in a lowering of above-ground carbon stocks in the forests affected, which in terms of REDD+ should be considered to constitute degradation. In very few cases does it result in deforestation, since the forest remains forest over the long term. Our indications are that it results in more carbon emissions per tonne of maize than would be produced in permanent agricultural systems, although our calculations do not include the additional emissions that would be associated with the much higher energy inputs used in permanent agriculture, which would reduce the observed difference. However, we show that per tonne of maize produced, shorter SC cycles result in higher overall stocks of carbon and lower emissions. In the study area, recent reductions in the cycle appear to be a response to a variety of policy initiatives and financial incentives rather than to population pressure or market forces.
These findings are very significant for REDD+ policy, since shifting cultivation is often held to be the cause of deforestation and either its replacement by permanent agriculture (“agricultural intensification” or “sedentarization of agriculture”), or lengthening of fallows are often advocated as the means to reduce carbon emissions. If our findings are correct, they suggest that policies on shifting cultivation may need to be nuanced in the context of climate change. Cycles could be optimized to increase carbon stocks while maintaining the traditional benefits of SC systems in a land sharing scenario. At the very least, the reasons for shortened fallows would need to be thoroughly investigated at the local level before a policy either to eliminate shifting cultivation all together, or to extend the cycle length, is promoted.
Acknowledgements
This study was funded by The Netherlands Organisation for Scientific Research (NWO) – Science for Global Development (WOTRO) through project titled “Linking local action to international climate agreements in the tropical dry forests of Mexico”. We also thank Ernesto Vega Peña for his advice on the statistical analysis; Hilda Rivas Solórzano and Rosa Isela Salinas Espinoza for helping in soil sample preparation.
References
Abizaid C., Coomes O.T. (2004). Land use and forest fallowing dynamics in seasonally dry tropical forest of the southern Yucatan Peninsula, Mexico. Land Use Policy 21(1): 71–84. http://dx.doi.org/10.1016/j.landusepol.2003.06.001.
Álvarez-Yépiz J.C., Martínez-Yrízar A., Búrquez A., Lindquist C. (2008). Variation in vegetation structure and soil properties related to land use history of old-growth and secondary tropical dry forests in northwestern Mexico. Forest Ecology and Management 256(3): 355–366. http://dx.doi.org/10.1016/j.foreco.2008.04.049.
Andersen L.E., Granger C.W.J., Reis E.J., Weinhold D., Wunder S. (2002). The dynamics of deforestation and economic growth in the Brazilian Amazon. Cambridge University Press. 259 p.
Angelsen A., Kaimowitz D. (2001). When does technological change in agriculture promote deforestation? Tradeoffs or synergies? In: Lee D.R., Barrett C.B. (eds.). Agricultural intensification, economic development, and the environment. CABI International, Wallingford, Oxon. p. 89–114.
Antunes F.A., Adams C., Murrieta R.S.S. (2013). The impacts of shifting cultivation on tropical forest soil: a review. Boletim do Museu Paraense Emílio Goeldi. Ciências Humanas 8(3): 693–727. http://dx.doi.org/10.1590/S1981-81222013000300013.
Aryal D.R., De Jong B.H., Ochoa-Gaona S., Esparza-Olguin L., Mendoza-Vega J. (2014). Carbon stocks and changes in tropical secondary forests of southern Mexico. Agriculture, Ecosystems and Environment 195: 220–230. http://dx.doi.org/10.1016/j.agee.2014.06.005.
Aweto A.O. (2013a). Shifting cultivation and secondary succession in the Tropics. CABI International, Wallingford, Oxfordshire. 196 p.
Aweto A.O. (2013b). Shifting cultivation: definition, basic features and types. In: Shifting cultivation and secondary succession in the Tropics. CABI International Wallingford, Oxfordshire. 16–29 p.
Borrego A., Skutsch M. (2014). Estimating the opportunity costs of activities that cause degradation in tropical dry forest: implications for REDD+. Ecological Economics 101: 1–9. http://dx.doi.org/10.1016/j.ecolecon.2014.02.005.
Byerlee D., Stevenson J., Villoria N., 2014. Does intensification slow crop land expansion or encourage deforestation? Global Food Security 3: 92–98. http://dx.doi.org/10.1016/j.gfs.2014.04.001.
Campo J., Oliva F.G., Segueda A.N., Siebe C. (2016). Almacenes y dinámica del carbono orgánico en ecosistemas forestales tropicales de México. [Organic carbon stocks and dynamics in tropical forest ecosystems in Mexico]. Revista Terra Latinoamericana 34: 31–38.
Carter S., Herold M., Rufino M., Neumann K., Kooistra L., Verchot L. (2015). Mitigation of agriculture emissions in the tropics: comparing forest land-sparing options at the national level. Biogeosciences 12(7):5435–5475. http://dx.doi.org/10.5194/bg-12-4809-2015.
Chávez B.C. (1983). Coamil, un sistema de producción agrícola tradicional en Jalisco. [Coamil, a system of traditional agricultural production in Jalisco]. Degree thesis. Agricultural school, University of Guadalajara, Guadalajara, Mexico. 61 p.
Chazdon R.L., Letcher S.G., van Breugel M., Martínez-Ramos M., Bongers F., Finegan B. (2007). Rates of change in tree communities of secondary Neotropical forests following major disturbances. Philosophical Transactions of the Royal Society of London, Series B, Biological Sciences 362(1478): 273–89. http://dx.doi.org/10.1098/rstb.2006.1990.
Chiapas (Gobierno del Estado de Chiapas) (2016). Incentiva para reducciones de emisiones, Zoque-Mezcalapa. Anexos. https://www.gob.mx/cms/uploads/attachment/file/83750/IRE_Programa_de_Inversion_Zoque-Mezcalapa_Anexos.pdf. [Cited 2 Oct 2016].
Cuanalo H., Uicab-Covoh R. (2005). Investigación participativa en la milpa sin quema. [Participatory research in the milpa without burning]. Terra Latinoamericana. 23: 587–597.
Dalle S.P., de Blois S. (2006). Shorter fallow cycles affect the availability of non crop plant resources in a shifting cultivation system. Ecology and Society 11:2. http://www.ecology andsociety.org/vol11/iss2/art2/. [Cited 2 October 2016].
de Vries P.G. (1986). Sampling theory for forest inventory: a teach-yourself course. Springer-Verlag, Berlin, Germany. 399 p.
Delaney M., Brown S., Lugo A.E., Torres-Lezama A., Bello Quintero N. (1997). The distribution of organic carbon in major components of forests located in five life zones of Venezuela. Journal of Tropical Ecology 13(5): 697–708. http://dx.doi.org/10.1017/S0266467400010877.
Democratic Republic of Congo (2016). Emissions reductions program document. https://www.forestcarbonpartnership.org/sites/fcp/files/2016/May/ERPD%20DRC%20final%20for%20presentation.pdf. [Cited 2 Oct 2016].
Detwiler R.P., Hall C.A.S. (1988). Tropical forests and the global carbon cycle. Science 239: 42–47. http://dx.doi.org/10.1126/science.239.4835.42.
Dominican Republic (2015). Emissions reductions program idea note. https://www.forestcarbonpartnership.org/sites/fcp/files/2015/September/Dominican%20Republic%20ER-PIN%20Final.pdf. [Cited 2 Oct 2016].
Don A., Schumacher J., Freibauer A. (2011). Impact of tropical land-use change on soil organic carbon stocks: a meta-analysis. Global Change Biology 17(4): 1658–1670. http://dx.doi.org/10.1111/j.1365-2486.2010.02336.x.
Durán E., Meave J.A., Lott E.J., Segura G. (2006). Structure and tree diversity patterns at the landscape level in a Mexican tropical deciduous forest. Boletín de la Sociedad Botánica de México 79: 43–60.
Eaton J.M., Lawrence D. (2009). Loss of carbon sequestration potential after several decades of shifting cultivation in the Southern Yucatán. Forest Ecology and Management 258(6): 949–958. http://dx.doi.org/10.1016/j.foreco.2008.10.019.
ECOSUR (El Colegio de la Frontera Sur) (2012). Estrategia Regional de la Península de Yucatán para la Reducción de Emisiones por Deforestación y Degradación Forestal (REDD+ PY). [Regional Strategy of the Yucatan Peninsula for Reducing Emissions from Deforestation and Forest Degradation (REDD + PY)]. CONAFOR, SEMARNAT, Gobierno del estado de Yucatán, Gobierno del estado de Campeche and Gobierno del estado de Quintana Roo. Yucatán, Mexico. 351 p. http://www.semarnatcam.campeche.gob.mx/wp-content/uploads/2016/03/EPYREDDF.pdf. [Cited 22 March 2016].
FAO (Food and Agriculuture Organization of United Nations) (2011). Assessing forest degradation: towards the development of globally applicable guidelines. In: Forest Resources Assessment Working Paper 177. FAO, Rome, Italy. 91 p.
Fox J., Truong D.M., Rambo A.T., Tuyen N.P., Cuc L.T., Leisz S. (2000). Shifting cultivation: a new old paradigm for managing tropical forests. Bioscience 50(6): 521–528. http://dx.doi.org/10.1641/0006-3568(2000)050%5B0521:SCANOP%5D2.0.CO;2.
Fukushima M., Kanzaki M., Hara M., Ohkubo T., Preechapanya P., Choocharoen C. (2008). Secondary forest succession after the cessation of swidden cultivation in the montane forest area in Northern Thailand. Forest Ecology and Management 255(5–6): 1994–2006. http://dx.doi.org/10.1016/j.foreco.2007.12.022.
Geertz C. (1963). Agricultural involution: the process of ecological change in Indonesia. University of California Press, Berkeley and Los Angeles, California. 176 p.
Geist H.J., Lambin E.F. (2001). What drives tropical deforestation? A meta-analysis of proximate and underlying causes of deforestation based on subnational case study evidence. LUCC international project office, University of Louvain, Louvain-la-Neuve, Belgium. 116 p.
Geist H.J., Lambin E.F. (2002). Proximate causes and underlying driving forces of tropical deforestation. BioScience 52(2): 143–150. http://dx.doi.org/10.1641/0006-3568(2002)052%5B0143:PCAUDF%5D2.0.CO;2.
Gerritsen P.R.W. (2002). Diversity at Stake: a farmers’ perspective on biodiversity and conservation in Western Mexico. PhD thesis. Wageningen University, the Netherlands. 286 p.
Ghana (2015). National REDD+ strategy. https://www.forestcarbonpartnership.org/sites/fcp/files/2016/Sep/Ghana%27s%20National%20REDD%2B%20Strategy%20Dec%202015.pdf. [Cited 2 October 2016].
Gibbs H.K., Brown S., Niles J.O., Foley J.A. (2007). Monitoring and estimating tropical forest carbon stocks: making REDD a reality. Environmental Research Letters 045023. 13 p. http://dx.doi.org/10.1088/1748-9326/2/4/045023.
Gockowski J., Sonwa D. (2011). Cocoa intensification scenarios and their predicted impact on CO2 emissions, biodiversity conservation, and rural livelihoods in the Guinea rain forest of West Africa. Environmental Management 48(2): 307–321. http://dx.doi.org/10.1007/s00267-010-9602-3.
Grau H.R., Aide M. (2008). Globalization and land-use transitions in Latin America. Ecology and Society 13(2): 16. 12 p.
Grigg D.B. (1974). The agricultural systems of the world: an evolutionary approach. Cambridge University Press, New York, NY. 358 p.
Hernández-Xolocotzi E. (1988). La agricultura tradicional en México. [Traditional agriculture in Mexico]. Comercio Exterior 3S(8): 673–678.
Hernández-Xolocotzi E., Levy S., Bello E. (1995). Agricultura. [Agriculture]. In: Hernández-Xolocotzi E., Bello E, Levy S. (eds.). La milpa en Yucatán, Tomo 1. Un sistema de producción agrícola tradicional. [The milpa in Yucatan, Vol. 1, a tradicional agricultural system]. Colegio de Postgraduados. Montecillo, Mexico. p. 15–34.
Hett C., Castella J.C., Heinimann A., Messerli P., Pfund J.L. (2012). A landscape mosaics approach for characterizing swidden systems from a REDD plus perspective. Applied Geography 32: 608–618. http://dx.doi.org/10.1016/j.apgeog.2011.07.011.
Houghton R.A. (2005). Tropical deforestation as a source of greenhouse gas emissions. In: Moutinho P., Schwartzman S. (eds.). Tropical deforestation and climate change. Amazon Institute for Environmental Research, Belém, Brazil, and Environmental Defense, Washington D.C. p. 13–21.
Houghton R.A. (2012). Carbon emissions and the drivers of deforestation and forest degradation in the tropics. Current Opinion in Environmental Sustainability 4(6): 597–603. http://dx.doi.org/10.1016/j.cosust.2012.06.006.
Houghton R.A., Goodale C.L. (2004). Effects of land-use change on the carbon balance of terrestrial ecosystems. In: DeFries R.S., Asner G.P., Houghton R.A. (eds.). Ecosystems and land use change. American geophysical union, Washington, D.C. p. 85–98.
Houghton R.A., Woods T., Box P.O., Hole W. (2003). Revised estimates of the annual net flux of carbon to the atmosphere from changes in land use and land management 1850–2000. Tellus 55B: 378–390. http://dx.doi.org/10.1034/j.1600-0889.2003.01450.x.
Hughes R.F., Kauffman J.B., Jaramillo V.J. (1999). Biomass, carbon, and nutrient dynamics of secondary forests in a humid tropical region of Mexico. Ecology 80: 1892–1907. http://dx.doi.org/10.2307/176667.
Ickowitz A. (2006). Shifting cultivation and deforestation in tropical Africa: critical reflections. Development and Change 37: 599–626. http://dx.doi.org/10.1111/j.0012-155X.2006.00492.x.
INECC (2010). Índice de presión económica (riesgo) de la deforestación (INE–IRDEF–2.0.1). [Index for economic presión to deforestation (INE–IRDEF–2.0.1)]. http://www.inecc.gob.mx/irdef. [Cited 22 March 2016].
INEGI (Instituto Nacional de Estadística, Geografía e Informática) (2010). Conjunto Nacional de Uso del Suelo y Vegetación a escala 1:250 000. Serie IV. [Land use and vegetation national set scale 1:250 000]. DGG-INEGI, México.
Jaramillo V.J., Kauffman J.B., Rentería-Rodríguez L., Cummings D.L. Ellingson L.J. (2003). Biomass, carbon, and nitrogen pools in Mexican tropical dry forest landscapes. Ecosystems 6(7): 609–629. http://dx.doi.org/10.1007/s10021-002-0195-4.
Jaramillo V.J., Martínez-Yrízar A., Sanford Jr. R.L. (2011). Primary productivity and biogeochemistry of seasonally dry tropical forests. In: Dirzo R., Young H.S., Mooney H.A., Ceballos G. (eds.). Seasonally dry tropical forests: ecology and conservation. Island Press, Washington, DC. p. 109–128.
Jardel E., Skutsch M., Martínez R., Morfin J., Allende T., Vega E., Morales-Barquero L., Ghilardi A. (2012). Análisis de cambio de cobertura y uso del suelo, escenario de referencia de carbono y diseño preliminar del mecanismo de Monitoreo, Reporte y Verificación en los diez municipios de la Junta Intermunicipal del Río Ayuquila, Jalisco. [Cover change and land use analysis, baseline for carbon and preliminary design of the Monitoring, Reporting and Verification in the municipalities of Intermunicipal Board of Rio Ayuquila, Jalisco]. Informe final. Centro de Investigaciones en Geografía Ambiental (CIGA), Universidad Nacional Autónoma de México (UNAM). 63 p. + 4 annex. [In Spanish]. http://redd.ciga.unam.mx/files/InformeFinal_JIRA_May10_12.pdf. [Cited 2 Oct 2016].
JIRA (Junta Intermunicipal del Rio Ayuquila) (2015). Programa de Inversión, Incentiva de Reducciones de Emisiones. [Investment Program, Emission Reduction Incentive]. [In Spanish]. https://www.gob.mx/cms/uploads/attachment/file/83604/Programa_de_Inversion_JIRA.pdf. [Cited 2 October 2016].
Jobbágy E.G., Jackson R.B. (2000). The vertical distribution of soil organic carbon and its relation to climate and vegetation. Ecological Applications 10: 423–436. http://dx.doi.org/10.1890/1051-0761(2000)010%5B0423:TVDOSO%5D2.0.CO;2.
Kass D., Foletti C., Szott L., Landaverde R., Nolasco R. (1993). Traditional fallow systems of the Americas. Agroforestry Systems 23: 207–218. http://dx.doi.org/10.1007/BF00704916.
Kauffman J.B., Hughes R.F., Heider C. (2009). Carbon pool and biomass dynamics associated with deforestation, land use, and agricultural abandonment in the neotropics. Ecological Applications 19(5): 1211–1222. http://dx.doi.org/10.1890/08-1696.1.
Kleinman P.J.A., Pimentel D., Bryant R.B. (1995). The ecological sustainability of slash-and-burn agriculture. Agriculture, Ecosystems & Environment 52(2–3): 235–249. http://dx.doi.org/10.1016/0167-8809(94)00531-I.
Kuchelmeister G. (1993). Trees, settlements and people in developing countries. Arboricultural Journal: The International Journal of Urban Forestry 17(4): 399–411. http://dx.doi.org/10.1080/03071375.1993.9746991.
Lai R. (2004). Soil carbon sequestration in natural and managed tropical forest ecosystems. Journal of Sustainable Forestry 21(1): 1–30. http://dx.doi.org/10.1300/J091v21n01_01.
Lambert D.P. (1996). Crop diversity and fallow management in a tropical deciduous forest shifting cultivation system. Human Ecology 24: 427–453. http://dx.doi.org/10.1007/BF02168861.
Lawrence D., Foster D. (2002). Changes in forest biomass, litter dynamics and soils following shifting cultivation in southern Mexico: an overview. Interciencia 27: 400–408.
Lawrence D., Radel C., Tully K., Schmook B., Schneider L. (2010). Untangling a decline in tropical forest resilience: constraints on the sustainability of shifting cultivation across the globe. Biotropica 42: 21–30. http://dx.doi.org/10.1111/j.1744-7429.2009.00599.x.
Lebrija-Trejos E., Bongers F., Pérez-García E.A., Meave J.A. (2008). Successional change and resilience of a very dry tropical deciduous forest following shifting agriculture. Biotropica 40(4): 422–431. http://dx.doi.org/10.1111/j.1744-7429.2008.00398.x.
Lebrija-Trejos E., Meave J.A., Poorter L., Pérez-García E.A., Bongers F. (2010). Pathways, mechanisms and predictability of vegetation change during tropical dry forest succession. Perspectives in Plant Ecology, Evolution and Systematics 12(4): 267–275. http://dx.doi.org/10.1016/j.ppees.2010.09.002.
Lobell D.B., Baldos U.L., Hertel T.W. (2013). Climate adaptation as mitigation: the case of agricultural investments. Environmental Research Letters 8(1): 015012. 12 p. http://dx.doi.org/10.1088/1748-9326/8/1/015012.
MacFarland T.M., Yates J.M. (2016). Introduction to nonparametric statistics for the biological sciences using R. Springer, Switzerland. 329 p.
Marín-Spiotta E. S. Sharma. (2013). Carbon storage in successional and plantation forest soils: a tropical analysis. Global Ecology and Biogeography 22:105–117. http://dx.doi.org/10.1111/j.1466-8238.2012.00788.x.
Martínez-Yrízar A., Sarukhan J., Perez-Jimenez A., Rincon E., Maass J.M., Solis-Magallanes A., Cervantes L. (1992). Above-ground phytomass of a tropical deciduous forest on the coast of Jalisco, Mexico. Journal of Tropical Ecology 8(1): 87–96. http://dx.doi.org/10.1017/S0266467400006131.
Mertz O. (2009). Trends in shifting cultivation and the REDD mechanism. Current Opinion in Environmental Sustainability 1(2): 156–160. http://dx.doi.org/10.1016/j.cosust.2009.10.002.
Miranda F., Hernández-Xolocotzi E. (1963). Los tipos de vegetación de México y su clasificación. [Vegetation types and classification of Mexico]. Boletín de la Sociedad Botánica de México 28: 29–179.
Morales-Barquero L., Skutsch M., Jardel-Peláez E.J., Ghilardi A., Kleinn C., Healey J.R. (2014). Operationalizing the definition of forest degradation for REDD+, with application to Mexico. Forests 5(7): 1653–1681. http://dx.doi.org/10.3390/f5071653.
Morales-Barquero L., Borrego A., Skutsch M., Kleinn C., Healey J.R. (2015). Identification and quantification of drivers of forest degradation in tropical dry forests: a case study in Western Mexico. Land Use Policy 49: 296–309. http://dx.doi.org/10.1016/j.landusepol.2015.07.006.
Moreno-Calles A., García-Luna V., Casas A., Toledo V.M., Vallejo M., Santos-Fita D., Camou-Guerrero A. (2014). La Etnoagroforestería: el estudio de los sistemas agroforestales tradicionales de México. [Agroforestry ethnicity: the study of traditional agroforestry systems of Mexico]. Etnobiología 12: 1–16.
Nigh R., Diemont S.A. (2013). The Maya milpa: fire and the legacy of living soil. Frontiers in Ecology and the Environment 11: e45–e54. http://dx.doi.org/10.1890/120344.
Pelletier J., Codjia C., Potvin C. (2012). Traditional shifting agriculture: tracking forest carbon stock and biodiversity through time in western Panama. Global Change Biology 18(12): 3581–3595. http://dx.doi.org/10.1111/j.1365-2486.2012.02788.x.
Penman J., Gytarsky M., Hiraishi T., Krug T., Kruger D., Pipatti R., Buendia L., Miwa K., Ngara T., Tanabe K., Wagner F. (eds.) (2003). Good practice guidance for land use, land-use change and forestry. The Intergovernmental Panel on Climate Change (IPCC). Institute for Global Environmental Strategies (IGES), Hayama, Kanagawa.
Perfecto I., Vandermeer J. (2010). The agroecological matrix as alternative to the land-sparing/agriculture intensification model. Proceedings of the National Academy of Sciences of the United States of America 107(13): 5786–5791. http://dx.doi.org/10.1073/pnas.0905455107.
Pirard R., Belna K. (2012). Agriculture and deforestation: is REDD+ rooted in evidence? Forest Policy and Economics 21: 62–70. http://dx.doi.org/10.1016/j.forpol.2012.01.012.
Pohlert T. (2014). The Pairwise Multiple Comparison of Mean Ranks Package (PMCMR). R package. http://CRAN.R-project.org/package=PMCMR. [Cited 2 Oct 2016].
Post W.M., Emanuel W.R., Zinke P.J., Stangenberger A.G. (1982). Soil carbon pools and world life zones. Nature 298: 156–159. http://dx.doi.org/10.1038/298156a0.
Quintana Roo (2016). Incentiva de reducciones de emisiones: programa de inversión. Gobierno de Estado de Quintana Roo, CONAFOR, y CONABIO. https://www.gob.mx/cms/uploads/attachment/file/118208/Quintana_Roo.pdf. [Cited 2 Oct 2016].
R Core Team (2013). R: a language and environment for statistical computing. R Foundation for Statistical Computing, Vienna, Austria.
Raintree J.B., Warner K. (1986). Agroforestry pathways for the intensification of shifting cultivation. Agroforestry Systems 4(1): 39–54. http://dx.doi.org/10.1007/BF01834701.
Rambo A.T. (1990). Slash-and-burn farmers: villains or victims? Earthwatch 39: 10–12.
Read L., Lawrence D. (2003). Recovery of biomass following shifting cultivation in dry tropical forests of the Yucatan. Ecological Applications 13(1): 85–97. http://dx.doi.org/10.1890/1051-0761(2003)013%5B0085:ROBFSC%5D2.0.CO;2.
Romero-Duque L.P., Jaramillo V.J., Perez-Jimenez A. (2007). Structure and diversity of secondary tropical dry forests in Mexico, differing in their prior land-use history. Forest Ecology and Management 253(1–3): 38–47. http://dx.doi.org/10.1016/j.foreco.2007.07.002.
Rudel T.K., Schneider B., Uriartec M., Turner B.L., DeFries R., Lawrence D., Geoghegan J., Hecht S., Ickowitz A., Lambin E.F., Birkenholtz T., Baptista S., Grau R. (2009). Agricultural intensification and changes in cultivated areas, 1970–2005. Proceedings of the National Academy of Sciences of the United States of America 106(49): 20675–20680. http://dx.doi.org/10.1073/pnas.0812540106.
Ryu S., Tenney G. (2005). Protocol – OHHW CHNS/O analyser 2400 series II. Perkin Elmer Company. http://lees.geo.msu.edu/resources/files/CHN_protocol.pdf. [Cited 14 Oct 2016].
Rzedowski J. (1978). Vegetación de México. [Vegetation of Mexico]. Editorial limusa, first edition, Mexico D.F., Mexico. 400 p.
Sadoulet E., de Janvry A., Davis B. (2001). Cash transfer programs with income multipliers; the case of PROCAMPO in Mexico. World Development 29(6): 1043–1056. http://dx.doi.org/10.1016/S0305-750X(01)00018-3.
Salvini G., Herold M., De Sy V., Kissinger G., Brockhaus M., Skutsch M. (2014). How countries link REDD+ interventions to drivers in their readiness plans: implications for monitoring systems. Environmental Research Letters 9(7): 074004. 12 p. http://dx.doi.org/10.1088/1748-9326/9/7/074004.
Scharlemann J.P., Tanner E.V., Hiederer R., Kapos V. (2014). Global soil carbon: understanding and managing the largest terrestrial carbon pool. Carbon Management 5(1): 81–91. http://dx.doi.org/10.4155/cmt.13.77.
Schmook B. (2010). Shifting maize cultivation and secondary vegetation in the Southern Yucatán: successional forest impacts of temporal intensification. Regional Environmental Change 10(3): 233–246. http://dx.doi.org/10.1007/s10113-010-0128-2.
Seidenberg C., Mertz O., Kias M.B. (2003). Fallow, labour and livelihood in shifting cultivation: implications for deforestation in northern Lao PDR. Geografisk Tidsskrift, Danish Journal of Geography 103(2): 71–80. http://dx.doi.org/10.1080/00167223.2003.10649493.
Spencer J. (1966). Shifting cultivation in Southeast Asia. University of California Publications in Geography. University of California Press, Berkley, California. 247 p.
Trejo I., Dirzo R. (2000). Deforestation of seasonally dry tropical forest a national and local analysis in Mexico. Biological Conservation 94(2): 133–142. http://dx.doi.org/10.1016/S0006-3207(99)00188-3.
UNFCCC (2001). Decision 11/CP.7. Definitions, modalities, rules and guidelines relating to land use, land-use change and forestry activities under the Kyoto Protocol. http://unfccc.int/resource/docs/cop7/13a01.pdf#page=58. [Cited 14 Oct 2016].
van Noordwijk M., Tata H.L., Xu J., Dewi S., Minang P.A. (2012). Segregate or integrate for multifunctionality and sustained change through rubber-based agroforestry in Indonesia and China. In: Nair P.K.R., Garrity D. (eds.). Agroforestry: the future of global land use. Springer Netherlands. p. 69–104.
Vargas R., Allen M.F., Allen E.B. (2008). Biomass and carbon accumulation in a fire chronosequence of a seasonally dry tropical forest. Global Change Biology 14(1): 109–124. http://dx.doi.org/10.1111/j.1365-2486.2007.01462.x.
West P.C., Gibbs H.K., Monfreda C., Wagner J., Barford C.C., Carpenter S.R., Foley J.A. (2010). Trading carbon for food: global comparison of carbon stocks vs. crop yields on agricultural land. Proceedings of the National Academy of Sciences of the United States of America 107(46): 19645–19648. http://dx.doi.org/10.1073/pnas.1011078107.
Williams-Linera G., Álvarez-Aquino C., Hernández-Ascención E., Toledo M. (2011). Early successional sites and the recovery of vegetation structure and tree species of the tropical dry forest in Veracruz, Mexico. New Forests 42(2): 131–148. http://dx.doi.org/10.1007/s11056-010-9242-8.
Total of 100 references.
