Johanna Jetsonen  ,
Annamari Laurén,
Heli Peltola,
Olli Muhonen,
Juha Nevalainen,
Veli-Pekka Ikonen,
Antti Kilpeläinen,
Eeva-Stiina Tuittila,
Elisa Männistö,
Nicola Kokkonen,
Marjo Palviainen
,
Annamari Laurén,
Heli Peltola,
Olli Muhonen,
Juha Nevalainen,
Veli-Pekka Ikonen,
Antti Kilpeläinen,
Eeva-Stiina Tuittila,
Elisa Männistö,
Nicola Kokkonen,
Marjo Palviainen
Effects of nitrogen fertilization on the ground vegetation cover and soil chemical properties in Scots pine and Norway spruce stands
Jetsonen J., Laurén A., Peltola H., Muhonen O., Nevalainen J., Ikonen V.-P., Kilpeläinen A., Tuittila E.-S., Männistö E., Kokkonen N., Palviainen M. (2024). Effects of nitrogen fertilization on the ground vegetation cover and soil chemical properties in Scots pine and Norway spruce stands. Silva Fennica vol. 58 no. 1 article id 23058. https://doi.org/10.14214/sf.23058
Highlights
- Nitrogen (N) fertilization decreased the total cover of ground vegetation
- N fertilization decreased the cover of mosses and dwarf shrubs and increased the cover of herbaceous plants
- N concentration of the mor humus layer increased with the N fertilization
- The magnitude of these changes depended on the intensity of the N fertilization.
Abstract
The aim of this study was to investigate the short-term effects of nitrogen (N) fertilization intensity on the ground vegetation cover and soil chemical properties in two Scots pine (Pinus sylvestris L.) and two Norway spruce (Picea abies (L.) Karst.) dominated stands on upland forest sites in Eastern Finland. The fertilizer was applied using a helicopter in the spruce stands and a forwarder in the pine stands. The distribution and the amount of fertilizer was measured with funnel traps. Cover of each species of ground vegetation was estimated before fertilization and 3–4 years after it in pine and 2–3 years after it in spruce stands. Further, the cover observations were aggregated by plant types. Based on measurements, we analyzed the effects of the funnel-trap-observed amount of N fertilizer on the cover and plant type composition of ground vegetation and soil N and C concentration. In addition, we analyzed the impacts of competition caused by trees on the ground vegetation cover based on competition indices. N fertilization increased the cover of herbaceous plants and decreased the cover of mosses and dwarf shrubs, and the total cover of ground vegetation. Further, it increased the N concentration of the mor humus layer. The magnitude of the changes increased with the intensity of the N fertilization. The competition caused by trees did not affect the cover of ground vegetation.
Keywords
boreal forest;
competition index;
forest fertilization;
upland forests;
vegetation cover
-
Jetsonen,
Department of Forest Sciences, University of Helsinki, P.O. Box 27, 00014 University of Helsinki, Finland
E-mail
johanna.jetsonen@helsinki.fi
-
Laurén,
Department of Forest Sciences, University of Helsinki, P.O. Box 27, 00014 University of Helsinki, Finland; Faculty of Science and Forestry, University of Eastern Finland, P.O. Box 111, 80101 Joensuu, Finland
 https://orcid.org/0000-0002-6835-9568
E-mail
annamari.lauren@helsinki.fi
https://orcid.org/0000-0002-6835-9568
E-mail
annamari.lauren@helsinki.fi
- Peltola, Faculty of Science and Forestry, University of Eastern Finland, P.O. Box 111, 80101 Joensuu, Finland E-mail heli.peltola@uef.fi
-
Muhonen,
Faculty of Science and Forestry, University of Eastern Finland, P.O. Box 111, 80101 Joensuu, Finland
https://orcid.org/0009-0007-4051-8567
E-mail
olli.muhonen@forestvital.com
-
Nevalainen,
Faculty of Science and Forestry, University of Eastern Finland, P.O. Box 111, 80101 Joensuu, Finland
https://orcid.org/0009-0000-2972-4385
E-mail
juha.hs.nevalainen@gmail.com
-
Ikonen,
Faculty of Science and Forestry, University of Eastern Finland, P.O. Box 111, 80101 Joensuu, Finland
https://orcid.org/0000-0003-1732-2922
E-mail
veli-pekka.ikonen@uef.fi
-
Kilpeläinen,
Faculty of Science and Forestry, University of Eastern Finland, P.O. Box 111, 80101 Joensuu, Finland
https://orcid.org/0000-0003-4299-0578
E-mail
antti.kilpelainen@uef.fi
- Tuittila, Faculty of Science and Forestry, University of Eastern Finland, P.O. Box 111, 80101 Joensuu, Finland E-mail eeva-stiina.tuittila@uef.fi
-
Männistö,
Faculty of Science and Forestry, University of Eastern Finland, P.O. Box 111, 80101 Joensuu, Finland
https://orcid.org/0000-0003-3869-6739
E-mail
elisa.mannisto@uef.fi
-
Kokkonen,
Faculty of Science and Forestry, University of Eastern Finland, P.O. Box 111, 80101 Joensuu, Finland
https://orcid.org/0000-0003-0197-2672
E-mail
nicola.kokkonen@uef.fi
- Palviainen, Department of Forest Sciences, University of Helsinki, P.O. Box 27, 00014 University of Helsinki, Finland E-mail marjo.palviainen@helsinki.fi
Received 6 October 2023 Accepted 2 January 2024 Published 1 February 2024
Views 90974
Available at https://doi.org/10.14214/sf.23058 | Download PDF

1 Introduction
Climate change mitigation requires a rapid increase in forest carbon (C) sequestration (Lecocq et al. 2022). Boreal forests can efficiently sequester and store substantial amounts of C as tree biomass, understory vegetation and in soil (Mäkipää 1995; Ilvesniemi et al. 2002). However, in upland boreal forests the stand growth is strongly limited by nitrogen (N) availability (Tamm 1991). Thus, N fertilization could increase the C sequestration of forests (Johnson 1992; Mäkipää 1995; Jörgensen et al. 2021) and wood production (Gustavsen and Lipas 1975; Kellomäki et al. 1982; Sikström et al. 1998; Pettersson and Högbom 2004; Pukkala 2017). N fertilization also increases soil C stocks due to increasing litter production and decreasing decomposition rate (Carreiro et al. 2000; Marshall et al. 2021). However, fertilization may also cause many adverse environmental effects, e.g., changes in species biodiversity (Strengbom and Nordin 2008), as well as increase in nutrient export to water courses (Binkley et al. 1998; Bergh et al. 2008) and soil N2O emissions (Hedwall et al. 2014; Håkansson et al. 2021).
The effects of fertilization on the species composition, cover, and biomass of ground vegetation, have received relatively little attention compared to tree growth in previous forest fertilization studies in Nordic countries (Saarsalmi and Mälkönen 2001; Hedwall et al. 2014). However, ground vegetation has an important role in C and nutrient cycling in boreal forests despite its rather small biomass (Helmisaari 1995; Finér et al. 2003). Ground vegetation has high rates of nutrient uptake because a large part of its biomass is renewed annually and the nutrient concentrations of ground vegetation biomass are high compared to trees (Mälkönen 1974; Helmisaari 1995). This results in nutrient competition between ground vegetation and trees (Mälkönen 1974). On the other hand, the ground vegetation acts as a buffer, where the nutrients from the fertilization can temporarily be stored, thus decreasing the risk of nutrient export to water courses (Palviainen et al. 2005a, 2005b).
Fertilization has both direct and indirect effects on the ground vegetation that can be observed for decades (Strengbom et al. 2001). The direct effects are due to the increased N availability, which shifts the species composition towards that of a more fertile site type (Kellner 1993; Turkington et al. 1998; Rajaniemi 2002). Previous studies have observed an increase in the cover of some vascular plant types, such as grasses and herbs, and some pteridophytes after N fertilization (van Dobben et al. 1999; Strengbom and Nordin 2008; Hedwall et al. 2013). However, the direction of change is not always clear. Fertilization may either decrease or increase the cover of dwarf shrubs (Mäkipää 1994; Strengbom and Nordin 2008; Hedwall et al. 2010; Jacobson et al. 2020). The cover of mosses and lichens has generally decreased after fertilization (Olsson and Kellner 2006; Jacobson et al. 2020), but in some cases fertilization has increased the cover of moss species that favor litter habitats such as Brachythecium spp. (Strengbom and Nordin 2008; Hedwall et al. 2010).
Indirect impacts of N fertilization on ground vegetation are primarily driven by increases in forest growth and litterfall in Scots pine (Pinus sylvestris L.) and Norway spruce (Picea abies (L.) Karst.) stands, which last for 6–10 years after fertilization (Thomas et al. 1999; Valinger et al. 2000; Pettersson and Högbom 2004). Increasing forest growth and canopy closure changes the understory microclimate and light availability affecting the success of ground vegetation, although the extent of this varies with stand structure and species (Skrindo and Øland 2002; Majasalmi and Rautiainen 2020). The mor humus layer, which acts as a growth media for the ground vegetation, is impacted by the cumulative effects of microclimate and species composition through litterfall (Laurén 1999).
In field experiments, fertilizer can be applied manually to ensure it is evenly distributed. However, in practical forestry, fertilizer application is often uneven due to large-scale application using helicopters or forwarders resulting in a variable response in the ground vegetation. So far, only a few earlier studies have focused on the responses of ground vegetation to N fertilization in practical forestry in boreal forests (Strengbom and Nordin 2008; Turkington et al. 1998).
The aim of this study was to investigate the short-term effects of the intensity of N fertilization carried out in practical forestry on the ground vegetation and soil chemical properties in two Scots pine and two Norway spruce dominated upland forest stands in Eastern Finland. Further, we analyzed the impacts of competition caused by trees on the cover of ground vegetation. The fertilizer with the target amounts of 150 and 200 kg N ha–1 was applied using a helicopter in the spruce stands and using a forwarder in the pine stands on medium fertile (Myrtillus-type, MT) upland forest sites. In addition, there were unfertilized control plots (0 kg N ha–1). We observed the distribution of the fertilizer in the sites using funnel traps and used these funnel-trap-observed fertilizer amounts in the analyses.
2 Material and methods
2.1 Study sites and experimental design
This study was conducted in two Scots pine and two Norway spruce dominated stands on medium fertile (Myrtillus-type, MT; based on Cajander 1949) upland (mineral) forest sites in Eastern Finland (Table 1, Fig. 1). All the stands were thinned 4 to 8 years before the fertilization. The 30-year (1990–2020) mean annual air temperature on the sites varied between 2.8 and 3.5 °C and the average annual precipitation between 640 mm and 670 mm, respectively (Table 1). For the duration of the experiments (2018–2022 for pine stands and 2019–2022 for spruce stands), the mean annual air temperature was on average 0.8 °C higher across all sites and the average annual precipitation was lower (592–667 mm) than the 30-year average (Finnish Meteorological Institute 2023). The soil type in all sites is Haplic Podzol according to FAO/WRB classification. The organic layer was mor humus, which is typical humus form in medium fertile upland boreal forests in Finland (Tamminen 1999).
| Table 1. Description of the research sites where the effects of nitrogen fertilization on ground vegetation were studied. The research sites were located in Eastern-Finland. The mean annual air temperature and the annual precipitation are the 30-year average from 1990–2020 (Finnish Meteorological Institute 2023). Stand characteristics were calculated as averages of 27 plots (200 m2). | ||||
| Research site | Liperi | Ilomantsi | Juuka | Savonranta |
| Latitude | 62,55846 N | 62,85543 N | 63,066199 N | 62,139028 N |
| Longitude | 29,06265 E | 30,67705 E | 28,874640 E | 29,149086 E |
| Altitude (m a.s.l.) | 160 | 180 | 170–200 | 120–140 |
| Dominant tree species | Pinus sylvestris | Pinus sylvestris | Picea abies | Picea abies |
| Pinus sylvestris volume (%) | 78 | 86 | 0 | 11.6 |
| Picea abies volume (%) | 19.3 | 12.5 | 86.6 | 86.4 |
| Betula spp. volume (%) | 2.7 | 1.5 | 4.6 | 2.0 |
| Mean annual air temperature (°C) | 3.5 | 3.0 | 2.8 | 3.4 |
| Effective temperature sum (d.d.) | 1200–1300 | 1100–1200 | 1100–1200 | 1200–1300 |
| Annual precipitation (mm) | 640 | 644 | 661 | 670 |
| Date of N application | 27.06.2018 | 20.07.2018 | 25.–27.07.2019 | 10.08.2019 |
| Means of application | Forwarder | Forwarder | Helicopter | Helicopter |
| Stand density (stems ha–1) | 513 | 687 | 619 | 455 |
| Mean diameter at breast height (cm) | 23 | 18 | 21 | 21 |
| Initial volume (m3 ha–1) | 167 | 170 | 187 | 159 |
| Range of the N fertilizer dose (kg N ha–1) (> 0 in plots*) | 110–288 | 109–369 | 48–441 | 50–426 |
| *) In Ilomantsi in one plot and in Savonranta in two plots planned to be fertilized the funnel-trap-observed amount of fertilizer was zero due to problems in fertilizing and they were excluded from range values. | ||||
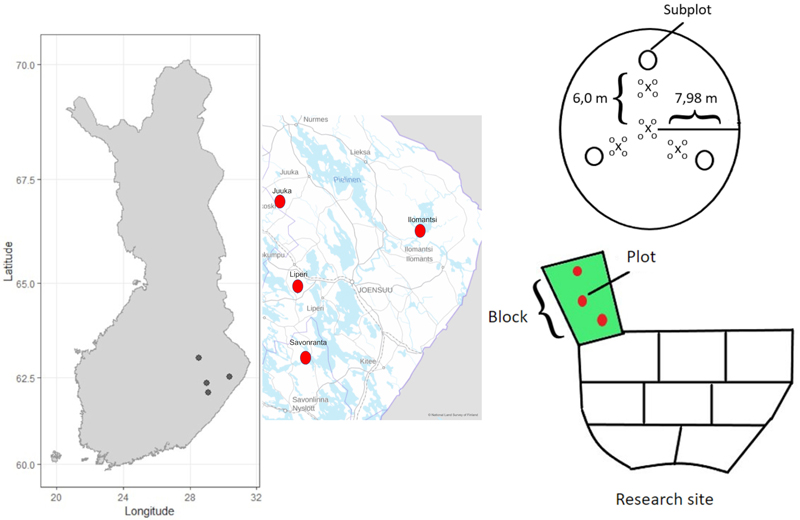
Fig. 1. The location of the four research sites in Eastern Finland, a schematic presentation of the block-design including three replicates of the fertilization treatments (150 kg N ha–1 and 200 kg N ha–1) and unfertilized control blocks. Each block contained three circular plots (200 m2) from where the tree characteristics were measured. Each plot further contained three subplots (0.5 m2) for measuring the cover and species composition of the ground vegetation. Every plot (200 m2) also contained four mineral soil sample points and sixteen mor humus layer sample points.
The experiment was originally established using randomized block design. In every research site three (one hectare) replicate blocks for different fertilization target levels (0 kg N ha–1, 150 kg N ha–1, and 200 kg N ha–1) were established. These fertilizer amounts correspond to the recommendations in practical forestry (Äijälä et al. 2019). Scots pine dominated stands were fertilized by using YaraBela Metsäsalpietari (NPK 27-0-1, indicating 27% N of mass) and the Norway spruce dominated stands by using YaraMila Metsän NP (NPK 25-2-0, indicating 25% N of mass). Scots pine sites were fertilized in June 2018 using a forwarder and a centrifugal spreader. Norway spruce sites were fertilized by helicopter in July 2019.
Before fertilization, three circular (radius 7.98 m, 200 m2) plots were established in every replicate block. Diameter at breast height (DBH) and tree height of all trees (with DBH > 8 cm) were measured by tree species and status (living/dead) for all trees before fertilization (in 2018 for pine and 2019 for spruce) and thereon at the end of each growing season until autumn 2022. The location of living trees relative to the plot center were also measured in autumn 2022, to evaluate effects of competition caused by neighboring trees on ground vegetation cover. In the Ilomantsi research site, thinning was done in summer 2022, and therefore DBH of harvested trees was estimated based on DBH in 2021 and diameter growth of stem base in 2022.
We observed the spatial distribution of the fertilizer by using funnel traps. Each plot contained three (apart from six in Ilomantsi) fertilizer funnels (0.5 m diameter) located at three meters distance from the plot center. Immediately after the fertilization the fertilizer grains captured by the funnels were weighed and the measured mass was converted to units of kg N ha–1. The funnel trap data revealed that the fertilizer was spatially unevenly distributed across the area (Table 1 and Fig. 3). Therefore, instead of factorial analysis of randomized block experiment, we used funnel-trap-observed fertilizer amount as a continuous variable in the analysis.
To study the response of the ground vegetation, three circular sub-plots (radius 0.4 m, 0.5 m2) were established in each plot (200 m2). These subplots were set systematically 6.0 m from the center point of the main plot (Fig. 1). Every plot (200 m2) also contained four mineral soil sample points and sixteen mor humus layer sample points.
2.2 Measurements of ground vegetation sub-plots
In each subplot ground vegetation was studied by visually estimating the percentage cover of each plant species in the plot area. Due to vertically overlapping layers of ground vegetation the total cover can exceed 100%. Additionally, the cover of coarse woody debris was evaluated visually from the subplots, all the pieces of woody debris from needles to fallen branches were included into the cover. The first vegetation inventories in Scots pine dominated sites were conducted in August 2018 and in Norway spruce dominated sites in August–September 2019. The second ground vegetation inventory was done in July 2021 and the third one in July 2022 across all sites.
2.3 Measurements of soil chemical properties in study plots
From every study plot (200 m2), four mineral soil samples and sixteen mor humus layer samples were collected in September 2022 using a cylindrical soil corer (diameter 2.5 cm). One of the mineral soil sampling points was located at the center of the plot and the three others 4 m from the center point in the direction of the subplots (Fig. 1). The mor humus samples were collected next to the mineral soil sampling points (Fig. 1). The mineral soil samples were collected from the upper 20 cm layer, which were then divided by depth into 0–10 cm and 10–20 cm layer samples. The thickness of the mor humus layer was measured from the cores. Soil samples were oven-dried at 40 °C for 48 hours. Dry samples were weighed and passed through a 2 mm sieve. The fraction of <2 mm was used for further chemical analyses. Soil pH was measured in water suspension (1:2.5) using Mettler Toledo SevenCompact S210 pH meter. Soil C and N concentrations were analyzed with varioMAXcube analyzer.
2.4 Evaluation of the implications of ground vegetation cover to nutrient balance
To link the measured ground vegetation cover to the nutrient cycling of the forest ecosystem, we converted the cover values to biomass. We used the observed ground vegetation cover and Equations 1 and 2 from Muukkonen et al. (2006) and the parameter values were taken from Tables 3 and 4. The calculations were done separately for Scots pine and Norway spruce forests. The biomass values were multiplied by the average N concentration values reported by Palviainen et al. (2005b) to obtain the amount of N in kg ha–1. For mosses we used N concentration of 1.2% (of dry mass), for dwarf shrubs 1.1%, and 1.8% for herbaceous plants. In addition, we calculated the amount of N in the mor humus layer (kg ha–1) and estimated the N in tree biomass (kg ha–1) using volume-based equations presented by Palviainen and Finér (2012).
2.5 Statistical analyses
For statistical analyses the ground vegetation species were divided into three groups: herbaceous plants (grasses, herbs, and pteridophytes), dwarf shrubs, and mosses and lichens (lichens had <0.1% cover). In addition, cover of two dwarf shrub species, Vaccinium myrtillus L. and Vaccinium vitis-idaea L. were studied individually because of their commercial importance. The cover of each plant type in a subplot was obtained by summing up the cover of species belonging to the group. The sub-plot level data was used in the statistical analyses. The cover values were arcsine-square-root transformed before the linear regression analyses to meet the normal distribution of the data. Changes in ground vegetation cover during the experiment were calculated by subtracting the cover in 2018 (pine stands) / 2019 (spruce stands) from the cover measured in 2021 and 2022. Changes between 2021 and 2022 were also calculated. The observed changes in ground vegetation cover within the research site were explained by the funnel-trap-observed amount of fertilizer. Because the fertilizer was unevenly distributed, we used the funnel-trap-observed amount of fertilizer as a continuous variable in the linear regression analysis instead of the factor design (Eq. 1, Fig. 3). The fertilizer impact was considered statistically significant if the p-value of the slope parameter was < 0.05. The statistical analyses were made with R 4.2.2 (R Core Team 2022). The package stats, which is part of R, was used to execute the regression analyses.
Linear regression model was fitted for every plant type group in every research site (Eq. 1).
![]()
where y is the arcsine-square-root transformed ground vegetation cover change component, Nt is the funnel-trap-observed amount fertilizer amount in the study plot (kg N ha–1), β0 is an intercept and β1 is a slope describing the ground vegetation cover change per amount of funnel-trap-observed N. We used the significance of the β1 term as a measure of the fertilizer impact.
Eq. 1 was applied to test the effect of funnel-trap-observed N fertilizer amount on the N concentration and C:N ratio in the mor humus layer. We also tested the effect of competition caused by nearest trees on the changes in the vegetation cover. For this purpose, we calculated competition indices (Ci) for every subplot center using the following equation:

where di is the diameter at breast height (1.3 m) of a living tree i (m) measured in autumn 2022 and disti is the distance of tree i from the sub-plot center point (m). Trees inside a 2 m radius from the subplot center were accounted for, and n is the number of stems within this area.
3 Results
3.1 Vegetation cover and fertilization intensity
Before N fertilization, mosses and lichens (28–54%) (Fig. 2) had the highest cover of all plant types. The pre-treatment covers of dwarf shrubs varied from 15 to 31% in the pine-dominated sites, and from 3 to 9% in the spruce-dominated sites (Fig. 2). V. myrtillus and V. vitis-idaea were the main dwarf shrub species in all research sites. The cover of the herbaceous plants in the pine-dominated research sites was 21–37% in Liperi and 6–17% in Ilomantsi before fertilization (Fig. 2). In the spruce-dominated research sites, the cover of herbaceous plants varied between 9–18 and 14–16% in Juuka and Savonranta, respectively.
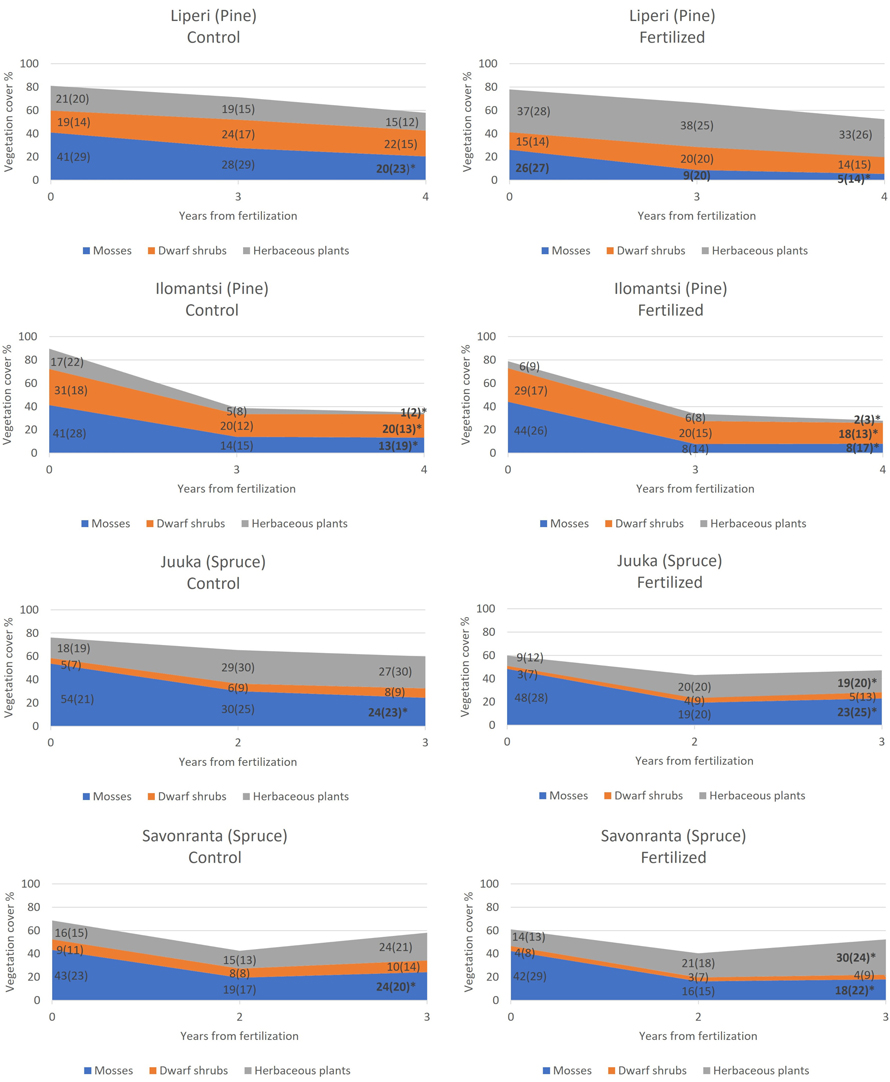
Fig. 2. The development of mean cover of mosses and lichens, dwarf shrubs and herbaceous plants in unfertilized control plots (left) and in fertilized plots (right) during the study period. Standard deviations are presented in parenthesis. The plots were fertilized in 2018 (Liperi, Ilomantsi) and 2019 (Juuka, Savonranta). An asterisk in the year 2022 indicates statistically significant change in the mean cover from 2018 to 2022 (Liperi, Ilomantsi) and from 2019 to 2022 (Juuka, Savonranta).
The total cover of ground vegetation decreased across all sites in the years following the establishment of field experiments (Fig. 2). The fertilization intensity affected the ground vegetation cover. Generally, the moss and lichen cover decreased with the increasing fertilization intensity, but this change was statistically significant only in Juuka (spruce) site (Table 2, Fig. 3).
| Table 2. The change in the ground vegetation and coarse woody debris cover expressed as slopes (β1, Eq. 1) from linear regression analysis. The slope describes the arcsine-square root transformed cover change per amount of funnel-trap-observed N (Mg ha–1). If the slope is negative the cover is reduced by the fertilization and if the slope is positive the cover increases. Statistically significant slope values (p < 0.05) are shown as bold text. | ||||||||||||
| Vegetation cover | Liperi (Pine) | Ilomantsi (Pine) | Juuka (Spruce) | Savonranta (Spruce) | ||||||||
| 2018–2021 | 2018–2022 | 2021–2022 | 2018–2021 | 2018–2022 | 2021–2022 | 2019–2021 | 2019–2022 | 2021–2022 | 2019–2021 | 2019–2022 | 2021–2022 | |
| Tree seedlings | 0.01 | –0.05 | –0.06 | 0.17 | 0.52 | 0.24 | 0.00 | 0.03 | 0.03 | 0.05 | 0.13 | 0.08 |
| Herbaceous plants | 0.11 | 0.04 | –0.08 | 0.56 | 0.36 | –0.08 | 0.12 | 0.21 | 0.09 | 0.39 | 0.50 | 0.11 |
| Grasses | –0.42 | –0.50 | –0.08 | 0.35 | 0.19 | –0.08 | 0.34 | 0.40 | 0.07 | 0.17 | 0.23 | –0.06 |
| Herbs | –0.08 | 0.18 | 0.26 | 0.32 | 0.28 | 0.02 | –0.18 | –0.07 | 0.08 | 0.06 | 0.10 | 0.07 |
| Pteridophytes | 0.48 | 0.27 | –0.21 | 0.03 | –0.02 | –0.02 | –0.08 | –0.08 | 0.00 | 0.22 | 0.38 | 0.16 |
| Dwarf shrubs | –0.25 | –0.39 | –0.15 | 0.00 | 0.01 | 0.18 | –0.04 | –0.02 | 0.02 | –0.05 | –0.18 | –0.12 |
| Vaccinium myrtillus | –0.18 | –0.33 | –0.15 | 0.09 | 0.32 | 0.36 | –0.01 | –0.03 | –0.01 | –0.04 | –0.13 | –0.09 |
| Vaccinium vitis-idaea | –0.15 | –0.11 | 0.04 | 0.02 | –0.06 | –0.09 | –0.03 | –0.02 | 0.01 | 0.01 | 0.00 | –0.01 |
| Mosses and lichens | –0.39 | –0.23 | 0.13 | –0.55 | –0.57 | 0.11 | –0.60 | –0.29 | 0.30 | –0.08 | –0.29 | –0.21 |
| CWD | 0.52 | 0.13 | –0.39 | –0.28 | 0.38 | 0.62 | 0.23 | 0.41 | 0.18 | –0.04 | 0.17 | 0.21 |
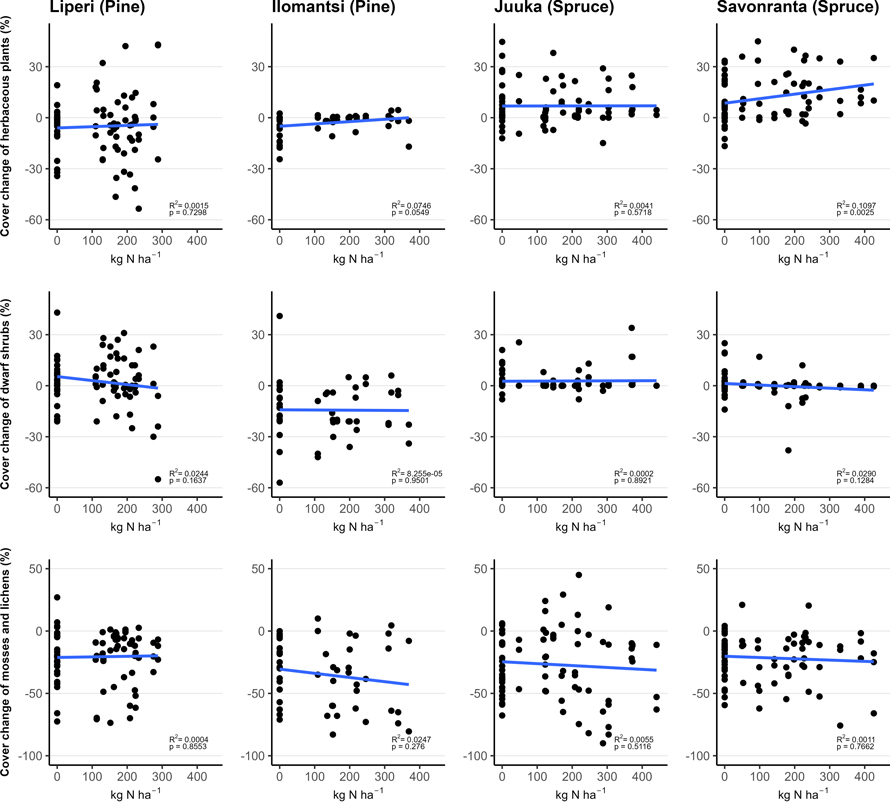
Fig. 3. The relationship between funnel-trap-observed N amount (in plots with area of 200 m2) and vegetation cover change (%) of the mosses and lichens, dwarf shrubs and herbaceous plants in vegetation sub-plots between 2018 (Liperi, Ilomantsi) or 2019 (Juuka, Savonranta) and 2022. The points indicate the measured change in cover with corresponding funnel-trap-observed N amount.
The cover of dwarf shrubs decreased significantly with the increasing fertilization intensity only in Savonranta (spruce) research site (Table 2, Fig. 3). The cover of V. myrtillus increased significantly with the fertilization dose in the Ilomantsi (pine) research site.
The cover of herbaceous plants increased significantly with the increasing fertilization intensity (Table 2, Fig. 3). Within the herbaceous plants the cover of herbs and pteridophytes increased significantly after fertilization in some research sites, whereas grass cover either increased or decreased. The tree seedling cover was small (0.5–4%) and did not change significantly after fertilization (Table 2).
3.2 Changes in soil chemical properties and fertilization intensity
The average concentration of N in the mor humus layer varied between 0.9 and 1.2% in unfertilized plots and 0.9 and 1.5% in fertilized plots three to four years after fertilization (Table 3). The C:N ratio varied between 26 and 29 in unfertilized control plots and between 23 and 32 in the fertilized plots. Mor humus layer N concentrations increased with an increasing fertilization intensity (Fig. 4). However, there was a large variation in N concentrations both in the unfertilized control plots and the fertilized plots. The decrease in C:N ratio in the mor humus layer reflected the increase in the mor humus layer N concentrations.
| Table 3. Concentration of nitrogen (N) (% of dry mass) and carbon to nitrogen (C:N) ratio in the mor humus layer three to four years after fertilization in unfertilized control plots and fertilized plots. | ||||
| Research site | N | C:N | ||
| Control | Fertilized | Control | Fertilized | |
| Liperi (Pine) | 1.1 | 1.3 | 26 | 23 |
| Ilomantsi (Pine) | 0.9 | 0.9 | 29 | 32 |
| Juuka (Spruce) | 1.2 | 1.5 | 26 | 24 |
| Savonranta (Spruce) | 0.9 | 1.2 | 27 | 25 |
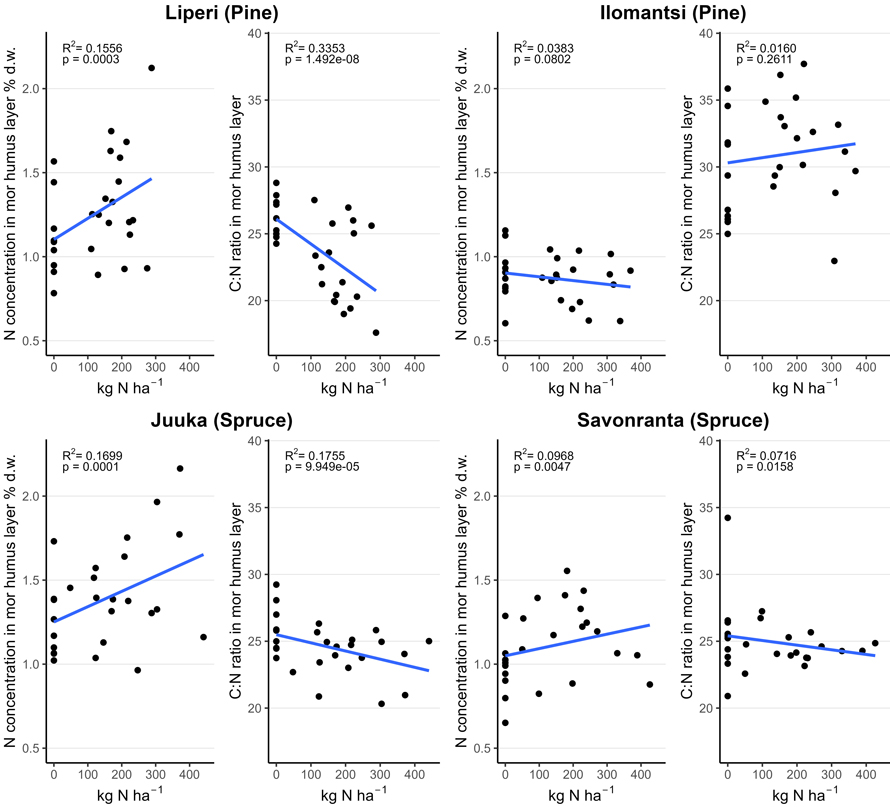
Fig. 4. Nitrogen (N) concentration (% of dry mass (d.w.)) and carbon to nitrogen (C:N) ratio in the mor humus layer in unfertilized and fertilized study plots (200 m2) as a function of the funnel-trap-observed N fertilizer dose.
3.3 Competition between vegetation and trees
The competition indices calculated for the subplots (Eq. 2) did not explain the cover of any plant type group. The competition indices did not explain the changes in the vegetation between 2018–2022 (pine stands) or 2019–2022 (spruce stands) or the short-term change between 2021 and 2022. However, there was a statistically significant confounding effect of the fertilizer amount and competition index that increased the cover of pteridophytes in Savonranta. The higher competition index increased the coarse woody debris cover to some extent in all sites.
3.4 Implications of the ground vegetation cover to nutrient balance
In our study, the estimated total above ground biomass of ground vegetation tended to decrease with increasing fertilization intensity. The N stored in the mosses and lichens, and dwarf shrubs decreased, whereas N increased in herbaceous plants compared with unfertilized control plots (Table 4). The total amount of N stored in the ground vegetation decreased with increasing fertilization intensity. The amount of N in the mor humus layer also increased significantly with the fertilization intensity (Fig. 4, Tables 3 and 4). The N fertilization increased the N stock of the whole forest stand even when the trees were not included in the calculations (Table 4). Amount of N stored in the ground vegetation and mor humus layer was higher in Scots pine stands than in Norway spruce stands in both fertilized and unfertilized plots (Table 4).
| Table 4. The estimated amount of nitrogen (N) in the ground vegetation and mor humus layer kg ha–1 in 2022, three to four years after the fertilization. Statistically significant (p < 0.05) differences between the means of the unfertilized control plots and the fertilized plots within the research site are shown as bold text. | |||||||
| Research site | Treatment | Herbaceous plants | Dwarf shrubs | Mosses and lichens | All ground vegetation | Mor humus layer | All |
| Liperi | Control | 2.3 | 5.2 | 5.2 | 12.7 | 813.9 | 826.6 |
| Fertilized | 4.9 | 4.0 | 1.2 | 10.1 | 1117.0 | 1127.1 | |
| Ilomantsi | Control | 0.2 | 4.7 | 3.1 | 8.0 | 404.2 | 411.6 |
| Fertilized | 0.3 | 4.2 | 1.9 | 6.4 | 447.5 | 453.5 | |
| Juuka | Control | 3.2 | 1.2 | 7.4 | 11.8 | 683.2 | 695.0 |
| Fertilized | 2.2 | 0.8 | 7.1 | 10.1 | 752.8 | 762.8 | |
| Savonranta | Control | 2.8 | 1.4 | 7.5 | 11.8 | 489.1 | 500.9 |
| Fertilized | 3.6 | 0.6 | 5.3 | 9.5 | 588.5 | 598.0 | |
We calculated that approximately 180 kg N ha–1 was stored in the pine sites and 300 kg N ha–1 in the spruce sites before fertilization. In the unfertilized control plots the amount of N in tree biomass increased 6–10 kg N ha–1 and in the fertilized plots 7–13 kg N ha–1 in one growing season. Based on our estimation, the N fertilization increased the amount of N stored in tree biomass by 1–5 kg N ha–1 in a year and this could be seen as 1–2 m3 ha–1 increase in the annual volume growth.
4 Discussion
4.1 Vegetation cover and fertilization intensity
We found that N fertilization decreased the cover of mosses and lichens and increased the cover of herbaceous plants, which is in accordance with previous studies (Dirkse and Martakis 1992; Turkington et al. 1998; van Dobben et al. 1999; Strengbom and Nordin 2008). The decrease in the moss and lichen cover (decrease of 21–36% in 3–4 years) was in the same order of magnitude as previously found in boreal forests (Kellner 1993; Turkington et al. 2002; Hedwall et al. 2010). Initially mosses and lichens had the highest cover of all plant groups in the ground vegetation, but they suffered from N fertilization. In other studies N fertilization has also directly decreased the moss cover (Hedwall et al. 2010), because high N levels interfere with the physiology of mosses including Hylocomium splendens (Hedw.) Schimp. and Pleurozium schreberi (Willd. ex Brid.) Mitt. (Dirkse and Martakis 1992; Salemaa et al. 2008) that were the dominant moss species in our sites. Mosses are susceptible to high ion concentrations because they uptake nutrients efficiently through their entire surface area (Glime 2007).
In previous studies, N fertilization increased shading by the herbaceous plants, which leads to reduced light availability for mosses (Bergamini and Pauli 2001; van der Wal et al. 2007). Britton et al. (2018) argues that the addition of N reduces the C:N ratio of the moss litter thereby enhancing the rate of mineralization. Increased decomposition of moss litter alters the growth medium, thus opening growing space and making it favorable for more competitive plants, such as grasses and herbs, to grow.
We found that dwarf shrub cover decreased after N fertilization, which has been similarly observed in several prior studies (Mäkipää 1994; Strengbom and Nordin 2008; Hedwall et al. 2010). This decrease has been attributed to a simultaneous increase in the cover of fast-growing grasses (Aerts and Berendse 1988). Furthermore, Strengbom et al. (2002, 2006) suggested that the decreased dwarf shrub cover after the N fertilization may be explained by increased occurrence of the parasitic fungus Valdensia heterodoxa Peyronel, which causes defoliation and decreases leaf growth (Witzell and Shevtsova 2004). The mechanism behind the increased infections is possibly related to the decrease in the defense-related secondary metabolism or increase in the presence of amino acids in V. myrtillus leaf tissues which increases the risk of infection (Strengbom et al. 2002; Witzell and Shevtsova 2004). Surprisingly, in the Ilomantsi (pine) site, the cover of dwarf shrubs tended to increase with increasing fertilization intensity, but the effect was not statistically significant. Jacobson et al. (2020) obtained similar results from their fertilization study. Same time we observed an increase in cover of herbaceous plants contradicting the results of Aerts and Berendse (1988). As a consequence of N fertilization, we observed a decrease in the cover of V. myrtillus and V. vitis-idaea, which may imply reduce in the berry production (Miina et al. 2009; Turtiainen et al. 2013; Granath and Strengbom,2017).
We found a significant increase in the cover of herbaceous plants (grasses, herbs, and pteridophytes) after N fertilization, which is similar to what other studies have reported (Heil and Diemont 1983; Aerts and Berendse 1988; Jonasson 1992; Kellner 1993; van Dobben et al. 1999; Strengbom and Nordin 2008, 2012; Hedwall et al. 2013). In general, grasses and herbs grow faster than dwarf shrubs and mosses, which gives them a competitive advantage (Grime et al. 1990). Hester et al. (1991) found that the grass species Deschampsia flexuosa (L.) Trin. and Agrostis capillaris L. are able to outcompete V. myrtillus when resources become more abundant after fertilization. However, a variable response to N fertilization has been observed among the grasses and herbs. Some species are favored, and other species suffer following fertilization (Turkington et al. 1998), reflecting the different functional traits of the species (Grainger and Turkington 2013). The increased vascular plant cover we observed was less than the increase found after clear cutting, in response to increased nutrients and light (Palviainen et al. 2005b). This was because the closed canopy reduces the light availability (Strengbom et al. 2004).
Our study is among the few studies done on ground vegetation examining the effects of N fertilization intensity that was applied using a forwarder or helicopter, which is typical in practical forestry. The very unevenly distributed fertilizer dose over the research areas was one reason for the large variation in the response of ground vegetation to fertilization within the study plots (Fig. 3). In the sites fertilized by helicopter, the fertilizer tended to be more unevenly distributed than with ground-based fertilization. The uneven distribution of fertilizer caused higher fertilization intensities in the spruce sites, and it can be seen also as a more notable increase of the cover of herbaceous plants. Gilliam (2006) argued that N fertilization may decrease the heterogeneity of the soil N availability, which causes changes in the ground vegetation. The decreased heterogeneity may favor some grasses and herbs and result in a decrease of the species diversity in the fertilized ecosystem (Strengbom and Nordin 2008).
Before the fertilization, differences in ground vegetation between the pine- and spruce-dominated sites were likely caused by the differences in microclimate (e.g., light conditions), growth media and nutrient cycling (Laurén 1999; Palviainen et al. 2004; Ukonmaanaho et al. 2008; Palviainen and Finér 2012; Majasalmi and Rautiainen 2020). Furthermore, all sites were thinned 4–8 years before the experiment, and in the Ilomantsi site also in summer 2022. Thinning temporarily increases the light, water and nutrient availability in the ground vegetation and may, therefore, also change species composition and coverage. However, in previous studies it has been observed that the effect of fertilization on the ground vegetation is greater than that of thinning (Hedwall et al. 2013).
The spruce sites were dominated by mosses and lichens, whereas the vegetation cover in the pine sites was more evenly distributed between dwarf shrubs, herbaceous plants, and mosses and lichens. Similar to previous studies (Kellner 1993; Turkington et al. 1998; Olsson and Kellner 2006), the only notable difference in the fertilization response between the pine and spruce sites was that the cover of herbaceous plants increased significantly in the spruce sites, whereas the increase was not significant in the pine sites. Also, total vegetation cover decreased more on the pine sites, whereas the increase of the vascular plant cover compensated for the loss of the moss and lichen cover in the spruce sites. This may also be caused by the higher fertilizer amounts in the spruce stands. Notably, there was recent (in 2021) snow and wind damage present on the spruce site in Juuka. This likely changed the light conditions to some extent, leading to increased growth of grasses and herbs.
4.2 Implications to nutrient balance
Even though the biomass of ground vegetation is small in boreal forests, it is an important part of the nutrient cycle, because a large fraction of the biomass of ground vegetation is renewed annually resulting in high nutrient uptake (Mälkönen 1974; Helmisaari 1995). We calculated that the total biomass and the N stocks of the ground vegetation decreased with increasing fertilization intensity. The biomass and N stock of herbaceous plants increased, but this increase was not enough to compensate for the decrease in dwarf shrubs and moss biomass. Similar observations have been described by Mäkipää (1994). These changes alter N cycling because N concentrations in mosses and dwarf shrubs are lower than those in grasses and herbs, and a smaller share of their biomass is renewed annually (Palviainen et al. 2005b). Consequently, the N demand of mosses is lower than that of herbaceous plants, and therefore, mosses do not benefit from the fertilization to the same extent as the herbaceous plants.
Only a small fraction of the N from fertilizer is typically retained in the ground vegetation. Melin and Nômmik (1988) observed that 1% of 150 kg N ha–1 accumulated into the ground vegetation, whereas 48% of the applied N was accumulated in the soil and around 33% in the tree biomass. We calculated that after the fertilization the amount of N in the tree biomass increased 7–13 kg N ha–1 in one growing season after N fertilization. This increase in the N amount corresponds to 1–2 m3 ha–1 increase in the annual volume growth, which is aligned with previous studies (Valinger et al. 2000; Pukkala 2017).
Large quantities of N are stored in the mor humus layer and mineral soil in boreal forests; therefore, soil is an important part of the nutrient cycle (Merilä et al. 2014). In our study, the amount of N in the mor humus layer increased significantly with the fertilization intensity. In the previous studies, the amount of N stored in the mor humus layer has been shown to increase after the N fertilization (Melin and Nômmik 1988; Mäkipää 1994; Ladanai et al. 2007; Merilä et al. 2014). Indirect increases of the N content in the mor humus layer can be caused by increased litterfall and a decreased decomposition rate following the N fertilization (Prescott et al. 1992). In coniferous trees a large share of the added N is allocated to the annual growth of needles and shoots (Melin et al. 1983), which leads to increased litter fall (Miller et al. 1976).
Although a large amount of the fertilizer N is retained in the soil, trees, and ground vegetation, a fraction of the excess N leaches to groundwater and water courses (Preston and Mead 1994; Eriksson et al. 1996; Binkley et al. 1998; Bergh et al. 2008). In unmanaged boreal forests, annual N export to water courses is 1–2 kg N ha–1 (Kortelainen et al. 2006). In previous studies, the leaching losses have been observed to be 6–24% of the applied fertilizer N (Melin et al. 1983; Melin and Nômmik 1988). The increased N export after the fertilization is highest during the first years and decreases with time (Bergh et al. 2008). The risk of N leaching is highest in saturated ecosystems, whereas in N limited boreal forests where much of the fertilizer N is retained in the forest (Kortelainen et al. 1997; Binkley et al. 1998).
5 Conclusions
The unevenness of commercial fertilization done by helicopter or forwarder creates a gradient of different fertilization intensities. In our study, the N fertilization decreased the cover of mosses and lichens, and dwarf shrubs and increased the cover of herbaceous plants shortly after the N application. The funnel-trap-observed fertilizer amount affected the magnitude of the vegetation response, and the changes in the vegetation cover were more pronounced in areas with higher fertilizer dose. Mor humus layer was found to retain a significant amount of the applied N, which may be reflected in vegetation composition and tree growth in delay. Long-term vegetation monitoring is needed in various conditions because we found that vegetation responses might depend on tree species, lighting conditions and soil chemical properties and the different application methods of the fertilizer. We can conclude that changes in ground vegetation species composition and the decreased C:N ratio in mor humus layer alter the nutrient cycling.
Declaration of openness of research materials, data, and code
Data is available upon request from the corresponding author (johanna.jetsonen@helsinki.fi).
Authors contribution
JJ: Data curation, Formal analysis, Investigation, Methodology, Visualization, Writing-original draft
AL: Conceptualization, Formal analysis, Investigation, Methodology, Writing-review & editing
HP: Conceptualization, Formal analysis, Funding acquisition, Investigation, Methodology, Project administration, Resources, Writing-review & editing
OM: Conceptualization, Data curation
JN: Data curation, Writing-review & editing
VPI: Formal analysis, Methodology
AK: Formal analysis, Methodology, Writing-review & editing
EST: Conceptualization, Data curation, Writing-review & editing
EM: Data curation, Writing-review & editing
NK: Data curation, Writing-review & editing
MP: Formal analysis, Funding acquisition, Investigation, Methodology, Project administration, Resources, Writing-review & editing
Acknowledgements
Jarmo Pennala, Risto Ikonen, Anna Laine-Petäjäkangas, Joni-Matti Kusmin and Petro Penttinen are thanked for assisting in the field measurements and Maini Mononen and Leena Kuusisto for assisting in laboratory analyses at the School of Forest Sciences, University of Eastern Finland. Tornator, Yara, Forest Vital and University of Eastern Finland are acknowledged for establishing these fertilization experiments.
Funding
This research was funded by PREFER Academy project (decision numbers 348096 and 348103) and UNITE flagship (decision numbers 337127 and 357906), both funded by the Research Council of Finland.
References
Aerts R, Berendse F (1988) The effect of increased nutrient availability on vegetation dynamics in wet heathlands. Vegetatio 76: 63–69. https://doi.org/10.1007/BF00047389.
Äijälä O, Koistinen A, Sved J, Vanhatalo K, Väisänen P (eds) 2019 Metsänhoidon suositukset. [Forest management recommendations.] Tapion julkaisuja. https://tapio.fi/wp- content/uploads/2020/09/Metsanhoidon_suositukset_Tapio_2019.pdf.
Bergamini A, Pauli D (2001) Effects of increased nutrient supply on bryophytes in montane calcareous fens. J Bryol 23(4): 331–339. https://doi.org/10.1179/jbr.2001.23.4.331.
Bergh J, Nilsson U, Grip H, Hedwall O, Lundmark T (2008) Effects of frequency of fertilisation on production, foliar chemistry and nutrient leaching in young Norway spruce stands in Sweden. Silva Fenn 42: 721–733. https://doi.org/10.14214/sf.225.
Binkley D, Burnham H, Allen H (1999) Water quality impacts of forest fertilization with nitrogen and phosphorus. Forest Ecol Manag 121: 191–213. https://doi.org/10.1016/S0378-1127(98)00549-0.
Britton A, Mitchell RJ, Fisher JM, Riach DJ, Taylor AFS (2018) Nitrogen deposition drives loss of moss cover in alpine moss–sedge heath via lowered C : N ratio and accelerated decomposition. New Phytol 218: 470–478. https://doi.org/10.1111/nph.15006.
Cajander AK (1949) Forest types and their significance. Acta For Fenn 56, article id 7396. https://doi.org/10.14214/aff.7396.
Carreiro M, Sinsabaugh R, Repert D, Parkhurst D (2000) Microbial enzyme shifts explain litter decay responses to simulated nitrogen deposition. Ecology 81: 2359–2365. https://doi.org/10.2307/177459.
Dirkse G, Martakis G (1992) Effects of fertilizer on bryophytes in Swedish experiments on forest fertilization. Biol Conserv 59: 155–161. https://doi.org/10.1016/0006-3207(92)90576-9.
Eriksson HM, Berdén M, Rosén K, Nilsson SI (1996) Nutrient distribution in a Norway spruce stand after long-term application of ammonium nitrate and superphosphate. Water Air Soil Pollut 92: 451–467. https://doi.org/10.1007/BF00283572.
Finér L, Mannerkoski H, Piirainen S, Starr M (2003) Carbon and nitrogen pools in an old-growth, Norway spruce mixed forest in eastern Finland and changes associated with clear-cutting. Forest Ecol Manag 174: 51–63. https://doi.org/10.1016/S0378-1127(02)00019-1.
Finnish Meteorological Institute (2023) Open data ‐ Finnish Meteorological Institute. https://en.ilmatieteenlaitos.fi/open-data. Accessed 27 February 2023.
Gilliam FS (2006) Response of the herbaceous layer of forest ecosystems to excess nitrogen deposition. J Ecol 94: 1176–1191. https://doi.org/10.1111/j.1365-2745.2006.01155.x.
Glime JM (2017) Nutrient relations: uptake and location. Chapt. 8-4. In: Glime JM. Bryophyte ecology volume 1. 8-4-1 Physiological ecology. Ebook sponsored by Michigan Technological University and the International Association of Bryologists. http://digitalcommons.mtu.edu/bryophyte-ecology/.
Grainger TN, Turkington R (2013) Mechanisms for success after long-term nutrient enrichment in a boreal forest understory. PLoS One 8, article id e61229. https://doi.org/10.1371/journal.pone.0061229.
Granath G, Strengbom J (2017) Nitrogen fertilization reduces wild berry production in boreal forests. Forest Ecol Manag 390: 119–126. https://doi.org/10.1016/j.foreco.2017.01.024.
Grime JP, Rincon ER, Wickerson BE (1990) Bryophytes and plant strategy theory. Bot J Linn Soc 104: 175–186. https://doi.org/10.1111/j.1095-8339.1990.tb02217.x.
Gustavsen HG, Lipas E (1975) Lannoituksella saatavan kasvunlisäyksen riippuvuus annetusta typpimäärästä. Summary: Effect of nitrogen dosage on fertilizer response. Folia For 246. http://urn.fi/URN:ISBN:951-40-0188-5.
Håkansson C, Hedwall PO, Strömgren M, Axelsson M, Bergh J (2021) Effects of fertilization on soil CH4 and N2O fluxes in young Norway spruce stands. Forest Ecol Manag 499, article id 119610. https://doi.org/10.1016/j.foreco.2021.119610.
Hedwall PO, Gong P, Ingerslev M, Bergh J (2014) Fertilization in northern forests – biological, economic and environmental constraints and possibilities. Scand J Forest Res 29: 301–311. https://doi.org/10.1080/02827581.2014.926096.
Hedwall PO, Nordin A, Brunet J, Bergh J (2010) Compositional changes of forest-floor vegetation in young stands of Norway spruce as an effect of repeated fertilisation. Forest Ecol Manag 259: 2418–2425. https://doi.org/10.1016/j.foreco.2010.03.018.
Hedwall PO, Strengbom J, Nordin A (2013) Can thinning alleviate negative effects of fertilization on boreal forest floor vegetation? Forest Ecol Manag 310: 382–392. https://doi.org/10.1016/j.foreco.2013.08.040.
Heil GW, Diemont WH (1983) Raised nutrient levels change heathland into grassland. Vegetatio 53: 113–120. https://doi.org/10.1007/BF00043031.
Helmisaari H-S (1995) Nutrient cycling in Pinus sylvestris stands in eastern Finland. Plant Soil 168: 327–336. https://doi.org/10.1007/BF00029345.
Hester A J, Miles J, Gimingham CH (1991) Succession from heather moorland to birch woodland. II. Growth and competition between Vaccinium myrtillus, Deschampsia flexuosa and Agrostis capillaris. J Ecol 79: 317–327. https://doi.org/10.2307/2260715.
Ilvesniemi H, Forsius M, Finér L, Holmberg M, Kareinen T, Lepistö A, Piirainen S, Pumpanen J, Rankinen K, Starr M, Tamminen P, Ukonmaanaho L, Vanhala P (2002) Carbon and nitrogen storages and fluxes in Finnish forest ecosystems. In: Käyhkö J, Talve L (eds) Understanding the global system. The Finnish perspective. Finnish Global Change Programme FIGARE, Painosalama, Turku, pp 69–82.
Jacobson S, Högbom L, Ring E (2020) Long-term responses of understory vegetation in boreal Scots pine stands after nitrogen fertilization. Scand J Forest Res 35: 139–146. https://doi.org/10.1080/02827581.2020.1761996.
Johnson DW (1992) Effects of forest management on soil carbon storage. In: Wisniewski J, Lugo AE (eds) Natural sinks of CO2. Springer, Dordrecht. https://doi.org/10.1007/978-94-011-2793-6_6.
Jonasson S (1992) Plant responses to fertilization and species removal in tundra related to community structure and clonality. Oikos 63: 420–429. https://doi.org/10.2307/3544968.
Jörgensen K, Granath G, Lindahl BD, Strengbom J (2021) Forest management to increase carbon sequestration in boreal Pinus sylvestris forests. Plant Soil 466: 165–178. https://doi.org/10.1007/s11104-021-05038-0.
Kellner O (1993) Effects on associated flora of silvicultural nitrogen fertilization repeated at long. J Appl Ecol 30: 563–574. https://doi.org/10.2307/2404195.
Kellomäki S, Puttonen P, Tamminen H, Westman CJ (1982) Effect of nitrogen fertilization on photosynthesis and growth in young Scots pine – preliminary results. Silva Fenn 16: 363–371. https://doi.org/10.14214/sf.a15084.
Kortelainen P, Saukkonen S, Mattsson T (1997) Leaching of nitrogen from forested catchments in Finland. Global Biogeochem Cy 11: 627–638. https://doi.org/10.1029/97GB01961.
Kortelainen P, Mattsson T, Finér L, Ahtiainen M, Saukkonen S, Sallantaus T (2006) Controls on the export of C, N, P and Fe from undisturbed boreal catchments, Finland. Aquat Sci 68: 453–468. https://doi.org/10.1007/s00027-006-0833-6.
Ladanai S, Ågren G, Hyvönen R, Lundkvist H (2007) Nitrogen budgets for Scots pine and Norway spruce ecosystems 12 and 7 years after the end of long-term fertilisation. Forest Ecol Manag 238: 130–140. https://doi.org/10.1016/j.foreco.2006.10.005.
Laurén A (1999) Hydraulic, thermal and aeration properties of mor layers in Finland. Faculty of Forestry, University of Joensuu.
Lecocq F, Winkler H, Daka JP, Fu S, Gerber JS, Kartha S, Krey V, Lofgren H, Masui T, Mathur R, Portugal-Pereira J, Sovacool BK, Vilariño MV, Zhou N (2022) Mitigation and development pathways in the near- to mid-term. In: Shukla PR, Skea J, Slade R, Al Khourdajie A, van Diemen R, McCollum D, Pathak M, Some S, Vyas P, Fradera R, Belkacemi M, Hasija A, Lisboa G, Luz S, Malley J (eds) IPCC 2022: Climate change 2022: mitigation of climate change. Contribution of Working Group III to the Sixth Assessment Report of the Intergovernmental Panel on Climate Change. Cambridge University Press, Cambridge, UK and New York, NY, USA. https://doi.org/10.1017/9781009157926.006.
Majasalmi T, Rautiainen M (2020) The impact of tree canopy structure on understory variation in a boreal forest. Forest Ecol Manag 466, article id 118100. https://doi.org/10.1016/j.foreco.2020.118100.
Mäkipää R (1994) Effects of nitrogen fertilization on the humus layer and ground vegetation under closed canopy in boreal coniferous stands. Silva Fenn 28: 81–94. https://doi.org/10.14214/sf.a9164.
Mäkipää R (1995) Effect of nitrogen input on carbon accumulation of boreal forest soils and ground vegetation. Forest Ecol Manag 79: 217–226. https://doi.org/10.1016/0378-1127(95)03601-6.
Mälkönen E (1974) Annual primary production and nutrient cycle in some Scots pine stands. Comm Inst For Fenn 84: 1–87. http://urn.fi/URN:NBN:fi-metla-201207171117.
Marshall J, Peichl M, Tarvainen L, Lim H, Lundmark T, Näsholm T, Öquist M, Linder S (2021) A carbon-budget approach shows that reduced decomposition causes the nitrogen-induced increase in soil carbon in a boreal forest. Forest Ecol Manag 502, article id 119750. https://doi.org/10.1016/j.foreco.2021.119750.
Melin J, Nômmik H (1988) Fertilizer nitrogen distribution in a pinus sylvestris/ picea abies ecosystem, central Sweden. Scand J Forest Res 3: 3–15. https://doi.org/10.1080/02827588809382490.
Melin J, Nômmik H, Lohm U, Flower-Ellis J (1983) Fertilizer nitrogen budget in a Scots pine ecosystem attained by using root-isolated plots and 15N tracer technique. Plant Soil 74: 249–263. https://doi.org/10.1007/BF02143615.
Merilä P, Mustajärvi K, Helmisaari H-S, Hilli S, Lindroos A-J, Nieminen TM, Nöjd P, Rautio P, Salemaa M, Ukonmaanaho L (2014) Above- and belowground N stocks in coniferous boreal forests in Finland: implications for sustainability of more intensive biomass utilization. Forest Ecol Manag 311: 17–28. https://doi.org/10.1016/j.foreco.2013.06.029.
Miina J, Hotanen J-P, Salo K (2009) Modelling the abundance and temporal variation in the production of bilberry (Vaccinium myrtillus L.) in Finnish mineral soil forests. Silva Fenn 43: 577–593. https://doi.org/10.14214/sf.181.
Miller HG, Cooper JM, Miller JD (1976) Effect of nitrogen supply on nutrients in litter fall and crown leaching in a stand of Corsican pine. J Appl Ecol 13: 233–248. https://doi.org/10.2307/2401943.
Muukkonen P, Mäkipää R, Laiho R, Minkkinen K, Vasander H, Finér L (2006) Relationship between biomass and percentage cover in understorey vegetation of boreal coniferous forests. Silva Fenn 40: 231–245. https://doi.org/10.14214/sf.340.
Olsson BA, Kellner O (2006) Long-term effects of nitrogen fertilization on ground vegetation in coniferous forests. Forest Ecol Manag 237: 458–470. https://doi.org/10.1016/j.foreco.2006.09.068.
Palviainen M, Finér L (2012) Estimation of nutrient removals in stem-only and whole-tree harvesting of Scots pine, Norway spruce, and birch stands with generalized nutrient equations. Eur J For Res 131: 945–964. https://doi.org/10.1007/s10342-011-0567-4.
Palviainen M, Finér L, Kurka A-M, Mannerkoski H, Piirainen S, Starr M (2004) Decomposition and nutrient release from logging residues after clear-cutting of mixed boreal forest. Plant Soil 263: 53–67. https://doi.org/10.1023/B:PLSO.0000047718.34805.fb.
Palviainen M, Finér L, Mannerkoski H, Piirainen S, Starr M (2005a) Changes in the above- and below-ground biomass and nutrient pools of ground vegetation after clear-cutting of a mixed boreal forest. Plant Soil 275: 157–167. https://doi.org/10.1007/s11104-005-1256-1.
Palviainen M, Finér L, Mannerkoski H, Piirainen S, Starr M (2005b) Responses of ground vegetation species to clear-cutting in a boreal forest: aboveground biomass and nutrient contents during the first 7 years. Ecol Res 20: 652–660. https://doi.org/10.1007/s11284-005-0078-1.
Pettersson F, Högbom L (2004) Long-term growth effects following forest nitrogen fertilization in Pinus sylvestris and Picea abies stands in Sweden. Scand J Forest Res 19: 339–347. https://doi.org/10.1080/02827580410030136.
Prescott CE, Corbin JP, Parkinson D (1992) Immobilization and availability of N and P in the forest floors of fertilized Rocky Mountain coniferous forests. Plant Soil 143: 1–10. https://doi.org/10.1007/BF00009123.
Preston CM, Mead DJ (1994) Growth response and recovery of 15N-fertilizer one and eight growing seasons after application to lodgepole pine in British Columbia. Forest Ecol Manag 65: 219–229. https://doi.org/10.1016/0378-1127(94)90172-4.
Pukkala T (2017) Optimal nitrogen fertilization of boreal conifer forest. For Ecosyst 4, article id 3. https://doi.org/10.1186/s40663-017-0090-2.
Rajaniemi TK (2002) Why does fertilization reduce plant species diversity? Testing three competition-based hypotheses. J Ecol 90: 316–324. https://doi.org/10.1046/j.1365-2745.2001.00662.x.
R Core Team (2022) R: a language and environment for statistical computing. R Foundation for Statistical Computing, Vienna, Austria. https://www.R-project.org/.
Saarsalmi A, Mälkönen E (2001) Forest fertilization research in Finland: a literature review.Scand J Forest Res 16: 514–535. https://doi.org/10.1080/02827580152699358.
Salemaa M, Mäkipää R, Oksanen J (2008) Differences in the growth response of three bryophyte species to nitrogen. Environ Pollut 152: 82–91. https://doi.org/10.1016/j.envpol.2007.05.019.
Sikström U, Nohrstedt HÖ, Pettersson F, Jacobson S (1998) Stem-growth response of Pinus sylvestris and Picea abies to nitrogen fertilization as related to needle nitrogen concentration. Trees 12: 208–214. https://doi.org/10.1007/PL00009712.
Skrindo A, Øland RH (2002) Effects of fertilization on understorey vegetation in a Norwegian Pinus sylvestris forest. Appl Veg Sci 5: 167–172. https://doi.org/10.1111/j.1654-109X.2002.tb00546.x.
Strengbom J, Nordin A (2008) Commercial forest fertilization causes long-term residual effects in ground vegetation of boreal forests. Forest Ecol Manag 256: 2175–2181. https://doi.org/10.1016/j.foreco.2008.08.009.
Strengbom J, Nordin A (2012) Physical disturbance determines effects from nitrogen addition on ground vegetation in boreal coniferous forests. J Veg Sci 23: 361–371. https://doi.org/10.1111/j.1654-1103.2011.01359.x.
Strengbom J, Nordin A, Näsholm T, Ericson L (2001) Slow recovery of boreal forest ecosystem following decreased nitrogen input. Funct Ecol 15: 451–457. https://doi.org/10.1046/j.0269-8463.2001.00538.x.
Strengbom J, Nordin A, Näsholm T, Ericson L (2002) Parasitic fungus mediates change in nitrogen-exposed boreal forest vegetation. J Ecol 90: 61–67. https://doi.org/10.1046/j.0022-0477.2001.00629.x.
Strengbom J, Näsholm T, Ericson L (2004) Light, not nitrogen, limits growth of the grass Deschampsia flexuosa in boreal forests. Can J Bot 82: 430–435. https://doi.org/10.1139/b04-017.
Strengbom J, Englund G, Ericson L (2006) Experimental scale and precipitation modify effects of nitrogen addition on a plant pathogen. J Ecol 94: 227–233. https://doi.org/10.1111/j.1365-2745.2005.01073.x.
Tamm CO (1991) Nitrogen in terrestrial ecosystems questions of productivity, vegetational changes, and ecosystem stability. Springer, Berlin.
Tamminen P (1999) Maaperätunnusten maastoarvioinnin tarkkuus. [Accuracy of field assessment of soil characteristics]. Metsätieteen aikakauskirja, article id 6848. https://doi.org/10.14214/ma.6848.
Thomas SC, Halpern CB, Falk DA, Liguori DA, Austin KA (1999) Plant diversity in managed forests: understory responses to thinning and fertilization. Ecol Appl 9(3): 864–879. https://doi.org/10.1890/1051-0761(1999)009[0864:PDIMFU]2.0.CO;2.
Turkington R, John E, Krebs CJ, Dale MRT, Nams VO, Boonstra R, Boutin S, Martin K, Sinclair ARE, Smith JNM (1998) The effects of NPK fertilization for nine years on boreal forest vegetation in northwestern Canada. J Veg Sci 9: 333–346. https://doi.org/10.2307/3237098.
Turkington R, John E, Watson S, Seccombe-Hett P (2002) The effects of fertilization and herbivory on the herbaceous vegetation of the boreal forest in north-western Canada: a 10-year study. J Ecol 90: 325–337. https://doi.org/10.1046/j.1365-2745.2001.00666.x.
Turtiainen M, Miina J, Salo K, Hotanen J-P (2013) Empirical prediction models for the coverage and yields of cowberry in Finland. Silva Fenn 47, article id 1005. https://doi.org/10.14214/sf.1005.
Ukonmaanaho L, Merilä P, Nöjd P, Nieminen TM (2008) Litterfall production and nutrient return to the forest floor in Scots pine and Norway spruce stands in Finland. Borel Env Res 13: 67–91. http://hdl.handle.net/10138/235267.
Valinger E, Elfving B, Mörling T (2000) Twelve-year growth response of Scots pine to thinning and nitrogen fertilisation. Forest Ecol Manag 134: 45–53. https://doi.org/10.1016/S0378-1127(99)00244-3.
van der Wal R, Pearce ISK, Brooker RW (2005) Mosses and the struggle for light in a nitrogen-polluted world. Oecologia 142: 159–168. https://doi.org/10.1007/s00442-004-1706-0.
van Dobben HF, ter Braak CJF, Dirkse GM (1999) Undergrowth as a biomonitor for deposition of nitrogen and acidity in pine forest. Forest Ecol Manag 114: 83–95. https://doi.org/10.1016/S0378-1127(98)00383-1.
Witzell J, Shevtsova A (2004) Nitrogen-induced changes in phenolics of Vaccinium myrtillus –implications for interaction with a parasitic fungus. J Chem Ecol 30: 1937–1956. https://doi.org/10.1023/B:JOEC.0000045587.75128.a4.
Total of 80 references.
