Alexander Kaulen  ,
Benjamin Engler,
Thomas Purfürst
,
Benjamin Engler,
Thomas Purfürst
Net carbon storage of supplied timber in highly mechanized timber harvest
Kaulen A., Engler B., Purfürst T. (2024). Net carbon storage of supplied timber in highly mechanized timber harvest. Silva Fennica vol. 58 no. 4 article id 24011. https://doi.org/10.14214/sf.24011
Highlights
- CO2 emissions from timber supply comprise only 1.5–5% of the CO2 stored in wood
- Distance to the mill has the greatest influence on CO2 emissions
- Successful application by combining a few variable parameters from forest machine data with constant parameters to create a net carbon storage of the supplied timber
- Simple presentation of the net CO2 storage capacity of wood can influence policy positively.
Abstract
Highly mechanized timber harvesting and timber logistics emit CO2. In turn, the provided timber stores CO2 from the atmosphere as biogenic carbon. This basic assumption resulted in the calculation of net carbon storage of supplied timber. For this, we first developed a formula that represents the carbon content of freshly harvested timber. Coniferous wood contains about 734 kg CO2 m-3 and deciduous wood about 1000 CO2 m-3. Contrary to this, CO2 emissions from trucks, harvesters, and forwarders were calculated using the variable parameters for actual diesel consumption and the distance to the sawmill and constant parameters for the transport of the machine to the stand, lubricants, transport of operators, loading, and fabrication, supply, and maintenance. The method was tested on an actual harvest. The principal findings are that the method is practical, the net carbon storage of the supplied timber is reduced by 1.5% to 5% by harvesting and transport activities, and timber logistics is the largest contributor to emissions. The CO2 emissions for harvesters and forwarders are about 4 kg CO2 m-3, and for downstream timber logistics across all assortments and distances is 11 kg CO2 m-3. We conclude that the emissions are low, vis-a-vis the storage capacity. Emissions and a standardized calculation model are imperative. The model developed here for mapping the net carbon storage of roundwood highlights the climate protection performance of timber and contributes to optimizing climate-friendly timber supply chains.
Keywords
carbon balance;
emissions;
forest machine data;
forestry technique;
timber supply chain;
traceability
-
Kaulen,
KWF - Kuratorium für Waldarbeit und Forsttechnik e.V., Spremberger Straße 1, 64823 Groß-Umstadt, Germany; University of Freiburg, Chair of Forest Operations, Werthmannstr. 6, 79085 Freiburg, Germany
 https://orcid.org/0009-0006-2633-8132
E-mail
alexander.kaulen@kwf-online.de
https://orcid.org/0009-0006-2633-8132
E-mail
alexander.kaulen@kwf-online.de
-
Engler,
University of Freiburg, Chair of Forest Operations, Werthmannstr. 6, 79085 Freiburg, Germany
https://orcid.org/0000-0003-2104-8209
E-mail
benjamin.engler@foresteng.uni-freiburg.de
-
Purfürst,
University of Freiburg, Chair of Forest Operations, Werthmannstr. 6, 79085 Freiburg, Germany
https://orcid.org/0000-0001-9661-0193
E-mail
thomas.purfuerst@foresteng.uni-freiburg.de
Received 13 February 2024 Accepted 23 August 2024 Published 25 September 2024
Views 88411
Available at https://doi.org/10.14214/sf.24011 | Download PDF

Supplementary Files
1 Introduction
With the increase in the effects of climate change impact, global demand for sustainably sourced renewable timber is rising because timber and timber-related products are acknowledged stores of carbon. In 2015, 335 megatons of CO2 were stored annually in harvested wood products (HWP). In 2030, the CO2 storage capacity in HWP will increase to 441 megatons, which is still less than 1% of the global CO2 emissions (Johnston and Radeloff 2019). Besides its sink effect in the form of long-term carbon storage, timber is also considered for substituting fossil fuels in energy use and as a low-emission substitute for energy-intensive building materials such as aluminium, steel, and concrete (Marchi et al. 2018). Forests can be designated as carbon sinks only when sustainable forest management is accompanied by increased (long-lasting) timber consumption (Tellnes et al. 2017).
Mapping biogenic carbon flows is challenging, especially for timber and timber-based products. Long-term sequestration is subject to many factors in forests and timber-derived products, such as the duration of use and the number of recycling cycles (Tellnes et al. 2017). To map the Global Warming Potential (GWP) of wood products and, consequently, the use of forests, we found it useful to minimize the complexity of the entire value chain by focusing on a single fragment, viz., timber supply.
The resource timber is said to be CO2-neutral under the principles of sustainable forest management, which is supported by the Food and Agriculture Organization of the United Nations (FAO). However, discussions are continuing, particularly for energy wood consumption (FAO 2015; Head et al. 2019). Admittedly, a positive impact on the climate can be realized only by a (temporary) prevention of the emission into the atmosphere of the biogenic carbon previously accumulated in the timber through its use. Carbon storage in wood is assured only if timber products retain the carbon stored therein. The process is then accounted as sequestered CO2. The term carbon storage is understood here as CO2 stored in wood and follows the example of Kazulis et al. (2017). Wood combustion releases carbon and causes additional CO2 emissions through harvest, transport, and any form of manipulation, but still substitutes fossil fuels (Tellnes et al. 2017; Aras and Kalaycıoğlu 2020). Trees accumulate an average of 900 kg CO2 m–3 across all tree species. The carbon sequestrated throughout the tree’s lifetime is stored within timber products and forests act as a carbon sink only in managed forests. In unmanaged forests, the accumulated carbon is released back into the atmosphere. However, depending on the intensity, timber harvesting can lead to increased emissions of greenhouse gases (GHG) from the forest soil (Johnson and Curtis 2001; Davis et al. 2009; Achat et al. 2015; Schulze et al. 2022). About 50% of the harvested wood is refined into lumber and furniture, which represents long-term carbon storage (Solarin et al. 2019; Aras and Kalaycıoğlu 2020).
To better understand the importance of these additionally caused CO2 emissions, a comparison with the carbon storage capacity of timber is required, particularly for highly mechanized harvesting systems (Klein et al. 2015; Labelle and Lemmer 2019). During timber harvesting, CO2 is emitted by forest machine operations. The ratio of CO2 emissions depends, inter alia, on the diesel consumption of the machines, the transport distance to the mill, the load carrier, and the total load (Busenius et al. 2015). Additionally, the transport of forest machines and workers to the harvesting site, the use of lubricants, and the fabrication and maintenance of machines are highly important. Therefore, the efficient use of resources is the decisive factor in minimizing the impact on the environment and further increasing the climate protection performance of forestry and timber use. The range of CO2 emissions depends on several factors that can reduce the net carbon storage by up to 7% (Buonocore et al. 2014; FAO 2015; Marchi et al. 2018; Schweier et al. 2019).
Particularly, harvesters and forwarders continuously measure timber data and data on the machine’s own operation. The fieldbus systems on the machines connect all measuring units, such as in the harvester head, where the diameters and lengths are recorded, or from the engine compartment where the diesel consumption is measured. The availability of performance data enables machine operators to constantly improve. Engineers can use this data to improve machine performance. The transmission of the data is standardized and is available in consistent quality. This paper also promotes the use of data sets that are always collected anyway for further use, such as for mapping CO2 emissions, here. The use of assortment data and CO2 emissions represents only a fragment of the possibilities of forest machine data use. Thus, this study will make an important contribution to the dissemination of wood data and raw material flows without media discontinuity through the entire wood supply chain and satisfy the need to track the status of CO2 emissions of wood products.
Recording the CO2 emissions for individual processes and products is the first step in reducing them. Revealing this advantage by making available the status of CO2 emissions can increase the competitiveness of timber (Aras and Kalaycıoğlu 2020). The solid representation of CO2 emissions during timber harvesting versus the sink performance of the provided timber can contribute to preventing the closure of forest areas for usage when arguing with policymakers. Studies of CO2 emission based on forest machine data are important for credibility and help in reducing emissions (Haavikko et al. 2022; Eliasson et al. 2023).
In the next five years, a decisive course will be set for the use of wood in the European Union (EU). Policymakers are negotiating whether the EU Biodiversity Strategy (EUBDS) for 2030 will lead to a withdrawal of the forests from management by 47% in the most intensive scenario or 9% in the moderate scenario. The modeled consequences of the leakage effect, caused by an extensive withdrawal from wood production, show a negative impact on biodiversity, jobs, the economy, and ultimately on climate protection too (European Commission 2020; Schier et al. 2022).
Highlighting the positive characteristics of timber use in climate protection performance can contribute to technically sound legislative proposals. One of the political strategies is “Fit for 55” of the EU. For the forest sector, the objectives are specified in the criteria on land use, land use change, and forestry (LULUCF). It fosters a carbon-neutral forestry and agriculture sector, mainly by reserving large areas of forests (Schier et al. 2022). Fit for 55 focuses narrowly on increasing the carbon pool in forests through forest closures and the ban on harvesting but ignores the climate-positive effect of wood products, as well as the socio-economic importance of the resource (Köhl et al. 2021).
Whether this is realistic is questionable because unmanaged forest areas, especially old-growth forests, although hotspots for biodiversity, do not serve as effective carbon sinks. Instead, through all kinds of decay, such as calamities, windthrows, snow breaks, fungal decays, and natural senescence, forests turn into carbon emitters. Young and middle-aged forests, on the other hand, absorb large amounts of carbon by their fast growth. Therefore, it is necessary to keep as many forest areas as possible under management. The basic assumption is that unmanaged forests emit more CO2 than they absorb (Metslaid et al. 2022). Particularly, the substitution of energy-intensive building materials (steel, concrete) appears to promote the management scenario (Klein et al. 2013). However, there are other opinions. For instance, it is widely held and scientifically proven that reducing forestry interventions has a positive effect on the climate by increasing forest stocks (Skytt et al. 2021). Essentially, it must be decided whether to prioritize the short-term climate-positive effects of forest closure by increasing stocks, or promoting wood products through timber harvesting and thus achieve a positive climate impact through substitution effects and CO2 storage in wood products (Gustavsson et al. 2021). A stronger reflection of this within the EU’s plans would be welcome to better include forestry in the carbon market. In 2024, a framework is to be established to map the sink performance of forests and wood products. If this standard proves robust, forestry could be covered by the Emissions Trading Scheme (ETS). In the long term, natural CO2 sinks, such as forests and timber products, will play a crucial role in offsetting the remaining carbon emissions. The EU envisions its industry and households to be CO2-neutral by 2050, which can be achieved only by storing the remaining emissions in carbon sinks for the long term. To achieve this, it will be necessary to precisely measure and report on captured carbon (Simon 2020). However, the political efforts to take European forests out of management on the one hand and the political ideas for more timber construction, bioeconomy, and CO2 neutrality on the other, require an exact presentation of the carbon removal performance of the resource timber, especially compared to fossil substitutes (D’Amato et al. 2020).
This paper presents a method to determine the net carbon storage of supplied timber in highly mechanized timber harvest and downstream logistics. The method is explained through a simple example of real harvesting data.
2 Thematic positioning and state of the art
2.1 Sustainability Impact Assessment, Life Cycle Assessment, and Sustainable Forest Operations
Sustainability Impact Assessment (SIA) and Life Cycle Assessment (LCA) study the environmental impacts of products and processes at all stages of the value chain. Both reduce negative impacts through an improved and targeted information-driven management of processes. Particularly, the SIA and LCA serve as decision-making tools for legislative interventions by policymakers (Schweier et al. 2019; Zhang et al. 2020). They further serve as a basis for the carbon footprints of products to which the CO2 emissions are mapped throughout a product’s lifetime (Tellnes et al. 2017). LCA and SIA are both considered by the International Organization for Standardization (ISO) as suitable means to describe the climate-positive attributes of timber and optimize sustainable forest operations from the emissions aspect (Timmermann and Dibdiakova 2014; Labelle and Lemmer 2019; Valdivia et al. 2021). Both methods represent end-of-life scenarios and are therefore important for robust decision-making processes regarding environmental and climate protection measures. For Roundwood, this is a realistic target now (Linkosalmi et al. 2020). The cradle-to-grave approach makes sense for wood utilization, although individual processes within the utilization cascade also deserve scrutiny. Even though LCA has been in use since the 1960s, gaps still exist concerning the forestry and the timber industry. Therefore, holistic analyses are lacking on the scope of the system boundaries from regeneration in the stand to energetic use at the end of life. Most studies related to the forest-wood cluster have a clear focus on CO2-neutrality and environmental impact assessment (Klein et al. 2015; Linkosalmi et al. 2020). Forest operations are interventions in forest ecosystems with the goal of management. They include forest road construction, preparation, and planting, thinning, and timber harvesting (Athanassiadis 2000). Sustainable Forest Operations (SFO) can be seen as a special part of an SIA. SFO focuses on minimizing negative impacts caused by timber harvesting on the environment and employees, supporting positive benefits for the society, optimizing production and economics, and in particular, not compromising the use of timber as a resource for future generations (Marchi et al. 2018). This also explicitly refers to low-emission technologies to reduce greenhouse gases (GHG) from timber supply (Marchi et al. 2018).
In this field, Linkosalmi et al. (2020) addressed the whole value chain (cradle-to-grave) in a literature review. The study based its proposal for a timber LCA on DIN EN 15804 (2019), which classifies the LCA into A 1–3 production, A 4–5 installation, B supply and use, C final recovery, and D recycling outside the system boundaries. The pure production phase summarizes the wood supply up to the forest road in A1. This is followed by transportation (A2), production at the mill (A3), transportation to installation (A4), and installation/assembly (A5). The utilization phase includes the period of use and type of use, repairs, renovation, maintenance, replacement, water consumption, and energy consumption (B1–B7).The final recycling represents the end of the product/structure and includes demolition/destruction, transportation, waste recycling, and finally, landfilling (C1–4). The recycling phase describes the elusive benefits and positive impacts of cascade use (D). The authors also focus on the refinement of timber, its use over its lifetime, and finally, the recycling phase or final energy use (Eliasson et al. 2021; Strubergs et al. 2021). In the model of Linkosalmi et al. (2020), our observation horizon is in phases A1 and A2.
Klein et al. (2015) designated six process groups based on an extensive literature review and found that there is no standardized chain of custody for forest (cradle-to-gate) processes. Group 1 includes all secondary processes (action planning, mechanical engineering, road construction, machine transportation, personnel, and machine accommodation, seedling production, seedling transportation, fuel, and other inputs). Group 2 comprises the preparation of the stand establishment. Group 3 represents the maintenance of the stand after establishment (fence construction, fertilizer, irrigation, and use of plant protection products). Only in group 4 are all silvicultural measures summarized (planting, young stand maintenance, pruning, thinning, harvesting, backing, and assortment). Timber supply at the forest road marks a break in the value chain. Although this break should not be there in a continuous chain of custody, it represents a change of ownership, as does the mill entry of the timber. Subsequent groups 5 and 6 include logistics and chipping. Klein et al. (2015) studied traditional wood supply to the mill (cradle-to-gate), thus considering raw material supply. In the model of Klein et al. (2015), our observation horizon is in groups 4 and 5, although not all processes described in group 4 are represented.
2.2 Degree of mechanization and functional unit timber
The timber harvesting process is generally divided into the activity groups of (1) tree felling, (2) processing, and (3) extraction of logs. The degree of mechanization describes how the activities are performed, namely manual/motor-manual or mechanized (Erler 2000). For (fully) manual, (fully) motor-manual, partly motor-manual, and partly mechanized harvesting processes, only a few studies on CO2 emission exist, with data suitable for this study (Willems 2015; Erler et al. 2020). In contrast, fully mechanized harvesting systems were intensively studied within the last decade and provide suitable data via the CAN-Bus and the StanForD interface (standard for forest machine data and communication) (Skogforsk 2021). According to DIN ISO 6814 (2016), the following machines are permissible for work in highly mechanized timber harvesting: (i) feller-buncher that only cuts down trees and assigns them to bunches; (ii) harvesters that are self-propelled, capable of felling, delimbing, and bucking; (iii) forwarders that carry logs/trees fully suspended; (iv) skidders, mostly equipped with a grapple or clambunk that drags parts of trees or whole trees behind the machine (sometimes caterpillars perform the same work); (v) yarders that extract trees with ropes and, with the appropriate setup, can also process them; (vi) stroke-delimbers that delimb the branches from the trunk; (vii) feller-forwarders (harwarder), which cut down trees and can move them in a carrying manner (Morat et al. 1998; Berendt et al. 2020; Erler et al. 2020; KWF 2023). The machines used should be able to provide StanForD-enabled data sets in the form of production and machine performance reports. This study focuses on a system of harvester and forwarder, well known as the Cut-to-Length harvesting system (CTL) (Fig. 1). In each case, trucks are required for log transportation, regardless of the process.
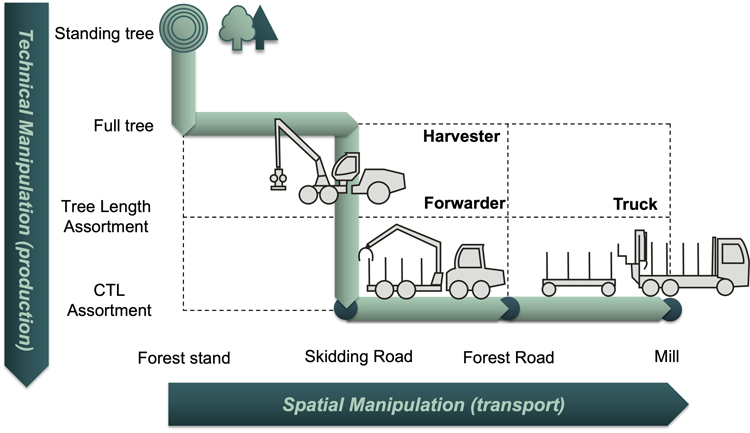
Fig. 1. Functions of fully mechanized timber harvesting (CTL) with harvester, forwarder, and truck from standing tree to assortment (Y-axis, condition of timber, and technical manipulation) and from forest stand to sawmill (X-axis, location of timber, and spatial manipulation). The functiogram shows the technical and spatial manipulation of the timber in the supply process according to the KWF templates (KWF 2019).
ISO 14040 (2009) describes the functional unit (FU) as the “quantified performance of a product system for use as a reference unit”. It represents a significant part of an LCA. The FU is a reference according to which all data and calculations are oriented. It ensures that all values within a system have a fixed reference point that remains constant (Perez et al. 2024).
In a functional unit, 12 variants are commonly used. These can be clustered into dimension, area, time, mass, and energy. The units for dimension are m3 u.b. (under bark), m3 o.b. (over bark); those for area are ha or m2. Those for time are h, specifically pmh0 (productive machine hour, which describes the time of productivity for mechanized timber harvesting vis-a-vis times of downtime) (Yoshimura et al. 2023), year, or day. The units for mass are toven dry, tcarbon and those for energy content are MWh and MJ (megawatt hour and megajoule). The most meaningful functional units are m3 o.b. and m3 u.b. for wood supply. The unit is used in the entire value chain at a rate of 61% (Puettmann et al. 2013; Klein et al. 2015; Cosola et al. 2016; Klein et al. 2016; Labelle and Lemmer 2019). 1 m3 of timber can also be used as a default unit, according to ISO 14044 (2006) and ISO 14067 (2018). CO2 emissions have been projected as kg CO2 m–3 to the functional unit. Accordingly, the output quantity is kg CO2 per cubic meter (kg CO2 m–3) (Labelle and Lemmer 2019). The output unit also includes the other GHGs as CO2 equivalents. However, the focus of our study is not the individual GHGs, which is why they have been grouped together. For better readability, the addition “eq.” (equivalent) is omitted.
2.3 Harvester and forwarder data
Modern forest machines equipped with full onboard computers (OBC) generate StanForD-compliant data about machine performance and from the harvesting process (Skogforsk 2021; Woo et al. 2021). Besides others, diesel consumption is documented by OBC automatically, enabling a correlated analysis of the CO2 emissions during the harvesting process and, therefore, of the CO2 emissions per harvested cubic meter of timber (Dias et al. 2007).
Developed in the 1980s for forestry machines, StanForD has been continuously improved and used by all relevant manufacturers. In 2010, the latest version was published in .xml format, allowing more detailed management and analysis of the machine data (Kemmerer and Labelle 2021; Skogforsk 2021). This enables specific training of the operator skills (Strubergs et al. 2021), contributes to lower harvesting costs, and can potentially increase machine productivity (Roth 2016). The StanForD data packages can be divided into two categories: (i) instructions to the machine and its operator and (ii) production reports from the machine. Instructions provide the harvester with information about the assortments to be harvested (product instruction–pin, object instruction–oin, species group instruction–spi) and about site conditions (object geographical instruction–ogi). The forwarder, on the other hand, receives instructions about which assortments to move where (forwarding object instruction–foi) (Skogforsk 2021).
StanForD also allows the retrieval of production reports. The most important production reports, which are also used in this work, are harvested production–hpr and forwarded production–fpr. The graphical representation of the reports is done through a GIS layer, the object geographical report–ogr. The production reports contain the assortment, log length, log diameter, individual log number, tree species, GPS-position, process type, and resource consumption (Arlinger 2014; Skogforsk 2021). To obtain more detailed information about the individual log, the production individual files .pri are used, which contain data about the individual tree, the associated log pieces, the diameter measured every 10 cm, volume, log classification, stem identification number, and sales length. In case the .pri data are used, the allocation of the input consumption to the assortment would be possible and even traceable to the stump, provided the harvester is equipped with GPS (Woo et al. 2021). Other positive aspects of using data are responding to the challenges of climate change, supporting forestry digitization, addressing calamities, optimizing the bucking process, and increasing overall productivity (Kärhä et al. 2017; Kemmerer and Labelle 2021). Besides the advantages of using StanForD data, which are mainly expressed in the data quality, the high degree of automation, and the potential to better understand machine performance and the harvesting process, StanForD is also faced with challenges. Data acquisition is possible only when the harvester head is connected to a controller embedded in the OBC. The data are not provided in a human-readable format and require manufacturer-specific software to view or interpret (Woo et al. 2021). Automated reading of the data is not guaranteed due to the different versions of the standard. Therefore, interfaces may have to be programmed or data to be transferred into specific databases (Purfürst and Erler 2011). The results from measuring the timber with the harvester head must be calibrated and sometimes deviate from the results from the measurements at the mill entrance. Besides results differing due to varying measurement methods, errors can also be caused by lost logs, various conversion factors, failure to comply with contractual provisions, or a misunderstanding between commercial and physical volumes. These errors can make the exact determination of carbon content difficult and must be mentioned here.
2.4 System boundaries of wood supply chains and major factors determining results of SIA/LCA
Several studies have analyzed harvesting-related emissions, as shown in Table 1. However, only a limited comparison of these study results is possible because of different system boundaries within the studies and different harvesting systems, functional units, and management strategies analyzed. About 60% of the forestry-focused studies set the boundaries at the transfer of timber to the mill (Klein et al. 2015; Linkosalmi et al. 2020).
| Table 1. Summary of the relevant reviewed literature with the most significant constants for this paper. The table consists of the reviewed literature, the year of the study (not the publication date) and origin, the CO2 emissions, and the constants relevant to this paper. The literature answered heterogeneous questions and therefore produced heterogeneous results. We determined the data on total emissions, those of the harvester use and those of the forwarder use in thinning, final felling, and later thinning, for timber transport, as well as for standard processes such as loading of the timber, relocation of the machine, machine fabrication/supply and maintenance, lubricants, and transport of operator to the job. The values had to be partly converted to get our standard value kg CO2 m–3 or kg CO2 m–3 km–1 (carbon dioxide (kg) per cubic meter of wood or carbon dioxide (kg) per cubic meter of wood and driven kilometer). If no values for transport are available, they are not included in the total, i.e., they only refer to harvester and forwarder use (column 3). | |||
| Reviewed Literature | Year/Origin | CO2 Emission referred to kg CO2 m–3 | Constants of Interest referred to kg CO2 m–3 |
| Kühmaier (2022) | 2018/Austria | Total: 25.63 Harvester: 3.4 Forwarder: 3.7 Truck Transport: 0.02695 km–1 Railway Transport: 0.00939 km–1 | Transport of Machine: 0.013 Lubricants: 0.118 Transport of Operator: 0.079 |
| Karjalainen (1996) | 1996/Finland | No Total Harvester (thinning): 3.896 Harvester (final felling): 1.857 Forwarder (thinning): 1.918 Forwarder (final felling): 1.423 Truck Transport: 0.0303 km–1 Railway Transport: 0.0187 km–1 Waterway Transport: 0.0149 km–1 | |
| Lijewski (2017) | 2017/Poland | No Total Harvester (final felling): 2.112 Forwarder: 1.505 Truck Transport: 0.0616 km–1 | |
| Klvac (2013) | 2011/Czech | Total (final felling): 12.3 Truck Transport: 0.131 km–1 | |
| Puettmann (2013) | 2011/USA | Total (final felling): 14.5 | Lubricants: 0.077 |
| Dias (2007) | 2000/Portugal | No Total Harvester (final felling): 2.315 Forwarder (final felling): 2.431 | Loading Truck: 0.386 |
| Labelle (2019) | 2018/Germany | Total (only thinning): 3.962 Harvester: 1.325 Forwarder: 1.853 | Lubricants (Harvester): 0.0197 Lubricants (Forwarder): 0.0112 for AdBlue, Grease, Oil |
| Haavikko (2022) | 2016/Finland | Total (average): 4.259 Total (final felling): 3.14 Total (thinning): 5.274 Harvester (later thinning): 1.151 Harvester (final felling): 0.893 Forwarder (later thinning): 0.771 Forwarder (final felling): 0.846 | Relocation of Machine: 0.325 |
| Zhang (2016) | 2009/USA | Total (average): 6.994 Total (clear cut): 5.7 Total (selective cut): 8.2875 | Machine fabrication/supply/maintenance: 0.112 |
| Handler (2014) | 2009/USA | Total (average): 15.35 Total (clear cut): 12.3 Total (selective cut): 18.4 Truck Transport: 0.03625 km–1 Railway Transport: 0.00825 km–1 | Machine fabrication/supply/ maintenance: 0.5375 Loading Truck: 0.9625 |
| Kärhä (2022) | 2020/Finland | Total (average): 4.46 Total (final felling): 3.64 Total (thinning): 6.23 Harvester (thinning): 3.96 Harvester (final felling):2.06 Forwarder (thinning): 2.27 Forwarder (final felling):1.58 | Transport of Operator: 0.3705 Relocation of Machine: 0.3249 |
Depending on the focus of the study, system boundaries were typically set from the beginning of tree felling to log stacking along the roadside (Dias et al. 2007; Zhang et al. 2016; Labelle and Lemmer 2019; Kärhä et al. 2023a). However, none of the studies included operational planning, such as stand preparation or cruising for stand selection. Only a few studies included transportation in the analysis (Karjalainen and Asikainen 1996; Klvač et al. 2013; Puettmann et al. 2013; Handler et al. 2014; Lijewski et al. 2017; Kühmaier et al. 2022), which is often related to unknown transportation time planning. CO2 emissions significantly increase when transportation is included in the analysis (Handler et al. 2014). Generally, more than half of the emissions along the wood supply chain can be allocated to wood transport. For example, Karjalainen and Asikainen (1996) determined the CO2 emissions of harvesting systems in Finland in 1993, which amounted to 8% of the carbon stored in the provided timber. A major part of these emissions is caused by the transport of the logs to the mill (57%), followed by log extraction (18%), and tree felling including processing (13%). How the timber is transported also has an impact. Transport by ship emits the least CO2, followed by rail transport. Most emissions are during truck transport (Karjalainen and Asikainen 1996; Kühmaier et al. 2022; Kärhä et al. 2023b).
The selected silviculture management system gains great influence on the specific emissions, especially between thinning operations and final cuts, where the harvesting-related emissions are about twice as much in thinning, compared to final felling (Haavikko et al. 2022; Karjalainen and Asikainen 1996; Kärhä et al. 2023). This also includes the tree species to be harvested, as Dias et al. (2007) pointed out when comparing cuts in pine plantations and eucalyptus plantations.
The influences on CO2 emissions due to the choice of harvesting systems (and the technology used) mainly concern the degree of mechanization (the motor-manual, the semi-mechanized, and fully-mechanized systems) (Dias et al. 2007; Labelle and Lemmer 2019; Kühmaier et al. 2022), which depends primarily on the adapted use of technology for the job. For example, Labelle and Lemmer (2019) revealed figures of 3.412 kg CO2 m–3 o.b. for manual harvesting, 2.937 kg CO2 m–3 o.b. for semi-mechanized harvesting, and 1.598 kg CO2 m–3 o.b. for highly mechanized harvesting, making fully mechanized harvesting the most efficient type, although it consumes the highest amount of diesel. Semi-mechanized harvesting has a lower CO2 potential in thinning and over the full rotation. Kühmaier et al. (2022) identified the combination of chainsaw and tractor in the manual process as the most climate-friendly, although the productivity was several times lower than in highly mechanized harvest.
3 Materials and methods
A strong engagement of stakeholders in this study was realized by a two-day workshop with the representatives of Hohenloher Spezial-Maschinenbau GmbH & Co. KG (HSM), Komatsu Forest GmbH, NUHN GmbH & Co. KG for John Deere and WAHLERS Forsttechnik GmbH and Co. KG for Ponnsse. Additionally, representatives of the state forestry administrations were involved in the workshop, in which the system boundaries were set between the standing tree and the mill entrance. The reference unit for all calculations was kg CO2 m–3 o.b. The reference volume was the harvested timber of the cut, not considering unused assortments (branches, slash material, stumpage, etc.). Data of the harvested timber were assessed from the harvester OBC. From the theoretical stored carbon within the harvested timber, all manipulation activities that consume energy, such as harvesting by harvesters, log extraction by forwarders, and transportation by trucks, were logically subtracted.
The wood density of the timber is required to calculate the species-specific carbon content. This indicates how much kiln-dried timber is contained in 1 m3 of freshly cut timber. The timber properties of the tree species provided by Wagenführ and Wagenführ (2003) and Lohmann and Blosen (2021) are kiln density (d0) and total shrinkage of the volume (sV), which result in the species-specific wood density of fiber-saturated timber (dfs), as shown in Eq. 1 (Lohmann and Blosen 2003; Wagenführ and Wagenführ 2021). Since it was not possible to monitor the moisture content of the wood during the study, we assumed that the timber was fiber-saturated. The amount of CO2 accumulated in the supplied timber was calculated by multiplying the tree species-specific wood density by the carbon content of timber at 51.9%, and the factor for converting carbon(C) to CO2 (3.67 or 44/2, which corresponds to the molar mass of CO2 vis-a-vis carbon) (see Eq. 2 and Eq. 3) (Lohmann and Blosen 2003; Kollmann 2013; Bloche-Daub et al. 2016; Scholz et al. 2018). Setting the carbon content of timber at 51.9% was as per Diestel and Weimar (2014), who suggested that the percentage is more precise. The carbon content is usually set around 50%. The possible variations depending on tree species and provenance are addressed in the discussion. We use the term carbon content to indicate the content of biogenic carbon in wood, following Lamlom and Savadige (2003). For the calculation of the carbon content of the bark, the raw density of the respective timber was used for simplification purposes and the same carbon content of the specific species (see Table 2) was assumed for the following calculations (Werner 2017; Hagauer et al. 2009).

![]()
![]()
| Table 2. Properties of the main European species of timber for calculating the carbon content in freshly cut wood. Oven dry (kiln) density with 0% moisture content in kg m–3 (d0), Total shrinkage of the volume of the raw wood during drying in % (sV); wood density of fiber-saturated timber in kg m–3 (dfs), carbon content of timber in kg m–3 (C). For the calculation of the specific carbon content (C), a carbon content of 51.9% was assumed. CO2 is obtained by multiplying the specific carbon content of the tree species by the carbon-to-carbon dioxide conversion factor of 3.67. Other deciduous trees include Acer, Pyrus communis, Castanea sativa, Alnus, Fraxinus excelsior, Prunus avium, Tilia, Juglans, Robinia pseudoacacia. Other conifers include Tsuga, and Pinus strobus/radiata. | |||||
| Tree species | Kiln density (Wagenführ and Wagenführ 2021; Lohmann and Blosen 2003) kg m–3 (d0) | Total shrinkage (Wagenführ and Wagenführ 2021; Lohmann and Blosen 2003) % (sV) | Wood density fiber-saturated kg m–3 (dfs) | Carbon content kg m–3 (C) | CO2 content kg m–3 (CO2) |
| Conifer | |||||
| Other conifers | 200 (Diestel and Weimar 2014) | 734 | |||
| Pseudotsuga menziesii | 470 | 11.9 | 414.07 | 275 | 788.692 |
| Picea abies | 430 | 11.8 | 379.26 | 197 | 722.388 |
| Pinus sylvestris | 490 | 11.8 | 432.18 | 224 | 823.186 |
| Abies alba | 410 | 10.85 | 365.515 | 190 | 696.207 |
| Larix decidua | 550 | 13.2 | 477.4 | 248 | 909.318 |
| Deciduous | |||||
| Other deciduous | 275 (Diestel and Weimar 2014) | 1009.25 | |||
| Fagus sylvatica | 680 | 17.9 | 558.28 | 290 | 1063.373 |
| Quercus robur | 650 | 14.1 | 558.35 | 290 | 1063.506 |
| Betula pendula | 610 | 13.95 | 524.905 | 272 | 999.802 |
| Populus nigra | 410 | 12.5 | 358.75 | 186 | 683.322 |
The example of Pseudotsuga menziesii (Mirb.) Franco (Douglas fir) (Missouri Botanical Garden 2024) is used here to show how the specific carbon content, or the CO2 stored in it, was calculated. The shrinkage rate, which is 11.9% for Douglas fir, is subtracted from the kiln density, which is 470 kg m–3. This results in a wood density in fiber-saturated wood of 414.07 kg m–3. This, in turn, is multiplied by the carbon content of the wood (51.9%), resulting in an approximate value for the carbon content of 214.9 kg CO2 m–3. If this is now converted with the factor of carbon to CO2 (3.67), the result is 788.7 kg CO2 m–3 for Douglas fir. For Picea abies (L.) H. Karst. (Norway spruce) (Missouri Botanical Garden 2024), this is 722.39 kg CO2 m–3 (Table 2). The taxonomic nomenclature is based on Tropicos (Missouri Botanical Garden 2024).
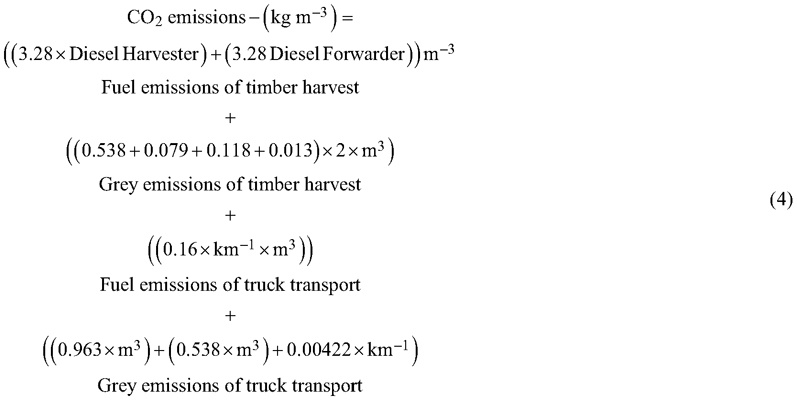
The CO2 emissions from timber harvesting result from the combination of real variable data from forestry machines (.hpr and .mom of the harvester and .mom of the forwarder) and constant parameters (constants) from averaged values that are difficult to determine from real data, as displayed in Table 3. As can be seen from equation 4, the diesel consumption of the harvester and forwarder (from .mom, in l) is first added, divided by the amount of wood (from .hpr, in m3), and multiplied by the conversion factor (diesel to CO2, 3.28 kg CO2 l–1) to calculate the emissions by fuel combustion (Handler et al. 2014). The constants for fabrication, supply, and maintenance (0.538 kg CO2 m–3) (Handler et al. 2014), for lubricants (0.118 kg CO2 m–3), transport of the machine to stand (0.013 kg CO2 m–3), and transport of the operator to the operation (0.079 kg CO2 m–3) (Kühmaier et al. 2022) are added to this to calculate the grey emissions. Generally, grey emissions are defined as the form of emissions required for the production and provision of goods or services (Paschotta 2023). Here, in particular, we refer to emissions not directly measurable in the form of diesel consumption as grey emissions. The values are included twice in the equation as they are used for forwarders and harvesters. The emissions of fuel combustion and grey emissions from timber logistics are added to this. These result from the distance traveled (km) multiplied by the constant for emissions from diesel consumption (0.16 per km and m3) (Klvac et al. 2013) and the amount of wood transported, added to the product of the quantum of wood transported and the constants for loading (0.963 kg CO2 m–3) and fabrication, supply and maintenance of the machine (0.538 kg CO2 m–3), again, added to the product of the distance traveled and the constant for lubricants (0.00422 kg CO2 m–3) (Handler et al. 2014).
| Table 3. Constants taken from the literature are divided into two operations – harvesting (forwarder and harvester) and timber transport. The parameters to be used in the calculation are either variables such as the data from the forestry machine on diesel consumption, kilometers driven, and timber volume, or constants. The constants refer either to kg CO2 m–3 (carbon dioxide (kg) per cubic meter of wood and driven kilometer) for distances traveled in timber transport or to kg CO2 m–3 (carbon dioxide (kg) per cubic meter of wood) related to volumes of timber provided. For harvesters or forwarders, the constants are transport to stand, lubricants, transport of operators, and fabrication, supply, and maintenance apply. The constants must be considered twice in the calculation, as they apply to both harvesters and forwarders. For timber transport by truck, the constants are lubricants, loading and fabrication, supply, and maintenance. For transport by ship or train, again constants apply. | |||
| Operation and machine | Source of emission | Parameter | Parameter value (CO2) |
| Harvesting/Forwarding (Harvester or Forwarder) | Fuel (Diesel) | Variable | 3.28 kg l–1 (Handler et al. 2014) |
| Volume | Variable | m3 | |
| Transport to stand | Constant | 0.013 kg m–3 (Kühmaier et al. 2022) | |
| Lubricants | Constant | 0.118 kg m–3 (Kühmaier et al. 2022) | |
| Transport of operator | Constant | 0.079 kg m–3 (Kühmaier et al. 2022) | |
| Fabrication, supply, and maintenance | Constant | 0.538 kg m–3 (Handler et al. 2014) | |
| Transportation truck | Kilometers | Variable | km |
| Volume | Variable | m3 | |
| Fuel (Diesel) | Constant | 0.16 kg m–3 km–1 (Klvač et al. 2013) | |
| Lubricants | Constant | 0.00422 kg km–1 (Handler et al. 2014) | |
| Loading | Constant | 0.963 kg m–3 (Handler et al. 2014) | |
| Fabrication, supply, and maintenance | Constant | 0.538 kg m–3 (Handler et al. 2014) | |
| Transportation ship | Waterway (total) | Constant | 0.0153 kg m–3 km–1 (Karjalainen and Asikainen 1996) |
| Transportation train | Railway (total) | Constant | 0.0193 kg m–3 km–1 (Karjalainen and Asikainen 1996) |
The combination of variable parameters and constant parameters is because some data are easy to determine while others are not. The data that are easy to determine are managed as variables. The data that are difficult or impossible to determine are managed as constants. By combining them, the calculated value of CO2 emissions comes very close to reality. The constants were selected from a comprehensive literature review of common methods for determining CO2 emissions in timber harvesting, as detailed in Chapter 2.4. For a detailed summary, please see Table 1. The input values listed in Table 3 include variables that come directly from the forest machines OBC in the form of StanForD files and constants that are in turn derived from the literature analysis in Chapter 2.4. In case of doubt, the parameters that are geographically and procedurally closer to the German forestry are selected, if more than one would have been suitable. Moreover, in case of doubt, the more conservative parameter is selected. One reason for the choice of these parameters is that they contain CO2 and roughly the same CO2-equivalent GHGs. The specific conversion factor for CO2 emissions from diesel combustion was set at 3.28 kg l–1 and the corresponding value for lubricant combustion at 4.22 kg l–1 (Handler et al. 2014), which also included the CO2-equivalent GHGs. The other GHGs cover methane, nitrous oxide, carbon monoxide, nitrogen oxide, and volatile non-methane carbon compounds. Combining CO2 and other GHGs as CO2-equivalents follows the Intergovernmental Panel on Climate Change (IPCC) guidelines (Solomon et al. 2007). The calculation of CO2 equivalents instead of just CO2 increases the output value marginally. We have not differentiated between the individual GHGs in the presentation of results.
The case study was conducted in Rhineland-Palatinate (DE) with a CTL harvesting system.
The cut was performed in the Hermeskeil forestry office near the Hunsrück National Park. The studied stand was a 60-year-old homogeneous spruce stand. Trees had an average diameter of 35 cm o.b. All trees were affected by bark beetle infestation in 2022. Consequently, the area was clear-cut and prepared for next-generation planting. Two machines from Komatsu Forest were investigated during the study. The Komatsu Harvester 931 XC single-grip harvester is a powerful, stable, and all-terrain 8-wheel machine for felling, delimbing, and bucking coniferous wood under simple-to-difficult terrain conditions (Komatsu Forest 2022b). The harvester was equipped with a C93 harvester head with the best fit for tree diameter at a breast height of 20 to 40 cm. The Komatsu Forwarder 845 is designed for all-round use in thinning and a lighter final harvest with a payload of 12 t; it has a mid-range for moving timber in lengths of 2 to 6 m under easy-to-difficult terrain conditions (Komatsu Forest 2022a). Both machines were equipped with Komatsu MaxiFleet interlogistics software, which provided production reports during the entire study (Kivilinna-Korhola 2016; Komatsu Forest 2018). The harvested volume with and without bark, the tree species, and the diesel consumption were sourced from the production reports, along with the descriptive machine statistics. For the harvesting operations, the existing skidding road system (20 m) was used and no motor-manual support was necessary. The edge trees along the public road were felled with the harvester during a road closure and were processed immediately.
4 Results
4.1 Emissions of timber supply – a case study
The cut included 955.5 m3 o.b. of spruce wood (848.79 m3 u.b.) for five different assortments, namely 5 m sawlogs, 2.5 m industrial logs, 3 m pulp/paper logs, 3 m butt log pieces, and 2.4 m logs for pallets (see Table 4). Sixty-five percent of the total harvested volume was 5 m sawlogs, 18.2% 2.5 m industrial logs, 2% 3 m logs for pulp/paper, 14% 3 m butt log pieces, and only 0.8% was 2.4 m logs for pallets. The harvester consumed 369 l diesel in 22 pmh0, in which it drove 14 km. The forwarder drove 47 km in 38 pmh0, consuming 353 l diesel. The mean distance to sawmills by truck, adjusted for assortments, was 103 km.
| Table 4. Input variables derived from the test cut divided into the accrued assortments of the total volume of timber in m3 over bark (o.b.) and under bark (u.b.), total diesel consumption of harvester and forwarder in liters o.b. and u.b., distance to the sawmill and the proportions of the assortments in the total volume of timber. | ||||
| Assortment | Volume (m3) o.b. / u.b. | Diesel consumption of harvester and forwarder combined (l) o.b. / u.b. | Distance to mill (km) | Share of total quantity (%) |
| 5.0 m sawlogs | 601.4 / 533.1 | 470 / 468.7 | 30 | 65 |
| 2.5 m industrial logs | 168.2 / 149.4 | 131.4 / 131.4 | 108 | 18.2 |
| 3.0 m pulp/paper logs | 19.1 /16.8 | 14.9 / 14.8 | 165 | 2 |
| 3.0 m butt log pieces | 127.8 / 115.2 | 100 / 101.3 | 172 | 14 |
| 2.4 m logs for pallets | 7.4 /6.7 | 5.8 / 5.9 | 117 | 0.8 |
The total diesel consumption and the kilometers traveled in transport to the sawmill were distributed proportionally among the assortments so that in combination with the constants and the harvested volumes, an assortment-specific determination of the CO2 m–3 could be obtained.
As shown in detail in Table 5, the calculation results in CO2 emissions for the entire wood supply chain ranged from 10.5 kg CO2 m–3 o.b. (5 m sawlogs) to 33.8 kg CO2 m–3 o.b. (3 m butt log pieces). The highest amount of CO2 emitted corresponded logically with the volume harvested per assortment. For the 5 m sawlogs, a total of 5.9 t CO2 for 601.4 m3 was calculated. This compares with a carbon storage of 434.4 t CO2 for the same assortment. For the 5 m sawlogs, the calculated CO2 emissions meant a reduction in the carbon storage capacity of the provided timber from 722.4 kg CO2 m–3 o.b. to 711.9 kg CO2 m–3 o.b. This represents a reduction of 1.47% in carbon storage capacity.
| Table 5. Results of the calculations to determine the CO2 emissions for the individual assortments from the timber transport, timber harvesting with the harvester, and transport with the forwarder, each in kg CO2 m–3 (carbon dioxide (kg) per cubic meter of wood) over bark (o.b.) and under bark (u.b.). In the case of timber transport, the distances covered individually are already included. Columns 5 and 6 summarize the CO2 emissions. In column 5 per m3 and column 6 over for the total amount per assortment. Column 7 shows the total amount of CO2 stored in the provided timber for each assortment in tons. | |||||||||||
| Assortment/ Emissions | Truck CO2 | Harvester CO2 | Forwarder CO2 | Truck/Harvester/Forwarder CO2 | Total CO2 | Total C-Storage CO2 | |||||
| kg m–3 u.b./o.b. | kg m–3 o.b. | kg m–3 u.b. | kg m–3 o.b. | kg m–3 u.b. | kg m–3 o.b. | kg m–3 u.b. | t o.b. | t u.b. | t o.b. | t u.b. | |
| 5.0 m sawlogs | 6.4 | 2.058 | 2.221 | 2 | 2.161 | 10.5 | 10.8 | 5.906 | 5.406 | 434.4 | 385.1 |
| 2.5 m industrial logs | 19.24 | 23.3 | 23.6 | 3.751 | 3.380 | 121.5 | 107.9 | ||||
| 3.0 m pulp/paper logs | 28.6 | 32.6 | 33.0 | 0.601 | 0.534 | 13.8 | 12.1 | ||||
| 3.0 m butt log pieces | 29.75 | 33.8 | 34.1 | 4.159 | 3.787 | 92.3 | 83.2 | ||||
| 2.4 m logs for pallets | 20.71 | 24.8 | 25.1 | 0.177 | 0.161 | 5.4 | 4.8 | ||||
| Mean | 20.9 | 2.058 | 2.221 | 2 | 2.161 | 25 | 27.32 | - | - | - | - |
The main result is the methodology applicable for determining the net carbon storage of the timber provided, which is demonstrated here in the findings of the practical application:
The percentage value of the reduction differs greatly between the assortments in some cases. It ranges from 1.47% for the 5 m sawlogs up to 4.9% for the 3 m butt log pieces (Table 6). Across all assortments, and thus across all distances to mills, the reduction in carbon storage in the provided timber averaged 2.19% for timber o.b. and 2.24% u.b.
| Table 6. Net carbon storage of the supplied timber by assortment. Thus, it is a value derived from the CO2 stored in the timber minus the CO2 emitted during timber supply. Net carbon storage is given as an absolute value in kg CO2 m–3 (carbon dioxide (kg) per cubic meter of wood) over bark (o.b.) and under bark (u.b.). The rate by which carbon storage must be reduced is given here as %. | ||||
| Assortment | C-Storage | C-Storage reduction rate | ||
| kg CO2 m–3 reduced by CO2 o.b. | kg CO2 m–3 reduced by CO2 u.b. | % o.b. | % u.b. | |
| 5 m Sections | 711.9 | 711.0 | 1.47 | 1.51 |
| 2.5 m Industrial | 699.1 | 689.8 | 3.33 | 3.38 |
| 3 m Paper | 689.7 | 689.4 | 4.73 | 4.78 |
| 3 m Butt log pieces | 688.6 | 688.3 | 4.90 | 5.00 |
| 2.4 m Palette | 697.6 | 697.3 | 3.50 | 3.60 |
| On Average | 2.19 | 2.24 | ||
5 Discussion
The quality of the calculated CO2 emissions per harvested cubic meter of wood strongly depends on the accurate calibration of the harvester head measurement unit. Initially, harvester head measurement aimed to provide productivity data and information on machine performance, rather than precise calculation of stem volumes (Kemmerer and Labelle 2021). With continuous development, the harvester volume calculation is of sufficient accuracy in most cases and no differences exist between productivity models based on harvester data and those based on time and motion study data (Brown et al. 2011; Bembenek et al. 2015; Mederski et al. 2018). The accuracy of harvester data (harvested volume and fuel consumption) provided in the StanForD format appears sufficient for a practicable assessment of the carbon footprint of specific wood products. When georeferencing is applied additionally, it offers great potential for operation planning and allocation of efforts (e.g., fuel and time consumption) to specific logs or wood products. The only drawback is that harvest data are not available in real-time now (Kemmerer and Labelle 2021). The same applies to fuel consumption data for transportation, which can be easily read out via CAN bus. Their accuracy was reported as ±5%, with possible improvements in data quality (Marx et al. 2015).
In this study, we considered only CO2 (including CO2 equivalent GHGs in the constants) from fuel consumption, though aware that further gases are released into the atmosphere through forest operations and transportation (Karjalainen and Asikainen 1996; Athanassiadis 2000; Lijewski et al. 2017). This system boundary to focus exclusively on CO2 emissions was defined due to the primary objective of examining the contribution of forest operations to the carbon footprint of wood products. For the same reason, we set the system boundaries between the felling of the standing tree and the mill gate of the industry. Within these narrow boundaries, CO2 emissions are comprehensively represented. Further operations, such as planting, road construction, or thinning, performed within the tree’s lifetime were excluded as they cannot be allocated to the specific harvested logs under the management principles of continuous cover forestry. This might be different in rotation or plantation forestry, where system boundaries can be different. Even though several life cycle assessment studies on forest operations and wood products have been performed, there seems to be a stagnation in the last few years (Berg 1997; Xu and Becker 2012; Cambero et al. 2014; Klein et al. 2016; Cardellini et al. 2018; Schweier et al. 2018). Till today, standardized methods and system boundaries in the life cycle assessment of forest-wood supply chains are lacking, particularly regarding product declarations (Klein et al. 2015).
Remarkably, we did not find a standardized method to determine the carbon content in freshly harvested wood. Our calculations modeled the carbon content of round wood oriented on Diestel and Weimar (2014) and incorporated kiln dry density and total shrinkage of volume according to Lohmann and Blosen (2003). We applied mean values knowing that actual kiln dry density and total shrinkage can vary by provenance, growth area, and age (Dietz 1975). The carbon content was calculated per cubic meter of wood over bark, assuming the same kiln dry density for bark and wood, in line with Hagauer et al. (2009) and Werner (2017). However, Dietz (1975) showed that the density of the bark does not correspond to that of the timber. The same is possibly true for the carbon content of bark. Research for determining the carbon content of the bark is still needed. On the other hand, it is highly debatable whether the bark should be included in the calculation or whether a calculation based on cubic meters under bark is more realistic. Two aspects support this: (i) it is widely unknown how much bark remains in the forest/on the road due to damages by loader grapples, and (ii) whether the bark is removed in the sawmill before wood processing and used for gardening applications or combustion.
The experimental results are based on the data provided by the harvester and forwarder operating in a homogeneous stand in a final felling. This does not necessarily represent standard logging conditions in Central Europe, especially not for expected future forests. In Germany, 72% of forest operations are performed by harvester-forwarder harvesting systems, another 22% by chainsaw-skidder harvesting systems, and 6% by chainsaw-cable yarder harvesting systems (Engler et al. 2024). Generally, for thinning operations, partly mechanized harvesting systems show lower emission rates per cubic meter of harvested wood, compared to fully mechanized harvesting systems (Cosola et al. 2016; Labelle and Lemmer 2019). Only in the final felling, when the total harvested volume and the volume per tree are high, fully mechanized harvesting systems become more efficient. However, chainsaw-based operations are currently not included in CO2 emission studies from StanForD data. To roll out the application potential of machine data for the assessment of the carbon footprint for wood products, chainsaws, as well as cable yarders and skidder/tractors, need to be implemented in the StanForD data standard.
The calculations of the net carbon storage based on data from the harvester OBC and an allocation of the emissions according to the volume of the produced products seem to be a low-effort and feasible solution. The recorded volume of harvested wood and the corresponding diesel consumption are robust and provide transparent information on CO2 emissions per harvesting site under real-world conditions, used machines, and given silvicultural management objectives. As the harvesting intensity and the stem volume of trees are known to be major determinants of CO2 emissions from forestry operations (Suadicani and Talbot 2008), averages from databases, for example, only partially reflect specific conditions at the specific harvesting site. A strong correlation exists between the volume of the processed trees and the corresponding CO2 emissions, like the law of piece-size-and-volume which refers to time consumption for tree processing, while we consider the fuel consumption for tree processing, namely the CO2 emissions. The harvesting-related CO2 emissions decrease with increasing tree volume, from about 7.3 kg CO2 m–3 o.b. in a first thinning to 5.3–6.6 kg CO2 m–3 o.b. in a late thinning and to 3.1–3.6 kg CO2 m–3 o.b. in a final felling (Karjalainen and Asikainen 1996; Haavikko et al. 2022; Kärha et al. 2023).
Operational conditions, such as slope, terrain, and stand conditions, and the relocation distance of the machinery and forest infrastructure are known for their strong influence on the CO2 emissions of forest machines (Suadicani and Talbot 2008; Labelle and Lemmer 2019; Haavikko et al. 2022). Particularly for forwarders, the extraction distance, the load space capacity, the number of logs, and the log diameter are highly relevant (Klvač et al. 2013; Zhang et al. 2016; Kärhä et al. 2023).
By using real fuel consumption data from the OBC, the effects from specific machine configurations, such as tracks or wheel chains, and the age of the machine are considered, which have a strong influence on machine fuel consumption, namely CO2 emissions. This is a strong benefit of this methodology compared to standardized values from databases, which cannot reflect specific machine performance and working conditions (Cosoal et al. 2016; Kärhä et al. 2023).
Based on our study data, the influence of the transportation distance from the forest road to the sawmill becomes clearer. The log transport to the mill is arbitrary and at 83.9%, it contributes most to the overall CO2 emissions per harvested cubic meter (Fig. 2), underlining the importance of transportation in the carbon footprint of wood products. Not surprisingly, a significant positive correlation exists between transportation distance and emitted CO2. In our study, CO2 emissions for a 30 km haul were 10.5 kg CO2 m–3 o.b. and tripled for a 172 km haul from the same cut to 33.8 kg CO2 m–3 o.b. The corresponding CO2 emissions per transported kilometer can differ because of (i) a higher ratio of loading time for short transportation distances, (ii) differing fuel consumption of the trucks, and (iii) differing loading capacities of the wood trucks. The latter have a strong influence on the CO2 emissions per harvested cubic meter – even under the same gross vehicle weight limits, which vary widely within Europe, ranging from 40 t for five-axle wood trucks (the most frequent wood truck configuration in Europe) and 76 t high-capacity transport (HCT) vehicles in Finland (Busenius et al. 2015; Seuri et al. 2024). For wood trucks with only two or three axles, even lower gross vehicle weight limits exist, while at the other end, HCT timber truck combinations with a 92 t gross vehicle weight are running in Finland. Studies revealed 27% higher payloads between standard 76 t and 92 t HCT timber trucks, compared to 12–15% higher fuel consumption (64.4 l 100 km–1 vs. 70.1 l 100 km–1, respectively 72.4 l 100 km–1) (Kärhä et al. 2023). Concerning the transported mass and driven kilometer (mL tkm–1), the HCT timber truck combination with 92 t reduces fuel consumption by 8–11%, compared to 76 t HTC vehicles (Kärhä et al. 2023). The effect of declining fuel consumption per ton-kilometer against increasing payloads, namely gross vehicle weight, is non-linear; thus, it is generally lower for HTC trucks than for European standard 40-t-tucks, which was reported to be 3.3% per extra ton of gross vehicle weight for 40-t-trucks and only 1.8% for 44-t-trucks onward (Busenius et al. 2015).
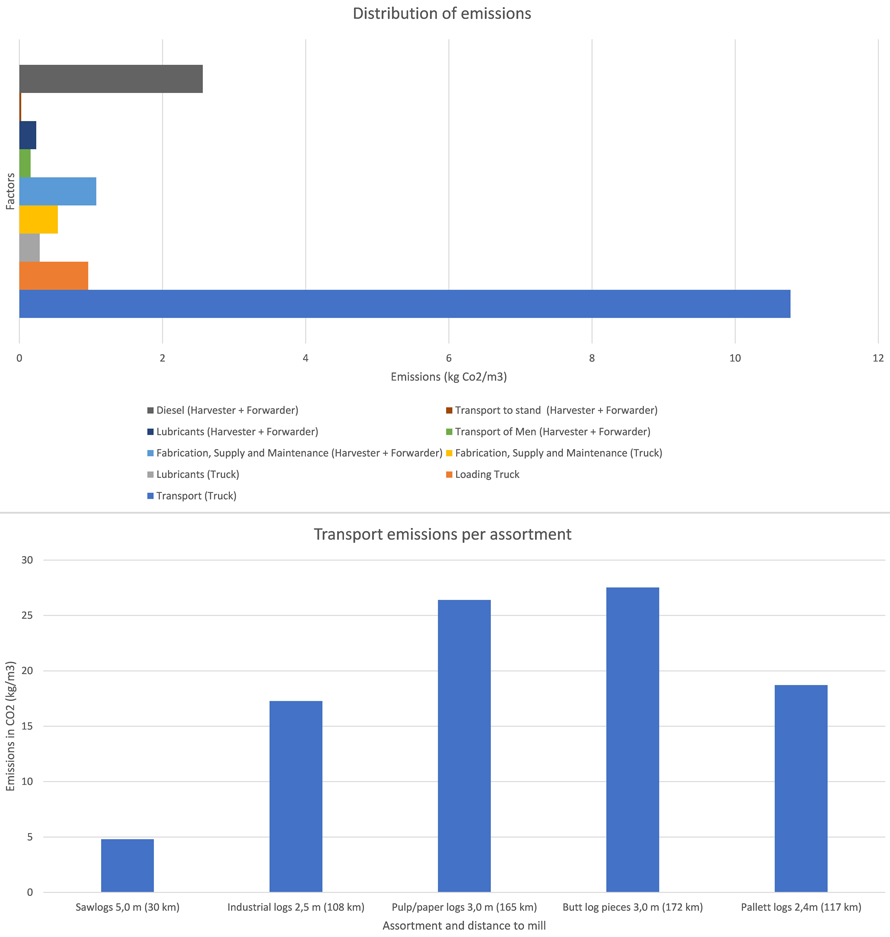
Fig. 2. Influences of the individual factors on the CO2 emissions of a cubic meter of timber in the entire fully mechanized timber supply chain. In the upper graph, all influencing factors are displayed together. In the lower graph, a special focus is placed on the CO2 emissions per assortment depending on the transport distance, to reflect the influence of the distance to mill. View larger in new window/tab.
Logically, the greatest potential to reduce the carbon footprint of wood products lies in logistic optimization, both in technology and planning aspects. Optimal routing of wood trucks could reduce transport emissions by about 10% (Smaltschinski 2010; Smaltschinski et al. 2011, 2012), while the potential from swapping transportation carriers, e.g., to trains, is limited (Timmermann and Dibdiakova 2014). The use of up-to-date navigation systems for forest roads, maintaining the quality of forest roads, and fuel-saving driving with modern timber trucks can additionally reduce CO2 emissions (Cosola et al. 2016; Kühmaier et al. 2022).
In forest operation, CO2 emission could potentially be reduced by the adequate performance of the machine operator. This has a particular influence not only on harvesting productivity but also on CO2 emissions generated by the operating machines (Strubergs et al. 2021). Generally, operator skills have a lesser impact on log extraction than on tree felling and processing performance with a harvester (Purfürst 2009). For operating the harvester, tacit knowledge, the ability to handle working elements simultaneously, skills in harvester head control, advanced planning for several trees ahead, and exact gripping and cutting, are skills required of the machine operator’. Differences in harvesting productivity between operators are up to 80%, which is directly linked to fuel consumption (Purfürst and Erler 2011). Therefore, the operator’s influence on emission reduction should be rated higher than technological improvements, even though fuel consumption of forest machines decreased over the last 30 years mainly due to technological innovations (Lijewski et al. 2017; Prinz et al. 2018). Additionally, new developments in hybrid technology for harvesters show promising results in reducing CO2 emissions (Gabriel 2019; Schweier et al. 2019). Complete decarbonization of forest operations by electric drives is yet not envisaged, but electric farm tractors already exist. In forestry, only CO2-neutral fuels will be a promising option to decarbonize forest machinery in the short run. In the study region of Rhineland-Palatinate 6.4 Mio m3 u.b. of spruce, Abies alba Mill. (silver fir) (Missouri Botanical Garden 2024), and Douglas fir were harvested in 2020 (Destatis 2021). Based on the findings of this study, this represents a carbon sequestration potential of 163 129 t CO2 stored in wood, a share of 0.5% of the total annual GHG emissions of Rhineland-Palatinate (MKUEM 2022). A more detailed breakdown of fuel consumption to individual logs would be possible based on a mean value allocated to the number of logs or by log-specific tracing. This could potentially allow a wood product-specific carbon footprint, opening the doors to new business applications.
6 Conclusions
This work contributes to a better representation of CO2 emissions and carbon contents of supplied timber in the chain of custody for timber and presents a calculation basis that can be used as a standard procedure. The results include:
• The calculation of the carbon content in freshly harvested timber,
• The determination of constants based on a literature analysis and own investigations,
• The determination of variables,
• Combining the constants and variables into a formula for calculating the net CO2 emissions of highly mechanized harvesting, and
• The determination of net carbon content in the provided timber at the mill entrance.
The heterogeneity of possible forest operations, conditions in the forests, and choice of forestry equipment defies comparability. Mapping CO2 emissions in wood supply reliably requires standardization of terminology, values of the constants, and determining which values of constants are included in the equations (Cosola et al. 2016). The present paper proposes such a standardization from values of constants of a literature review and a study on the portrayability with real wood supply measures (variables). We suggest a comprehensive study of the exact impact of factors on CO2 emissions based on the methodology developed here. For this purpose, the CO2 emissions of different forest operations have to be compared and classified according to the silvicultural system (e.g., clear cut, selective cut, bark beetle calamity, wind throws, thinning, later thinning, and final felling), the type of harvester (small, medium, and large), the type of forwarder (small, medium, and large), equipment and technology (crane tip control, fleet control systems, intralogistics, hybrid engine, thermostatic fans, dual gear, high flotation tires, tire pressure control system, and continuous track), slope, infrastructure, stand type (mixed stands and monoculture), and stand situation (visual restrictions, rejuvenation, and large boulders). We intend to address the exact influence of the individual factors in a future paper by carrying out a sensitivity analysis.
Declaration of openness of research materials, data, and code
The databases used are described and cited to the best of our knowledge and belief. The raw data from the forest machine data cannot be made available as they contain personal data and it was agreed with the owners of the data that it would not be passed on to third parties. However, the relevant data are listed in the manuscript so that the results can be reproduced. We have also provided an Excel sheet, which shows the equation and can be used for calculating: http://gofile.me/3YqDx/TlRwMlMnW.
The net CO2 storage capacity can be calculated using the following app: HarvestCO2-App – KWF 2030 (kwf-online.de)

Authors’ contributions
Alexander Kaulen (corresponding author) contributed substantially to the conception of the research question, the design of the work, and the acquisition, analysis, and interpretation of data and results. He carried out the main scientific writing of the work and the final approval of the version to be published. He is also accountable for all aspects of the work in ensuring that questions related to the accuracy or integrity of any part of the work are appropriately investigated and resolved.
Prof. Dr. Thomas Purfürst and Dr. Benjamin Engler contributed substantially to the acquisition, analysis, and interpretation of data and results. They revised it critically for sound and intellectual content, did the final approval of the version to be published, and are accountable for all aspects of the work in ensuring that questions related to the accuracy or integrity of any part of the work are appropriately investigated and resolved.
Acknowledgments
We acknowledge the contributions made by Thomas Wehner (former Komatsu Forest GmbH, now DLG e.V.), Matthias Urmes, and Tobias Witzack (both from Landesforsten Rheinland Pfalz) for providing the raw data from the forestry machines and carrying out the test cuts. We thank Norbert Remler (Bayerische Staatsforsten AöR), Dr. Dorothea Mayer, and Volker Labudda (both from Kuratorium für Waldarbeit und Forsttechnik e.V.) for their careful review.
Funding
No funding was used.
References
Achat D, Fortin M, Landmann G, Ringeval B, Augusto L (2015) Forest soil carbon is threatened by intensive biomass harvesting. Sci Rep 5, article id 15991. https://doi.org/10.1038/srep15991.
Aras U, Kalaycıoğlu H (2020) Evaluation of carbon footprint and environmental impact in wood based product. WI&E 2: 91–97.
Arlinger J (2014) StanForD. https://www.skogforsk.se/english/projects/stanford/. Accessed 24 April 2022.
Athanassiadis D (2000) Energy consumption and exhaust emissions in mechanized timber harvesting operations in Sweden. Sci Total Environ 255: 135–143. https://doi.org/10.1016/S0048-9697(00)00463-0.
Bembenek M, Mederski PS, Karaszewski Z, Łacka A, Grzywiński W, Węgiel A, Giefing DF, Erler J (2015) Length accuracy of logs from birch and aspen harvested in thinning operations. Turk J Agric For 39: 845–850. https://doi.org/10.3906/tar-1406-39.
Berendt F, Tolosana E, Hoffmann S, Alonso P, Schweier J (2020) Harvester productivity in inclined terrain with extended machine operating trail intervals: a German case study comparison of standing and bunched trees. Sustainability 12, article id 9168. https://doi.org/10.3390/su12219168.
Berg S (1997) Some aspects of LCA in the analysis of forestry operations. J Clean 5: 211–217. https://doi.org/10.1016/S0959-6526(97)00040-1.
Berndes G, Abt B, Asikainen A, Cowie A, Dale V, Egnell G, Lindner M, Marelli L, Paré D, Pingoud K and Sonia Yeh (2016) Forest biomass, carbon neutrality and climate change mitigation. Sci Public Policy 3. https://doi.org/10.36333/fs03.
Bloche-Daub K, Hartmann H, Hofbauer H, Kaltschmitt M, Pfeiffer D, Thormann L, Thrän D (2016) Einleitung und Zielsetzung. [Introduction and objectives]. In: Kaltschmitt M, Hartmann H, Hofbauer H (eds) Energie aus Biomasse [Energy from Biomass]. Springer, pp 1–76. http://hdl.handle.net/20.500.12708/29083.
Böttcher F (2021) Analyse der Prozessabhängigen Kosten der Mechanisierten Buchenaufarbeitung. [Analysis of the process-dependent costs of mechanized beech processing.] PhD, Niedersächsische Staats- und Universitätsbibliothek Göttingen.
Brand C, Briechle M, Schulz C (2023) Regionalität verbessert Kohlendioxid-Bilanz. Ergebnisse einer Untersuchung zum Einfluss des Transports auf die CO2-Bilanz verschiedener Holzprodukte. [Regionality improves carbon footprint. Results of a study on the influence of transportation on the carbon footprint of various wood products]. Holzzentralblatt 28: 473–474.
Braun M, Fritz D, Weiss P, Braschel N, Büchsenmeister R, Freudenschuß A, Gschwantner T, Jandl R, Ledermann T, Neumann M, Pölz W, Schadauer K, Schmid C, Schwarzbauer P and Stern T (2016) A holistic assessment of greenhouse gas dynamics from forests to the effects of wood products use in Austria. Carbon Manag 7: 271–283. https://doi.org/10.1080/17583004.2016.1230990.
Breton C, Blanchet P, Amor B, Beauregard R, Chang W-S (2018) Assessing the climate change impacts of biogenic carbon in buildings: a critical review of two main dynamic approaches. Sustainability 10, article id 2020. https://doi.org/10.3390/su10062020.
Brewer J, Talbot B, Belbo H, Ackerman P, Ackerman S (2018) A comparison of two methods of data collection for modelling productivity of harvesters: manual time study and follow-up study using on-board-computer stem records. Ann For Res 61: 109–124. https://doi.org/10.15287/afr.2018.962.
Brown M, Strandgard M, Acuna M, Walsh D, Mitchell R (2011) Improving forest operations management through applied research. Croat J For Eng 32: 471–480.
Bundesamt für Wirtschaft und Ausfuhrkontrolle (2021) Informationsblatt CO2-Faktoren. [Information sheet CO2 factors]. https://www.bafa.de/SharedDocs/Downloads/DE/Energie/eew_infoblatt_co2_faktoren_2021.pdf?__blob=publicationFile&v=5. Accessed 12 April 2024.
Buonocore E, Häyhä T, Paletto A, Franzese PP (2014) Assessing environmental costs and impacts of forestry activities: a multi-method approach to environmental accounting. Ecol Model 271: 10–20. https://doi.org/10.1016/j.ecolmodel.2013.02.008.
Burk J, Weise G (2005) Einfluss von Reifendruckregelanlagen auf den Kraftstoffverbrauch von Tragschleppern. [Influence of tire pressure control systems on the fuel consumption of towing tractors]. Forsttechnische Informationen 4: 49–53.
Busenius M, Engler B, Smaltschinski T, Opferkuch M (2015) Consequences of increasing payloads on carbon emissions – an example from the Bavaria State Forest Enterprise (BaySF). For Lett 108.
Cambero C, Sowlati T (2014) Assessment and optimization of forest biomass supply chains from economic, social and environmental perspectives – a review of literature. Renw Sust Energ Rev 36: 62–73. https://doi.org/10.1016/j.rser.2014.04.041.
Cardellini G, Valada T, Cornillier C, Vial E, Dragoi M, Goudiaby V, Mues V, Lasserre B, Gruchala A, Rørstad PK, Neumann M, Svoboda M, Sirgmets R, Näsärö O-P, Mohren F, Achten WMJ, Vranken L, Muys B (2018) EFO-LCI: a new life cycle inventory database of forestry operations in Europe. Env Man 61: 1031–1047. https://doi.org/10.1007/s00267-018-1024-7.
Chen C, Pierobon F, Zamora-Cristales R, Ganguly I, Sessions J, Eastin I (2017) Modeling the processing and transportation logistics of forest residues using life cycle assessment. J Forest 115: 86–94. https://doi.org/10.5849/jof.2016-027.
Cosola G, Grigolato S, Ackerman P, Monterotti S, Cavalli R (2016) Carbon footprint of forest operations under different management regimes. Croat J For Eng 37: 201–217.
D’amato D, Gaio M, Semenzin E (2020) A review of LCA assessments of forest-based bioeconomy products and processes under an ecosystem services perspective. Sci Total Environ 706, article id 135859. https://doi.org/10.1016/j.scitotenv.2019.135859.
Davis SC, Hessl AE, Scott CJ, Adams MB, Thomas RB (2009) Forest carbon sequestration changes in response to timber harvest. For Ecol Manag 258: 2101–2109. https://doi.org/10.1016/j.foreco.2009.08.009.
de la Fuente T, Athanassiadis D, Gonzalez-Garcia S, Nordfjell T (2017) Cradle-to-gate life cycle assessment of forest supply chains: comparison of Canadian and Swedish case studies. J Clean Prod 143: 866–881. https://doi.org/10.1016/j.jclepro.2016.12.034.
Dias AC, Arroja L (2012) Environmental impacts of eucalypt and maritime pine wood production in Portugal. J Clean Prod 37: 368–376. https://doi.org/10.1016/j.jclepro.2012.07.056.
Dias AC, Arroja L, Capela I (2007) Carbon dioxide emissions from forest operations in Portuguese eucalypt and maritime pine stands. Scand J Forest Res 22: 422–432. https://doi.org/10.1080/02827580701582692.
Diederichs SK (2015) Monitoring energy efficiency and environmental impact of the woodworking industry in Germany. Eur J Wood Wood Prod 73: 573–588. https://doi.org/10.1007/s00107-015-0934-9.
Diestel S, Weimar H (2014) Der Kohlenstoffgehalt in Holz- und Papierprodukten: Herleitung und Umrechnungsfaktoren. [The carbon content in wood and paper products: derivation and conversion factors]. Thünen Working Paper.
Dietz P (1975) Dichte und Rindengehalt von Industrieholz. [Density and bark content of industrial wood]. Holz als Roh- und Werkstoff 33: 135–141.
DIN EN 15804 (2019) Nachhaltigkeit von Bauwerken – Umweltproduktdeklarationen. [Sustainability of buildings – Environmental product declarations]. Deutsches Institut für Normung (Din e.V.), Germany, Berlin.
DIN ISO 6814 (2016) Forstmaschinen – Mobile und selbstfahrende Maschinen – Begriffe und Klassifizierung. [Machinery for forestry – Mobile and self-propelled machinery – Terms, definitions and classification]. Deutsches Institut für Normung (Din e.V.), Germany, Berlin.
Eliasson L, Grönlund Ö, Lundström H, Sonesson J (2021) Harvester and forwarder productivity and net revenues in patch cutting. Int J For Eng 32: 3–10. https://doi.org/10.1080/14942119.2020.1796433.
Eliasson L, Kärhä K, Arlinger J (2023) Fuel consumption in logging operations in Sweden. Int J For Eng 34: 366–372. https://doi.org/10.1080/14942119.2023.2229707.
EN ISO 14040 (2009) Environmental management – Life Cycle Assessment – principles and framework. European Committee for Standardization, Brussels, Belgium.
Engler B, Hartmann G, Mederski PS, Bont LG, Picchi G, Alcoverro G, Purfürst T, Schweier J (2024) Impact of forest operations in four biogeographical regions in Europe: finding the key drivers for future development. Curr For Rep 10: 1–23. https://doi.org/10.1007/s40725-024-00226-4.
Eriksson E, Gillespie AR, Gustavsson L, Langvall O, Olsson M, Sathre R, Stendahl J (2007) Integrated carbon analysis of forest management practices and wood substitution. Can J For Res 37: 671–681. https://doi.org/10.1139/X06-257.
Erler J (2000) Forsttechnik: Verfahrensbewertung. [Forestry technology: process evaluation]. Verlag Eugen Ulmer, Stuttgart.
Erler J, Knobloch C, Faber R, Grüll M, Nimz R (2020) Forsttechnische Grundlagen. [Forestry basics], 10th edition. Tharandt.
European Commission (2020) EU biodiversity strategy for 2030. Bringing nature back into our lives. Communication for the Commission to the European Parliament, the Council, the European Economic and Social Committee and the Committee of the regions.
FAO (2015) Global forest resources assessment 2015: how are the world’s forests changing? FAO, Rome.
Forest Research (2018) Forestry Statistics – Conversion factors. https://www.forestresearch.gov.uk/tools-and-resources/statistics/forestry-statistics/forestry-statistics-2018/sources/timber-2/conversion-factors/. Accessed 22 August 2022.
Forster E, Healey J, Dymond C, Newman G, Davies G, Styles D (2019) Linking construction timber carbon storage with land use and forestry management practices. IOP Conference Series: Earth and Environmental Science. IOP Publishing 323, article id 012142. https://doi.org/10.1088/1755-1315/323/1/012142.
Gabriel O (2019) Erste Zahlen zum Hybridharvester von Logset. [First figures for the hybrid harvester from Logset]. Forstpraxis. https://www.forstpraxis.de/erste-zahlen-zum-hybridharvester-von-logset-20513. Accessed 1 December 2023.
Ghaffariyan MR, Apolit R, Kuehmaier M (2015) Analysis and control of fuel consumption rates of harvesting systems: a review of international studies. Ind Prod Bull 15: 1–4.
Gustavsson L, Nguyen T, Sathre R, Tettey UYA (2021) Climate effects of forestry and substitution of concrete buildings and fossil energy. Renew Sust Energ Rev 136: article id 110435. https://doi.org/10.1016/j.rser.2020.110435.
Haavikko H, Kärhä K, Poikela A, Korvenranta M, Palander T (2022) Fuel consumption, greenhouse gas emissions, and energy efficiency of wood-harvesting operations: a case study of stora enso in Finland. Croat J For Eng 43: 79–97. https://doi.org/10.5552/crojfe.2022.1101.
Hagauer D, Lang B, Pasteiner C, Nemestothy K (2009) Empfohlene Umrechnungsfaktoren für Energieholzsortimente. [Recommended conversion factors for energy wood assortments for wood]. Energiebilanzberechnungen. Austrian Energy Agency, Vienna, Austria.
Handler RM, Shonnard DR, Lautala P, Abbas D, Srivastava A (2014) Environmental impacts of Roundwood supply chain options in Michigan: life-cycle assessment of harvest and transport stages. J Clean Prod 76: 64–73. https://doi.org/10.1016/j.jclepro.2014.04.040.
Hauschild MZ (2018) Introduction to LCA methodology. In: Hauschild M, Rosenbaum R, Olsen S (eds) Life Cycle Assessment. Springer, pp 59–66. https://doi.org/10.1007/978-3-319-56475-3_6.
Head M, Bernier P, Levasseur A, Beauregard R, Margni M (2019) Forestry carbon budget models to improve biogenic carbon accounting in life cycle assessment. J Clean Prod 213: 289–299. https://doi.org/10.1016/j.jclepro.2018.12.122.
Hiesl P (2013) Productivity standards for whole-tree and cut-to-length harvesting systems in Maine. Electronic Theses and Dissertations 2252. https://digitalcommons.library.umaine.edu/etd/2252. Accessed 12 January 2023.
Hilf H (1967) Die Arbeitsleistung im Hauungsbetrieb (nicht veroeffentlichte Akte, Institut f. Forstliche Arbeitswissenschaft, Eberswalde, 1928). [The work performance in the forestry operation.] Speidel.
Hilf H (1941) Die Erforschung und Verbesserung der Waldarbeit: Zwei Vortraege an der Forstlichen Hochschule Stockholm. [Researching and improving forestry work: two lectures at Stockholm Forestry College]. Schaper.
Holzzentralblatt (2023) Wald der Zukunft braucht regionale Maßanzüge. [The forest of the future needs regional tailor-made suits]. Holzzentralblatt 21: 333–334.
ISO 14067 (2018) Greenhouse gases – carbon footprint of products – requirements and guidelines for quantification. International Organization for Standardization (ISO), Switzerland, Geneva.
ISO 14044 (2006) Environmental management – life cycle assessment – requirements and guidelines. International Organization for Standardization (ISO), Switzerland, Geneva.
Johnson DW, Curtis PS (2001) Effects of forest management on soil C and N storage: meta analysis. For Ecol Manag 140: 227–238. https://doi.org/10.1016/S0378-1127(00)00282-6.
Johnson E (2009) Goodbye to carbon neutral: getting biomass footprints right. Environ Impact Asses 29: 165–168. https://doi.org/10.1016/j.eiar.2008.11.002.
Johnson L, Lippke B, Oneil E (2012) Modeling biomass collection and woods processing life-cycle analysis. For Prod J 62: 258–272. https://doi.org/10.13073/FPJ-D-12-00019.1.
Johnston CMT, Radeloff VC (2019) Global mitigation potential of carbon stored in harvested wood products. Proc Natl Acad Sci USA 116: 14526–14531. https://doi.org/10.1073/pnas.1904231116.
Kärhä K, Änäkkälä J, Hakonen O, Palander T, Sorsa J-A, Räsänen T, Moilanen T (2017) Analyzing the antecedents and consequences of manual log bucking in mechanized wood harvesting. Mech Mater Sci Eng 12: 1–15. https://doi.org/10.2412/mmse.45.20.957.
Kärhä K, Haavikko H, Kääriäinen H, Palander T, Eliasson L, Roininen K (2023a) Fossil-fuel consumption and CO2eq emissions of cut-to-length industrial roundwood logging operations in Finland. Eur J For Res 142: 1–17. https://doi.org/10.1007/s10342-023-01541-4.
Kärhä K, Kortelainen E, Karjalainen A, Haavikko H, Palander T (2023b) Fuel consumption of a high-capacity transport (HCT) vehicle combination for industrial roundwood hauling: a case study of laden timber truck combinations in Finland. Int J For 34: 284–293. https://doi.org/10.1080/14942119.2022.2163871.
Karjalainen T, Asikainen A (1996) Greenhouse gas emissions from the use of primary energy in forest operations and long-distance transportation of timber in Finland. Forestry: Int J For 69: 215–228. https://doi.org/10.1093/forestry/69.3.215.
Kazulis V, Muizniece I, Zihare L, Blumberga D (2017) Carbon storage in wood products. Energy Procedia 128: 558–563. https://doi.org/10.1016/j.egypro.2017.09.009.
Kemmerer J, Labelle ER (2021) Using harvester data from on-board computers: a review of key findings, opportunities and challenges. Eur J For Res 140: 1–17. https://doi.org/10.1007/s10342-020-01313-4.
Kirby KR, Potvin C (2007) Variation in carbon storage among tree species: implications for the management of a small-scale carbon sink project. For Ecol Manag 246: 208–221. https://doi.org/10.1016/j.foreco.2007.03.072.
Kivilinna-Korhola T (2016) Fleet management ohjelmistot – Ponsse, Komatsu ja John Deere. Mikkelin ammattikorkeakoulu. https://urn.fi/URN:NBN:fi:amk-2016090113951.
Klein D, Höllerl S, Blaschke M, Schulz C (2013) The contribution of managed and unmanaged forests to climate change mitigation – a model approach at stand level for the main tree species in Bavaria. Forests 4: 43–69. https://doi.org/10.3390/f4010043.
Klein D, Wolf C, Schulz C, Weber-Blaschke G (2015) 20 years of life cycle assessment (LCA) in the forestry sector: state of the art and a methodical proposal for the LCA of forest production. Int J Life Cycle Assess 20: 556–575. https://doi.org/10.1007/s11367-015-0847-1.
Klein D, Wolf C, Schulz C, Weber-Blaschke G (2016) Environmental impacts of various biomass supply chains for the provision of raw wood in Bavaria, Germany, with focus on climate change. Sci Total Environ 539: 45–60. https://doi.org/10.1016/j.scitotenv.2015.08.087.
Klvač R, Kolařík J, Volná M, Drápela K (2013) Fuel consumption in timber haulage. Croat J For Eng 34: 229–240.
Knauf M, Joosten R, Frühwald A (2016) Assessing fossil fuel substitution through wood use based on long-term simulations. Carbon Manag 7: 67–77. https://doi.org/10.1080/17583004.2016.1166427.
Köhl M, Linser S, Prins K, Talarczyk A (2021) The EU climate package “Fit for 55” – a double-edged sword for Europeans and their forests and timber industry. FPE 132: article id 102596. https://doi.org/10.1016/j.forpol.2021.102596.
Kollmann F (2013) Technologie des Holzes und der Holzwerkstoffe: 1. Band. [Technology of wood and wood-based materials]. Springer-Verlag.
Komatsu Forest (2018) MAXIFLEET Sicherheit, Rentabilität und bessere Arbeitsabläufe. [MAXIFLEET Safety, profitability and better workflows]. http://shopv15.mediahandler.se/pdf/partek/kMaxiFleet_b_4-sid_de.pdf. Accessed 12 April 2024.
Komatsu Forest (2022a) Komatsu 845. https://shopv15.mediahandler.se/pdf/komatsu/k845_b_2022_de.pdf. Accessed 25 April 2023.
Komatsu Forest (2022b) Komatsu 931XC. https://www.komatsuforest.com/forest-machines/our-wheeled-harvesters/931xc. Accessed 25 April 2023.
Kubová P, Hájek M, Třebickỳ V (2018) Carbon footprint measurement and management: case study of the school forest enterprise. BioResources 13: 4521–4535. https://doi.org/10.15376/biores.13.2.4521-4535.
Kühmaier M, Kral I, Kanzian C (2022) Greenhouse gas emissions of the forest supply chain in Austria in the year 2018. Sustainability 14, article id 792. https://doi.org/10.3390/su14020792.
KWF (2019) Funktiogrammvorlagen für Holzernteverfahren: “Funktiogrammvorlagen und Maschinenpiktogramme zum Download”. [Functional diagram templates for timber harvesting methods: “Functional diagram templates and machine pictograms for download”]. http://dbwaldarbeit.kwf-online.de/. Accessed 6 August 2023.
KWF Datenbasis Waldarbeit und Forsttechnik. [Forestry work and forestry technology database]. https://www.kwf-online.de/index.php/forschungsprojekte/replan/306-funktiogramme-erstellen. Accessed 27 November 2022.
Labelle ER, Lemmer KJ (2019) Selected environmental impacts of forest harvesting operations with varying degree of mechanization. Croat J For Eng 40: 239–257. https://doi.org/10.5552/crojfe.2019.537.
Lamlom SH, Savidge RA (2003) A reassessment of carbon content in wood: variation within and between 41 North American species. Biomass Bioenerg 25: 381–388. https://doi.org/10.1016/S0961-9534(03)00033-3.
Lijewski P, Merkisz J, Fuć P, Ziółkowski A, Rymaniak Ł, Kusiak W (2017) Fuel consumption and exhaust emissions in the process of mechanized timber extraction and transport. Eur J For Res 136: 153–160. https://doi.org/10.1007/s10342-016-1015-2.
Linkosalmi L, Roope H, Atsushi T, Tuovi V, Olli D (2020) Environmental product declaration of timber products: the impact of allocation method to the impact categories. J Clean Prod 256. https://doi.org/10.1016/j. jclepro.2020.120386.
Lippke B, Gustafson R, Venditti R, Steele P, Volk TA, Oneil E, Johnson L, Puettmann ME, Skog K (2012) Comparing life-cycle carbon and energy impacts for biofuel, wood product, and forest management alternatives. For Prod J 62: 247–257. https://doi.org/10.13073/FPJ-D-12-00017.1.
Lohmann U, Blosen M (2003) Holzlexikon. [Wood encyclopedia]. Nikol-Verlag, Hamburg.
Lohmann U, Annies T, Ermschel D (1998) Timber manual. DRW-Verlag, Leinfelden-Echterdingen.
Marchi E, Chung W, Visser R, Abbas D, Nordfjell T, Mederski PS, McEwan A, Brink M, Laschi A (2018) Sustainable forest operations (SFO): a new paradigm in a changing world and climate. Sci Total Environ 634: 1385–1397. https://doi.org/10.1016/j.scitotenv.2018.04.084.
Marx SE, Luck JD, Hoy RM, Pitla SK, Blankenship EE, Darr MJ (2015) Validation of machine CAN bus J1939 fuel rate accuracy using Nebraska Tractor Test Laboratory fuel rate data. Comput Electron Agric 118: 179–185. https://doi.org/10.1016/j.compag.2015.08.032.
Mederski PS, Bembenek M, Karaszewski Z, Pilarek Z, Łacka A (2018) Investigation of log length accuracy and harvester efficiency in processing of oak trees. Croat J For Eng 39: 173–181.
Metslaid M, Reintam E, Sims A (2022) Researchers: unmanaged forests now emit more CO2 than they absorb. https://news.err.ee/1608741910/researchers-unmanaged-forests-now-emit-more-co2-than-they-absorb. Accessed 21 November 2022.
Missouri Botanical Garden (2024). Tropicos. https://www.tropicos.org/home. Accessed 29 July 2024.
Morat J, Forbrig A, Graupner J (1998) Holzernteverfahren: Vergleichende Erhebung und Beurteilung der Holzernteverfahren in der Bundesrepublik Deutschland. [Timber harvesting methods: comparative survey and assessment of timber harvesting methods in the Federal Republic of Germany]. KWF, Groß-Umstadt.
Niemz P, Sonderegger W (2016) Holzphysik. [Timber physics]. Hanser, Munich.
Oberscheider M, Zazgornik J, Henriksen CB, Gronalt M, Hirsch P (2013) Minimizing driving times and greenhouse gas emissions in timber transport with a near-exact solution approach. Scand J For Res 28: 493–506. https://doi.org/10.1080/02827581.2012.758309.
Oberscheider M, Zazgornik J, Gronalt M, Hirsch P (2015) An exact approach to minimize the greenhouse gas emissions in timber transport. Eur J Oper Res 7: 43–59. https://doi.org/10.1080/02827581.2012.758309.
Paschotta R (2023). Graue Energie. [Grey Energy]. In RP-Energie-Lexikon. https://www.energie-lexikon.info/fname. Accessed 18 July 2024.
Pérez R, Argüelles F, Laca A, Laca A (2024) Evidencing the importance of the functional unit in comparative life cycle assessment of organic berry crops. Environ Sci Pollut Res 31: 22055–22072. https://doi.org/10.1007/s11356-024-32540-6.
Prinz R, Spinelli R, Magagnotti N, Routa J, Asikainen A (2018) Modifying the settings of CTL timber harvesting machines to reduce fuel consumption and CO2 emissions. J Clean 197: 208–217. https://doi.org/10.1016/j.jclepro.2018.06.210.
Puettmann M, Oneil E, Bergman R (2013) Cradle to gate life cycle assessment of softwood lumber production from the Northeast-North Central. Consortium for Research on Renewable Industrial Materials University of Washington Seattle, WA.
Purfürst T (2009) Der Einfluss des Menschen auf die Leistung von Harvestersystemen. [The influence of humans on the performance of harvester systems]. Doctoral thesis, Technical University of Dresden. https://nbn-resolving.org/urn:nbn:de:bsz:14-qucosa-19722.
Purfürst T, Erler J (2011) The human influence on productivity in harvester operations. Int J For Eng 22: 15–22. https://doi.org/10.1080/14942119.2011.10702606.
Rogovskii I, Voinash S, Sokolova V, Krivonogova A (2021) Research on fuel consumption for different values of capacity factor of engine of combine harvester. IOP Conference Series: Earth and Environmental Science. IOP Publishing 666. https://doi.org/10.1088/1755-1315/666/3/032093.
Roth G (2016) StanForD as a data source for forest management: a forest stand reconciliation implementation case study. Doctoral thesis, School of Forestry, University of Canterbury. http://hdl.handle.net/10092/12865.
Saranpää P (2003) Wood density and growth. In: Barnett JR, Jeronimidis G (eds) Wood quality and its biological basis. Blackwell Publishing Ltd, Oxford, pp 87–117.
Schier F, Iost S, Seintsch B, Weimar H, Dieter M (2022) Assessment of possible production leakage from implementing the EU biodiversity strategy on forest product markets. Forests 13, article 1225. https://doi.org/10.3390/f13081225.
Scholz J, De Meyer A, Marques AS, Pinho TM, Boaventura-Cunha J, Van Orshoven J, Rosset C, Künzi J, Kaarle J, Nummila K (2018) Digital technologies for forest supply chain optimization: existing solutions and future trends. Environ Manag 62: 1108–1133. https://doi.org/10.1007/s00267-018-1095-5.
Schulz H, Glos P, Wegener G (1988) Überlegungen zu künftigen Anforderungen an Rohholz. [Considerations on future requirements for raw wood]. Forstwissenschaftliches Centralblatt 107: 317–325.
Schulze ED, Bouriaud O, Irslinger R, Valentini R (2022) The role of wood harvest from sustainably managed forests in the carbon cycle. Ann For Sci 79, article id 17. https://doi.org/10.1186/s13595-022-01127-x.
Schweier J, Spinelli R, Magagnotti N, Wolfslehner B, Lexer M (2018) Sustainability assessment of alternative thinning operations in Mediterranean softwood plantations. Forests 9, article id 375. https://doi.org/10.3390/f9070375.
Schweier J, Magagnotti N, Labelle ER, Athanassiadis D (2019) Sustainability impact assessment of forest operations: a review. Curr For Rep 5: 101–113. https://doi.org/10.1007/s40725-019-00091-6.
Seuri M, Bradley A, Röser D, Pinto C, Dian W, Pandur Z, Dvořák J, Torbjørn Jørgensen M, Muiste P, Irdla M, Ginet C, Mac Donagh PM, Purfürst T, Dietz H-U, Spinelli R, Suzuki Y, Shirasawa H, Lazdiņš A, Visser R, Harvey C, Skjølaas D, Moskalik T, Acuna M, Trzciński G, Borz SA, Muşat EC, Triplat M, Oberholzer F, Talbot B, Tolosana E, Von Hofsten H, Akay AO, Bakay B, Kanzian C, Conrad Iv JL, Olivera A, Petković V, Gonçalves Robert RC, Suppi Costa LH, Coelho Da Cruz R, Krumov T, Kärhä K (2024) Overview of global long-distance road transportation of industrial roundwood. Croat J For Eng 45: 217–236. https://doi.org/10.5552/crojfe.2024.2286.
Sgarbossa A, Boschiero M, Pierobon F, Cavalli R, Zanetti M (2020) Comparative life cycle assessment of bioenergy production from different wood pellet supply chains. Forests 11, article id 1127. https://doi.org/10.3390/f11111127.
Simon F (2020) Official: EU taking first steps to bring forestry into carbon market. https://www.euractiv.com/section/energy-environment/interview/official-eu-taking-first-steps-to-bring-forestry-into-carbon-market/. Accessed 21 November 2022.
Skogforsk (2021) StanForD 2010 – modern communication with forest machines. https://www.skogforsk.se/english/projects/stanford/stanford-2010/. Accessed 28 August 2022.
Skytt T, Englund G, Jonsson B-G (2021) Climate mitigation forestry – temporal trade-offs. Environ Res Lett 16, article id 114037. https://doi.org/10.1088/1748-9326/ac30fa.
Smaltschinski T (2010) Reduktion der Leerfahrten beim Rundholztransport. [Reduction in empty runs during log transportation]. Allg F u J Ztg 181: 197–204.
Smaltschinski T, Müller M, Becker G (2011) Round wood distribution logistics of the Bavaria state forest enterprise. Allg F u J Ztg 182: 53–59.
Smaltschinski T, Seeling U, Becker G (2012) Clustering forest harvest stands on spatial networks for optimised harvest scheduling. Ann For Sci 69: 651–657. https://doi.org/10.1007/s13595-012-0182-7.
Solarin SA, Gil-Alana LA, Lafuente C (2019) Persistence in carbon footprint emissions: an overview of 92 countries. Carbon Manag 10: 405–415. https://doi.org/10.1080/17583004.2019.1620038.
Solomon S, Quin D, Manning M, Chen Z, Marquis M, Averyt KB, Tignor M, Miller HL (eds), IPCC (2007) Climate change 2007: the physical science basis. Cambridge University Press. ISBN 978-0-521-70596-7.
Speidel G (1952) Das Stückmassegesetz und seine Bedeutung für den internationalen Leistungsvergleich bei der Forstarbeit. [The Law of Unit Measurements and its significance for the international comparison of forestry work performance]. Doctoral thesis. IFFA 5, Reinbek/Hamburg.
Strubergs A, Lazdins A, Sisenis L (2021) Use of StanForD2010 data for determination of effect of harvester operator periodic training on productivity and fuel economy. Proceedings of the international scientific conference Engineering for Rural Development. Latvia University of Life Sciences and Technologies. https://doi.org/10.22616/ERDev.2021.20.TF252.
Suadicani K, Talbot B (2008) The Nordic-Baltic conference on forest operations. Forest & Landscape Working Papers 92.
Tellnes LG, Ganne-Chedeville C, Dias A, Dolezal F, Hill C, Zea Escamilla E (2017) Comparative assessment for biogenic carbon accounting methods in carbon footprint of products: a review study for construction materials based on forest products. IForest 10: 815–823. https://doi.org/10.3929/ethz-b-000516814.
Timmermann V, Dibdiakova J (2014) Greenhouse gas emissions from forestry in East Norway. Int J Life Cycle Assess 19: 1593–1606. https://doi.org/10.1007/s11367-014-0773-7.
Valdivia S, Backes JG, Traverso M, Sonnemann G, Cucurachi S, Guinée JB, Schaubroeck T, Finkbeiner M, Leroy-Parmentier N, Ugaya C, Pena C, Zamagni A, Inaba A, Amaral M, Berger M, Dvarioniene J, Vakhitova T, Benoit-Norris C, Prox M, Foolmaun R, Goedkoop M (2021) Principles for the application of life cycle sustainability assessment. Int J Life Cycle Assess 26: 1900–1905. https://doi.org/10.1007/s11367-021-01958-2.
Wagenführ R (1989) Anatomie des Holzes. [Anatomy of the wood]. VEB Fachbuchverlag, Leipzig.
Wagenführ R, Wagenführ A (2021) Holzatlas. [Wood atlas]. Carl Hanser Verlag GmbH Co KG, Munich.
Weise G (2022) Kraftstoffverbrauch und Leistung von Forstmaschinen im Licht der KWF-Gebrauchswertprüfungen. [Fuel consumption and performance of forestry machines in the light of KWF utility value tests]. Forsttechnische Informationen 5: 12–17.
Werner F (2017) Background report for the life cycle inventories of wood and wood based products for updates of ecoinvent 2.2. Werner Environment & Development, Zürich, CH.
Willems S (2015) Zur Abschaetzung der Holzernte-Produktivität bei Optimierung von Bereitstellungsverfahren für Sortimente aus Laubholzkronen. [To estimate timber harvesting productivity when optimizing staging methods for assortments from hardwood crowns]. Doctoral thesis, University of Göttingen. Cuvillier Verlag, Göttingen.
Woo H, Acuna M, Choi B, Han S (2021) FIELD: a software tool that integrates harvester data and allometric equations for a dynamic estimation of forest harvesting residues. Forests 12, article id 834. https://doi.org/10.3390/f12070834.
Wördehoff R, Spellmann H, Evers J, Aydın CT, Nagel J (2012) Kohlenstoffstudie Forst und Holz Schleswig-Holstein. [Carbon Study of Forestry and wood industry in Schleswig-Holstein]. https://www.schleswig-holstein.de/DE/fachinhalte/W/wald/wald_02_Kohlenstoff.html. Accessed 12 April 2024.
Xu W, Becker G (2012) Environmental impact assessment of wood pulp from a eucalyptus plantation in South China by using life-cycle analysis. For Prod J 62: 365–372. https://doi.org/10.13073/0015-7473-62.5.365.
Yoshimoto A, Asante P, Itaka S (2018) Incorporating carbon and bioenergy concerns into forest management. Curr For Rep 4: 150–160. https://doi.org/10.1007/s40725-018-0080-9.
Yoshimura T, Suzuki Y, Sato N (2023) Assessing the productivity of forest harvesting systems using a combination of forestry machines in steep terrain. Forests 14, article id 1430. https://doi.org/10.3390/f14071430.
Zhang F, Johnson DM, Wang J, Yu C (2016) Cost, energy use and GHG emissions for forest biomass harvesting operations. Energy 114: 1053–1062. https://doi.org/10.1016/j.energy.2016.07.086.
Zhang X, Zhang W, Xu D (2020) Life cycle assessment of complex forestry enterprise: a case study of a forest–fiberboard integrated enterprise. Sustainability 12, article 4147. https://doi.org/10.3390/su12104147.
Zijlema P (2019) The Netherlands: list of fuels and standard CO2 emission factors version of January 2016. https://www.rvo.nl/files/file/2016/08/The%20Netherlands%20list%20of%20fuels%20and%20CO2%20emission%20January%202016.pdf. Netherlands Enterprise Agency. Accessed 12 April 2024.
Total of 144 references.
