
Therese Strömvall Nyberg  ,
Mikolaj Lula,
Hammed Adekunle,
Urban Nilsson,
Göran Örlander,
Emma Holmström
,
Mikolaj Lula,
Hammed Adekunle,
Urban Nilsson,
Göran Örlander,
Emma Holmström
Forest development and financial outcomes under shelterwood and clearcut regimes in mixed stands
Strömvall Nyberg T., Lula M., Adekunle H., Nilsson U., Örlander G., Holmström E. (2026). Forest development and financial outcomes under shelterwood and clearcut regimes in mixed stands. Silva Fennica vol. 60 no. 3 article id 26005. https://doi.org/10.14214/sf.26005
Highlights
- Shelterwood and mixed species regeneration can be a viable strategy under suitable conditions
- Active management and timely overstory removal in shelterwood systems are important for financial revenue and stand development
- Clearcuts consistently yielded higher financial returns than shelterwood.
Abstract
We assessed long-term outcomes of a regeneration experiment comparing clearcutting and shelterwood treatments, each with and without mechanical site preparation (MSP). The experiment was established in the early 1990s across Sweden and combined natural regeneration of Scots pine (Pinus sylvestris L.) with planting of Norway spruce (Picea abies (L.) H. Karst.; 2500 seedlings ha–1). The first assessment showed Norway spruce dominance on southern sites and potential for mixed stands in central and northern regions. In 2022–2023, sites were re-measured to assess stand structure and productivity at mid-rotation, and the measured data were then used to parameterize Heureka decision support system (DSS) for simulations to final harvest. Southern sites developed into Norway spruce-dominated stands, with higher volume in clearcut than shelterwood treatments. Central and northern sites developed into mixed species stands, with higher volumes in shelterwood treatments in central Sweden. In northern Sweden, retained shelterwood negatively affected understory growth, highlighting the importance of active management while using shelterwood. Despite these regional differences, land expectation value (LEV) was consistently higher for clearcut treatments. Even in central Sweden, higher volumes in shelterwood treatments did not compensate for the additional costs associated with shelterwood cuttings. Our results show that establishing mixed species stands through shelterwood and planting can be viable depending on site conditions, but likely results in lower revenue than clearcutting.
Keywords
Pinus sylvestris;
Picea abies;
land expectation value;
combination method;
Drettinge method
-
Strömvall Nyberg,
Southern Swedish Forest Research Centre, Swedish University of Agricultural Sciences, 234 56 Alnarp, Sweden
 https://orcid.org/0009-0007-0280-6023
E-mail
therese.stromvall@slu.se
https://orcid.org/0009-0007-0280-6023
E-mail
therese.stromvall@slu.se
- Lula, Southern Swedish Forest Research Centre, Swedish University of Agricultural Sciences, 234 56 Alnarp, Sweden E-mail mikolaj.lula@slu.se
- Adekunle, Southern Swedish Forest Research Centre, Swedish University of Agricultural Sciences, 234 56 Alnarp, Sweden E-mail hammedadekunle43@yahoo.com
- Nilsson, Southern Swedish Forest Research Centre, Swedish University of Agricultural Sciences, 234 56 Alnarp, Sweden E-mail urban.nilsson@slu.se
- Örlander, Department of Forestry and Wood Technology, Linnaeus University, 351 95 Växjö, Sweden E-mail goran.orlander@outlook.com
-
Holmström,
Southern Swedish Forest Research Centre, Swedish University of Agricultural Sciences, 234 56 Alnarp, Sweden
https://orcid.org/0000-0003-2025-1942
E-mail
emma.holmstrom@slu.se
Received 30 January 2026 Accepted 3 June 2026 Published 16 July 2026
Views 18066
Available at https://doi.org/10.14214/sf.26005 | Download PDF

Supplementary Files
1 Introduction
Mixed species forest, consisting of two or more tree species coexisting at any given time (Bravo-Oviedo et al. 2014), is thought to be more resilient (Jactel et al. 2009), maintain biodiversity (Felton et al. 2016; Huuskonen et al. 2021) and be less susceptible to damage (Agestam et al. 2006) than monocultures. Mixed species stands are furthermore suggested as an adaptation to climate change (Felton et al. 2010). Studies have shown that the most productive mixture of Scots pine (Pinus sylvestris L.) and Norway spruce (Picea abies (L.) H. Karst.) produces volumes comparable to those of monocultures of the same species at intermediate site conditions (Agestam et al. 2006; Holmström et al. 2018; Huuskonen et al. 2021). Although interest in managing mixed forests is growing, practical experience and long-term data on the outcomes of different management practices are limited.
In the boreal region of Fennoscandia, the primary tree species used in forest regeneration are Scots pine and Norway spruce (Huuskonen et al. 2021). In Sweden, the distribution of these species varies regionally, with Norway spruce being predominant in the south and Scots pine more common in the north (SLU 2024). Scots pine is a more favorable fodder species, especially for moose (Alces alces L.), but also for roe deer (Capreolus capreolus L.; Felton et al. 2020; Ara et al. 2021). The selective browsing pressure and the profitability of Norway spruce stands have motivated planting only Norway spruce in the past (Månsson et al. 2007; Nilsson et al. 2010; Lodin et al. 2017). However, private forest owners are increasingly adopting mixed species forest management as a climate change adaptation (Blennow 2012). This shift is driven by risk awareness, a desire for aesthetic diversity and growing curiosity about other tree species (Lodin et al. 2017). Even when forest owners regenerate with a single species, stands turned into mixed species stands a few years after planting (Ara et al. 2021) and today approximately one third of Sweden’s forest can be classified as conifer-mixed species stands (Lee et al. 2023).
Today, most stands in Sweden are regenerated through planting genetically improved seedlings after mechanical site preparation and clearcutting (MSP; Skogsstyrelsen 2024, 2025). This has been described as an efficient way to establish new stands, reducing seedling mortality (Heiskanen et al. 2013; Johansson et al. 2013; Sikström et al. 2020), shortening rotation length (Simonsen 2013; Serrano-León et al. 2021), increasing volume production (Holmström et al. 2018; Jonsson et al. 2022) and thus optimizing the financial outcome (Simonsen et al. 2010, 2013). In 2024, natural regeneration was used in less than 10% of the time (Skogsstyrelsen 2024). However, shelterwood reduces frost damage risk (Lundmark and Hällgren 1987; Langvall 2000), because the downwelling longwave radiation from the canopy increases the daily minimum air temperature (Man and Lieffers 1999; Langvall and Örlander 2001). Shelterwood stands has less competing ground vegetation (Béland et al. 2000) and pine weevil (Hylobius abietis L.) damage (von Sydow and Örlander 1994; Nordlander et al. 2003; Petersson and Örlander 2003; Wallertz et al. 2006; Wallertz 2009). Lower establishment costs and the value increase for the retained overstory, which later will be harvested, could potentially make shelterwood more profitable than clearcutting and planting (Glöde et al. 2003; Lula et al. 2021). However, the risk of wind damage to the retained shelterwood and thus loss of income needs to be considered (Örlander 1995; Nilsson et al. 2006). There is also a risk that seedlings might be damaged when the shelterwood is harvested (Niemistö et al. 2024). Furthermore, uneven seed distribution and variation in establishment success among years and sites make natural regeneration more uncertain (Miina and Saksa 2008; Jonsson et al. 2022; Lula et al. 2024), with the risk of reduced volume production (Lula et al. 2021) and prolonged rotation periods relative to planting (Strand et al. 2006; Simonsen et al. 2013; Tishler et al. 2020).
The combination method, also commonly called the “Drettinge method” in Sweden, combines natural regeneration with planting. In this approach, a retained Scots pine shelterwood promotes natural regeneration of its seedlings while Norway spruce seedlings are actively planted (Karlsson and Örlander 2004). It intends to promote the development of a mixed species stand, combining planting and shelterwood systems’ benefits while mitigating their risks. In Sweden, a nationwide regeneration experiment was initiated in the early 1990s to evaluate the combination method in comparison to conventional clearcutting followed by planting (Nilsson et al. 2006). The planted seedlings grew slower in the shelterwoods compared to the clearcuts and for naturally regenerated Scots pine, seedling density in the central region increased under both shelterwood and MSP. In the southern region, these treatments initially enhanced seedling density, but the effects were diminished after five years due to high mortality, possibly from browsing pressure or a fungal pathogen. Moreover, naturally regenerated Scots pine seedlings grew slowly across all regions, constraining future mixed species stands’ establishment, particularly in southern Sweden.
We remeasured sites from the national regeneration experiment to assess long-term effects of clearcutting and shelterwood-cutting on species composition, basal area, volume and stand density. We used the measured stand variables to parameterize Heureka (a forest decision support system) to further simulate the stand development until final harvest. Using the simulation results, we quantified the effect of shelterwood-cutting and clearcutting on long-term volume production, cash flow (CF) and land expectation value (LEV) using different interest rates (IR).
2 Materials and methods
2.1 Study sites and experimental design
We remeasured twelve sites across Sweden, chosen from those established in the early 1990s (Nilsson et al. 2006). The sites were located between Skåne county in the south (56°21´N, 15°18´E) to Västerbotten county in the north (64°33´N, 18°24´E; Fig. 1). At the time of establishment, all twelve were classified as moderate-fertility sites, with either blueberry- or grass-dominated understory vegetation (Hägglund and Lundmark 1977). Site index (SIS), estimated from site properties, assessed as Scots pine or Norway spruce height after 100 years of growth, ranged from 20 to 29 m (Hägglund and Lundmark 1977; Table 1). All sites were located on mesic soil, with annual temperature sums ranging from 810 degree-days (dd) in the north to 1450 dd in the south (Table 1; Nilsson et al. 2006). Soil texture was predominantly sandy-silty till, except for site 24:1, which was sandy.
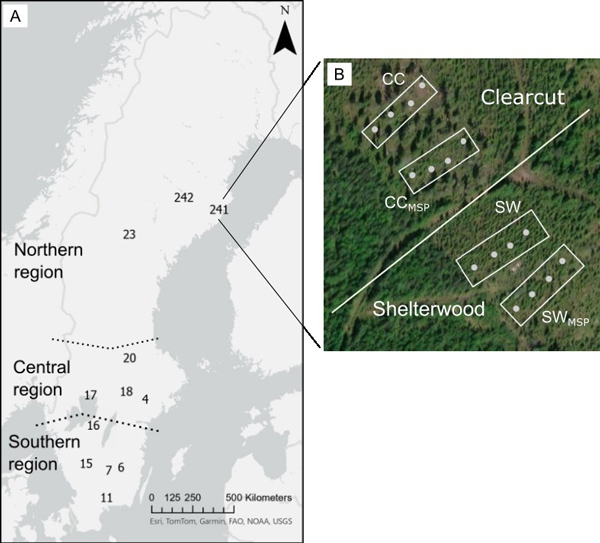
Fig. 1. Picture A shows a map over Sweden and the locations of the sites divided into the three regions, southern, central and northern Sweden. Picture B shows site 24:1 and the experimental design. The whole site equals one block divided into the two main treatments: clearcut (CC) and shelterwood (SW). The main treatments were then further divided into the two sub-treatments: mechanical site preparation (MSP) and no mechanical site preparation (no abbreviation). The four filled circles in the sub-treatments represent the sample plots established in 2022 or 2023.
| Table 1. Description of study sites, using the same regional classification (south, central and north), and site numbers from the original design in Nilsson et al. (2006). | |||||||
| Region | Site | County | Latitude, Longitude | Altitude (m a.s.l.) | Temperature sum (degree-days) | Soil texture | SIS 1 (m) |
| South | 6 | Jönköping | 57°17´N, 15°17´E | 185 | 1385 | Sandy-silty | 26–27 (SP) |
| South | 7 | Kronoberg | 57°08´N, 14°49´E | 230 | 1400 | Sandy-silty | 25–26 (SP) |
| South | 11 | Skåne | 56°26´N, 14°20´E | 150 | 1450 | Sandy-silty | 28 (NS) |
| South | 15 | Älvsborg | 57°28´N, 13°08´E | 175 | 1400 | Sandy-silty | 22 (NS) |
| South | 16 | Skaraborg | 58°39´N, 13°47´E | 70 | 1400 | Sandy-silty | 26 (SP) |
| Central | 4 | Södermanland | 59°13´N, 16°49´E | 60 | 1375 | Sandy-silty | 24–27 (SP) |
| Central | 17 | Värmland | 59°25´N, 13°31´E | 90 | 1380 | Sandy-silty | 26 (SP) |
| Central | 18 | Örebro | 59°35´N, 15°27´E | 85 | 1350 | Sandy-silty | 24–26 (SP) |
| Central | 20 | Dalarna | 60°27´N, 15°45´E | 157 | 1222 | Sandy-silty | 23 (NS) |
| North | 23 | Jämtland | 63°44´N, 15°44´E | 290 | 850 | Sandy-silty | 29–21 (SP) |
| North | 24:1 | Västerbotten | 64°04´N, 20°17´E | 145 | 1010 | Sandy | 23 (SP) |
| North | 24:2 | Västerbotten | 64°33´N, 18°24´E | 340 | 810 | Sandy-silty | 20–21 (SP) |
| 1 Site index, estimated from site properties, at experimental establishment, either based on dominant height at age 100 years for Scots pine (SP) or Norway spruce (NS) | |||||||
In the 1990’s, one block per site was established with a split-plot design. Each block was divided into two main treatments, either a clearcut or a shelterwood. The two main treatments were then further split into two sub-treatments, with or without MSP (Fig. 1). The specific MSP method varied by site, either disc trenching, patch scarification, or mounding (Table 2). These were, and still are, conventional MSP methods in forest regeneration in northern Europe (Sikström et al. 2020). In each block, both the main treatments and the sub-treatments were randomly assigned.
| Table 2. Site-specific details of forest management operations during the establishment phase (Nilsson et al. 2006). | ||||||
| Site | Clearcut (month, year) | MSP 1 (month, year) | MSP 1 (type) | Planting (month, year) | Seedling type | Seedling age (years) |
| 6 | Oct-94 | Apr-95 | Patch | May-95 | Bare-root | 4 |
| 7 | Mar-95 | Nov-95 | Disc trench. | May-96 | Cont 2 | 1.5 |
| 11 | Sep-95 | Nov-95 | Disc trench. | Jun-96 | Bare-root | 4 |
| 15 | Feb-94 | Sep-94 | Disc trench. | Apr-95 | Bare-root | 4 |
| 16 | Apr-94 | Nov-94 | Disc trench. | May-95 | Cont 2 | 2 |
| 4 | Apr-94 | Oct-95 | Disc trench. | May-96 | Cont 2 | 1 |
| 17 | Dec-94 | Sep-95 | Mound | May-96 | Cont 2 | 1 |
| 18 | Oct-95 | Oct-96 | Disc trench. | May-97 | Cont 2 | 1 |
| 20 | Dec-94 | May-95 | Disc trench. | Jun-95 | Cont 2 | 1.5 |
| 23 | Mar-95 | Jun-96 | Mound | Jun-96 | Cont 2 | 1 |
| 24:1 | Aug-94 | Jul-96 | Disc trench. | Sep-96 | Cont 2 | 1 |
| 24:2 | Jan-95 | Sep-96 | Disc trench. | Jun-97 | Cont 2 | 1 |
| 1 Mechanical site preparation 2 Containerized seedlings | ||||||
The original sub-treatment areas were 0.4 ha, resulting in a total block area of 1.6 ha (Table 2). Final felling for the clearcut treatments and the release cutting to establish the shelterwood occurred in 1994 and 1995 (Table 2). In total, between 114 and 156 trees ha–1 were retained in the shelterwood treatments, corresponding to a volume range of 69 to 138 m3 ha–1, with 78% to 100% of the retained volume consisting of Scots pine (Nilsson et al. 2000, 2006). MSP was performed between 1994 and 1996. All sub-treatments were planted between 1995 and 1997 with a density of 2500 Norway spruce seedlings ha–1, either with containerized or bare-root seedlings (Table 2; Nilsson et al. 2006). For additional details on the original experimental design, results, and measurements, see Karlsson and Nilsson (2005) and Nilsson et al. (2006).
2.2 Inventory design
At the time of the establishment in the 1990’s, the location of each site and sub-treatments were documented on paper. Most of the sites were given coordinates for the general location of the experiment and had hand-drawn maps of the sub-treatment locations. In 2022, the sites were first relocated in ArcMap (version ArcGIS Pro 3.5.0) once the coordinates were converted from the old RT 38 reference system to SWEREF 99 TM. The outer bounds of the sub-treatments were then preliminarily located in ArcMap and more exactly positioned during the field visits. After this process, twelve of the original sites’ locations and borders could be re-established. The twelve sites were measured between fall 2022 and spring 2023 (Supplementary file S1: Table S1).
In each of the original sub-treatments, four sample plots with a radius of 5.64 meters were established, (sixteen in total per block). The sample plots were laid out along a transect in the center of the sub-treatments at 15–23 m spacing with an exception for seven sub-treatments (six of which had three sample plots and one which had two sample plots due to uncertainties of the exact location of the sub-treatment). Within each sample plot, all trees above 1.3 meters were noted for species and diameter at breast height (DBH, measured twice with calipers at right angles and averaged). On selected sample trees, the height was also measured with a Vertex 5 (Haglöf Sweden n.d.). The sample trees were selected by size and location relative to the sample plot center. For each tree species present in the sample plot, the height of the two largest trees was measured, as well as the three trees closest to the center. If one of the largest trees also was one of the three closest to the center, the fourth-closest tree was then measured and so forth. The center of each sample plot was marked in the field, and the latitude and longitude were noted.
2.3 Data processing and analysis
Heights for the measured Norway spruce, Scots pine and birch trees (Betula pendula Roth and Betula pubescens Ehrh.) were estimated using diameter-height functions parameterized with data from sample trees for which both DBH and height were measured. For the six species with more limited occurrence, height estimates were derived from the Norway spruce data (hybrid larch, Larix × marschlinsii Coaz.) or the birch spp. data (gray alder – Alnus incana (L.) Moench, aspen – Populus tremula L., oak – Quercus robur L., rowan – Sorbus aucuparia L., and willow – Salix caprea L.). This grouping was also applied in the tree volume estimations.
Tree height was estimated using Näslund’s height function (1947; Eq. 1), implemented in R, version 2023.9.1.494 (R Core Team 2023) using the package forestmangr (Rabelo Braga et al. 2023). One α and one β coefficient (Eq. 1) were estimated for each combination of species, site, and sub-treatment based on the sample tree data. The fitted model was visually validated against the measured sample tree heights. Upon successful validation, the derived parameters were applied together with the measured DBH to predict individual tree height:

where h is the measured or estimated height (m), dbh is the measured DBH (cm) and a is a species-specific parameter. For Norway spruce and larch, a is 3; for all other species a is 2. α and β are the estimated site-, treatment- and species-specific parameters, and the +1.3 corrects for the height at which DBH was measured.
Volume was calculated for each tree using its measured DBH and estimated height. For trees with DBH < 4 cm, Andersson’s volume functions (1954) were applied, while for trees with DBH > 5 cm, Brandel’s volume function (1990) was used (Suppl. file S1). For trees with a DBH ranging from 4.0 to 5.0 cm, a smoothing function was applied to reduce possible divergence between functions (Holmström et al. 2016; Suppl. file S1). Quadratic mean diameter (QMD; Eq. 2) and Lorey’s mean height (HL; Eq. 3) was also calculated for Scots pine, Norway spruce and birch spp. for each region and sub-treatment:

where dbhi is the measured DBH (cm) of tree i and n is the total number of trees (Curtis and Marshall 2000).

where BAi is the basal area (m2) of tree i and hi is the height of tree i and BAtot is the total basal area for all calipered trees in the sample plot (Kershaw et al. 2016).
2.4 Statistical analysis
To assess potential differences in stand density (stems ha–1), volume, basal area, quadratic mean diameter (QMD) and Lorey’s mean height (HL), values were first calculated at sample plot level and then averaged for each sub-treatment. The averaged values were tested with linear mixed-effects models which were fitted using the package lme4 (Bates et al. 2015) in R version 2023.9.1.494 (R Core Team 2023). For stand density, the response variable was log transformed before the model fitting, to ensure normal distribution residuals. The fixed effects included main treatment (clearcutting and shelterwood) and sub-treatment (MSP and no MSP), while each site was one block and included as a random effect. Main treatment was nested within site to account for the split-plot experimental design. The general model structure was:

where μ is an overall mean, ai the random effect of the i-th block, βj the fixed effect of main treatment, үk the fixed effect of sub-treatment, (βү)jk the fixed interaction effect between main treatment and sub-treatment and (aβ)ij and εijk were the main treatment and sub-treatment error terms respectively. Random effects are assumed to be normally distributed with constant variances within the levels of the random factor and with independence between levels of the random factor.
Separate models were fitted for each region (south, central, and north), as well as for the combined dataset of the southern and central sites. The northern sites were excluded from the combined dataset due to the retention of the shelterwood trees on those sites. To adjust for small sample sizes, the Kenward–Roger approximation was used to estimate denominator degrees of freedom and a significance level of p = 0.05 was used (Suppl. file S1: Tables S2–S6). Due to a deviation in management objectives at site 11 (sub-treatment CC), where the forest owner actively promoted birch spp. got it excluded from statistical analyses.
2.5 Simulations and calculations
Simulations were conducted using StandWise application in Heureka DSS to further analyze the effects of the four treatments on volume growth over a full rotation and their expected revenue. Heureka DSS is an open software tool used to simulate stand development based on growth and yield models in 5-year time steps (Lämås et al. 2023). Two different simulations were conducted, one for the overstory and one for the understory. Swedish SEK was used for the calculations and converted to EUR, using the conversion factor of 11.468 (April 2024).
2.5.1 Overstory simulations
For each stand, two management scenarios were simulated: one representing regeneration under a shelterwood system, and the other representing a clearcut system. For the shelterwood system, overstory development was simulated to cover the period from the initial release cutting until the assumed removal of the remaining shelter trees, set to occur ten years after release cutting. Input data for the simulations were based on stand measurements collected prior to the release cutting. The intensity of the simulated release cuttings closely reflected the actual basal area proportions of Norway spruce and Scots pine retained in the stands following intervention, while birch spp. was removed entirely during the release cuttings. In the shelterwood scenario, wind damage was included based on empirical data from southern Sweden, where an average of 9% of overstory basal area was lost to windthrow during the first seven years after release cutting (Nilsson et al. 2006). Therefore, during the simulation, an assumption was made that 9% of the basal area was lost due to windthrows.
2.5.2 Understory simulations
Data collected from the inventory served as the starting values for the simulations. Prior to the simulations, stems with a diameter at breast height (DBH) smaller than 5 cm were removed, provided that the remaining stem density exceeded 1000 stems ha–1. All stands were subjected to a pre-commercial thinning following this protocol, except for two stands. For site 6 treatment SWMSP, 12 stems of Scots pine trees with a dbh smaller than 5 cm were retained to maintain an equivalent number of 1000 stems ha–1. Whereas for site 20 treatment SW, the trees were smaller than 1 cm in DBH, and where therefore still removed, leading to a total stem number below 1000 stems ha–1 (Table 5).
During the simulations, the stands were managed in accordance with the thinning guidelines of Södra, the regional forest owners’ association. For the thinnings to follow the guidelines, basal area had to reach a minimum of 31 m2 before the stands reached a top height of 20 m. Otherwise, the following alternative predefined criteria were applied:
1. If the stem density exceeded 1500 stems ha–1 with a top height of 16 m, the stand was thinned
2. If the stem density exceeded 1000 stems ha–1 with a top height of 20 m, the stand was thinned
Following this, all stands, except three, had one or two simulated thinnings from below with 25% of basal area removal each time (Table 5).
2.5.3 Financial calculations
Three different IRs’ were used for the financial calculations: 0%, 2.5% and 4% (Brukas et al. 2001). Depending on IR, when either the CF or the LEV reached its maximum value, the stands were harvested. For IR 0%, CF was calculated (Eq. 5):

where R is revenue and C the cost at time t and u is the rotation length. For IRs 2.5% and 4%, LEV was instead calculated (Eq. 6):

where R is the revenue and C is the cost, t (years) is the age of the stand, I0 is the investment cost at year 0, r is the IR expressed as a decimal; for example, 2.5% was written as 0.025, and u is the rotation length (Faustmann 1849 as cited by Dosumu et al. 2024).
For the calculation of CF and LEV, the roadside timber price list specific to the Växjö region (Suppl. file S1: Tables S10–S11) was used for both the overstory and understory. Operational harvester and forwarder costs for thinning and final felling were based on data provided by Södra for 2024. The thinning operation costs were 139.5 EUR hour–1 for the harvester and 95.9 EUR hour–1 for the forwarder, whereas final felling costs were 165.7 EUR hour–1 for the harvester and 130.8 EUR hour–1 for the forwarder. Furthermore, regeneration costs were included in accordance with Södra’s 2024 financial data, including MSP (392.4 EUR ha–1), seedling and planting labor (0.73 EUR seedling–1), and pre-commercial thinning (436 EUR ha–1). Only the southern and central sites were used in the simulation since the shelterwood was still retained on the northern sites.
2.5.4 Financial outcomes of overstory retention
To evaluate the effect of selecting shelterwood retention instead of clearcutting on profitability, the financial outcomes of the shelterwood and clearcut treatments were compared. The resulting difference was then incorporated into the understory calculations as either an income or a cost at year 0for the shelterwood treatments. It was calculated as the sum of discounted revenues from the shelterwood cuttings subtracted by the revenue from the clearcutting. If negative, it was treated as a cost, and if positive, as an income. For this analysis, the timber value of wind-felled shelter trees was assumed to be equal to the costs of their removal and were therefore excluded from the financial calculations.
2.6 Mixed species assessment
For this study, we adopted a baseline definition in which the dominant tree species comprised of no more than 75% of the stand basal area, based on treatment average. This threshold is slightly lower than that used by the Swedish NFI but is consistent with definitions applied in previous scientific studies (Agestam et al. 2006; Felton et al. 2016; SLU 2023).
3 Results
3.1 Stand development
3.1.1 Stand density
Stand density ranged from 2956 to 7008 stems ha–1 (Fig. 2). There were no statistically significant differences overall or for the separate regions (south, central and north; Suppl. file S1: Tables S2–S3) in stand density between the clearcut and shelterwood treatments. MSP had also no significant effect on stand density.
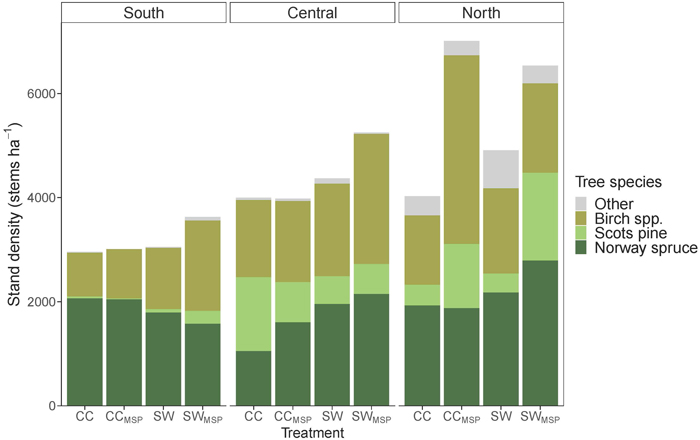
Fig. 2. Stand density (stems ha–1) for the different regions (south, central and north), treatments (CC, CCMSP, SW and SWMSP), and species (Norway spruce, Scots pine, birch spp. and other). The treatments are abbreviated CC = clearcut without mechanical site preparation, CCMSP = clearcut with mechanical site preparation, SW = shelterwood without mechanical site preparation, and SWMSP = shelterwood with mechanical site preparation.
3.1.2 Stand volume
Standing volume ranged from 14.2 to 132.2 m3 ha–1 (Fig. 3). Between the clearcut and shelterwood treatments, there were no significant differences overall in volume (Suppl. file S1: Tables S4–S5). However, when analyzed by region, the southern and northern region showed significantly higher volumes in the clearcut treatments than in the shelterwood treatments, and MSP also increased volume in the north. In the central region, neither harvesting method nor MSP had a statistically significant impact on volume.
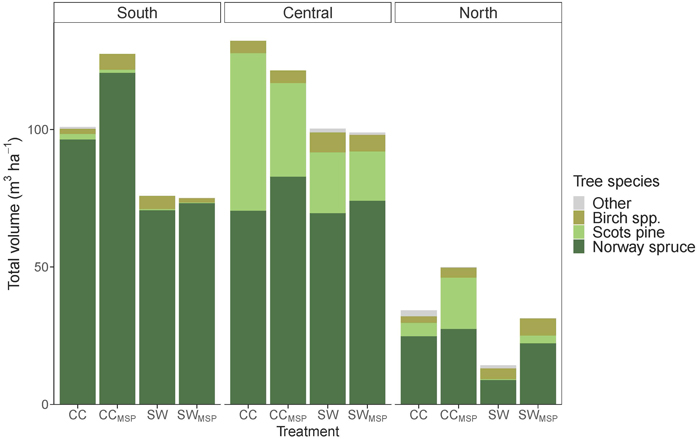
Fig. 3. Total standing volume in m3 ha–1 for the different regions (south, central and north), treatments (CC, CCMSP, SW and SWMSP), and species (Norway spruce, Scots pine, birch spp. and other). The treatments are abbreviated CC = clearcut without mechanical site preparation, CCMSP = clearcut with mechanical site preparation, SW = shelterwood without mechanical site preparation, and SWMSP = shelterwood with mechanical site preparation.
3.1.3 Diameter and height
The clearcut and shelterwood treatments did not have a statistically significant effect on quadratic mean diameter overall (QMD; Suppl. file S1: Table S6). In contrast, species differences were evident, with Norway spruce exhibiting significantly larger QMD values compared to Scots pine (Table 3). When analyzed separately by region (southern, central, and northern), the clearcut and shelterwood treatments again showed no significant effect on QMD. However, Norway spruce QMD was significantly larger than Scots pine QMD in the southern and northern regions.
| Table 3. Quadratic mean diameter (QMD) ± SE and Lorey’s mean height (HL) ± SE by region and treatment. The treatments are abbreviated CC = clearcut without mechanical site preparation, CCMSP = clearcut with mechanical site preparation, SW = shelterwood without mechanical site preparation, and SWMSP = shelterwood with mechanical site preparation. | |||||||
| Region | Treatment | QMD (cm) | Lorey’s height (m) | ||||
| Spruce | Pine | Birch spp. | Spruce | Pine | Birch spp. | ||
| South | CC | 10.3 ± 0.9 | 6.4 ± 3.7 | 2.0 ± 0.5 | 10.0 ± 0.9 | 7.4 ± 2.3 | 5.8 ± 1.6 |
| South | CCMSP | 11.4 ± 1.5 | 5.7 ± 3.3 | 4.7 ± 2.2 | 12.1 ± 0.9 | 9.5 ± 4.0 | 6.8 ± 2.4 |
| South | SW | 9.9 ± 1.0 | 2.9 ± 1.0 | 1.8 ± 0.7 | 9.8 ± 0.9 | 4.5 ± 1.4 | 5.2 ± 1.4 |
| South | SWMSP | 9.6 ± 1.1 | 0.6 ± 0.4 | 3.8 ± 1.2 | 9.7 ± 1.1 | 2.4 ± 0.2 | 6.2 ± 1.3 |
| Central | CC | 10.2 ± 2.3 | 11.0 ± 1.0 | 4.3 ± 1.6 | 10.9 ± 1.0 | 10.7 ± 0.8 | 7.3 ± 1.4 |
| Central | CCMSP | 10.3 ± 0.5 | 9.7 ± 0.5 | 2.9 ± 0.5 | 11.0 ± 1.0 | 9.7 ± 1.4 | 6.7 ± 0.7 |
| Central | SW | 9.0 ± 1.1 | 8.4 ± 2.2 | 3.0 ± 1.4 | 10.1 ± 0.8 | 8.5 ± 1.9 | 8.9 ± 1.1 |
| Central | SWMSP | 9.3 ± 1.0 | 7.4 ± 2.1 | 2.0 ± 0.5 | 10.0 ± 0.6 | 8.2 ± 2.0 | 5.1 ± 1.4 |
| North | CC | 6.4 ± 1.3 | 5.3 ± 1.7 | 2.3 ± 0.6 | 7.1 ± 1.1 | 4.8 ± 1.3 | 4.8 ± 1.0 |
| North | CCMSP | 6.9 ± 0.5 | 7.1 ± 1.0 | 1.2 ± 0.3 | 7.0 ± 0.2 | 7.5 ± 0.1 | 3.9 ± 1.2 |
| North | SW | 4.2 ± 0.7 | 1.8 ± 0.1 | 3.4 ± 0.5 | 4.8 ± 0.5 | 2.6 ± 0.1 | 4.8 ± 0.4 |
| North | SWMSP | 5.1 ± 0.5 | 2.5 ± 0.6 | 3.5 ± 0.5 | 6.2 ± 0.7 | 3.8 ± 0.5 | 5.9 ± 0.6 |
When the regions were tested together, the clearcut and shelterwood treatments had no effect on Lorey’s mean height (HL; Suppl. file S1: Table S7), while the Norway spruce was significantly taller than Scots pine (Table 3), this was true for the northern region as well. For the southern and central regions, the HL were significantly higher in the clearcut treatments compared to the shelterwood; Norway spruce trees were also significantly taller than Scots pine trees.
3.1.4 Basal area
The mean basal area ranged from 4.1 to 22.4 m2 ha–1 (Fig. 4). The clearcut and shelterwood treatments had no significant effect on basal area overall or for the southern and central region when tested separately (Suppl. file S1: Tables S8–S9). In the north however, where the shelterwood was still retained, the clearcuts had significantly higher basal area than shelterwood treatments. MSP significantly increased basal area as well.
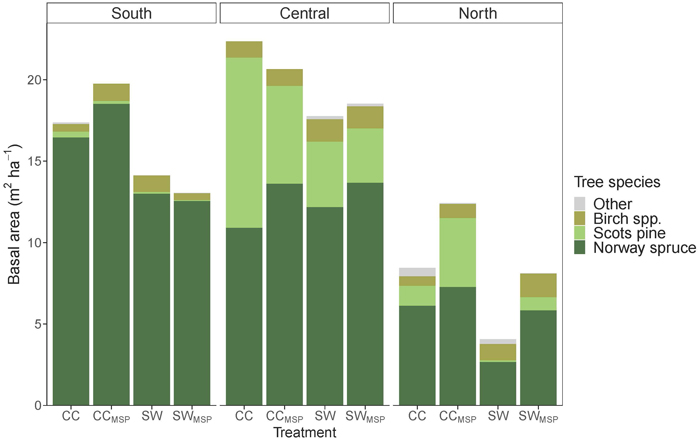
Fig. 4. Total basal area of the new regeneration for sites in southern, central and northern Sweden. The shelterwoods were still retained on the northern sites but were not included in the calculated basal area. The treatments are abbreviated CC = clearcut without mechanical site preparation, CCMSP = clearcut with mechanical site preparation, SW = shelterwood without mechanical site preparation, and SWMSP = shelterwood with mechanical site preparation.
3.1.5 Mixed forest
All southern sites, irrespective of clearcut or shelterwood treatments, had a Norway spruce basal area proportion exceeding 75% (Fig. 5), corresponding to a single-species stand. In contrast, on central and northern sites, Norway spruce accounted for less than 75% of the total basal area across all clearcut and shelterwood treatments.
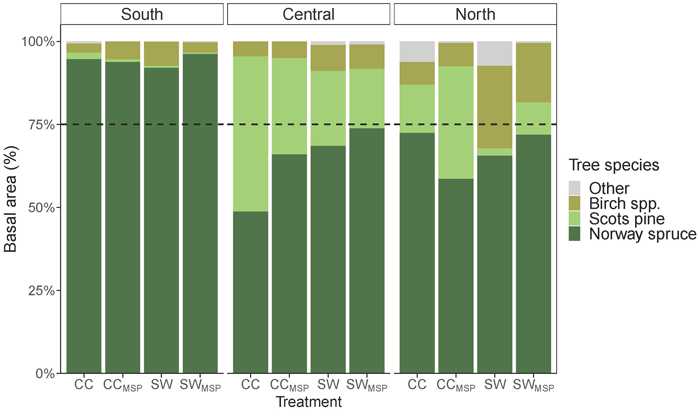
Fig. 5. Basal area divided by region and species in percent. The black dotted line shows the cut-off for mixed species stands (75%). The treatments are abbreviated CC = clearcut without mechanical site preparation, CCMSP
= clearcut with mechanical site preparation, SW = shelterwood without mechanical site preparation, and SWMSP = shelterwood with mechanical site preparation.
The ratio of QMD for Scots pine vs. Norway spruce was close to 1 in all the clearcut treatments but varied in the shelterwoods between 0.3 to 1.1 (Table 4; Fig. 6). In addition, the visualized diameter distributions of the four central sites demonstrated the same diameter range for the two species (Fig. 6).
| Table 4. The quadratic mean diameter (QMD) for Scots pine and Norway spruce and the QMD ratio for Scots pine vs. Norway spruce for the four central sites. The treatments are abbreviated CC = clearcut without mechanical site preparation, CCMSP = clearcut with mechanical site preparation, SW = shelterwood without mechanical site preparation, and SWMSP = shelterwood with mechanical site preparation. | ||||
| Site | Treatment | QMD (cm) | QMD ratio | |
| Scots pine | Norway spruce | |||
| 4 | CC, CCMSP | 11.1 | 11.5 | 1.0 |
| 4 | SW, SWMSP | 9.9 | 9.0 | 1.1 |
| 17 | CC, CCMSP | 10.6 | 10.9 | 1.0 |
| 17 | SW, SWMSP | 11.3 | 10.5 | 1.1 |
| 18 | CC, CCMSP | 8.8 | 6.8 | 1.3 |
| 18 | SW, SWMSP | 8.4 | 10.8 | 0.8 |
| 20 | CC, CCMSP | 10.8 | 11.9 | 0.9 |
| 20 | SW, SWMSP | 1.8 | 6.3 | 0.3 |
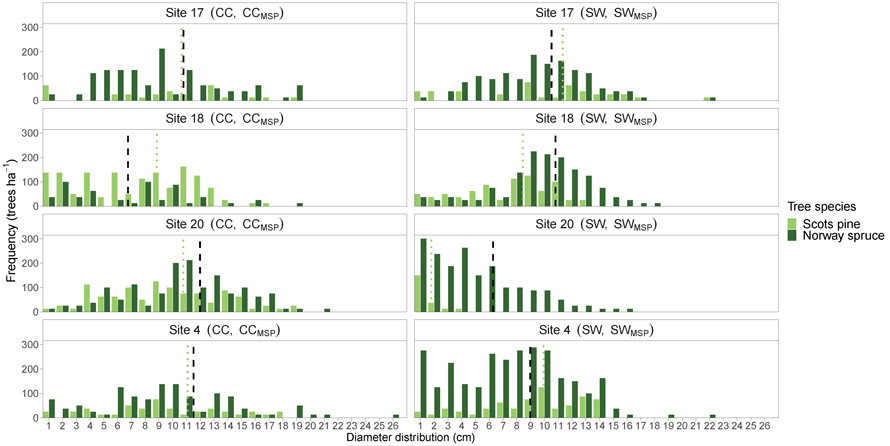
Fig. 6. The diameter distribution of Scots pine and Norway spruce for the clearcut treatments (with and without mechanical site preparation together) and shelterwood treatments (with and without mechanical site preparation together) for the four different sites in central Sweden. The vertical dashed lines represent the mean QMD for Scots pine (dotted, light green) and Norway spruce (dashed, black) for each site. The treatments are abbreviated CC = clearcut without mechanical site preparation, CCMSP = clearcut with mechanical site preparation, SW = shelterwood without mechanical site preparation, and SWMSP = shelterwood with mechanical site preparation. View larger in new window/tab.
3.2 Simulations
Using the defined criteria for the simulations, one or two thinnings were carried out in all sites and sub-treatments, except in three stands where thinnings were omitted due to low stem density (site 6, sub-treatment SWMSP; site 11, sub-treatment SW; and site 20, sub-treatment SW; Table 5). The first thinning was simulated when the stand age ranged from 29 to 66 years, with a corresponding basal area between 19 m2 ha–1 and 34 m2 ha–1. The wood volume removed during the first thinning ranged from 29.5 to 70.8 m3 ha–1. A second thinning was simulated in applicable 34–54-year-old stands, with basal area varying between 21 m2 ha–1 and 31 m2 ha–1. The wood volume removed during the second thinning ranged from 43.9 to 64.3 m3 ha–1. The optimal rotation age defined as the stand age at which the CF or LEV was maximized varied with the applied IR. At an IR of 0%, optimal rotation ages were the longest, ranging from 69 to 156 years, and with an IR of 4%, the optimal rotation ages were the shortest, ranging between 49 to 96 years.
| Table 5. Starting values for the different stands and treatments, as well as the simulated thinnings and ages at final harvest for the three different interest rates (IR). The values are shown per hectare. The treatments are abbreviated CC = clearcut without mechanical site preparation, CCMSP = clearcut with mechanical site preparation, SW = shelterwood without mechanical site preparation, and SWMSP = shelterwood with mechanical site preparation. View in new window/tab. |
3.2.1 The revenue or cost of shelterwood
Across the nine sites where simulations were conducted, the economic outcome of the shelterwood system relative to clearcutting varied depending on the IR applied (Table 6). At an IR of 0%, shelterwood treatments were more profitable than clearcutting across both the southern and central regions (except for site 16). In contrast, at IRs of 2.5% and 4%, shelterwood consistently resulted in a negative outcome relative to clearcutting, representing a relative loss regardless of region.
| Table 6. The financial outcome of the shelterwood by region (south and central) compared to the financial outcome of clearcutting in EUR ha–1 together with the mean and standard errors for the region. A positive number meant shelterwood was more profitable than clearcutting, whereas a negative number indicates that clearcutting was more profitable. | |||||||
| South | |||||||
| IR | Site | Mean | SE | ||||
| 6 | 7 | 11 | 15 | 16 | |||
| CF 0% | 1042 | 474.5 | 731.3 | 831.4 | –162.5 | 583.4 | 207.6 |
| LEV 2.5% | –873.0 | –1424.9 | –1776.4 | –654.7 | –2659.0 | –1478.4 | 355.7 |
| LEV 4% | –1797.5 | –2341.8 | –2987.0 | –1372.1 | –3864.4 | –2472.5 | 440.8 |
| Central | |||||||
| IR | Site | Mean | SE | ||||
| 4 | 17 | 18 | 20 | ||||
| CF 0% | 484.0 | 1318.8 | 305.4 | 752.1 | 715.0 | 221.2 | |
| LEV 2.5% | –1429.3 | –1041.1 | –2113.0 | –1328.2 | –1477.9 | 227.1 | |
| LEV 4% | –2352.9 | –2180.5 | –3280.5 | –2332.5 | –2536.6 | 251.0 | |
3.2.2 Cash flow and land expectation value
On the southern sites, CF and LEV were consistently higher for the clearcut treatments compared to the shelterwood treatments, irrespective of the IR applied (0%, 2.5%, and 4%; Table 7). CF and LEV remained positive across all treatments and IRs, except for the shelterwood treatments (SW and SWMSP) at a 4% IR, where LEV was negative. The inclusion of MSP resulted in an increase in CF and LEV for the clearcut treatments across all IRs. In contrast, for the shelterwood treatments, MSP led to a decrease in CF and LEV relative to the corresponding treatments without MSP. On the central sites, a similar pattern was observed: CF and LEV were consistently higher for the clearcut treatments compared to the shelterwood treatments, regardless of the IR. CF and LEV remained positive across all treatments and IRs, except for the shelterwood treatments (SW and SWMSP) at the 4% IR, where LEV was negative. However, unlike the southern sites, MSP consistently decreased CF and LEV on the central sites across all treatments, with one exception (IR 0% and the two shelterwood treatments).
| Table 7. Financial results of the simulated full rotation in EUR ha–1 with moderate wind damage. For IR 0%, cash flow (CF) is shown, whereas land expectation value (LEV) is shown for IR 2.5% and 4%. | ||||||||
| South | Central | |||||||
| IR | CC | CMSP | SW | SWMSP | CC | CMSP | SW | SWMSP |
| CF 0% | 470 | 508 | 415 | 413 | 493 | 487 | 461 | 472 |
| LEV 2.5% | 4142 | 5120 | 1727 | 1084 | 5896 | 4820 | 2809 | 2339 |
| LEV 4% | 118 | 430 | –2767 | –3250 | 1055 | 333 | –2313 | –2801 |
4 Discussion
4.1 Stand development
The combined method of naturally regenerated Scots pine and planted Norway spruce did not automatically result in mixed species stands (Fig. 5). On the southern sites, stands remained dominated by Norway spruce irrespective of initial regeneration treatment. In contrast, on the central and northern sites, stands developed into Norway-spruce-dominated mixed species stands regardless of treatment, with no single species exceeding 75% of the basal area (Fig. 5). This indicates the presence of nearby seed sources, as the clearcut treatments also developed into mixed species stands. Seeds may have originated from either the shelterwood or from adjacent stands. In central Sweden, the Scots pine trees are currently significantly shorter than the Norway spruce trees (Table 3). However, the QMD ratio between the two species is close to 1.0, with one exception (the shelterwood treatments on Site 20; Table 4). A comparable QMD between the two species gives better option for retaining a mixture after thinning, in systems where thinnings are usually done from below (Holmström et al. 2021; Persson 2022). In northern Sweden, however, a large proportion of the basal area consisted of broadleaved species, particularly in the shelterwood treatments. The shelterwood trees were still retained during our mid-rotation inventory and has thus continued to compete with the understory since planting.
To improve seedling establishment under shelterwood, delaying MSP to perform it just prior to a good seed year has been recommended (Karlsson and Örlander 2000; Lula et al. 2024). On fertile sites, this is rarely implemented in practice though due to potential production losses (Johansson et al. 2007) and the risk of increased competition from vegetation (Karlsson et al. 2002). During the first inventory, measurements showed that shelterwood and MSP had a positive effect on Scots pine seedling density three years after planting in the southern and central regions, but not in the north (Karlsson and Nilsson 2005; Nilsson et al. 2006). However, during the second measurement, five years after planting, most Scots pine seedlings in the southern region had disappeared and the positive effect was no longer observed. The authors speculated that this could be due to several factors, including ungulate browsing, pine weevil damage, or fungal diseases (Nilsson et al. 2006). Since these factors were not directly tested, the exact cause remains uncertain. The remaining Scots pine seedlings were smaller than the Norway spruce seedlings, and Nilsson et al. (2006) then speculated that the pine trees would most likely not be a substantial part of the future stand. We have now confirmed this with the mid-rotation inventory, where Scots pine represented only a small proportion of the stands in southern Sweden (Fig. 5). As a pioneer species, Scots pine is sensitive to competition (Malcolm et al. 2001), so in admixtures with larger seedlings of Norway spruce, interspecific competition increases and Scots pine is likely to be outcompeted.
Our mid-rotation inventory showed no differences in stand density, basal area, or QMD between treatments in the southern and central regions (Fig. 2; Fig. 4; Table 3). However, height was negatively affected by the shelterwood in both regions (Table 3). In central Sweden, height differences were already observed five years after planting, with Norway spruce seedlings being shorter in shelterwood treatments (Nilsson et al. 2006). In southern Sweden, no height differences were initially observed, but they became evident by the mid-rotation inventory, with taller trees in the clearcut treatments. Although the timing of shelterwood removal is unknown, the shelterwood remained present at least five years after planting (Nilsson et al. 2006). Thus, they most likely started to compete with the seedlings for nutrients, light and water (Axelsson et al. 2014; Häggström et al. 2024) before they were removed. Previous studies indicate that shelterwood competition typically becomes significant already a few growing seasons after planting (Strand et al. 2006; Tishler et al. 2020; Huth et al. 2022). The effect of competition from the shelterwoods was further visualized by the northern sites where retained, or forgotten, shelterwood resulted in significantly lower volumes and basal areas compared to clearcut treatments (Fig. 3; Fig. 4). All the sites in southern and central Sweden have most likely been pre-commercially thinned (Suppl. file S1: Table S1). Nonetheless, we found consistent results across all sites, despite the diversity in forest owners and unknown strategies in the tending of the young forest.
In southern and central Sweden, no long-term positive effects of MSP were observed for stand density, volume, or basal area (Figs. 2–4). This is somewhat unexpected, as MSP commonly improves seedling establishment through increased soil temperature sum (Nilsson and Örlander 1999; Nilsson et al. 2019), improved soil moisture availability (Nilsson and Örlander 1995; Löf et al. 2012), reduced vegetation competition (Löf et al. 1998; Johansson et al. 2013), and reduced pine weevil damage (Nordlander et al. 2005; Petersson et al. 2005; Nordlander et al. 2011; Wallertz et al. 2018). However, retained shelterwood can also reduce pine weevil damage (Petersson and Örlander 2003; Wallertz 2005) and limit ingrowth of competing vegetation (Béland et al. 2000; Lula et al. 2024). Additionally, all planted seedlings were treated with insecticide (forbidden in Sweden today), which likely improved survival rates across treatments. Another contributing factor may be seedling type. In southern Sweden, bare-rooted seedlings were used on half of the sites and containerized seedlings on the remaining sites (Nilsson et al. 2006). Bare-rooted seedlings were older (4–4.5 years) and thus most likely larger at planting than the containerized seedlings. Larger seedlings generally perform better under conditions of intense vegetation competition (Grossnickle and El-Kassaby 2015) and pine weevil pressure (Nordlander et al. 2011; Luoranen et al. 2017; Jonsson 2024), both of which are common when MSP is not applied in southern Sweden (Öhlund et al. 2025). The mid-rotation and early measurements highlight the importance of successful seedling establishment and early growth during the regeneration phase. Initial differences are generally retained throughout the rotation which has also been shown in other studies of long-term effects of establishment (Johansson et al. 2013; Hjelm et al. 2019; Jonsson et al. 2022).
4.2 Revenues and costs
4.2.1 Overstory
When no IR (IR 0%) was applied, the shelterwood cuttings were more profitable than the clearcutting, with one exception (Site 16; Table 6). In this case, the cost of splitting the harvest operation into two occurrences was balanced with the slight increased growth in the retained shelterwood trees. With an IR of 2.5% or 4%, which are more commonly used by forest companies in Sweden (Brukas et al. 2001), clearcutting was consistently more profitable than the shelterwood cuttings, with one exception (Site 17; Table 6). This indicates that although the retained shelterwood following the release cutting had more time and space to grow into higher-value timber, it was not sufficient to offset the increased harvesting costs associated with multiple entries in the forest. Lula et al. (2021) compared the LEV of seed-tree systems, shelterwood, and clearcutting under different levels of wind damage. Their results showed that when wind damage was assumed to be 9%, overstory retention was more profitable than clearcutting at an IR of 0%. At IR 2.5%, however, only the shelterwood produced higher LEV than clearcutting, seed-tree systems did not. Our results showed a similar pattern at IR 0%, whereas at IR 2.5%, the clearcut treatments consistently produced higher LEV than the shelterwood treatments. Which could potentially be explained by our shelterwood having lower densities than in Lula et al. (2021) study.
In the simulations of this study, the shelterwood was assumed to be removed 10 years after the release cutting, with 9% of the shelterwood basal area lost due to wind damage (Nilsson et al. 2006). Wind damage can vary between sites due to differences in stand characteristics and timing of wind events after cutting (Örlander 1995; Valinger and Fridman 2011; Albrecht et al. 2012). With higher wind damage, the revenue from the shelterwood cuttings would decrease. Additional operational constraints, not considered in the calculations of this study, is the complexity of shelterwood removal. Performing felling and logging while avoiding damaging future crop trees, typically reduces operational efficiency and increases costs (Hånell et al. 2000; Niemistö et al. 2024).
4.2.2 Understory
When comparing understory development over a full rotation between treatments, the southern and central regions showed different patterns (Table 5). In the southern region, the clearcut treatments consistently produced higher volumes than the shelterwood treatments when stands were harvested at the same time. However, because stands were harvested when the CF or LEV culminated, shelterwood treatments were sometimes harvested later, resulting in higher standing volumes at the time of harvest compared to the clearcut treatments. This outcome is not surprising, as differences in height and volume between the clearcut and shelterwood treatments were already evident in southern Sweden during our mid-rotation inventories. In central Sweden, the same pattern was not observed. At three out of the four sites, the shelterwood treatments generated higher volumes than the clearcut treatments, with one exception (Site 4 at IR 0%). In addition, rotation lengths in the shelterwood treatments were sometimes shorter, the same, or longer compared to the clearcut treatments. However, these differences in volume did not translate into higher CF or LEV in either region. For both regions, the CF was roughly the same for both the clearcut and shelterwood treatments (IR 0%; Table 7). Whereas the LEV were consistently higher for the clearcut treatments compared to the shelterwood treatments (Table 7). Which means that even for the central sites when the shelterwood treatments had a higher volume than the clearcut treatments, it was not enough to carry the extra cost from the shelterwood removal. Other studies (Hyytiäinen et al. 2006; Jonsson et al. 2022), showed that with a low IR (<2.5%), artificial regeneration gave a better financial result than natural regeneration. With higher IR however, the opposite was true. During the establishment phase of this experiment, between 2000 to 2500 Norway spruce seedlings ha–1 were planted, irrespective of clearcut or shelterwood treatment (Nilsson et al. 2006). Thus, the cost of between 2000 to 2500 Norway spruce seedlings was used during the calculation of CF and LEV. This explains why the clearcut treatments in this study produced higher financial returns than the shelterwood treatments. All sub-treatments had to carry the cost of planting, but the clearcut treatments avoided the additional harvesting costs from overstory retention. Today, in practical forestry, if the goal is to create a mixed species stand, between 1000 to 2000 seedlings ha–1 would be planted (Karlsson and Örlander 2004). It would lead to higher CF and LEV for the shelterwood treatments if seedling establishment is successful following natural regeneration, since the procurement of seedlings would be lower (Jonsson 2024).
Although the shelterwood treatments generated less income compared to the clearcutting treatments, it still produced positive CFs and LEVs over a full rotation (with the IR of 0% and 2.5%; Table 7). Indicating that regenerating with the combination method (using shelterwood and planting) may remain a viable silvicultural option, if the forest owner is not driven by maximizing the financial outcome.
5 Conclusions and management implications
In southern Sweden, natural regeneration of Scots pine failed, leading to Norway spruce monocultures regardless of treatment. This resulted in lower volumes and revenue in the shelterwood treatments compared to the clearcut treatments. In central Sweden, however, spruce-dominated mixed forests developed regardless of treatment. This suggests that when seed sources are nearby and survival of naturally regenerated Scots pine is high, mixed species stands can establish on clearcuts even when only one species is planted. The results also indicate that the combination method can work, provided that the Scots pine seedlings survive the establishment phase. With successful regeneration under a shelterwood, the total volume over a rotation is comparable to that obtained from regeneration following clearcutting. However, regenerating following clearcutting remained more profitable, due to higher costs of harvesting the shelterwood (the release cutting and final harvest of the shelterwood). The results from northern Sweden instead highlight the importance of management planning, as failing to remove the shelterwood negatively affected the development of the new stand. Overall, this study shows that establishing a new stand using the combination method can be successful, but the forest owner will most likely notice a slight reduced revenue compared to clearcutting.
Funding
The project was financed by the Swedish University of Agricultural Sciences (SLU), Södra forest owner association, the Petersson-Grebbe Foundation and Partnerskap Alnarp.
Data availability
The data that support the findings of this study are contained in the dataset Nyberg et al. (2026) and are openly accessible at: https://doi.org/10.5878/rmrv-xh80.
Acknowledgements
The authors would like to thank the researchers responsible for designing the experiment, the research assistants helping with field measurements and the funders for their financial support.
Author’s contribution
Research design (U.N and G.Ö), collection of data (T.S.N, H.A and E.H), data simulations (T.S.N, M.L., U.N, E.H) analyzing of data (T.S.N, E.H), all writers contributed to the writing process; all authors read and approved the submitted version.
Declaration of generative AI and AI-assisted technologies in the writing process
During the preparation of this work the authors used OpenAI, ChatGPT [Large language model] checking for grammar and spelling. After using this tool/service, the authors reviewed and edited the content as needed and takes full responsibility for the content of the publication.
References
Agestam E, Karlsson M, Nilsson U (2006) Mixed forests as a part of sustainable forestry in Southern Sweden. J Sustain Forest 21: 101–117. https://doi.org/10.1300/J091v21n02_07.
Albrecht A, Hanewinkel M, Bauhus J, Kohnle U (2012) How does silviculture affect storm damage in forests of south-western Germany? Results from empirical modeling based on long-term observations. Eur J Fores 131: 229–247. https://doi.org/10.1007/s10342-010-0432-x.
Andersson S-O (1954) Funktioner och tabeller för kubering av småträd. [Functions and tables for computing the cubic volume of small trees]. Medd Statens Skogsforskningsinst 44. https://res.slu.se/id/publ/125130.
Ara M, Barbeito I, Kalén C, Nilsson U (2021) Regeneration failure of Scots pine changes the species composition of young forests. Scand J Forest Res 37: 14–22. https://doi.org/10.1080/02827581.2021.2005133.
Axelsson EP, Lundmark T, Högberg P, Nordin A (2014) Belowground competition directs spatial patterns of seedling growth in boreal pine forests in Fennoscandia. Forests 5: 2106–2121. https://doi.org/10.3390/f5092106.
Bates D, Meachler M, Bolker B, Walker S (2015). Fitting linear mixed-effects models using lme4. J Stat Softw 67: 1–48. https://doi.org/10.18637/jss.v067.i01.
Béland M, Agestam E, Ekö PM, Gemmel P, Nilsson U (2000). Scarification and seedfall affects natural regeneration of Scots pine under two shelterwood densities and a clear-cut in southern Sweden. Scand J Forest Res 15: 247–255. https://doi.org/10.1080/028275800750015064.
Blennow K (2012) Adaptation of forest management to climate change among private individual forest owners in Sweden. Forest Policy Econ 24: 41–47. https://doi.org/10.1016/j.forpol.2011.04.005.
Brandel G (1990) Volymfunktioner för enskilda träd: tall, gran och björk. [Volume functions for individual trees: Scots pine (Pinus sylvestris), Norway spruce (Picea abies) and birch (Betula pendula & Betula pubescens)]. Swedish University of Agricultural Sciences, Garpenberg, Rapport 26.
Bravo-Oviedo A, Pretzsch H, Ammer C, Andenmatten E, Barbati A, Barreiro S, Brang P, Bravo F, Coll L, Corona P, den Ouden J, Ducey MJ, Forrester DI, Giergiczny M, Jacobsen JB, Lesinski J, Löf M, Mason WL, Matovic B, Metslaid M, Morneau F, Motiejunaite J, O’Reilly C, Pach M, Ponette Q, del Rio M, Short I, Skovsgaard JP, Soliño M, Spathelf P, Sterba H, Stojanovic D, Strelcova K, Svoboda M, Verheyen K, von Lüpke N, Zlatanov T (2014) European mixed forests: definition and research perspectives. For Syst 23: 518–533. https://doi.org/10.5424/fs/2014233-06256.
Brukas V, Thorsen BJ, Helles F, Tarp P (2001) Discount rate and harvest policy: implications for baltic forestry. Forest Policy Econ 2: 143–156. https://doi.org/10.1016/S1389-9341(01)00050-8.
Curtis RO, Marshall DD (2000) Technical note: why quadratic mean diameter? West J Appl For 15: 137–139. https://doi.org/10.1093/wjaf/15.3.137.
Dosumu B, Aldea J, Holmström E, Nilsson U (2024) Thinning strategies impact the productivity, perpetuity and profitability of mixed species stands. Scand J Forest Res 39: 217–225. https://doi.org/10.1080/02827581.2024.2390901.
Faustmann M (1849) Berechnung des wertes welchen waldboden sowie noch nicht haubare holzbestände für die waldwirtschaft besitzen. [Calculation of the value that forest soil and unharvestable timber stocks possess for forestry]. Allg Forst Jagdztg 15: 7–44.
Felton A, Ellingson L, Andersson E, Drössler L, Blennow K (2010) Adapting production forests in southern Sweden to climate change. Int J Clim Chang Str 2: 84–97. https://doi.org/10.1108/17568691011020274.
Felton A, Nilsson U, Sonesson J, Felton AM, Roberge J-M, Ranius T, Ahlström M, Bergh J, Björkman C, Boberg J, Drössler L, Fahlvik N, Gong P, Holmström E, Keskitalo ECH, Klapwijk MJ, Laudon H, Lundmark T, Niklasson M, Nordin A, Pettersson M, Stenlid J, Sténs A, Wallertz K (2016) Replacing monocultures with mixed-species stands: ecosystem service implications of two production forest alternatives in Sweden. Ambio 45: 124–139. https://doi.org/10.1007/s13280-015-0749-2.
Felton AM, Holmström E, Malmsten J, Felton A, Cromsigt J, Edenius L, Ericsson G, Widemo F, Wam HK (2020) Varied diets, including broadleaved forage, are important for a large herbivore species inhabiting highly modified landscapes. Sci Rep 10, article id 1904. https://doi.org/10.1038/s41598-020-58673-5.
Glöde D, Hannerz, M, Eriksson B (2003) Ekonomisk jämförelse av olika föryngringsmetoder. [Economic comparison of different establishment methods]. Skogforsk, Report 557. https://www.skogforsk.se/contentassets/e29dbb16bfa340b187bed0646ad338f2/arbetsrapport-557-2003.pdf. Accessed 12 January 2025.
Grossnickle SC, El-Kassaby YA (2015) Bareroot versus container stocktypes: a performance comparison. New Forest 47: 1–51. https://doi.org/10.1007/s11056-015-9476-6.
Hägglund B, Lundmark J-E (1977) Site index estimation by means of site properties, Scots pine and Norway spruce in Sweden. Stud For Suec 138. https://res.slu.se/id/publ/125433.
Häggström B, Gundale MJ, Nordin A (2024) Environmental controls on seedling establishment in a boreal forest: implications for Scots pine regeneration in continious cover forestry. Eur J Fores 143: 95–106. https://doi.org/10.1007/s10342-023-01609-1.
Haglöfs Sweden (n.d.) Vertex 5. https://haglofsweden.com/project/vertex-5/. Accessed 12 January 2025.
Hånell B, Nordfjell T, Eliasson L (2000) Productivity and costs in shelterwood harvesting. Scand J Forest Res 15: 561–569. https://doi.org/10.1080/028275800750173537.
Heiskanen J, Saksa T, Luoranen J (2013) Soil preparation affects outplanting success of Norway spruce container seedlings on till soils susceptible to frost heave. Silva Fenn 47, article id 893. https://doi.org/10.14214/sf.893.
Hjelm K, Nilsson U, Johansson U, Nordin P (2019) Effects of mechanical site preparation and slash removal on long-term productivity of conifer plantations in Sweden. Can J Forest Res 49: 1311–1319. https://doi.org/10.1139/cjfr-2019-0081.
Holmström E, Carlström T, Goude M, Lidman FD, Felton A (2021) Keeping mixtures of Norway spruce and birch in production forests: insights from survey data. Scand J Forest Res 36: 155–163. https://doi.org/10.1080/02827581.2021.1883729.
Holmström E, Gålnander H, Petersson M (2018) Within-site variation in seedling survival in Norway spruce plantations. Forests 10, article id 181. https://doi.org/10.3390/f10020181.
Holmström E, Hjelm K, Johansson U, Karlsson M, Valkonen S, Nilsson U (2016) Pre-commercial thinning, birch admixture and sprout management in planted Norway spruce stands in South Sweden. Scand J Forest Res 31: 56–65. https://doi.org/10.1080/02827581.2015.1055792.
Huth F, Wehnert A, Wagner S (2022) Natural regeneration of Scots pine requires the application of silvicultural treatments such as overstorey density regulation and soil preparation. Forests 13, article id 817. https://doi.org/10.3390/f13060817.
Huuskonen S, Domisch T, Finér L, Hantula J, Hynynen J, Matala J, Miina J, Neuvonen S, Nevalainen S, Niemistö P, Nikula A, Piri T, Siitonen J, Smolander A, Tonteri T, Uotila K, Viiri H (2021) What is the potential for replacing monocultures with mixed-species stands to enhance ecosystem services in boreal forests in Fennoscandia? Forest Ecol Manag 479, article id 118558. https://doi.org/https://doi.org/10.1016/j.foreco.2020.118558.
Jactel H, Nicoll B, Branco M, Gonzalez-Olabarria JR, Grodzki W, Långström B, Moreira F, Netherer S, Orazio C, Piou D, Santos H, Schelhaas MJ, Tojic K, Vodde F (2009) The influences of forest stand management on biotic and abiotic risks of damage. Ann For Sci 66: 701–701. https://dx.doi.org/10.1051/forest/2009054.
Johansson K, Nilsson U, Örlander G (2013) A comparison of long-term effects of scarification methods on the establishment of Norway spruce. Forestry 86: 91–98. https://doi.org/10.1093/forestry/cps062.
Jonsson A (2024) Long-term effects of forest regeneration success on volume produciton, economics and stand structure. Doctoral thesis. Acta Univ Agric Suec 77.. https://doi.org/10.54612/a.ab5c6jfqkc.
Jonsson A, Elfving B, Hjelm K, Lämås T, Nilsson U (2022) Will intensity of forest regeneration measures improve volume production and economy? Scand J Forest Res 37: 200–212. https://dx.doi.org/10.1080/02827581.2022.2085784.
Karlsson C, Örlander G (2000) Soil scarification shortly before a rich seed fall improves seedling establishment in seed tree stands of Pinus sylvestris. Scand J Forest Res 15: 256–266. https://doi.org/10.1080/028275800750015073.
Karlsson C, Örlander G (2004) Naturlig föryngring av tall. [Natural regeneration of pine]. Skogsstyrelsen, Report 4. https://res.slu.se/id/publ/6167.
Karlsson M, Nilsson U (2005) The effects of scarification and shelterwood treatments on naturally regenerated seedlings in southern Sweden. Forest Ecol Manag 205: 183–197. https://doi.org/https://doi.org/10.1016/j.foreco.2004.10.046.
Karlsson M, Nilsson U, Örlander G (2002) Natural regeneration in clear-cuts: effects of scarification, slash removal and clear-cut age. Scand J Forest Res 17: 131–138. https://doi.org/10.1080/028275802753626773.
Kershaw JA, Ducey MJ, Beers TW, Husch B (2016) Measurement of tree and stand growth. In: Forest Mensuration. Kershaw JA, Ducey MJ, Beers TW, Husch B (eds) John Wiley & Sons, pp 455–518. https://doi.org/10.1002/9781118902028.ch14.
Lämås T, Sängstuvall L, Öhman K, Lundström J, Årevall J, Holmström H, Nilsson L, Nordström E-M, Wikberg P-E, Wikström P, Eggers J (2023) The multi-faceted Swedish Heureka forest decision support system: context, functionality, design, and 10 years experiences of its use. Front For Glob Change 6, article id1163105. https://doi.org/10.3389/ffgc.2023.1163105.
Langvall O (2000) Interactions between near-ground temperature and radiation, silvicultural treatments and frost damage to Norway spruce seedlings. Doctoral thesis. Acta Univ Agric Suec Silvest 140. https://res.slu.se/id/publ/107648.
Langvall O, Örlander G (2001) Effects of pine shelterwoods on microclimate and frost damage to Norway spruce seedlings. Can J Forest Res 31: 155–164. https://doi.org/10.1139/x00-149.
Lee D, Holmström E, Hynynen J, Nilsson U, Korhonen KT, Westerlund B, Bianchi S, Aldea J, Huuskonen S (2023) Current state of mixed forests available for wood supply in Finland and Sweden. Scand J Forest Res 38: 442–452. https://doi.org/10.1080/02827581.2023.2259797.
Lodin I, Brukas V, Wallin I (2017) Spruce or not? Contextual and attitudinal drivers behind the choice of tree species in southern Sweden. Forest Policy Econ 83: 191–198. https://doi.org/10.1016/j.forpol.2016.11.010.
Löf M, Gemmel P, Nilsson U, Welander N T (1998) The influence of site preparation on growth in Quercus robur L. seedlings in a southern Sweden clear-cut and shelterwood. Forest Ecol Manag 109: 241–249. https://doi.org/10.1016/S0378-1127(98)00254-0.
Lula M, Trubins R, Ekö PM, Johansson U, Nilsson U (2021) Modelling effects of regeneration method on the growth and profitability of Scots pine stands. Scand J Forest Res 36: 263–274. https://doi.org/10.1080/02827581.2021.1908591.
Lula M, Domevscik M, Hjelm K, Andersson M, Johansson U, Wallertz K, Nilsson U (2024)Recruitment dynamics of naturally regenerated Scots pine under different overstorey densities in southern Sweden. Scand J Forest Res 39: 402–410. https://doi.org/10.1080/02827581.2024.2443058.
Lundmark T, Hällgren J-E (1987) Effects of frost on shaded and exposed spruce and pine seedlings planted in the field. Can J Forest Res 17: 1197–1201. https://doi.org/10.1139/x87-184.
Luoranen J. Viiri H, Sianoja M, Poteri M, Lappi J (2017) Predicting pine weevil risk: effects of site, planting spot and seedling level factors on weevil feeding and mortality of Norway spruce seedlings. Forest Ecol Manag 389: 260–271. https://doi.org/10.1016/j.foreco.2017.01.006.
Malcom DC, Mason WL, Clarke GC (2001) The transformation of conifer forests in Britain – regeneration, gap size and silvicultural systems. Forest Ecol Manag 151: 7–23. https://doi.org/10.1016/S0378-1127(00)00692-7.
Man R, Lieffers V J (1999) Effects of shelterwood and site preparation on microclimate and establishment of white spruce seedlings in a boreal mixedwood forest. Forest Chron 75: 837–844. https://doi.org/10.5558/tfc75837-5.
Månsson J, Kalén C, Kjellander P, Andrén H, Smith H (2007) Quantitative estimates of tree species selectivity by moose (Alces alces) in a forest landscape. Scand J Forest Res 22: 407–414. https://doi.org/10.1080/02827580701515023.
Miina J, Saksa T (2008) Predicting establishment of tree seedlings for evaluating methods of regeneration for Pinus sylvestris. Scand J Forest Res 23: 12–27. https://doi.org/10.1080/02827580701779595.
Näslund M (1947) Funktioner och tabeller för kubering av stående träd: tall, gran och björk i södra Sverige samt i hela landet. [Functions and tables for computing the cubic volume of standing trees: Scots pine, Norway spruce and birch in southern Sweden and in the whole of Sweden]. Medd Statens Skogsforskningsinst 36(3). https://res.slu.se/id/publ/125049.
Niemistö P, Korpunen H, Nuutinen Y (2024) Harvesting efficiency and understory damage with different cutting methods on two storied stands of silver birch and Norway spruce. Silva Fenn 58, article id 23065. https://doi.org/10.14214/sf.23065.
Nilsson O, Hjelm K, Nilsson U (2019) Early growth of planted Norway spruce and Scots pine after site preparation in Sweden. Scand J Forest Res 34: 678–688. https://doi.org/10.1080/02827581.2019.1659398.
Nilsson U, Örlander, G (1995) Effects of regeneration methods on drought damage to newly planted Norway spruce seedlings. Can J Forest Res 25: 790–802. https://doi.org/10.1139/x95-086.
Nilsson U, Örlander G (1999) Vegetation management on grass-dominated clearcuts planted with Norway spruce in southern Sweden. Can J Forest Res 29: 1015–1026. https://doi.org/10.1139/x99-071.
Nilsson U, Örlander G, Karlsson M (2006) Establishing mixed forests in Sweden by combining planting and natural regeneration – effects of shelterwoods and scarification. Forest Ecol Manag 237: 301–311. https://doi.org/10.1016/j.foreco.2006.09.053.
Nilsson U, Luoranen J, Kolström T, Örlander G, Puttonen P (2010) Reforestation with planting in northern Europe. Scand J Forest Res 25: 283–294. https://doi.org/10.1080/02827581.2010.498384.
Nordlander G, Bylund H, Örlander G, Wallertz K (2003) Pine weevil population density and damage to coniferous seedlings in a regeneration area with and without shelterwood. Scand J Forest Res 18: 438–448. https://doi.org/10.1080/02827580310001634.
Nordlander G, Bylund H, Björklund N (2005) Soil type and microtopography influencing feeding above and below ground by the pine weevil Hylobius abietis. Agr Forest Entomol 7: 107–113. https://doi.org/10.1111/j.1461-9555.2005.00257.x.
Nordlander G, Hellqvist C, Johansson K, Nordenhem H (2011) Regeneration of European boreal forests: effectiveness of measures against seedling mortality caused by the pine weevil Hylobius abietis. Forest Ecol Manag 262: 2354–2363. https://doi.org/10.1016/j.foreco.2011.08.033.
Öhlund J, Berglund M, Johansson F, Fahlvik N, Ahlinder J, Renman C, Krook M, Vestlund M (2025) Årsrapport föryngringskollen: resultat 2024. [Yearly report regeneration results 2024]. Skogforsk, Arbetsrapport 1241-2025.
Örlander G (1995) Stormskador i sydsvenska tallskärmar. [Storm damage in southern Swedish pine shelterwood] Skog & Forskning 3: 52–56.
Persson M (2022) Evaluating thinnning practices and assessment methods for improved management in coniferous production forests in southern Sweden. Linnaeus University Dissertations 469. https://doi.org/10.15626/LUD.469.2022.
Petersson M, Örlander G (2003) Effectiveness of combinations of shelterwood, scarification, and feeding barriers to reduce pine weevil damage. Can J Forest Res 33: 64–73. https://doi.org/10.1139/x02-156.
Petersson M, Örlander G, Nordlander G (2005) Soil features affecting damage to conifer seedlings by the pine weevil Hylobius abietis. Forestry 78: 83–92. https://doi.org/10.1093/forestry/cpi008.
Rabelo Braga S, Leles Romarco de Oliveria M, Bastos Gorgens E (2023) forestmangr: forest mensuration and management (R package version 0.9.5) [Software]. https://CRAN.R-project.org/package=forestmangr. Accessed 12 January 2025.
Serrano-León H, Ahtikoski A, Sonesson J, Fady B, Lindner M, Meredieu C, Raffin A, Perret S, Perot T, Orazio C (2021) From genetic gain to economic gain: simulated growth and financial performance of genetically improved Pinus sylvestris and Pinus pinaster planted stands in France, Finland and Sweden. Forestry 94: 512–525. https://doi.org/10.1093/forestry/cpab004.
Sikström U, Hjelm K, Holt Hanssen K, Saksa T, Wallertz K (2020) Influence of mechanical site preparation on regeneration success of planted conifers in clearcuts in Fennoscandia – a review. Silva Fenn 54, article id 10172. https://doi.org/10.14214/sf.10172.
Simonsen R (2013) Optimal regeneration method – planting vs. natural regeneration of Scots pine in northern Sweden. Silva Fenn 47, article id 928. https://doi.org/10.14214/sf.928.
Simonsen R, Rosvall O, Gong P, WIbe S (2010) Profitability of measures to increase forest growth. Forest Policy Econ 12: 473–482. https://doi.org/10.1016/j.forpol.2010.03.002.
Skogsstyrelsen (2024) Statistiskdatabas. [Statistical database].
Skogsstyrelsen (2025) Statistiskdatabas. [Statistical database]. https://www.skogsstyrelsen.se/statistik/statistikdatabas/. Accessed 8 July 2025.
SLU (2023) Skogsdata 2023. [Forest statistics 2023]. SLU Instutitionen för skoglig resurshushållning.
SLU (2024) Skogsdata 2024. [Forest statistics 2024]. SLU Instutitionen för skoglig resurshushållning.
Strand M, Löfvenius M O, Bergsten U, Lundmark T, Rosvall O (2006) Height growth of planted conifer seedlings in relation to solar radiation and position in Scots pine shelterwood. Forest Ecol Manag 224: 258–265. https://doi.org/10.1016/j.foreco.2005.12.038.
Tishler M, Tullus T, Tullus A, Jäärats A, Lutter R, Lundmark T, Tullus H (2020) Effects of shelterwood method and plant stock type on the early growth and survival of pine seedlings in regeneration stands under hemiboreal conditions. Scand J Forest Res 35: 85–95. https://doi.org/10.1080/02827581.2019.1707273.
Valinger E, Fridman J (2011) Factors affecting the probability of windthrow at stand level as a result of Gudrun winter storm in southern Sweden. Forest Ecol Manag 262: 398–403. https://doi.org/10.1016/j.foreco.2011.04.004.
Von Sydow F, Örlander G (1994) The influence of shelterwood density on Hylobius abietis (L.) occurrence and feeding on planted conifers. Scand J Forest Res 9: 367–375. https://doi.org/10.1080/02827589409382853.
Wallertz K (2005) Pine weevil Hylobius abietis feeding in shelterwood systems. Swedish University of Agricultural Sciences. https://res.slu.se/id/publ/13178.
Wallertz K (2009) Pine weevil feeding in Scots pine and Norway spruce regenerations. Doctoral thesis. Acta Univ Agric Suec 60. https://res.slu.se/id/publ/26223.
Wallertz K, Nordlander G, Örlander G (2006) Feeding on the roots in the humus layer by adult pine weevil, Hylobius abietis. Agr Forest Entomol 8: 273–279. https://doi.org/10.1111/j.1461-9563.2006.00306.x.
Wallertz K, Björklund N, Hjelm K, Petersson M, Sundblad L G (2018) Comparison of different site preparation techniques: quality of planting spots, seedling growth and pine weevil damage. New Forest 49: 705–722. https://doi.org/10.1007/s11056-018-9634-8.
Total of 85 references.

