Samuel Egbäck  ,
Urban Nilsson,
Kenneth Nyström,
Karl-Anders Högberg,
Nils Fahlvik
,
Urban Nilsson,
Kenneth Nyström,
Karl-Anders Högberg,
Nils Fahlvik
Modeling early height growth in trials of genetically improved Norway spruce and Scots pine in southern Sweden
Egbäck S., Nilsson U., Nyström K., Högberg K.-A., Fahlvik N. (2017). Modeling early height growth in trials of genetically improved Norway spruce and Scots pine in southern Sweden. Silva Fennica vol. 51 no. 3 article id 5662. https://doi.org/10.14214/sf.5662
Highlights
- The developed height growth model based on unimproved material predicted the development relatively well for genetically improved Norway spruce
- For genetically improved Scots pine, however, the model needed to be modified
- By incorporating a genetic component into the Scots pine model, the prediction errors were reduced.
Abstract
Genetically improved Norway spruce (Picea abies (L.) Karst.) and Scots pine (Pinus sylvestris L.) are used extensively in operational Swedish forestry plantations to increase production. Depending on the genetic status of the plant material, the current estimated genetic gain in growth is in the range 10–20% for these species and this is expected to increase further in the near future. However, growth models derived solely from data relating to genetically improved material in Sweden are still lacking. In this study we investigated whether an individual tree growth model based on data from unimproved material could be used to predict the height increment in young trials of genetically improved Norway spruce and Scots pine. Data from 11 genetic experiments with large genetic variation, ranging from offspring of plus-trees selected in the late 1940s to highly improved clonal materials selected from well performing provenances were used. The data set included initial heights at the age of 7–15 years and 5-year increments for almost 2000 genetic entries and more than 20 000 trees. The evaluation indicated that the model based on unimproved trees predicted height development relatively well for genetically improved Norway spruce and there was no need to incorporate a genetic component. However, for Scots pine, the model needed to be modified. A genetic component was developed based on the genetic difference recorded within each trial, using mixed linear models and methods from quantitative genetics. By incorporating the genetic component, the prediction errors were significantly reduced for Scots pine. This study provides the first step to incorporate genetic gains into Swedish growth models and forest management planning systems.
Keywords
Pinus sylvestris;
Picea abies;
individual tree growth model;
genetic component;
genetic multiplier;
unimproved material;
improved material
-
Egbäck,
Swedish University of Agricultural Sciences, Southern Swedish Forest Research Centre, P.O. Box 49, 230 53 Alnarp, Sweden
E-mail
samuel.egback@slu.se
- Nilsson, Swedish University of Agricultural Sciences, Southern Swedish Forest Research Centre, P.O. Box 49, 230 53 Alnarp, Sweden E-mail urban.nilsson@slu.se
- Nyström, Swedish University of Agricultural Sciences, Department of Forest Resource Management, Skogsmarksgränd, 901 83 Umeå, Sweden E-mail kenneth.nystrom@slu.se
- Högberg, Skogforsk, Ekebo, 268 90 Svalöv, Sweden E-mail karl-anders.hogberg@skogforsk.se
- Fahlvik, Swedish University of Agricultural Sciences, Southern Swedish Forest Research Centre, P.O. Box 49, 230 53 Alnarp, Sweden E-mail nils.fahlvik@slu.se
Received 20 February 2017 Accepted 18 May 2017 Published 28 May 2017
Views 138865
Available at https://doi.org/10.14214/sf.5662 | Download PDF

1 Introduction
Norway spruce (Picea abies (L.) Karst.) and Scots pine (Pinus sylvestris L.) are, commercially, the two most important tree species in Sweden and breeding programs for them have been ongoing since the 1940s. Today some 350 million seedlings of Norway spruce and Scots pine are planted each year. About 70% of the Norway spruce and 90% of the Scots pine seedlings are genetically improved (Swedish Forest Agency 2013). The improvement programs are directed towards genetic gain in traits that are economically important in terms of both quantity and quality. The estimated potential genetic gain with respect to increased volume growth in the current supply of improved plant material is in the range 10–20% compared to unimproved material (Rosvall et al. 2001). In coming years, this gain will increase to about 25% as new seed orchards produce superior genetic material (Rosvall and Wennström 2008). The substantial increase in production suggests that existing growth models may need to be revised.
Current growth models in Sweden (e.g. Elfving 1982; Söderberg 1986; Fahlvik and Nyström 2006) are based on data from sample plots in largely unimproved stands, and the effect of genetic improvements is not explicitly taken into consideration. For instance, the height increment model by Fahlvik and Nyström (2006), predicts the 5-year height increment for young stands in southern Sweden by using initial height, total age, site index and temperature sum as explanatory variables. These variables may not be sensitive enough to predict the development of genetically improved material reliably. Keeping the model as it is may, therefore, lead to biased growth predictions and may result in suboptimal forest management. Accurate and appropriate growth models are becoming more and more important as the area planted with improved material is increasing, and as the genetic gain resulting from improvement programs also increases. Different approaches can be taken into consideration to incorporate the effect of genetic gain into growth models. One alternative could be to develop new empirical models or refit growth equations specifically for improved material (Gould and Marshall 2010). However, long-term growth data from genetically improved stands obtained from representative forest land are often unavailable so, in many cases this is not feasible. In addition, as tree breeding continues, new generations of improved material are produced before the previous generation has completed its rotation, leaving the growth modelers constantly one step behind the genetic improvement. Instead, a more common approach is to change the site index based on height–age curves for dominant trees to reflect increased height growth rates (Kurinobu and Shingai 1987; Sprinz et al. 1989; Danjon 1995; Bullock et al. 2010; Ahtikoski et al. 2012). In a study on loblolly pine (Pinus taeda L.), Buford and Burkhart (1987) found that genetics influence the asymptote but not the shape of the height-age curves, which means that genetic improvement can be modeled by simply changing site index. In a similar loblolly pine study, Knowe and Foster (1989) found significant differences among families with respect to the asymptote and rate parameter but not the shape parameter using the Chapman-Richard model. However, in a study on loblolly pine by Adams et al. (2006), it was found that merely adjusting site index had little effect on the projected stand volume. In order to produce better estimates of the future stand volume for genetically improved material, also modifications of other models in the growth simulator were needed, e.g. spacing by family-specific survival functions and family-specific diameter functions.
Another approach, which requires moderate modification of current growth models, is to use genetic multipliers. These have been developed to reflect the relative growth difference between improved and unimproved material (Hamilton and Rehfeldt 1994; Carson et al. 1999; Gould et al. 2008; Gould and Marshall 2010). This means that genetic multipliers modify predicted height or diameter while the original function of the model remains unchanged. An advantage with this approach is that estimated genetic gains or breeding values from genetic trials can be included directly in the models without transforming genetic gains to site-index changes. An example of this is the study by Gould et al. (2008) on Douglas fir (Pseudotsuga menziesii [Mirb.] Franco), where genetic multipliers were developed from height and diameter breeding values to improve growth predictions based on existing models.
The objectives of the present study were (1) to develop models for individual tree height increment in young Scots pine and Norway spruce stands distributed all over Sweden, (2), to evaluate whether these models can predict the early height growth of genetically improved material and, if necessary, (3) to generate a suitable genetic component for improved Norway spruce and Scots pine in Sweden.
2 Materials and methods
2.1 Height growth models
Models for individual tree height growth in Scots pine and Norway spruce in young stands in Sweden were developed based on data from the HUGIN young stand survey (Elfving 1982; Nyström 2001). The data comprised a large number of stands that were established in the period 1950–1965. At this time, genetically improved material was not used in operational plantations, thus the data reflect unimproved material. In the period 1976–79, permanent plots were established in about 800 young stands with a mean height of about 3–4 m, distributed throughout Sweden. In each stand, five circular plots measuring 100 m2 were randomly sampled. After five years, during the period 1981–1984, the plots were measured again. Previously, Fahlvik and Nyström (2006) had developed tree height increment models for southern Sweden, using a subsample of plots situated south of latitude 60°N. In the present study, individual tree data from Scots pine and Norway spruce dominated plots (i.e. if more than 65% of the basal area belonged to the target species) were used. Furthermore, only plots without presence of overstory and plots with more than 500 stems per hectare were used. Descriptive statistics of plot and tree data at the first measurement are provided in Table 1 and 2. Except for selection of the calibration data set from the HUGIN young stand survey, the processing of data and the statistical methods were similar to those used by Fahlvik and Nyström (2006).
| Table 1. Calibration data. Mean, standard deviation (SD) and maximum values of some plot characteristics, at the first measurement, by stand type. | |||||||||||||||
| Stand type | Site index*, m | Density, stems ha–1 | Age, years | Mean height**, m | |||||||||||
| Mean | SD | Max | Mean | SD | Max | Mean | SD | Max | Mean | SD | Max | ||||
| Scots pine (N = 899) | 20.2 | 4.0 | 32 | 2679 | 1063 | 6000 | 21.8 | 4.4 | 38 | 3.6 | 2.0 | 13.4 | |||
| Norway spruce (N = 498) | 24.7 | 5.3 | 36 | 2645 | 1026 | 5800 | 21.2 | 3.7 | 38 | 4.3 | 2.2 | 15.4 | |||
| * Site index according to site properties (Hägglund and Lundmark 1977) ** Height weighted mean height | |||||||||||||||
| Table 2. Calibration data. Mean, standard deviation (SD) and maximum values of some tree characteristics, at the first measurement, by tree species. | |||||||||||
| Tree species | Tree height (h), m | ih5* | hci** | ||||||||
| Mean | SD | Max | Mean | SD | Max | Mean | SD | Max | |||
| Scots pine (N = 10201) | 3.9 | 2.4 | 15.6 | 1.8 | 0.8 | 6.3 | 26.2 | 30.5 | 345 | ||
| Norway spruce (N = 8163) | 4.0 | 2.7 | 19.2 | 1.9 | 1.1 | 6.0 | 38.7 | 41.1 | 349 | ||
| * ih5 = Height increment for the 5-year period ** hci = Distance-independent competition index (Table 6) | |||||||||||
The prediction variable used was the 5-year height increment (ih5) in meters. For Norway spruce and Scots pine, the predictors were initial height (m), mean height, total age, distance-independent competition index (sum of the height square (Σh2) ×0.1 of all trees taller than the subject tree in the 100 m2 plot), site index according to site properties such as altitude, latitude, soil moisture, field vegetation, water flow, etcetera (Hägglund and Lundmark 1977) and/or combination of these based on experience from the study by Fahlvik and Nyström (2006). For Norway spruce, two indicator variables were also included describing whether the plot was established by planting and whether the plot had been pre-commercially thinned during the previous 10 years. The following general exponential model was used:
![]()
where β0 is a constant, βi form a vector of coefficients for the independent variables (Xi) and ε is a random error component. The random error terms considered were assumed to be independent and identically distributed:
![]()
where ep is the random variation between plots and et(p) is the random variation between trees within plots. The distributional assumptions of the error terms were:
ep ~ NID(0,σp2), et(p) ~ NID(0, σt2), and tied as: σɛ2 = σp2 + σt2.
The parameters of the independent variables and the variance of the random effects in the non-linear models were estimated using the PROC NLMIXED procedure in the SAS software (SAS Institute Inc. 2008).
2.1.1 Validation of height growth models
The height growth models were validated with an independent data set that originated from pre-commercial thinning experiments (Pettersson 1992). Data from 307 permanent sample plots in 56 different locations were used. The plots were planted or naturally regenerated and pre-commercially thinned to various densities. The data represent even-aged monocultures of Scots pine or Norway spruce all over Sweden (Table 3). The plots were mainly established using local provenances so this data could be considered to originate from genetically unimproved material. The plots were of various sizes, with an average for Norway spruce of 400 m2 and an average for Scots pine of 380 m2. The plots were measured at 5-year intervals. Diameter at breast height was measured for every tree, while total height was measured for systematically selected trees. The height of trees for which only the diameter at breast height was recorded was calculated by estimating coefficients for each plot to be used in a height-curve function developed by Näslund (1936). The estimated heights were then used to calculate mean height and competition index on the plots. However, when validating the height increment model, only sample trees with a measured height increment were used.
| Table 3. Validation data. Mean, standard deviation (SD) and maximum values of some plot characteristics, at the first measurement, by tree species. | |||||||||||||||
| Site index*, m | Density, stems ha–1 | Age, years | Mean height**, m | ||||||||||||
| Mean | SD | Max | Mean | SD | Max | Mean | SD | Max | Mean | SD | Max | ||||
| Scots pine (N = 224) | 24.5 | 3.4 | 31.2 | 2770 | 1790 | 18430 | 26 | 9 | 50 | 6.5 | 2.7 | 14.3 | |||
| Norway spruce (N = 83) | 32.2 | 4.8 | 38.4 | 2540 | 1480 | 8370 | 23.5 | 6 | 38 | 7.1 | 2.4 | 12.3 | |||
| * Site index according to site properties (Hägglund and Lundmark 1977) ** Height-weighted mean heigh | |||||||||||||||
2.2 Evaluation of the height growth models on genetically improved material
The height growth model developed using unimproved material was evaluated for genetically improved material using five Norway spruce and six Scots pine single tree plot trials (mixed family composition within the block) (Table 4). These experiments varied greatly with respect to the degree of genetic improvement, ranging from offspring of plus-trees selected in the late 1940s to highly improved clonal material selected from well-performing provenances. In total, almost 2000 genetic entries including more than 20 000 trees were included in the study. The initial tree spacing varied between 1.4×1.4 m and 2.0×2.0 m. Height was measured on two occasions. The first height measurement was undertaken at the total age of 7–15 years and the second was five years later. The average height per trial on these two occasions was in the range 1.3–3.4 m and 2.6–6.9 m, respectively. On both occasions the height of all trees was measured.
| Table 4. Key features of the trials from which the data for genetically improved trees were obtained. View in new window/tab. |
The competition index was calculated for each tree by summing the heights of all the taller neighboring trees closer than 5.6 m to the subject tree. This approach of estimating competition index differs from the calculation of competition index in the height growth model. For the HUGIN data (section 2.1) competition index was a spatially non-explicit index where the spatial location of the subject tree within the 100 m2 plot did not affect the calculation of the index. For the genetically improved material, the competition index was calculated as a semi-spatially explicit index, which enabled a more precise estimate of the competition around the subject tree by placing the subject to the center of the 100 m2 plot. Trees growing less than 5.6 m from the edge of the trial were not evaluated as competition index could not be calculated for these trees. Site index was specified for each trial based on the site-specific properties (Hägglund and Lundmark 1977).
Predicted height increment between the two measurement occasions was (![]() ) compared with observed height increment (ihijm) to evaluate the growth model for improved trees:
) compared with observed height increment (ihijm) to evaluate the growth model for improved trees:
![]()
where ihijm is the observed height increment of tree m belonging to trial i and genetic entry j, ![]() is the predicted height increment of that tree and Pijm is the prediction error. Mean prediction error (MPE) and root mean square error (RMSE) were calculated to evaluate the accuracy of the height growth model.
is the predicted height increment of that tree and Pijm is the prediction error. Mean prediction error (MPE) and root mean square error (RMSE) were calculated to evaluate the accuracy of the height growth model.
To evaluate whether the prediction errors exhibit a trend over improvement level, the predicted genetic effect (PGEij) was estimated for each genetic entry j within each trial i based on the tree heights from the first measurement using:
![]()
where Yijkm is the height (in meters) of tree m belonging to genetic entry j in block k and trial i, µ is the overall mean height, gij is the random effect of genetic entry j within trial i, bik is the fixed effect of block k within trial i, and εijkm is the residual error. The MIXED procedure in the SAS software (SAS Institute, Inc., 2008) was used to estimate the parameters.
From Eq. 4 the random genetic effect of entry j within trial i (gij) was divided with trial mean height (µi) to reflect the genetic performance of entry j within trial i. For the full-sib trial, the trial mean height reflected 10% increased height compared to unimproved material (Rosvall et al. 2001), where 6% was due to the plus-tree selection and 4% due to better seed quality and less inbreeding. In order for PGE to reflect the relationship to unimproved material, the genetic entries had a base line of 1.10 multiplied to their estimated PGE values to reflect a 10% increase from the unimproved level. Similar adjustments were applied to the half-sib trials, where the mean height reflected 3% increased height compared to unimproved material. Compared to the full-sib trial, these trials had no effect of better seed quality or less inbreeding and the plus-tree selection effect could only capture half of the selection effect. Thus, the genetic entries in the half-sib trials had a base line of 1.03 multiplied to their estimated PGE values. Similar adjustments were applied to the clone trials, where the mean height reflected 15% increased height compared to unimproved material (Karlsson 1993). In the trials the genetic gain consisted of a provenance effect of 8% (Persson and Persson 1992) and a selection effect of 7% resulting from choosing superior clones (Rosvall et al. 2001). Thus, the genetic entries in the clonal trials had a base line of 1.15 multiplied to their estimated PGE values:
![]()
By subtracting with 1, unimproved material achieved a PGE equivalent to 0. As a result of this procedure, PGE resembles genetic gain and these two concepts are used synonymously in this study.
2.3 Genetic component
PGE values were incorporated into the original height growth model (Eq. 1) to generate a common component for genetic gain (β1 × PGE) for all trials:
![]()
The coefficient β1 was estimated from:

where ihijm is the observed height increment of tree m belonging to trial i and genetic entry j, ![]() is the estimated height increment of same tree based on the unadjusted height growth model, PGEij is the fixed effect of the predicted genetic effect of genetic entry j belonging to trial i, ti is the random effect for trial i and εijm is the residual error. The NLMIXED procedure in the SAS software (SAS Institute Inc. 2008) was used to estimate the coefficients.
is the estimated height increment of same tree based on the unadjusted height growth model, PGEij is the fixed effect of the predicted genetic effect of genetic entry j belonging to trial i, ti is the random effect for trial i and εijm is the residual error. The NLMIXED procedure in the SAS software (SAS Institute Inc. 2008) was used to estimate the coefficients.
3 Results
3.1 Height growth models
Parameter estimates for the final height growth models based on unimproved material are presented in Table 5 and with variable definitions in Table 6. Like the height growth models for southern Sweden produced by Fahlvik and Nyström (2006), initial height was the most important variable in the models. Furthermore, comparing the models for Norway spruce and Scots pine, initial height and site conditions had greater impact on height increment for Norway spruce than Scots pine. By including the height square sum of trees larger than the subject tree (hci), there was no need of including neither variables for overall competition nor variables for relative dominance, such as relative height. The performance of the height models proved to be rather satisfactory with relatively unbiased predictions within the variation of tree, stand and site variables in the calibration data. The residual analyses revealed no clear trends for the prediction errors over estimated height increment (Fig. 1) or initial plot mean height (Fig. 2). However, the model underestimated height growth of Scots pine trees with initial heights above 10 m (Fig. 3). The prediction errors for site index (Fig. 4) and competition index (Fig. 5), were fairly unbiased with no obvious trends.
| Table 5. Parameter estimates for height growth models for individual trees in young stands of Scots pine and Norway spruce in Sweden. Dependent variable ih5, m. For variable explanation, see Table 6. | ||||
| Pine, n = 10201 | Spruce, n = 8163 | |||
| Variable | Parameter | SEE b | Parameter | SEE b |
| constant | –1.6474 | 0.05294 | –3.3560 | 0.08291 |
| h | –0.1213 | 0.004164 | –0.1431 | 0.004974 |
| ln(h) | 0.5728 | 0.01549 | 0.6222 | 0.04098 |
| hci/(0.1 + h) | –0.01329 | 0.000583 | –0.02013 | 0.000783 |
| ln(h × Hh) | - | - | 0.1384 | 0.02559 |
| Hh/T | 0.7810 | 0.07038 | 0.2905 | 0.08202 |
| ln(SI) | 0.6522 | 0.01846 | 1.0804 | 0.02678 |
| Newcl | - | - | 0.03032 | 0.006996 |
| Spcult | - | - | 0.09691 | 0.008062 |
| estimated variance components | ||||
| 0.07545 | 0.08246 | |||
| 0.2254 | 0.3325 | |||
| b standard error of estimate | ||||
| Table 6. Symbols for variables used in height increment models. | |
| Variable | Definition and units |
| ih5 | Single tree 5-year height increment, m |
| h | Initial tree height, m |
| Hh | Height-weighted mean height, Σh2/Σh, of all trees on the plot, m |
| T | Stand age, expressed as basal area-weighted total age in the plot, years |
| hci | Distance-independent competition index, sum of the height square (Σh2) ×0.1 of all trees taller than the subject tree in the plot (100 m2). |
| Newcl | Indicator variable for pre-commercially thinned plots. Newcl = 1 if the plot was cleaned within 10 years before the measurement, otherwise Newcl = 0 |
| Spcult | Indicator variable for spruce establishment by planting. Spcult = 1 if the plot was planted with spruce, otherwise Spcult = 0 |
| SI | Site index (m), according to site properties (Hägglund and Lundmark 1977) |

Fig. 1. Mean prediction error of height increment (m) over estimated height increment (m) for the calibration and the validation data set. The numbers in the graph represent the number of trees in each height class.
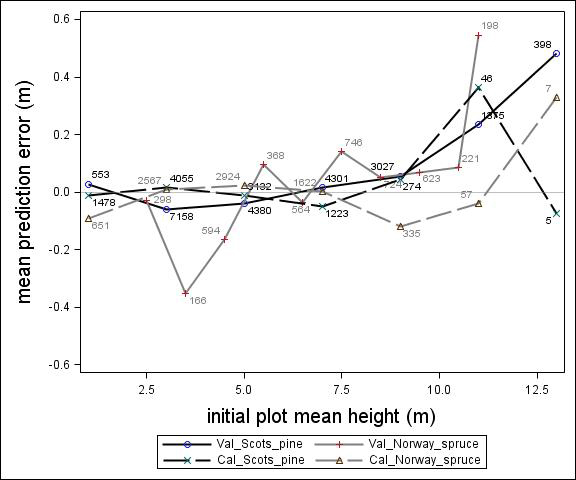
Fig. 2. Mean prediction error of height increment (m) over initial plot mean height (m) for calibration and the validation data set. The numbers in the graph represent the number of trees in each height class.
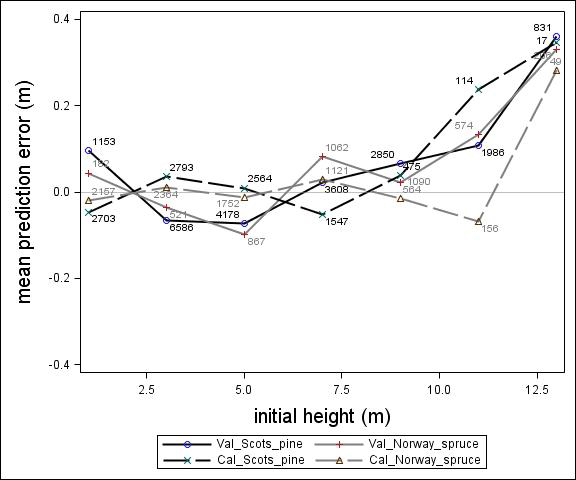
Fig. 3. Mean prediction error of height increment (m) over initial height (m) for the calibration and the validation data set. The numbers in the graph represent the number of trees in each height class.
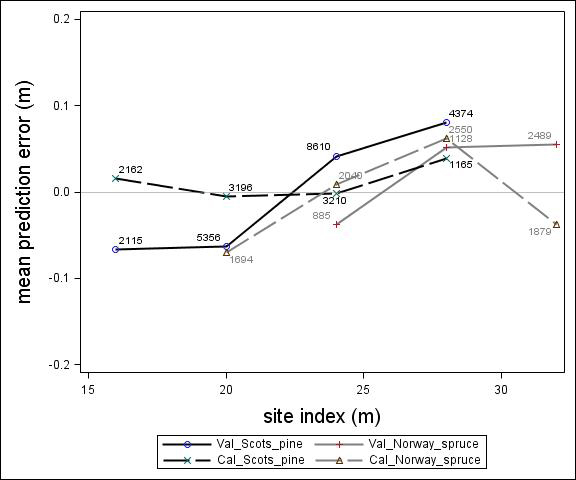
Fig. 4. Mean prediction error of height increment (m) over site index (m) for the calibration and the validation data set. The numbers in the graph represent the number of trees in each height class.
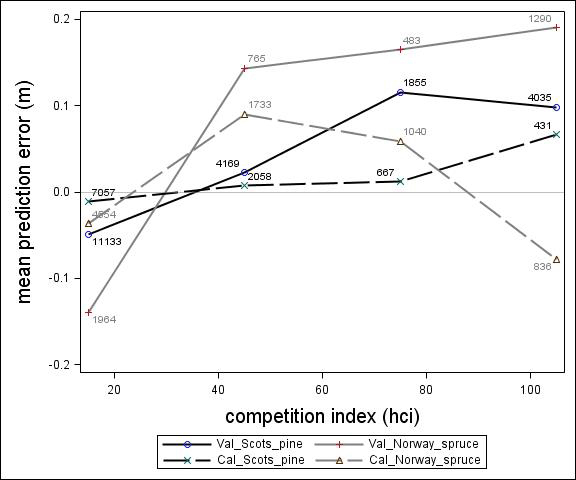
Fig. 5. Mean prediction error of height increment (m) over competition index for the calibration and the validation data set. The numbers in the graph represent the number of trees in each competition index class.
3.1.1 Validation of height growth models
For Scots pine and Norway spruce, the model overestimated the height increment on average by 1 cm and 4 cm (MPE of validation data set), respectively, and there were no clear trends for the prediction errors over estimated height increment (Fig. 1). Only slight trends were found over initial height (Fig. 3) and plot mean height (Fig. 2) up to 9 m. However, after about 9 m, there was a clear tendency to underestimate the height development for both species, which indicates that the models should not be used in stands above 9 m initial mean height. There was a trend for the prediction errors over site index (Fig. 4). However, the trend was not considered to be strong enough to motivate a rejection of the growth model. There was also a trend for the prediction errors over competition index (Fig. 5), which may be explained by the different plot size for the validation data compared with the calibration data. The plot size for the calibration data was 100 m2, while the average plot size for the validation data was about 400 m2. In order to generate competition indexes in line with the growth model, these were scaled down to the level of 100 m2 which may have caused some bias.
3.2 Predictions of the height growth models on genetic data
The prediction errors showed notable variation for the individual genetic field trials (Fig. 6). Some of the trials were under-predicted by almost one meter while others were over-predicted by half a meter. In general, the height growth model underestimated the development for both species. The overall bias (MPE) and standard deviation (RMSE) were 0.39 and 0.66, respectively, for Scots pine and 0.13 and 0.86, respectively, for Norway spruce. Overall, no consistent trend over estimated height increment was found for Norway spruce or Scots pine. However, for individual trials, some trends could be identified.
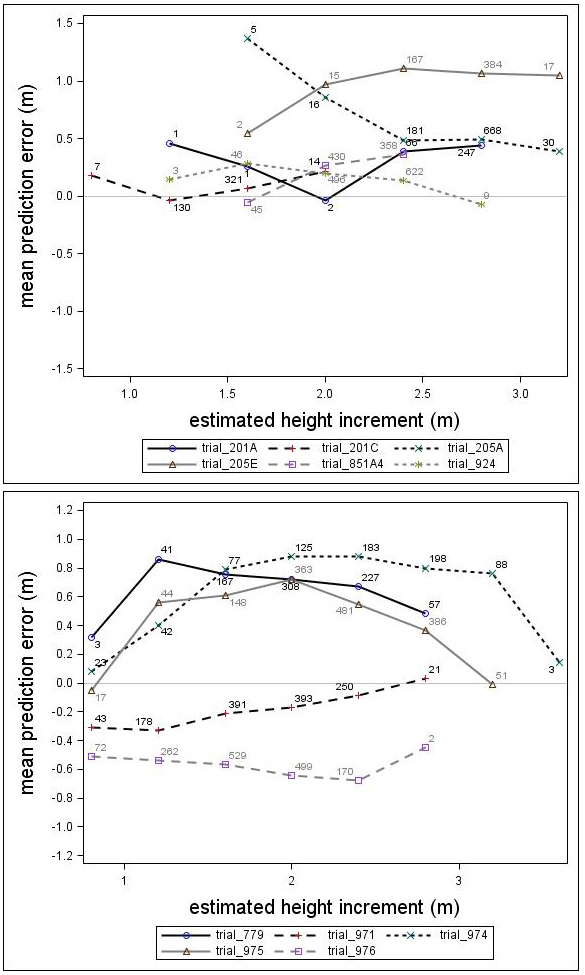
Fig. 6. Mean prediction error of height increment (m) over estimated height increment (m) for the Scots pine (upper) and Norway spruce (lower) genetic field trials. The numbers in the graph represent the number of trees in each height increment class.
There was a trend associated with genetic gain (PGE) for Scots pine; the height growth model produced greater underestimates for the highly improved families (Fig. 7). For Norway spruce there was no clear trend associated with improvement level (PGE) (Fig. 7). These results indicated that the estimates produced by the model would be improved by incorporating a genetic component for Scots pine. The MPEs for Scots pine with genetic gains (PGE) equivalent to 7.5% and 17.5% were 0.41 and 0.56, respectively. Similar results for Norway spruce were 0.26 and 0.06, respectively.
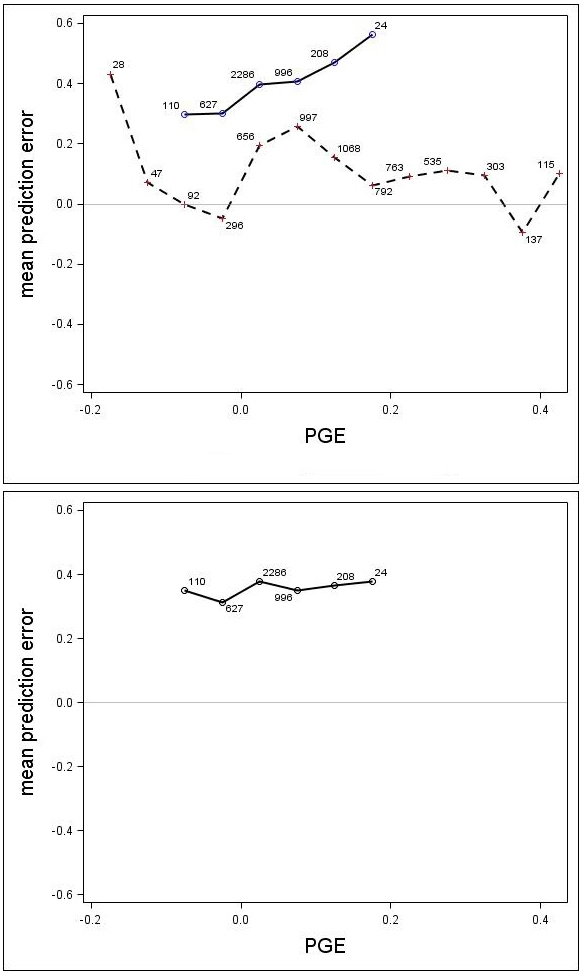
Fig. 7. Mean prediction error (m) for the unadjusted (upper) and adjusted (lower) growth models for Scots pine (solid line) and Norway spruce (dashed line) plotted against PGE. The numbers in the graph represent the number of trees in each PGE-class. Note that the Norway spruce model was not adjusted, so this species does not appear in the lower graph.
3.3 Predictions of the height growth models with the genetic component
A genetic component (β1 × PGE) was estimated for Scots pine and Norway spruce from Eq. 7. Parameter β1 was estimated to be 0.3504 (p = 0.0024) for Scots pine, indicating that the component significantly reduced the prediction bias. For Norway spruce, the coefficient β1 was estimated to be –0.0336 and it was not significant (p = 0.3271), indicating that the derived genetic component did not significantly reduced the prediction bias. The MPE and the RMSE were reduced for Scots pine to 0.36 and 0.64, respectively, and the MPEs for genetic gains (PGE) equivalent to 7.5% and 17.5% were reduced to 0.35 and 0.38. When using the genetic component for Scots pine, the model underestimated the height increment by about 0.35 m on average (Fig. 7), regardless of PGE. The results from the analysis also showed that there was no significant effect of trial for either Scots pine (p = 0.1443) or Norway spruce (p = 0.1895).
4 Discussion
The first objective of this study was to develop an individual tree height growth model based on empirical data for genetically unimproved Norway spruce and Scots pine trees. The models presented were based on a large data set covering the whole of Sweden with trees of a mean height of about 3–4 m and resembles the models by Fahlvik and Nyström (2006), which was based on data from southern Sweden. The results from the validation indicated no clear trend in the prediction errors in general, indicating that the models worked well for tree heights between 2 and 8 m. However, above an initial height and plot mean height of 9 m the validation data showed a tendency for the prediction errors. The models presented should, therefore, not be used for predicting height development after 9 m of initial height.
The second objective of this study was to evaluate whether the height growth models presented for Norway spruce and Scots pine could predict the height growth of genetically improved material. This analysis was conducted on 11 genetic field trials which varied greatly in improvement level, making the results suitable for generalizations about genetic improvement. Our results indicated that the model, as parameterized for the non-improved material, was able to predict the height increment fairly well for Norway spruce but not for Scots pine. The model underestimated the differences in height growth among the different genetic entries of Scots pine in our study. The original model employed in this study uses an initial state to predict a future state. In this case, initial height was used to predict future height; this is reasonable because initial height at a given age is a good measure of past performance, which is a reliable predictor of site-quality and future development. In addition, the correlation between heights of similar ages is strong for many tree species (Lambeth 1980; McKeand 1988; Johnson et al. 1997) including Scots pine (Haapanen 2001; Jansson et al. 2003) and Norway spruce (Karlsson and Danell 1988; Hannerz et al. 1999; Isik et al. 2010). However, when applying the model to genetically improved Scots pine trees, initial height as parameterized by the model, no longer provided enough information to predict future development. After re-parameterization of the model for the improved Scots pine, initial height might have had greater influence on the future development, which could have improved the predictions. However, this operation was not conducted as there was too little material to build a new growth model. Only six genetic trials (Table 4) could have been used, compared to the 899 plots which the model was originally based on. Instead, the objective was to use the original growth model as parameterized for the non-improved material and to add a genetic component to the model.
Our results indicated that the height growth model was significantly improved by incorporating the genetic component for Scots pine in our data. Adding this component for Scots pine with a genetic gain (PGE) equivalent to 17.5% resulted in an increased 5-year height growth of 19 cm. This would generate an increased height growth of almost 0.4 meter assuming two time periods between 2 and 7 m mean heights. The genetic component was based on material with a genetic gain (PGE) equivalent to –0.15–0.18. This demonstrates that our genetic component can handle wide genetic variation and can thus be used to account for high levels of improvement, making it suitable to use well into the future.
The genetic component was constructed based on the families’ genetic performance compared to unimproved material (PGE), similar to the study by Gould et al. (2008). In this study, unimproved material was defined based on its general genetic performance compared to the average height of half-sib and full-sib trials (Rosvall et al. 2001) and clonal trials (Persson and Persson 1992; Rosvall et al. 2001). This enabled a more robust definition of unimproved material which was crucial for correctly incorporating a genetic component into the height growth model. An alternative would have been to estimate PGE directly in relation to the control families which were used in all trials. However, the number of controls was very few (between 1 and 6) and this would have made the PGE estimations unstable. The PGE of a specific entry would have been mostly determined by the performance of the control family, which was not the intention. In addition, the controls in the Norway spruce trials did not represent unimproved material as these were provenances from eastern parts of Europe and represented an improvement level of some 8% (Persson and Persson 1992). As a consequence, these trials would also have to be adjusted for a provenance effect when using the control families.
The PGE was calculated using a similar method to that employed when breeding values and genetic gains are estimated in Swedish tree breeding. The approach presented in this study can, therefore, easily be used to predict the height development for various plant materials. However, in operational simulations it is important to use breeding values and genetic gains which are based on tests from various environments in order for the genetic component (β1 × PGE) to reflect the general performance of the specific genetic entry. Breeding values and genetic gains are estimated in Swedish tree breeding from several locations, usually between 3–5 locations (Rosvall et al. 2001), which provides robust genetic gain estimates. In this study, the genetic component was based on PGE and reflected the genetic gain of a specific entry in a specific trial, which may not be equivalent to its general breeding value estimated from several locations. An example here is the genetic entries with extreme PGE which may have been affected by for instance genotype by environment interactions. However, the genetic correlations for height across locations are strong for both Scots pine (0.77) (Hannrup et al. 2007) and Norway spruce (0.72) (Berlin et al. 2014) in Sweden, which indicates that genotype by environment interactions in general is of low importance in Swedish tree breeding population. In addition, the pattern of the genotype by environment interaction was largely unpredictable with respect to site and locality variables (Hannrup et al. 2007). Consequently, our approach of a genetic component based on a single trial could be used as a surrogate for a more general breeding value estimated from several locations.
Similar to the way that genetic gains are estimated in Swedish tree breeding, this study used single-tree plot trials. However, these can produce biased estimates of growth traits that are affected by competition, favoring entries with initially fast growth, while entries which are initially slow-growing are disfavored (Cannel 1982; Foster 1992; Vergara et al. 2004; Ye at al. 2010). Thus, genetic gains or breeding values based on late measurements from single-tree plot trials may not be reliable because they are affected by competition. In this study, the genetic component was based on data from early measurements at a mean height of 1.3–3.4 m, depending on trial; this results in a decreased risk of biased estimates. Consequently, it is important to estimate breeding values and genetic gains before the onset of competition, not only from a breeding point of view, but also to provide unbiased estimates when incorporating genetic components into growth models. By using the genetic component, the most recent genetic information, although incomplete, is extrapolated to an existing growth model. The family mean height varied between 0.9 and 4.5 m and 2.1 and 8.2 m at the times of the first and second height measurements, respectively. This corresponds well to the height interval which the original height growth model was based on.
Why the genetic component was needed for Scots pine but not for Norway spruce is an open question. One explanation might have been that PGE was not an informative variable for explaining the genetic potential of Norway spruce. However, this is not a likely explanation as the PGE estimated from the early measurement was highly correlated with the PGE based on the second measurement. The correlation was about 0.85 for both species, which indicates that a genetically well performing entry at the time of the first measurement is still a genetically well performing entry at the time of the second measurement. Instead, a more likely explanation for the differences is that the presented Norway spruce growth model better captured genetic gain by the initial height and the variables describing initial state, than the Scots pine model.
The genetic component was derived only to account for trends associated with genetic improvement. The fact that the height increment model under-predicted the height increment for Scots pine by about 35 cm for the five year period (Fig. 7) for the adjusted growth model, was therefore not taken into account in this study. Instead, this was probably an effect of imprecise site index estimates. In this study, site index was estimated based on site properties (Hägglund and Lundmark 1977), which may not always reflect the actual fertility on a specific site. However, these findings indicate a need for a more precise site index estimates. It is also possible that the under-prediction by the growth models was an effect of the well-managed experiments, which may have removed some of the growth reducing factors that often occur in the natural forests that the original model was based on. For instance, these experiments were carefully established in regular spacings and this might have increased the growth of the seedlings. In a study on Norway spruce in northern Sweden by Elfving and Nyström (1996), experimental sites were growing considerably more in terms of height and basal area than operational plantations on similar site conditions. Another explanation may be browsing damage which normally affects Scots pine more than Norway spruce. Most of the Scots pine trials were fenced and this may have reduced browsing damage, causing the trees to grow faster than predicted by the model, since the HUGIN-data which the model was parameterized from, were measured in un-fenced operational regenerations. Browsing reduces height-growth of individual trees (Wallgren et al. 2014) but browsing may also affect stand-level height growth dynamics. Bergqvist et al. (2003) showed that the most vigorously growing Norway spruce trees were more browsed than less vigorous individuals. However, since the height-growth models were based on undamaged individuals, selective browsing has probably not significantly influenced the genetic component for Scots pine.
This study provides a first step to incorporate genetic gains into Swedish growth models and forest management planning systems. The results presented in this study could, for instance, be implemented into the Heureka decision support system which is used for analysis and planning of silvicultural treatments and strategies in stands, forests and regions (Wikström et al. 2011). However, more studies are needed to evaluate whether modifications are needed also for growth models later in the tree or stand development.
Acknowledgements
This study was financially supported by the Swedish Forest Tree Breeding Association and the research program Future Forests. Thanks to Curt Almqvist for experimental data and Bo Karlsson and Ola Rosvall for constructive critique of the study.
References
Adams J.P., Matney T.G., Land S.B., Belli K.L., Duzan H.W. (2006). Incorporating genetic parameters into a loblolly pine growth-and-yield model. Canadian Journal of Forest Research 36(8): 1959–1967. https://doi.org/10.1139/X06-087.
Ahtikoski A., Ojansuu R., Haapanen M., Hynynen J., Kärkkäinen K. (2012). Financial performance of using genetically improved regeneration material of Scots pine (Pinus sylvestris L.) in Finland. New Forests 43(3): 335–348. https://doi.org/10.1007/s11056-011-9284-6.
Bergquist J., Örlander G., Nilsson U. (2003). Interactions among forestry regeneration treatments, plant vigour and browsing damage by deer. New Forests 25(1): 25–40. https://doi.org/10.1023/A:1022378908827.
Berlin M., Jansson G., Högberg K.-A. (2014). Genotype by environment interaction in the southern Swedish breeding population of Picea abies using new climatic indices. Scandinavian Journal of Forest Research 30(2): 112–121. https://doi.org/10.1080/02827581.2014.978889.
Buford M.A., Burkhart H.E. (1987). Genetic-improvement effects on growth and yield of loblolly-pine plantations. Forest Science 33: 707–724.
Bullock B., Nyström K., Rosvall O. (2010). Mixed stand establishment with genetically improved and unimproved plant material for Norway spruce. Simulations of future yields and impacts on forest management. In: Karlsson B., Rosvall O. (eds.). Ökad tillgång och användning av förädlade plantor. Slutrapport – Uppdrag om förbättrat växtodlingsmaterial, Jo2008/1883. Skogforsk, Uppsala.
Cannell M.G.R. (1982). ‘Crop’ and ‘isolation’ ideotypes: evidence for progeny differences in nursery-grown Picea sitchensis. Silvae Genetica: 32: 60–66.
Carson S.D., Garcia O., Hayes J.D. (1999). Realized gain and prediction of yield with genetically improved Pinus radiata in New Zealand. Forest Science 45: 186–200.
Danjon F. (1995). Observed selection effects on height growth, diameter and stem form in maritime pine. Silvae Genetica 44: 10–19.
Elfving B. (1982). Hugin´s ungskogstaxering 1976–1979. [Hugin young stand survey 1976–1979]. Projekt Hugin, Rapport 27. Sveriges lantbruksuniversitet, Umeå.
Elfving B., Nyström K. (1996). Yield capacity of planted Picea abies in northern Sweden. Scandinavian Journal of Forest Research 11(1–4): 38–49. https://doi.org/10.1080/02827589609382910.
Fahlvik N., Nyström K. (2006). Models for predicting individual tree height increment and tree diameter in young stands in southern Sweden. Scandinavian Journal of Forest Research 21(S7): 16–28. https://doi.org/10.1080/14004080500487292.
Foster G.S. (1992). Estimating yield: beyond breeding values. In: Fins L. (ed.). Handbook of quantitative forest genetics. Kluwer Academic publisher, Dordrecht.
Gould P., Johnson R., Marshall D., Johnson G. (2008). Estimation of genetic-gain multipliers for modeling Douglas-fir height and diameter growth. Forest Science 54: 588–596.
Gould P.J., Marshall D.D. (2010). Incorporation of genetic gain into growth projections of Douglas-fir using ORGANON and the Forest Vegetation Simulator. Western Journal of Applied Forestry 25: 55–61.
Haapanen M. (2001). Time trends in genetic parameter estimates and selection efficiency for Scots pine in relation to field testing method. Forest Genetics 8: 129–144.
Hägglund B., Lundmark J.-E. (1977). Site index estimation by means of site properties Scots pine and Norway spruce in Sweden. Studia Forestalia Suecica 138: 1–38.
Hamilton D.A., Rehfeldt G.E. (1994). Using individual tree growth projection models to estimate stand-level gains attributable to genetically improved stock. Forest Ecology and Management 68(2–3): 189–207. https://doi.org/10.1016/0378-1127(94)90045-0.
Hannerz M., Sonesson J., Ekberg I. (1999). Genetic correlations between growth and growth rhythm observed in a short-term test and performance in long-term field trials of Norway spruce. Canadian Journal of Forest Research 29(6): 768–778. https://doi.org/10.1139/x99-056.
Hannrup B., Jansson G., Danell Ö. (2007). Genotype by environment interaction in Pinus sylvestris L. in southern Sweden. Silvae Genetica 57: 306–311.
Isik K., Kleinschmit J., Steiner W. (2010). Age-age correlations and early selection for height in a clonal genetic test of Norway spruce. Forest Science 56: 212–221.
Jansson G., Li B., Hannrup B. (2003). Time trends in genetic parameters for height and optimal age for parental selection in Scots pine. Forest Science 49: 696–705.
Johnson G.R., Sniezko R.A., Mandel N.L. (1997). Age trends in Douglas-fir genetic parameters and implications for optimum selection age. Silvae Genetica 46: 349–358.
Karlsson B. (1993). Twenty years of clonal forestry with Norway spruce in Sweden. In: Valentina R. (ed.). Norway spruce provenances and breeding. Proceedings of the IUFRO S2.2-11 symposium Latvia 1993. Latvian forestry research institute ‘Silava’. p. 208–212.
Karlsson B., Danell Ö. (1988). Genetic parameters, predicted breeding values and potential selection gains for clones in a Norway spruce seed orchard. In: Stener L.-G., Werner M. (eds.). Norway spruce; provenances, breeding and genetic conservation. Proceedings of the IUFRO working party meeting, S2.02-11 in Sweden 1988. Report no 11, The Institute for Forest Improvement, Uppsala. p. 90–112.
Knowe S.A., Foster G.S. (1989). Application of growth-models for simulating genetic gain of loblolly-pine. Forest Science 35: 211–228.
Kurinobu S., Shingai Y. (1987). Stand-volume prediction of improved trees based on the realized gain in progeny tests of Hinoki (Chamaecyparis obtusa Endl). Silvae Genetica 36: 159–164.
Lambeth C. (1980). Juvenile-mature correlations in Pinaceae and implications for early selection. Forest Science 26: 571–580.
McKeand S.E. (1988). Optimum age for family selection for growth in genetic tests of Loblolly pine. Forest Science 34: 400–411.
Näslund M. (1936). Skogsförsöksanstaltens gallringsförsök i tallskog. Meddelanden från Statens Skogsförsöksanstalt 29. 169 p. [In Swedish].
Nyström K. (2001). Growth models for young stands: development and evaluation of growth models for commercial forests in Sweden. Dissertation. Swedish University of Agricultural Sciences, Umeå.
Persson A., Persson B. (1992). Survival, growth and quality of Norway spruce (Picea abies (L.) Karst.) provenances at the three Swedish sites of the IUFRO 1964/68 provenance experiment. Report 29, Swedish University of Agricultural Sciences, Department of Forest Yield Research, Garpenberg.
Pettersson N. (1992). The effect on stand development of different spacing after planting and precommercial thinning in Norway spruce (Picea abies (L.) Karst.) and Scots pine (Pinus sylvestris L.) stands. Dissertation. Swedish University of Agricultural Sciences, Department of Forest Yield Research, Garpenberg.
Rosvall O., Wennström U. (2008). Förädlingseffekter för simulering med Hugin i SKA 08. Arbetsrapport 665, Skogforsk, Uppsala.
Rosvall O., Jansson G., Andersson B., Ericsson T., Karlsson B., Sonesson J., Stener L.G. (2001). Genetiska vinster i nuvarande och framtida fröplantager och klonblandningar. [Genetic gain from present and future seed orchards and clone mixes]. Redogörelse nr. 1, Skogforsk, Uppsala.
SAS/STAT software version 9.2. SAS Institute Inc. Copyright 2002–2008. Cary N., USA.
Söderberg U. (1986). Functions for forecasting of timber yields. Swedish University of Agricultural Sciences, Section of Forest Mensuration and Management, Report 14. 251 p.
Sprinz P.T., Talbert C.B., Strub M.R. (1989). Height-age trends from an Arkansas seed source study. Forest Science 35: 677–691.
Swedish Forest Agency (2013). Swedish statistical yearbook of forestry. Jönköping.
Vergara R., White T.L., Huber D.A., Shiver B.D., Rockwood D.L. (2004). Estimated realized gains for first-generation slash pine (Pinus elliottii var. elliottii) tree improvement in the southeastern United States. Canadian Journal of Forest Reseach 34(12): 2587–2600. https://doi.org/10.1139/x04-136.
Wallgren M., Bergquist J., Bergström R., Eriksson S. (2014). Effects of timing, duration, and intensity of simulated browsing on Scots pine growth and stem quality. Scandinavian Journal of Forest Research 29: 734–746. https://doi.org/10.1080/02827581.2014.960896.
Wikström P., Edenius L., Elfving B., Eriksson L.O., Lämås T., Sonesson J., Öhman K., Wallerman J., Waller C., Klintebäck F. (2011). The Heureka forestry decision support system: an overview. Mathematical and Computational Forestry & Natural-Resource Sciences 3: 87–94.
Ye T.Z., Jayawickrama K.J.S., Clair J.B. (2010). Realized gains from block-plot coastalDouglas-fir trials in the northern Oregon Cascades. Silvae Genetica 59: 29–39.
Total of 43 references.
