Lars Fridh,
Lars Eliasson  ,
Dan Bergström
,
Dan Bergström
Precision and accuracy in moisture content determination of wood fuel chips using a handheld electric capacitance moisture meter
Fridh L., Eliasson L., Bergström D. (2018). Precision and accuracy in moisture content determination of wood fuel chips using a handheld electric capacitance moisture meter. Silva Fennica vol. 52 no. 5 article id 6993. https://doi.org/10.14214/sf.6993
Highlights
- The studied capacitance meter can provide accurate estimates of mean moisture content for chips with M < 50% if a large sample is taken
- It should be possible to use the capacitance meter to measure moisture content even for calculating payments depending of the needed accuracy
- However a calibration function for each assortment is needed.
Abstract
According to the Swedish Timber Measurement Act, measurements affecting payments for wood fuels to landowners must be accurate and precise. In this regard, moisture content is an important quality parameter for wood chips which influences the net calorific value as received and thus the economic value. As standard practice moisture content is determined with the oven-drying method, which is cumbersome to use for deliveries to facilities without drying-ovens, which in turn necessitates that samples are taken elsewhere for measurement. An alternative solution is to use a portable moisture meter. Our aim was to evaluate the precision of a handheld capacitance moisture meter. Accuracy and precision of a capacitance meter was determined in the lab and a calibration function was made. Thereafter, the calibrated moisture meter was compared with the standard method for moisture content determination of truckloads of chips. The capacitance meter showed a moderate accuracy by underestimating moisture content by 6.0 percentage points (pp), compared to the reference method, at a precision of ±3.8 pp (CI 95%). For chips with M > 50%, both accuracy and precision decreased. Calibration increased the accuracy in the follow up study by 3 pp for chips with M < 50% but could not be made for wetter chips. The oven-drying method and the capacitance meter can provide equally accurate estimates of mean moisture content for chips with M < 50% if a larger sample is taken with the latter. It should be possible to use capacitance meters to measure moisture content even when used to calculate payments depending of the needed accuracy. A calibration function for each assortment is needed.
Keywords
heating value;
biofuels;
payment
-
Fridh,
Skogforsk, The Forestry Research Institute of Sweden, Uppsala Science Park, 751 83 Uppsala, Sweden; Skogsägarna Mellanskog, Uppsala Science Park, Box 127, 751 04 Uppsala, Sweden
 http://orcid.org/0000-0002-4721-1193
E-mail
lars.fridh@mellanskog.se
http://orcid.org/0000-0002-4721-1193
E-mail
lars.fridh@mellanskog.se
-
Eliasson,
Skogforsk, The Forestry Research Institute of Sweden, Uppsala Science Park, 751 83 Uppsala, Sweden
http://orcid.org/0000-0002-2038-9864
E-mail
lars.eliasson@skogforsk.se
- Bergström, Swedish University of Agricultural Sciences, Department of Forest Biomaterials and Technology, S-901 83 Umeå, Sweden E-mail dan.bergstrom@slu.se
Received 7 March 2017 Accepted 19 November 2018 Published 20 November 2018
Views 45788
Available at https://doi.org/10.14214/sf.6993 | Download PDF

1 Introduction
Moisture content is one of the most important quality parameters of wood fuel chips (ISO 2014). It strongly influences the net calorific value of the delivered fuels as received, and consequently the economic value per tonne of fuel chips. An optimized combustion of the wood chips ideally requires a constant moisture content (Koppejan and Van Loo 2012). As fuel chips has a varying moisture content, more complex combustion techniques as well as constant process control with constant measurements of the moisture content of the fuel mixed used is needed. Given the limited on-site storage capacity at most larger heating plants (Olsson et al. 2016), moisture content determination has to be fast to enable an optimized combustion process in the boiler.
Measurement of biomass properties which influence payments to the landowner for the biomass is regulated by the Swedish Timber Measurement Act. It stipulates that measurements must be both accurate and precise, and require a systematic control of measurement and methodology (SFS 2014; Skogsstyrelsen 2014). The standard method currently used for moisture content determination on a wet base in the Swedish biomass trade is to collect samples (usually 6) which are mixed to a general sample. From that general sample one sample is taken and dried at 105 °C until constant weight is reached (ISO 2015a, 2015b). The method fulfils the requirements for accuracy and precision but not without potential sources of error such as e.g. sampling errors and errors due to precision of the scales used. In theory, it is unbiased and should ensure correct payment to the seller when enough samples are taken from the biomass.
Forest biomass supply to heat- and power plants is subject to diverse constraints in the supply chain, especially challenges related to storage and preserving biomass quality before it is used for bioenergy (Routa et al. 2015; Sosa et al. 2015; Ghaffariyan et al. 2017). Approximately 20% of the wood chips delivered to heating plants in Sweden has passed through a forest fuel storage terminal, but many of these are small and lack permanent staff and drying ovens or other equipment to measure moisture content (Kons et al. 2014). On these terminals, currently the most common measuring method is bulk volume measurement conducted by the truck drivers (Björklund 2014). The required systematic control of bulk volume measurement is difficult or even unreasonable to perform on small terminals, because it has to take place before the truck unloads the chips (Björklund 2014). A transition to measurement of dry weight, i.e. dry-tonnes, is therefore a likely solution to the problem at measured majority of these terminals. For effective and accurate dry mass measurement on small sites, it’s necessary to find efficient ways to determine moisture content. The oven-drying method necessitates that truck drivers takes samples of chips, put them into sealed bags, and deliver them to a measurement facility, which is often located at e.g. a saw- or pulp mill or larger heating plant in the region. This method is time consuming and associated with a high risk of incorrect sampling, which together give both costly and low precision measurements. For the above reasons, portable moisture meters that quickly and precisely can determine moisture content of biomass cost-effective would be of great value to many players in the biomass supply chain. Such measuring equipment must be reasonably priced, easy to use and carry around and still sufficiently accurate and precise, so that chipping contractors and truck drivers can bring the equipment in their vehicles and conduct moisture content determination on smaller sites.
Sjöström (2011) reviewed available measurement techniques for determining moisture content and the handheld devices available on the market. Of these, the electric and nuclear devices were sufficient small to be used for measurements in the field, but the nuclear devices were considered difficult from a work safety perspective. The electric moisture meters use either resistance or capacitance technology. Roux et al. (2010) stated that no conclusive results could be found for resistance type probe meters but that bucket type capacitance meters were quite reliable within their comfort zone. When tested, a handheld electric moisture meter model with a dish probe using capacitance technology had a fairly high precision, was relatively accurate if calibrated for the type of biomass tested and was easy to handle (Jensen et al. 2006; Fridh 2012; Volpé 2013). One advantage with the electric moisture meters is that they provide measurement results quickly. The handheld devices are more flexible than the bucket type meters due to their easy handling, allowing significantly more samples to be measured than what is practical to do using the oven drying method. This increases the representativeness which could make moisture content determination for a truckload equivalent or better than the standard method despite a lower precision of moisture content determination of individual samples. A handheld electric moisture meter could therefore be a possible solution to the problem of sampling error and become an accurate and effective method for moisture content determination on smaller sites without oven-drying capacity, to meet the requirements of the Swedish Timber Measurement Act.
The aim of this study was to: 1) compare the precision of a hand held electric moisture meter to the standard oven drying method for various moisture content of wood chips; 2) if necessary try to improve the measurements by calibration of the instrument, 3) validate the calibration using a second data set, and 4) evaluate if an electric moisture meter can determine moisture content in a truckload of fuel chips as accurately as the standard oven-drying method. The accuracy in moisture content determination of a whole truck load was assumed to be a function of sampling representativeness and the accuracy in moisture content determination of samples.
2 Materials and methods
This study was divided into two parts. Part one was to determine the accuracy and precision, of the hand-held moisture meter and to create a calibration function for more accurate moisture content value when measuring wood chips. It was carried out in a laboratory environment. Part two of the study was conducted as a field test evaluating and comparing the hand-held moisture meter, both with and without the calibration function from part one, with the current standard method for moisture content determination on truckloads of chips. Measurements were carried out in an operational environment, on piles of wood chips at a storage terminal for forest fuel in Ljusdal, mid Sweden.
2.1 The hand-held moisture meter
The handheld instrument used was a Wile Bio Moisture meter (Farmcomp 2017). It uses electrical capacitance to determine moisture content in wood and logging residue chips. A detailed description of the theory for moisture determination using capacitance can be found in (Skaar 1988) but, briefly, it is summarised here. When an AC voltage is applied across two conductors separated by an insulating material, a difference in charge between the two sides of the material occurs. The relationship between the voltage and the charge difference is called the capacitance, and various insulating material provide different capacitance. The dielectric constant of a substance is the ratio of the capacitance of vacuum and the capacitance of the considered insulating material. For wood, the dielectric constant varying with the wood’s moisture content, but also affected by temperature and wood density as well as the electric AC voltage frequency. By measuring the capacitance of wood chips, you get a measurement of its dielectric constant and thus can estimate its moisture content. The dielectric constant generally increases with increasing moisture content, wood density and reduced frequency. It also increases with increasing temperature except at high moisture levels where it decreases with higher temperature. Since the dielectric constant is similar for ice and for wood, capacitance moisture meters should not be used on frozen wood chips.
The Wile Bio Moisture meter (Farmcomp 2017) consists of an electronic unit and a removable dish probe. The measurement is conducted in a spherical area of 20 cm diameter between the probe tip and the dish. The manufacturer has calibrated the instrument with the oven drying method as reference according to standard EN-14774 (CEN 2009a, 2009b). The instrument has four different measuring scales; one for wood chips and three for logging residues chips (fine, medium and coarse). The manufacturer sets the instrument’s range of moisture content from 12% up to 40% wet basis for wood chips and from 30% to 70% wet basis for logging residues chips. The measuring procedure is simple to conduct: Stick the probe into the chips, then choose a suitable measuring scale with the buttons and wait a few seconds before the moisture content is displayed. It is possible to store multiple values in the electronics unit and to continuously get the average value of stored moisture content measurements. In this study, the scale for wood chip measurements was used.
2.2 Part 1: Accuracy and precision of handheld moisture meter
The biomass used was stem wood chips intended for energy production and produced from non-barked low-quality logs, mainly of Norway spruce (Picea abies (L.) H. Karst). 10 main samples of 20 L each were collected in airtight plastic bags at a combined heat and power plant (CHP) in mid Sweden. To ensure samples with variation in moisture content, the samples were collected randomly either from the CHP-plants storage site, or directly from arriving chip trucks. The sealed plastic bags were then transported to the lab and stored in a +4 oC cold storage room until preparation for tests.
Since the dielectric constant is affected by the wood’s moisture content, temperature and density (Skaar 1988; Jensen et al. 2006; Sjöström 2011) measurement was carried out on samples in four measuring cycles, and the samples were dried gradually between each cycle. This method was chosen to minimize the impact of density by conducting measurements on the same material but in different moisture content levels. For each main sample, the test was conducted by the following procedure: The 20 L main sample was mixed thoroughly before 13 L of chips were taken and placed a plastic bucket and weighted on a laboratory scale with the accuracy of 0.01 g. Thereafter, five repeated measurements were conducted with the capacitance meter, by each time inserting the probe at different positions in the bucket with chips and the moisture content according to the instrument (CAP_M) was recorded. The chips were then spread onto aluminium trays and dried for two hours in a drying oven at 105 oC. The samples were then taken out of the oven and allowed to cool off properly. The chips were put back in the bucket, and a new measuring cycle (weighing, measuring, drying, cooling) was conducted. After the fourth cycle, the chips were put back in the oven to be completely dried and weighed in dry condition. Reference moisture content (REF_M) for each sample was then calculated as:
![]()
where i is the sample identification, j is the measuring cycle number and REF_M is given as % wet basis.
| Table 1. Definition of moisture content classes (M_CL). | |
| Moisture content class (M_CL) | Moisture content % (M) |
| M_CL 2 | ≤ 29.9 |
| M_CL 3 | 30.0 – 39.9 |
| M_CL 4 | 40.0 – 49.9 |
| M_CL 5 | ≥ 50 |
To analyze the precision of the instrument the difference in moisture content (DIFF_Mijk) between the two methods was calculated as CAP_Mijk – REF_Mij, where i is the sample identification (S_ID), j is the measuring cycle number and k the identification for the repeated measurement using the capacitance meter within each measuring cycle. In the analyses, the material was divided into moisture content classes (M_CL) based on the REF_M for each sample in each measuring cycle (Table 1). PROC MIXED in SAS was used for statistical analyses, and to test if M_CL had effect on DIFF_M, following mixed linear model containing both fixed and random parameters were used:
![]()
Fixed parameter used was α = M_CL. Random parameters used were a = S_ID and b(a) = repeated measurement identification nested within S_ID. ε are random error term ~N(0,σ2). Results were considered significant if p < 0.05. To analyse the repeatability of the machine, the variance within samples in a measuring cycle was used to calculate the average variance from which a 95% confidence interval was calculated.
It was assumed that a calibration of CAP_M should be necessary, since the manufacturer stated that instrument’s calibration for wood chips ranged from a moisture content of 12% up to 40% wet basis and measurement tests were conducted on chips in moisture content range from 20% to over 50%. PROC HPREG in SAS was used for high-performance polynomial regression analyses, and to create a function for CAP_M to get a calibrated and more accurate moisture content value (CalF_M). The following eight degrees’ polynomial regression model with REF_M as dependent variable and CAP_M as independent variable was used with backward selection and stopped at a minimum of the Mallows C(p) criterion:
![]()
where i is the sample identification, j is the measuring cycle number and k the identification for the repeated measurement using the capacitance meter within each measuring cycle.
2.3 Part 2: Field evaluation
The biomass used was non-barked low-quality logs of Norway spruce (Picea abies) intended for energy production. Five truckloads of logs, approximately 30 m3 solid each, were comminuted with a CBI 6400 drum chipper and piled separately on site at a storage terminal. For each of the five piles, 30 measurements were conducted with capacitance meter and CAP_M was registered. At each measuring position, where the probe was stuck into the chips, a 2 L sample of chips was collected and put into airtight plastic bags. The measuring positions were systematically distributed from top to bottom all around the pile as described in standard EN 14778 (CEN 2011) in order to secure a representative sampling. The bags of collected chips were transported directly to the lab and put into sealed, moisture and air-tight plastic containers and stored in a +4 oC cold storage room until further analysis. For each CAP_M, a calculation of a calibrated moisture content value (CalF_M) was done with the calibration function from the results of regression analysis (Eq. 3) in Part 1.
For determination of REF_M a Metso MR Moisture Analyzer (Metso) instrument were used, as is has been proven to be faster and as accurate and precise as the oven drying method (Fridh et al 2014). The Swedish Timber Measurement Control Commission has approved the Metso to replace the oven drying method for the determination of moisture content for payment of biomass fuels, in accordance with the requirements of the Swedish Timber Measurement Act. The machine uses the technical principle of magnetic resonance (MR) to measure moisture content and it has several benefits compared to oven drying method. As mentioned it is fast and have very high accuracy and precision in measuring moisture content of biomass fuel (Fridh et al. 2014). In addition, it has the advantage of being a non-destructive method, i.e. samples can be measured again if necessary. Thus, the samples can be stored in the same sealed container used for the measuring procedure, without deviation in moisture content between sampling times. The above described benefits: approved, fast, accurate and non-destructive measurements were the reason to use the Metso instead of oven drying method. A detailed description for technical principal of MR can be found in (Järvinen 2013).
To analyse the effect of calibration function, the difference DIFF_Mijk between the instrument’s moisture content when using calibration function or not and the reference moisture content, was calculated as VALUE_Mijk – REF_Mij where i is the sample identification, j is the pile identification and k is the use of calibration function Yes or No. PROC GLM in SAS was used for the statistical analyses and to test if piles of chips (Pile), the calibration function (CalF) and the interaction between them (Pile × CalF) had any effect on DIFF_M the following linear model was used:
![]()
PROC MEANS in SAS was used for statistical analyses of mean, variance and 95% confidence interval (CI) for moisture values REF_M and CalF_M of each pile. The number of measurements (n) i.e. samples, required to determine population mean moisture content with calibrated capacitance meter (CalF_M) and oven drying method (REF_M), within: a) CI = ±2.5 percentage points (pp), b) CI = ±5.0 pp were determined according to Thompson (2012):
![]()
where z equals 1.96 at α/2 significance level were α = 0.05, i.e. a 95% CI, σ2 is the variance and d is equal to CI, i.e. CI = ±d pp.
3 Results
3.1 Part 1: Accuracy and precision of handheld moisture meter
On average, the capacitance meter significantly underestimated moisture content by 6.0 pp compared to the reference method. The 95% confidence interval for repeatability of measurements on the same sample was ±3.8 pp of the mean. The analysis of the results for the fixed parameter M_CL showed a significant effect on the difference (DIFF_M) between CAP_M and REF_M. In M_CL 2, 3 and 4 the capacitance-instrument significantly underestimated moisture content with between 4–6 pp and for M_CL 5 by almost 12 pp (Fig. 1). The results confirmed the assumption that a calibration of the moisture meter was necessary. Since the nominal CAP_M values were of a similar magnitude in M_CL 4 and 5 it was decided to restrict the calibration to M_CL 2 to 4.
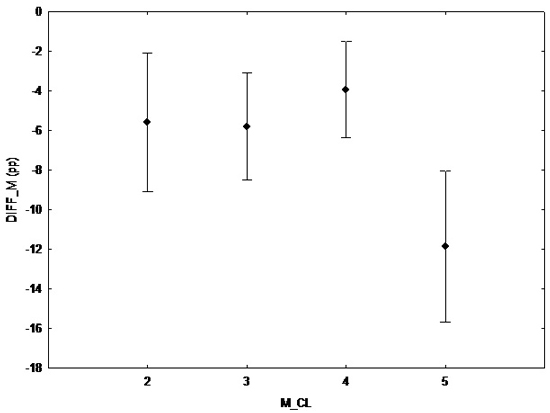
Fig. 1. The difference in moisture content (DIFF_M) pp between the capacitance meter and the reference measurement per moisture content class (M_CL). The markers show the least square mean and bars the 95% confidence interval.
The eight degrees’ polynomial regression analysis with backward selection stopped at local minimum of the Mallows C(p) criterion 4.02684 with the parameter estimates shown in Table 2. The selected regression model can be used to calibrate the moisture value of the capacitance meter for wood chips with M < 50% were the calibrated moisture value (CalF_M) is calculated according to Eq. 3 using the parameters in Table 2.
| Table 2. Parameter estimates for the selected polynomial regression model with backward selection, stopped where the local minimum of the Mallows C(p) criterion was 4.02684. | ||||
| Parameter | DF | Estimate | t Value | Pr > |t| |
| Intercept | 1 | 264.090497 | 2.30 | 0.0226 |
| CAP_M | 1 | –44.201559 | –2.27 | 0.0244 |
| CAP_M2 | 1 | 3.015468 | 2.37 | 0.0187 |
| CAP_M3 | 1 | –0.095332 | –2.38 | 0.0184 |
| CAP_M4 | 1 | 0.001435 | 2.35 | 0.0200 |
| CAP_M5 | 1 | –0.000008309 | –2.30 | 0.0230 |
3.2 Part 2: Field evaluation
The reference measurements for all collected chip samples showed a large variation of moisture content both within and between piles (Fig. 2). Pile 2 had the most heterogenic moisture content with 7.4 pp standard deviation of mean, where moisture content ranged from 19.3% to 56.0%. Pile 5 was most homogenic with 1.8 pp standard deviation of mean and moisture content ranged from 25.2% to 31.6% The analysis of the difference DIFF_M between the instrument’s moisture content when using calibration function or not showed that use of calibration function had a significant effect by 3.6 pp higher accuracy in moisture content determination (Table 3). The effect of Pile and calibration function (CalF) on DIFF_M showed that both parameters were significant but the interaction between them was not (Table 4). Piles were divided into three groups, one where moisture content was overestimated and two where moisture content was underestimated (Table 5). Although the precision for the capacitance meter is lower than for the oven drying method, this can be compensated by an increased sample size to reach the same precision in the estimate of the mean moisture content. Table 6 shows the necessary sample size (n) to estimate the population mean moisture content in each pile with a certainty of 2.5 and 5 pp by the oven drying method (REF_M) and the calibrated capacitance meter (CalF_M).
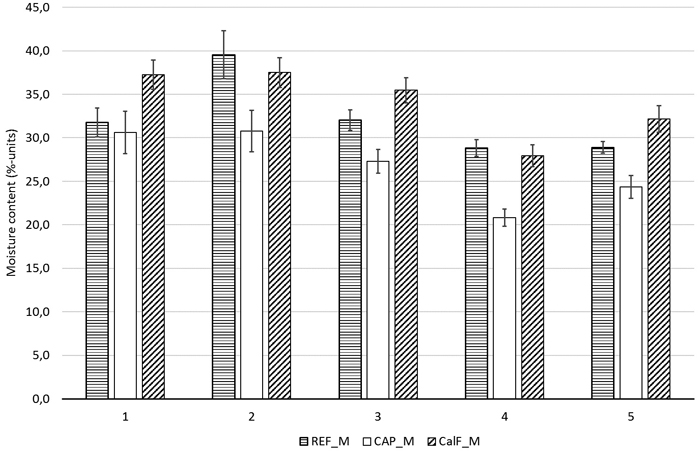
Fig. 2. Estimated mean moisture content with 95% confidence intervals for the 5 piles according to the oven drying method (REF_M), the capacitance meter (CAP_M) and the calibrated capacitance meter (CalF_M). N = 30 for each pile.
| Table 3. Least square mean and 95% confidence intervals (CI) for the difference in moisture content (DIFF_M) between the capacitance meter and the reference method, when the calibration function (CalF) was used (Yes) or not (No). | |||
| CalF | DIFF_M LSMean | 95% CI | |
| No | –5.449333 | –6.225522 | –4.673144 |
| Yes | 1.832742 | 1.056553 | 2.608931 |
| Table 4. Effects of pile (Pile) and calibration function (CalF) and the interaction (Pile × CalF) on the difference in moisture content between the capacitance meter and the reference method, from the general linear model analysis. | ||||
| Source | DF | Type III SS | F Value | Pr > F |
| Pile | 4 | 2284.109857 | 24.48 | <0.0001 |
| CalF | 1 | 3977.146342 | 170.48 | <0.0001 |
| Pile × CalF | 4 | 28.267717 | 0.30 | 0.8759 |
| Table 5. Least square means (LSMean) of difference in moisture content (DIFF_M) and grouping from Tukey pairwise test of means, were LSMeans with the same grouping letter are not significantly different. | ||
| PILE | DIFF_M LSMEAN | Tukey Grouping |
| 1 | 2.139 | a |
| 2 | –5.405 | b |
| 3 | –0.674 | c |
| 4 | –4.444 | b |
| 5 | –0.656 | c |
| Table 6. Necessary sample size (n) to estimate the population mean moisture content in each pile, by: REF_M and calibrated capacitance meter (CalF_M) within a 95% confides interval (CI) of ±2.5 and ±5.0 percentage points (pp). | ||||
| CI ± 2.5 pp | CI ± 5.0 pp | |||
| PILE | REF_M (n) | CalF_M (n) | REF_M (n) | CalF_M (n) |
| 1 | 13 | 13 | 4 | 4 |
| 2 | 34 | 13 | 9 | 4 |
| 3 | 7 | 10 | 2 | 3 |
| 4 | 5 | 8 | 2 | 2 |
| 5 | 2 | 11 | 1 | 3 |
4 Discussion
The precision i.e. repeatability of five measurements on the same sample was between ±3.8 pp, and can be considered to measure moisture content with a comparable precision to other tested dielectric instruments (Forsén and Tarvainen 2000; Jensen et al. 2006; López 2012; Volpé 2013). The relatively low precision of dielectric instruments could make them less suitable than oven drying or instruments using magnetic resonance (Fridh et al. 2014) and NIR (Fridh et al. 2017) for moisture content determination as basis for payment of delivered wood chips. However, the accuracy is acceptable for measuring moisture content in an operational environment, e.g. to decide which heating plant to send the chips to or to see that the chips meets the specifications.
Although the manufacturer calibration was stated to be valid between 12 and 40% moisture content, the Wile Bio Moisture Meter performed acceptably as long as moisture content was below 50%. It consistently underestimated moisture content, but this was possible to correct with a calibration function. For moisture content above 50% the underestimation increased drastically as was the variance in CAP_M. This can be expected given the technical limitations of the capacitance technology (Skaar 1988). Thus, it was not possible to make a reliable calibration function based on CAP_M for M_CL 2–5 given the sample size. However, to base the calibration function on CAP_M is not the best way to enhance the precision of the instrument. In fact, it would be far wiser to create an entirely new calibration curve based on the capacitance values recorded by the capacitance meter than to try to calibrate the presented moisture content values. This enables the user to more precisely define the type of chip assortment for which the curve is valid, and a homogenous assortment improves the possibility for the moisture meter to produce accurate estimates of moisture content (Jensen et al. 2006). Jensen et al. (2006) notes that individual calibration functions for the biomass types measured should preferably be used instead of a more general calibration function. New calibration curves have successfully been produced in a Canadian study for a number of wood chip assortments with moisture content ranging from 10–70% (Volpé 2013). The only time when it would be preferable to use the moisture content values read from the device as basis for a calibration curve is if a large amount of data already has been collected with the meter and there is a need to calibrate that dataset.
As could be expected from the lab test the CAP_M tended to underestimate moisture content in the operational test. Moisture content was underestimated for four out of five piles. The calibration function improved the estimates of moisture content, but for three of the five piles moisture content was overestimated. The capacitance meter significantly overestimated moisture content by 1.8 pp compared to the reference values. One of the reasons for the difference is probably due to differences between the lab study were measurements were made on chips in a large bucket compared to the field measurements were the probe were inserted into the stack of chips. Furthermore, temperature is known to affect the dielectric constant (Skaar 1988; Sjöström 2011) and the temperature during the field measurement was about 10 centigrade lower than in the lab. The sensitivity of the capacitance meter to external factors suggests that the accuracy of the instrument might depend on the homogeneity of the chip assortment measured (cf. Jensen et al. 2006; López 2012) further studies are needed to clarify this. This and the inability of the calibrated instrument to accurately estimate moisture content in the new conditions suggests that calibration curves are needed not only for each chip type but also for each region in which measurements are made in order to minimize systematic errors.
In all cases, except one, the variance in moisture content was larger for the capacitance meter before and after calibration than for the reference method. This exception is pile 2 were the variance in moisture content of the reference method was high as well as the maximum recorded moisture content. The tendency of the capacitance meter to severely underestimate moisture content in of fuels above 50% in moisture content, noted in the lab trial, will lead to a reduced range of moisture content for the capacitance meter compared to the oven drying method which explains at least a part of the lower variance for the capacitance meter.
An important lesson learnt during the field trial was that there can be considerable variation in moisture content within a chipped truckload of stored logs. Without prior knowledge of this variance it is hard to decide what the appropriate number of samples should be to reach the desired level of sampling accuracy. Furthermore, if a set number of samples is taken and thereafter mixed and homogenised to a general sample, as is done when moisture content of fuel chips is commercially measured, the information of the sample variance is lost which makes it impossible to estimate the true sampling accuracy. Thus, there is no way to guarantee that the desired accuracy has been achieved.
Depending on which of the five studied piles moisture content is going to be determined for, between 2 and 34 samples are needed for the reference oven drying method to secure a sampling accuracy within 2.5 pp from the “true value”. This makes it hard to decide on a set number of samples that will give the desired sampling accuracy and at the same time will be both feasible to handle and possible to handle at a reasonable cost. However, it is no alternative to take a too small sample and do a complimentary sampling after 24 hours if that sample proved to be too small, so it is necessary to have a safety margin when collecting the samples. The capacitance meter on the other hand is less accurate in measuring moisture content and in most cases, needs a larger sample to reach the desired accuracy. If the capacitance meter was able to continuously calculate the standard deviation in addition to the calculated mean moisture content, it would allow the user to adapt the sampling frequency to the variance in each load. If the user is aware of the estimated sampling accuracy as the sampling progresses a few extra samples will not cause any large amounts of extra work or extra sampling costs. It’s possible to increase sampling efficiency as more samples, than the minimum stipulated are taken, if the variance in the pile or load is high. But on the other hand, the minimum number of samples doesn’t need to be unnecessarily large since extra samples can be gathered when needed.
In the end, it should be a feasible solution for small plants or terminals to use the capacitance meter when measuring moisture content, even when moisture content is going to be used in to calculate energy content for payment to the seller of the biomass. In these sites, samples currently are collected by the truck drivers and thereafter stored in the truck until it reaches a plant where they can be dried. This leads to a risk for inaccuracies due to the sampling procedure and handling of the samples. Because it is easy and fast to take samples using a handheld device it should be possible to get as good results with a capacitance meter, provided that:
- The device is calibrated for the assortment measured
- A sufficient sampling frequency depending on the moisture content variation in the load
- Regular follow ups are made on the accuracy of the instrument and a recalibration is made when necessary
- No measurements are made on frozen material.
However, it is crucial that calibration functions are made for the assortments for which moisture content is going to be determined, and to do this the assortments has to be more precisely defined. Stem wood chips is not a precise enough definition. It has to be further refined, e.g. a definition could be high density, P45 stem wood chips, so that the precision of the measurement device can be fully utilised.
5 Conclusion
The Wile Bio Moisture Meter have a relatively low precision (±3.8 pp).
The instrument underestimated moisture content, and should not be used on materials with a moisture content above 50%. However, for moisture content ranging from 20% to 50% the systematic error was easy to correct with a calibration function.
However, the ease of use and measurement speed enables more samples to be taken than for the reference method, which increases the sampling precision. For materials with moisture content <50% it is therefore possible to reach the same overall accuracy with the capacitance meter as with the reference method at a reasonable cost.
The accuracy of instrument varied between the two parts of the tests. This was not unexpected given the technology used, but raises some concerns and necessitates further studies.
Acknowledgements
This work was funded by the Swedish forest and energy sector and the Swedish Energy Agency (grant no. 40407-1).
References
Björklund L. (2014). Mätning av trädbränslen. [Measurement of woody biomass fuel]. SDC, Uppsala. [In Swedish].
CEN (2009a). EN 14774-1 Solid biofuels – determination of moisture content – oven dry method – part 1: total moisture – reference method. European committee for standardization.
CEN (2009b). EN 14774-2 Solid biofuels – determination of moisture content – oven dry method – part 2: total moisture – simplified method. European committee for standardization.
CEN (2011). EN 14778 Solid biofuels – sampling. European committee for standardization.
Farmcomp (2017). Wile Bio moisture meter. Farmcomp Oy, Finland. http://www.farmcomp.fi/en/wile/products/wile-for-wood/wile-bio-moisture-meter.
Forsén H., Tarvainen V. (2000). Accuracy and functionality of hand held wood moisture content meters. Technical Research Centre of Finland. Espoo, Finland. ISBN-10 9513855813.
Fridh L. (2012). Utvärdering av portabla fukthaltsmätare. [Evaluation of portable moisture meters]. Skogforsk, Uppsala. Arbetsrapport no 781. [In Swedish].
Fridh L., Volpé S., Eliasson L. (2014). An accurate and fast method for moisture content determination. International Journal of Forest Engineering 25(3): 222–228. https://doi.org/10.1080/14942119.2014.974882.
Fridh L., Volpé S., Eliasson L. (2017). A NIR machine for moisture content measurements of forest biomass in frozen and unfrozen conditions. International Journal of Forest Engineering 28(1): 42–46. https://doi.org/10.1080/14942119.2017.1297521.
Ghaffariyan M.R., Brown M., Acuna M., Sessions J., Gallagher T., Kühmaier M., Spinelli R., Visser R., Devlin G., Eliasson L., Laitila J., Laina R., Wide M.I., Egnell G. (2017). An international review of the most productive and cost effective forest biomass recovery technologies and supply chains. Renewable and Sustainable Energy Reviews 74: 145–158. https://doi.org/10.1016/j.rser.2017.02.014.
ISO (2014). ISO 17225-1 Solid biofuels – fuel specifications and classes – part 1: general requirements. International Organization for Standardization.
ISO (2015a). ISO 18134-1 Solid biofuels – determination of moisture content – oven dry method – part 1: total moisture – reference method. International Organization for Standardization.
ISO (2015b). ISO 18134-2 Solid biofuels – determination of moisture content – oven dry method – part 2: total moisture – simplified method. International Organization for Standardization.
Jensen P.D., Hartmann H., Böhm T., Temmerman M., Rabier F., Morsing M. (2006). Moisture content determination in solid biofuels by dielectric and NIR reflection methods. Biomass and bioenergy 30(11): 935–943. https://doi.org/10.1016/j.biombioe.2006.06.005.
Järvinen T. (2013). Rapid and accurate biofuel moisture content gauging using magnetic resonance measurement technology. VTT Technical Research Centre of Finland, VTT Technology 89.
Kons K., Bergström D., Eriksson U., Athanassiadis D., Nordfjell T. (2014). Characteristics of Swedish forest biomass terminals for energy. International Journal of Forest Engineering 25(3): 238–246. https://doi.org/10.1080/14942119.2014.980494.
Koppejan J., Van Loo S. (eds.) (2012). The handbook of biomass combustion and co-firing. Routledge. 464 p. ISBN-10 1136553770.
López I. (2012). Estimation of performance and methodologies of moisture devices for wood chips for small entrepreneurs. Conference paper, 20th European Biomass Conference and Exhibition, 18–22 June 2012, Milan, Italy.
Olsson O., Eriksson A., Sjöström J., Anerud E. (2016). Keep that fire burning: fuel supply risk management strategies of Swedish district heating plants and implications for energy security. Biomass and Bioenergy 90: 70–77. https://doi.org/10.1016/j.biombioe.2016.03.015.
Routa J., Kolström M., Ruotsalainen J., Sikanen L. (2015). Precision measurement of forest harvesting residue moisture change and dry matter losses by constant weight monitoring. International Journal of Forest Engineering 26(1): 71–83. https://doi.org/10.1080/14942119.2015.1012900.
Roux S., Ireland D., Kent T., HETAS (2010). Moisture content assessment methods for woodfuel. Conference paper, COST FP0902, Harvesting Biomass: a Global State of the Art, Trento, 10 October 2010.
SFS (2014). Lag om virkesmätning. [Timber measurement Act]. SFS 2014:1005. Svensk författningssamling. [In Swedish].
Sjöström L. (2011). Tekniska principer för fukthaltsmätning av skogsbränsle. [Technical principles for moisture content measurements of forest fuel]. Skogforsk, Uppsala. Arbetsrapport no 754. [In Swedish].
Skaar C. (1988). Electrical properties of wood. In: Wood-water relations. Springer. p. 207–262.
Skogsstyrelsen (2014). Skogsstyrelsens föreskrifter om virkesmätning. [Swedish Forest Agency regulations of timber measurement]. SKSF 2014:11. Skogsstyrelsen. [In Swedish].
Sosa A., Acuna M., McDonnell K., Devlin G. (2015). Managing the moisture content of wood biomass for the optimisation of Ireland’s transport supply strategy to bioenergy markets and competing industries. Energy 86: 354–368. https://doi.org/10.1016/j.energy.2015.04.032.
Thompson S.K. (2012). Sampling. Wiley, New York. ISBN 978-0-470-40231-1.
Volpé S. (2013). Moisture meters for biomass. FPInnovations, Montreal. Advantage report vol. 14 no 5.
Total of 28 references.
Send to email
