Virginia Morales Olmos  ,
Jacek P. Siry
,
Jacek P. Siry
The Law of One Price in global coniferous sawlog markets
Morales Olmos V., Siry J. P. (2018). The Law of One Price in global coniferous sawlog markets. Silva Fennica vol. 52 no. 1 article id 6999. https://doi.org/10.14214/sf.6999
Highlights
- The Law of One Price did not hold for North American, European and South American sawlog markets between 1995–2012
- There are long-term relationships between some of the analyzed sawlog prices in these markets
- The Law of One Price may hold between sawlogs traded in Sweden and Norway, Norway and Finland, and Canada West and US Northwest.
Abstract
With progressing globalization of forest production, roundwood prices in different countries may follow similar trends. The Law of One Price (LOP) postulates that the price of a similar product should be the same in different markets when expressed in the same currency. The objectives of this research were (1) to test the LOP in selected coniferous sawlog markets, and (2) to analyze whether a common market – the European Union – leads to the existence of a single sawlog market. The analysis included Brazil, Chile, Finland, Germany, Norway, Poland, Russia Northwest, Sweden, the US South, the US Northwest, Canada East, and Canada West. The results suggest that some of the coniferous sawlog markets were cointegrated which means that they shared a long-term relationship even if in the short-term they do not necessarily adjust to each other. The LOP may hold between coniferous sawlog markets in Sweden and Norway from 1995 through 2012 when sawlog prices were expressed in USD, and in Norway and Finland for 2001–2012 for prices in EUR. Furthermore, the LOP may hold for North American markets in the West for 2004–2012.
Keywords
cointegration;
roundwood prices;
international trade
-
Morales Olmos,
Universidad de la República-Sede Tacuarembó, Ruta 5. km, 386.200, Tacuarembó, CP 45000, Uruguay
E-mail
vmolmos@gmail.com
- Siry, Warnell School of Forestry and Natural Resources, University of Georgia, 180 E. Green Street, Athens, GA 30602-2152, USA E-mail jsiry@uga.edu
Received 14 March 2017 Accepted 11 January 2018 Published 19 January 2018
Views 80972
Available at https://doi.org/10.14214/sf.6999 | Download PDF

1 Introduction
It has been argued that the increasing globalization of roundwood markets and competition would cause the prices of similar roundwood products to move together (Toivonen et al. 2002). Despite different price levels and pricing systems around the world, some sawlog markets appear to have followed similar trends in recent decades. If the price of a similar product is the same in different markets when expressed in the same currency, the Law of One Price (LOP) is said to hold. As for sawlog markets, several studies have tested the LOP for some regions in the world, but we are not familiar with any study covering leading markets in Europe, South America, and North America.
Previously, the LOP was tested for hardwood pulpwood, mixed hardwood sawlogs, and oak sawlogs in Alabama, Arkansas, Louisiana, Mississippi, Tennessee, and Texas from 1977 through 1997 (Nagubadi et al. 2001). The LOP did not hold but these markets were found to be partially integrated. Two or more markets are partially integrated if the prices follow similar trends in the long-term. If a linear combination of non-stationary variables is stationary, that is, sharing a long-run equilibrium relationship, they are said to be cointegrated (Hamilton 1994). Therefore, even though shocks to one variable might lead to disequilibrium in the short-term, in the long-term there is an equilibrium relationship. Therefore, prices will adjust to a long-term relationship. For a similar group of states – Texas, Louisiana, Alabama, Florida, Georgia, South Carolina, Mississippi, and Arkansas – but different products – pine sawlogs and pine pulpwood – cointegration was tested for the period 1977–1996 (Yin et al. 2002). Results were similar to Nagubadi et al. (2001), showing that the markets were partially integrated. Morales Olmos and Siry (2015) tested for the LOP pulpwood markets from 1988 through 2012 in the US, Canada, Germany, Sweden, Finland, Norway, France, Spain, Chile, Brazil, New Zealand, and Australia. They found that the LOP did not hold for most of the markets studied with the exception of coniferous pulpwood markets in Germany and Norway.
Cointegration was also tested for sawlog markets in the Scandinavian countries – Finland, Norway, Sweden – among themselves and with other countries in Europe, including Austria, Lithuania, Estonia, and Germany (Toivonen et al. 2002; Toppinen et al. 2005; Toppinen 1998). More recently, price integration of domestic and imported sawlogs and pulpwood in Finland was analyzed (Kuuluvainen et al. 2017). The results indicate that prices of imported and domestic sawlogs and pulpwood were closely connected during 2002–2014 and that domestic prices influenced import prices. The LOP was found to hold for pine sawlog prices in the Finnish markets after the structural changes in the 1980s and mid-1990s (Toppinen 1998). Furthermore, Finnish pine and spruce sawlog prices were cointegrated with Swedish prices but not with Austrian prices during 1980–1997. Toivonen et al. (2002) used correlation and pairwise regression analysis because of the lack of data prevented the use of the Johansen method to test for cointegration. One of the goals of Toivonen et al. (2002) was to study the roundwood markets of Sweden, Finland, and Austria after they have joined the European Union in 1995 because the common European market might have led to greater market integration. Finnish spruce sawlog prices were also tested for cointegration with Estonian and Lithuanian prices during 1996–2004 (Toppinen et al. 2005). The authors found that Finnish spruce sawlog prices were cointegrated with Lithuanian prices, and Estonian prices were cointegrated with Lithuanian prices.
The LOP was also tested in international forest products trade. For example, Hänninen et al. (1997) tested the LOP for the United Kingdom newsprint imports from Finland, Sweden, Canada, and Germany from 1989 to 1994. They found that the LOP did not hold except between Swedish and Canadian prices. Further, Hänninen (1998) tested the LOP in the United Kingdom coniferous lumber imports from Finland, Sweden, Canada, and Russia from 1978 through 1992. The findings indicated that the LOP did not hold.
The objectives of this research were (1) to test the LOP in coniferous sawlog markets in Europe, South America and North America; and (2) to analyze whether a common market – the European Union – leads to the existence of a single sawlog market.
In particular, Brazil, Chile, Finland, Germany, Norway, Poland, Russia Northwest, Sweden, the US South, the US Northwest, Canada East, and Canada West were included in the analysis. The data were grouped into four separate datasets and analyzed as follows: (1) as pairs of markets for 1995–2012 prices in US dollars (USD) in Europe, South America, and North America, (2) as regional markets for 2004–2012 prices in USD in North America (US South, US Northwest, Canada East, and Canada West), (3) as pairs of markets including the following countries: Germany, Sweden, Norway, and Finland for 1995–2012 prices in euros (EUR), and (4) as groups of markets including the following countries: Norway, Sweden, Finland, Poland, Germany, and Russia Northwest for 2001–2012 prices in EUR. These groupings were developed based the level of market development, including overall production and trade. Pairwise combinations were used to better understand the dynamics between individual markets. In some instances, shorter data series were analyzed as necessitated by data availability. The reminder of the paper introduces price data and methods, results, followed by discussion along with recommendations for further research.
2 Data and methods
2.1 Data
The Food and Agriculture Organization (FAO) reports the production of sawlogs and veneer logs together. Sawlogs and veneer logs are defined as roundwood used in manufacturing of sawnwood, railway sleepers and veneer (FAO 2013a). This research is focused on sawlogs, recognizing that the veneer logs and sawlog categories sometimes overlap. The distinction between sawlogs and veneer logs usually depends on log size and quality.
The production of coniferous sawlogs and veneer logs was 626.1 million cubic meters (m3) in 2012 (FAO 2013b). The countries included in this analysis produce more coniferous than non-coniferous sawlogs, except for Brazil (Table 1). The location of the regions or countries included in the analysis are presented in Fig. 1. The US and Canada are the leading producers of coniferous sawlogs with 21.4% and 18.4% of the world output, respectively. Finland, Germany, Norway, and Sweden supplied together 12.5% of the global coniferous sawlog output. Mostly, sawlogs are used in the production of sawnwood, followed by plywood and veneer. Chile, Finland, Russia and Sweden export much of their sawnwood production.
| Table 1. Sawlog and veneer log production in the selected countries. | |||||
| Country | Coniferous (in ´000 m3) | Non-Coniferous (in ´000 m3) | Total (in ´000 m3) | Percent coniferous world production | Percent non-coniferous world production |
| Brazil | 30 000 | 32 950 | 62 950 | 4.8% | 11.9% |
| Canada | 115 500 | 6598 | 122 098 | 18.4% | 2.4% |
| Chile | 15 523 | 624 | 16 147 | 2.5% | 0.2% |
| Finland | 18 526 | 796 | 19 322 | 3.0% | 0.3% |
| Germany | 23 457 | 3175 | 26 632 | 3.7% | 1.1% |
| Norway | 4458 | 2 | 4460 | 0.7% | 0.0% |
| Poland | 11 748 | 2827 | 14 575 | 1.9% | 1.0% |
| Russia | 67 200 | 17 300 | 84 500 | 10.7% | 6.2% |
| Sweden | 32 100 | 200 | 32 300 | 5.1% | 0.1% |
| US | 133 742 | 33 369 | 167 111 | 21.4% | 12.0% |
| Total world | 626 121 | 277 838 | 903 959 | 32.4% | 20.8% |
| Source: FAO 2013b | |||||
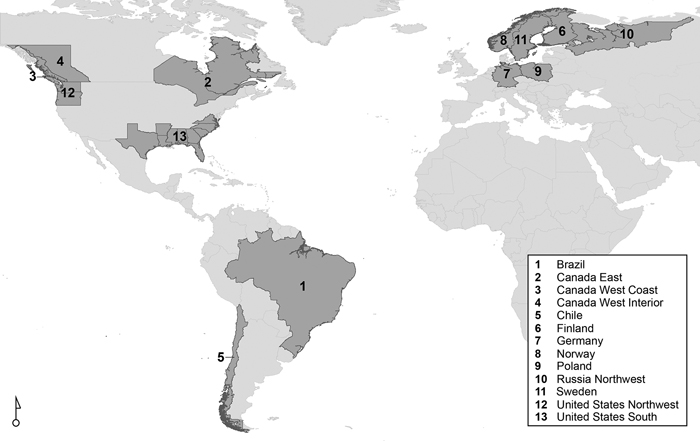
Fig. 1. Selected regions.
Sawlog prices were obtained from Wood Resources International Inc. (WRI). WRI reports delivered sawlog prices in nominal USD per m3 by species. WRI selected price series for reporting if conifer lumber production in the region was among the 25 top producing regions of the world, conifer log grades were commonly processed in the region, and log species and grades were mainly average logs being processed for construction and better grades lumber in the region. We assembled coniferous sawlog price series into a single database. While with pulpwood it may be easier to find similar log specifications across the markets, sawlog specifications might differ quite substantially. In the database used, prices correspond to an average log in terms of quality. The countries or regions included in the analysis were the US South, the US Northwest, Canada East, Canada West, Norway, Sweden, Finland, Brazil, Chile, Germany, Poland, and Russia Northwest.
The data were available from the first quarter of 1995, except for sawlog prices in Russia Northwest and Poland, which were first reported in the first quarter 2001 and the first quarter of 1998, respectively, and for prices in North America, which were available for all regions since 2002. During 2002–2014, average sawlog prices in the US Northwest were the highest in North America, while average pine prices in Germany were the highest in Europe (Table 2). Russian pine prices had the highest average variation in the period while the US South sawlog prices had the lowest variation.
| Table 2. Coniferous sawlog nominal delivered prices, in USD per m3. | ||||||
| Sawlog market | Number of observations | Mean | Standard deviation | Coefficient of variation | Min. | Max. |
| Norway | 71 | 76.24 | 16.5 | 22% | 51 | 117 |
| Sweden | 71 | 75.28 | 15.43 | 20% | 51 | 110 |
| Finland | 71 | 86.07 | 19.11 | 22% | 58 | 130 |
| Brazil | 71 | 42.12 | 20.49 | 49% | 16 | 78 |
| Chile | 71 | 39.19 | 5.17 | 13% | 31 | 48 |
| Germany | 71 | 110.14 | 27.05 | 25% | 67 | 166 |
| Poland | 59 | 62.56 | 18.25 | 29% | 41 | 107 |
| Russia Northwest | 46 | 45.73 | 17.2 | 38% | 23 | 80 |
| US South | 43 | 66.19 | 3.8 | 6% | 60 | 72 |
| US Northwest | 43 | 91.42 | 16.59 | 18% | 53 | 119 |
| Canada East | 43 | 65.33 | 8.59 | 13% | 46 | 77 |
| Canada West (Coast)(1) | 43 | 50.05 | 6.03 | 12% | 39 | 65 |
| Canada West (Coast)(2) | 35 | 76.51 | 10.57 | 14% | 57 | 97 |
| Canada West (Interior) | 43 | 43.02 | 5.53 | 13% | 32 | 53 |
| (1) Hemlock; (2) Douglas-fir | ||||||
Further, the prices in selected European and South American countries were converted to EUR denominated series. The EUR/USD exchange rate dating back to 1995 was obtained from the Organization for Economic Cooperation and Development (OECD) (OECD 2013). The Eurozone came to existence in 1999 when EUR arrived as an accounting currency; EUR coins and banknotes were subsequently introduced in 2002 (European Union 2014). The OECD developed a EUR/USD exchange rate series from 1995 using a basket of currencies. Norway, Sweden, Finland, and Germany had the highest average sawlog prices, while the South American countries – Brazil and Chile – showed the lowest average prices during the period. Coniferous sawlog prices in Brazil had the highest variation in the period 1995–2012, while prices in Chile had the lowest variation.
Between 1995 and 2012, several factors have affected roundwood prices. Storms affected Europe numerous times: Central Europe in 1999; Sweden in 2004; and several Northern and Central European countries in 2006, with Germany being the most affected. These storms resulted in harvests necessitated by salvage operations, with subsequent price impacts (Wood Resources International 2004, 2006). Overall, sawlog prices in Norway, Sweden and Finland followed similar trends during the period, until the beginning of 2000. In 2007, Russia imposed a tax on log exports affecting sawlog export prices with consequences for European markets, especially Finland (Wood Resources International 2007). This change in taxes resulted in a decrease of softwood imports from Russia in the last quarter of 2007 (Wood Resources International 2008). Consequently, Finnish sawlog prices increased in this period.
Brazilian prices in USD started to increase in 2003 and they followed the pattern of some European countries but at a lower level. The decrease of prices in 2008 was related to the worldwide financial crisis, followed by the housing starts collapse in the US and other countries. Furthermore, Russia has had its own economic crisis. Despite weak sawnwood markets in Europe, in 2010 sawlog markets were recovering with prices increasing in Europe and Brazil (Wood Resources International 2010).
The US South showed fewer changes in prices than other markets. In 2008, lumber markets were declining in the US (Wood Resources International 2008). Comparing regions, prices in the US Northwest varied more than prices in the US South. Hemlock sawlog prices in Canada West Coast showed a similar trend to coniferous sawlog prices in Canada West Interior. Douglas-fir sawlog prices in Canada West showed more variation than the rest of the analyzed price series in Canada.
Comparison of prices expressed in EUR for several European countries (Germany, Finland, Sweden, Norway, Poland, and Russia) and South American countries (Brazil and Chile) indicated that average prices in Norway and Sweden were similar in 1995–2012 (Table 3). Prices in EUR had less variation than prices expressed in USD and Brazil had again the highest variation among the analyzed countries. During the 2008 crisis, prices in EUR recovered faster than prices in USD. These different dynamics might affect the results of the analysis depending on whether they are conducted in EUR or in USD. In some cases, prices in local currencies were relatively unchanged but prices in USD experienced larger variations.
| Table 3. Coniferous sawlog nominal delivered prices, in EUR per m3. | ||||||
| Sawlog market | Number of observations | Mean | Standard deviation | Coefficient of variation | Min. | Max. |
| Norway | 71 | 62.6 | 6.2 | 10% | 53.3 | 80.7 |
| Sweden | 71 | 62.0 | 6.2 | 10% | 47.6 | 81.1 |
| Finland | 71 | 70.7 | 7.4 | 10% | 60.9 | 94.2 |
| Germany | 71 | 90.3 | 12.8 | 14% | 72.2 | 118.7 |
| Brazil | 71 | 33.6 | 13 | 39% | 15.6 | 54.9 |
| Chile | 71 | 32.6 | 2.9 | 9% | 26.4 | 38.6 |
| Poland | 59 | 51.3 | 8.7 | 17% | 37.1 | 69.4 |
| Russia Northwest | 47 | 35.6 | 9.8 | 28% | 22 | 54.9 |
2.2 Methods
Since the methods applied here have been relatively well known, below we provide only their basic overview and address issues specific to this research. Detailed description of the methods can be found, among others, in Hänninen (1998), Morales Olmos and Siry (2015), and Juselius (2006).
The first step in cointegration analysis is to test individual price series for stationarity. Three tests were applied in this research: the Augmented Dickey-Fuller (ADF) test, the Phillips-Perron (PP) test, and the Augmented Dickey Fuller General Least Squares (ADF-GLS) test.
Despite the fact that the ADF test has been the most widely used test for unit root testing in the literature, the PP test has been shown to be more robust than the ADF test in small samples, and the ADF-GLS test has been shown to be more robust than the previous two tests in large samples. The number of observations needed to be considered a large sample have been discussed by several authors (Juselius 2006; Perron 1991; Shiller and Perron 1985; Perron and Qu 2007). Their conclusion has been that the time span of the sample is more important than the number of observations. In our research, the ADF-GLS test was considered the most appropriate of the three tests described, except in cases where shorter time periods were analyzed, in which cases the PP test was considered more appropriate than the ADF-GLS test. For the ADF and PP tests, the number of lags was selected following the Schwartz Bayesian Criterion (SBIC).
The cointegration method used in this research was developed by Johansen and then extended by Johansen and Juselius (Johansen 1988; Johansen and Juselius 1990). The authors define the vector error correction models (VECM), which are a type of vector autoregressive models (VAR), whereby a restriction is imposed that a long-run equilibrium relationship exists among the variables of the system. If a long-term relationship exists, the variables are said to be cointegrated. In order to test for cointegration, the trace and maximum eigenvalue tests can be used (Johansen 1988; Johansen and Juselius 1990). Both tests are likelihood ratio tests which differ in the alternative hypothesis used. In order to estimate a VECM, Johansen’s approach maximizes the likelihood function of the system of equations subject to the restrictions that there are r cointegrating vectors, with r any natural number. The restriction is implemented by using the fact that the order of cointegration is the rank of π = αβʹ, where α and β are (p × r) matrices, with p the number of variables. If there are r cointegrating vectors, a VAR model can be estimated as a VECM (Juselius (2006) page 116). The coefficient α represents the deviation from the long run, while β represents the cointegrating vector, which will indicate whether the variables share a long-term relationship.
The LOP holds if in a system of p prices there exist p–1 cointegrating vectors meaning that the p markets follow one common trend. If there are fewer than p–1 cointegrating vectors, the markets are considered to be partially integrated (Yang et al. 2000). Therefore, for the LOP to hold, three conditions must be met. First, the p series are cointegrated, second, they are cointegrated in p–1 vectors, meaning that there is a long-term relationship among them, and third, that the β vector could be normalized in order to have two variables with equal magnitude and opposite sign, implying that the prices move together in the long-term.
In analyzing North American coniferous sawlog markets one must account for the US–Canada softwood lumber dispute. This trade dispute dates back to the early 1980s when the US claimed that Canada’s lumber exports were subsidized because stumpage fees were set by provincial governments (rather than markets) at artificially low levels (Gagné 2003; Luckert 2007). It has had four different stages: Lumber I (early 1980s), Lumber II (mid 1980s), Lumber III (1990s), and Lumber IV (started around 2001) (Gagné 2003). After several negotiations and agreements, in 2006 Canada and the US reached the Softwood Lumber Agreement (SLA) whereby the volume imported from Canada would be regulated by quantity; and the amount imported to the US could not exceed 34% of the total consumption (Governments of Canada and the United States of America 2006). Historically, the softwood lumber imports from Canada have averaged 35% of the US consumption, with lower volumes after the 2006 SLA. To analyze the impact of the softwood lumber trade dispute on sawlog prices a dummy variable has been defined as in Eq. 1.
![]()
The cointegration analyses were conducted for 1995–2012 and then for shorter periods when necessitated by limited data availability. For 1995–2012, the following countries were included in pairwise analyses: Norway, Sweden, Finland, Brazil, Chile, and Germany. The analysis was conducted for prices in USD.
The models for North America were estimated for 2002–2012 (the US South, pine; the US Northwest, Douglas-fir; Canada East, mixed coniferous; Canada West Coast, hemlock), and 2004–2012 (the US South, pine; the US Northwest, Douglas-fir; Canada East, mixed coniferous; Canada West Interior, mixed coniferous; Canada West Coast, hemlock; and Canada West Coast, Douglas-fir).
The North American markets tested for cointegration during 2002–2012 were grouped as follows: (1) the US South (pine), the US Northwest (Douglas-fir), Canada East (mixed coniferous), Canada West Coast (hemlock); (2) the US South (pine), Canada East (mixed coniferous); (3) the US Northwest (Douglas-fir), Canada West Coast (hemlock); (4) the US Northwest (Douglas-fir), the US South (pine); (5) the US South (pine), Canada West Coast (hemlock); (6) the US South (pine), Canada West Coast (hemlock); (7) the US Northwest (Douglas-fir), Canada East (mixed coniferous), Canada West Coast (hemlock); and (8) the US Northwest (Douglas-fir), Canada East (mixed coniferous).
For 2004–2012, two groups of North American markets were tested: (1) the US Northwest (Douglas-fir), Canada East (mixed coniferous), the US South (pine), Canada West Interior (mixed coniferous), Canada West Coast (hemlock and Douglas-fir); and (2) the US Northwest (Douglas-fir), Canada West Interior (mixed coniferous), Canada West Coast (hemlock and Douglas-fir).
Then North American markets were tested for cointegration with selected European markets in order to test whether the sawlog prices of traditional producers in the two continents shared a long-term relationship. First, the sawlog prices for Douglas-fir in the US Northwest and for hemlock in Canada West Coast; mixed coniferous in Canada West Interior; and mixed coniferous in Canada East and pine in the US South were tested for pairwise cointegration with coniferous sawlog prices in Finland, Sweden, Norway, Poland, and Russia Northwest.
Finally, the cointegration analysis was conducted for sawlog prices in EUR in order to learn (1) whether prices of the countries in a common market like the European Union shared a long-term relationship, and (2) to test whether the introduction of a common currency would lead to cointegration. Pairwise analyses were conducted for the period 1995–2012 including Germany, Sweden, Norway, and Finland. A groupwise analysis was conducted for the period 2001–2012 including Norway, Sweden, Finland, Poland, Germany, and Russia Northwest. The period 2001–2012 was selected to include the prices from Russia Northwest which became available in 2001.
3 Results
3.1 Pairwise analyses: Norway, Sweden, Finland, Brazil, Chile, Germany, prices in USD (1995–2012)
For the sawlog prices in USD in the period 1995–2012 results showed that the optimal number of lags was either one or two (Table 4). The null hypothesis of a unit root could not be rejected for any of the series tested.
| Table 4. Unit roots for sawlog prices in nominal USD, 1995–2012. | ||||||||
| Sawlog market | SBIC | Levels | First differences | |||||
| ADF | PP | ADF-GLS | ADF | PP | ADF-GLS | |||
| Norway | 2 | –1.75 | –1.52 | –1.57 | –4.62* | –5.52* | –4.04* | |
| Sweden | 2 | –1.57 | –1.57 | –1.74 | –4.62* | –5.67* | –5.10* | |
| Finland | 2 | –1.29 | –1.31 | –1.29 | –4.52* | –6.86* | –2.94* | |
| Brazil | 2 | –0.61 | –0.61 | –0.64 | –4.83* | –6.11* | –4.47* | |
| Chile | 1 | –0.81 | –0.68 | –0.72 | –5.04* | –7.03* | –5.07* | |
| Germany | 2 | –1.17 | –1.17 | –1.28 | –3.98* | –5.86* | –4.73* | |
| (1) SBIC = Schwartz Bayesian Criteria, ADF = Augmented Dickey-Fuller unit root test, PP = Phillips-Perron unit root test, ADF-GLS = Dickey-Fuller General Least Squares unit root test; (2) for the ADF-GLS tests in levels, one lag was used; (3) *significant at 1%, **significant at 5%, ***significant at 10% | ||||||||
The series were differentiated and then tested for unit root again. The null hypothesis of a unit root was rejected which indicates that the series were non-stationary in levels and stationary in first differences. Therefore, the series were integrated of order one, hereafter referred as I(1).
Eight cointegrating relationships between sawlog prices in USD were identified for Sweden and Norway, Chile and Norway, Germany and Norway, Chile and Sweden, Germany and Sweden, Chile and Finland, Germany and Brazil, Germany and Chile (Table 5).
| Table 5. Pairwise cointegration tests for prices in USD, 1995–2012. | |||||
| Sawlog market | Norway | Sweden | Finland | Brazil | Chile |
| Sweden | 20.88 (2) | - | |||
| Finland | 14.05 (2) | 9.75 (3) | - | ||
| Brazil | 14.64 (2) | 11.28 (2) | 11.89 (2) | - | |
| Chile | 22.31 (4) | 16.61 (2) | 16.61 (1) | 14.66 (2) | - |
| Germany | 16.39 (2) | 20.27 (2) | 12.24 (2) | 15.73 (2) | 15.67 (2) |
| (1) The number of lags is in parenthesis; (2) bold font indicates the series that are cointegrated | |||||
Despite the fact that Finland, Germany, and Sweden are part of the European common market, the forest sectors have different structures that might explain the fact that Finland and Sweden, and Finland and Germany did not share a long-term relationship for sawlog prices in USD. Further, the different management regulations in the analyzed countries might lead to different price trends. In the case of South America, Brazil and Chile are two different markets in terms of size, ownership and forest resources. While in Chile only two vertically integrated companies own large sawmills, in Brazil, around 21% of the coniferous plantations are owned by five companies. These characteristics might lead to different degrees of market power. Chilean prices were cointegrated with prices in the Scandinavian countries while Brazilian prices were cointegrated only with German prices.
The VECMs were estimated for the models using two lags (Table 6). The long-term adjustment coefficients β, and the short-term adjustment coefficients α, were normalized to include only the significant coefficients. The test of overidentifying restrictions indicated that the restrictions were significant.
| Table 6. VECM estimates for sawlog prices in USD, 1995–2012. | |||
| Variable | β | α | χ2 |
| Germany | 1 | 0.137 | |
| Sweden | –1.300 | 0.275 | 0.711 |
| C | 0.921 | ||
| Germany | 1 | 0.546 | |
| Norway | –1.275 | 0.194 | 0.460 |
| C | 0.823 | ||
| Chile | 1 | –0.142 | na |
| Norway | –0.712 | 0.278 | |
| C | –0.596 | ||
| Sweden | 1 | –0.172 | na |
| Chile | –1.281 | 0.083* | |
| C | 0.389 | ||
| Sweden | 1 | –0.313 | 0.468 |
| Norway | –0.923 | - | 0.494 |
| C | –0.326 | ||
| Germany | 1 | –0.192 | 0.026 |
| Brazil | –0.461 | - | 0.874 |
| C | –3.010 | ||
| Germany | 1 | –0.164 | na |
| Chile | –1.687 | 0.088 | |
| C | –1.513 | ||
| Finland | 1 | 0.623 | |
| Chile | –1.551 | 0.136 | 0.202 |
| C | 1.264 | ||
| (1) *Significant at 1%, **significant at 5%, ***significant at 10%; (2) the p-value is in italics; (3) C = constant | |||
Results showed that the LOP did not hold except for sawlog prices in USD in Sweden and Norway, meaning the prices in USD in Sweden and Norway were following a similar path. The LOP may hold because the long-term coefficients β were 1 and –0.923 for Sweden and Norway, respectively. Moreover, Swedish prices adjusted in the short term to changes in Norwegian prices.
3.2 Groupwise analyses: North America and Europe, prices in USD for 2002–2012 and 2004–2012
For the sawlog prices in the period 2002–2012 results showed that the optimal number of lags was either one or two (Table 7). The null hypothesis of a unit root could not be rejected for any of the series tested. The series were differentiated and then tested for unit root again. The null hypothesis of a unit root was rejected indicating that the series were non-stationary in levels and stationary in first differences; therefore, the series were I(1). The PP test was considered more appropriate for the analyzed price series because it has been shown to perform better in short series.
| Table 7. Unit roots for sawlog prices in nominal USD, 2002–2012. | ||||||
| Species | Sawlog market | SBIC | Levels | First differences | ||
| ADF | PP | ADF | PP | |||
| Pine | US South | 1 | –1.05 | –1.18 | –5.25* | –6.86* |
| Douglas-fir | US Northwest | 1 | –1.38 | –1.65 | –3.59** | –4.54* |
| Mixed coniferous | Canada East | 2 | –2.41 | –2.35 | –4.92* | –5.23* |
| Hemlock | Canada West (Coast) | 1 | –2.65 | –2.68** | –3.93* | –5.12* |
| Douglas-fir | Canada West (Coast) | 1 | –1.50 | –2.12 | –4.87* | –8.48* |
| Mixed coniferous | Canada West (Interior) | 1 | –1.34 | –1.55 | –3.61* | –7.63* |
| Pine | Germany | 2 | –1.95 | –2.15 | –4.20* | –4.70* |
| Pine | Finland | 2 | –1.99 | –2.50 | –6.60* | –4.63* |
| Pine | Sweden | 2 | –2.13 | –2.24 | –3.68** | –4.07* |
| Pine | Norway | 2 | –1.98 | –2.28 | –3.68* | –3.83* |
| Pine | Poland | 1 | –1.72 | –1.54 | –4.30* | –5.63* |
| Pine | Russia | 1 | –1.83 | –1.71 | –3.59** | –5.30* |
| (1) SBIC = Schwartz Bayesian Criteria, ADF = Augmented Dickey-Fuller unit root test, PP = Phillips-Perron unit root test; (2) significant at 1%, **significant at 5%, ***significant at 10%; (3) Canada West Coast (Douglas-fir) series since 2004 | ||||||
The null hypothesis of non-cointegration could not be rejected for prices in the US Northwest (Douglas-fir), Canada East (mixed coniferous), and Canada West Interior (mixed coniferous) for 2002–2012. These results are not reported here but are available from the authors. Furthermore, when the SLA dummy variable was added, the null hypothesis of non-cointegration was rejected at 1% and the prices were cointegrated in one cointegrating vector. Therefore, the SLA might have had an impact on Canadian and North American coniferous sawlog price behavior. The results of the pairwise cointegration analysis of the North American markets with the European markets for the period 2002–2012, showed that only Polish pine prices were cointegrated at 5% with hemlock prices in the US Northwest and in Canada West Coast. While numerical results are not reported here, they are available upon request.
For 2004–2012 price series, for all the North American markets –the US Northwest (Douglas-fir), the US South (pine), Canada West Coast (hemlock and Douglas-fir), Canada West Interior (mixed coniferous) – including the SLA, the results indicated that there were three cointegrating vectors (Table 8). On the other hand, when the SLA dummy was not included, there were cointegrated in two vectors. This result indicates that SLA may have affected the sawlog price trends in these North American markets.
| Table 8. Cointegration tests for coniferous sawlog nominal prices in USD in North America including the SLA, 2004–2012. | ||||||
| Maximum rank | Trace statistic | Critical value | Maximum eigenvalue statistic | Critical value | ||
| 5% | 1% | 5% | 1% | |||
| US Northwest (Douglas-fir), Canada West Coast (hemlock and Douglas-fir), Canada West Interior (mixed coniferous) | ||||||
| 0 | 68.00 | 47.21 | 54.46 | 32.92 | 27.07 | 32.24 |
| 1 | 35.09* | 29.68 | 35.65 | 18.89 | 20.97 | 25.52 |
| 2 | 16.19 | 15.41 | 20.04 | 13.08 | 14.07 | 18.63 |
| 3 | 3.12** | 3.76 | 6.65 | 3.12 | 3.76 | 6.65 |
| US Northwest (Douglas-fir), Canada West Coast (hemlock and Douglas-fir), Canada West Interior (mix coniferous), US South (pine), Canada East (mixed coniferous) | ||||||
| 0 | 158.58 | 94.15 | 103.18 | 60.84 | 39.37 | 45.10 |
| 1 | 97.74 | 68.52 | 76.07 | 37.74 | 33.46 | 38.77 |
| 2 | 60.00 | 47.21 | 54.46 | 26.23 | 27.07 | 32.24 |
| 3 | 33.77* | 29.68 | 35.65 | 13.54 | 20.97 | 25.52 |
| (1) The number of lags is in parenthesis; (2) *significant at 1%, **significant at 5%, ***significant at 10% | ||||||
When only the Western markets were considered – the US Northwest (Douglas-fir) and Canada West (Coast – hemlock, Coast – Douglas-fir, Interior – mixed coniferous) – and the SLA variable was included, the results showed that the prices were cointegrated in three vectors. Conversely, when the SLA was not considered, the prices were not cointegrated. Therefore, the SLA may have affected the long-term trend of coniferous sawlog prices in the North American markets located in the West.
The two first conditions for satisfying the LOP were met: (1) the price series were cointegrated, and (2) the four prices series were cointegrated in three vectors. In order to test whether the third condition – the β vector could be normalized so that two variables are of equal magnitude and opposite sign, 1 and –1 – was met, the VECM was estimated.
Results from the VECM indicated that the LOP may hold (Table 9). Even though Douglas-fir prices in Canada West Coast and Douglas-fir prices in the US Northwest shared a long-term relationship, the prices in Canada West Coast did not adjust in the short-term to changes in the prices in the US Northwest.
| Table 9. VECM estimates for North American sawlog prices in USD, 2004–2012. | ||
| Region | β | α |
| Vector 1 | ||
| US Northwest (Douglas-fir) | 1 | –0.699 |
| Canada West Coast (hemlock) | 0 | 0.043*** |
| Canada West Interior (mixed coniferous) | 0 | –0.070*** |
| Canada West Coast (Douglas-fir) | –1.469 | 0.033*** |
| C | 1.826 | |
| Vector 2 | ||
| US Northwest (Douglas-fir) | 0 | 0.045*** |
| Canada West Coast (hemlock) | 1 | –0.560 |
| Canada West Interior (mixed coniferous) | 0 | 0.040*** |
| Canada West Coast (Douglas-fir) | –0.947 | –0.157*** |
| C | 0.399 | |
| Vector 3 | ||
| US Northwest (Douglas-fir) | 0 | 0.501 |
| Canada West Coast (hemlock) | 0 | 0.227*** |
| Canada West Interior (mixed coniferous) | 1 | 0.100*** |
| Canada West Coast (Douglas-fir) | –1.718 | 0.517 |
| C | 3.820 | |
| (1) The number of lags used is in parenthesis; (2) *significant at 1%, **significant at 5%, ***significant at 10%; (3) the p-value is in italics, (4) C = constant | ||
Similar results were obtained for hemlock sawlog prices and Douglas-fir prices in Canada West Coast. While both prices shared a long-term relationship, Douglas-fir prices in Canada West Coast did not adjust in the short-term to changes in hemlock sawlog prices in Canada West Coast. Finally, Douglas-fir prices in Canada West Coast shared a long-term relationship with the coniferous sawlog prices of Canada West Interior, and also, they adjusted to changes in sawlog prices. Morales Olmos and Siry (2015) also identified a long-term relationship between coniferous pulpwood prices in the US South, the US Northwest and Canada West from 1988 to 2012; however, the LOP did not hold. Therefore, pulpwood prices in these regions, expressed in USD, were not closely connected.
3.3 Pairwise analyses: Germany, Sweden, Norway, Finland, prices in EUR (1995–2012)
Sawlog prices from Norway and Sweden in EUR were non-stationary in levels under the ADF-GLS test but stationary under the ADF and PP tests (Table 10). The ADF-GLS tests are more robust than PP for large samples as it was previously discussed. Therefore, we are not considering prices from Norway and Sweden in the cointegration analysis as it requires that the prices are non-stationary in levels. For Finnish and German prices, the hypothesis of unit root could not be rejected. Therefore, the price series of Germany and Finland were I(1).
| Table 10. Unit roots for sawlog prices in EUR, 1995–2012. | ||||||||
| Sawlog market | SBIC | Levels | First differences | |||||
| ADF | PP | ADF-GLS | ADF | PP | ADF-GLS | |||
| Norway | 2 | –3.43** | –2.39 | –2.64* | - | –5.19* | - | |
| Sweden | 2 | –2.54 | –2.35 | –2.65* | –4.70* | –5.93* | - | |
| Finland | 2 | –2.04 | –2.07 | –1.32 | –5.36* | –6.76* | –2.94* | |
| Germany | 2 | –1.64 | –1.48 | –1.56 | –4.20* | –5.81* | –5.08* | |
| (1) SBIC = Schwartz Bayesian Criteria, ADF = Augmented Dickey-Fuller unit root test, PP = Phillips-Perron unit root test, ADF-GLS = Dickey-Fuller General Least Squares unit root test; (2) for the ADF-GLS tests in levels, one lag was used; (3) *significant at 1%, **significant at 5%, ***significant at 10% | ||||||||
Sawlog prices in Norway and Sweden expressed in USD and in EUR had different properties. While Finland and Germany share the common currency, the EUR, and sawlogs are traded in this currency within each country, Norway and Sweden are not.
The results suggested that the sawlog prices in Finland and Germany in EUR were not cointegrated during 1995–2012. This result is the same as the result of the cointegration tests for the prices expressed in USD.
3.4 Groupwise analyses: Norway, Sweden, Finland, Poland, Germany, Russia Northwest, prices in EUR (2001–2012)
The period of cointegration analysis of sawlog prices in Russia Northwest with other markets was 2001–2012 since Russian prices were not available prior to 2001. Polish sawlog prices were also included in this analysis because they were available since 1998. The hypothesis of a unit root for sawlog prices in EUR could not be rejected for all the series using ADF, PP, and ADF-GLS tests with a constant (Table 11).
| Table 11. Unit roots for sawlog prices in EUR, 2001–2012. | ||||||||
| Sawlog market | SBIC | Levels | First differences | |||||
| ADF | PP | ADF-GLS | ADF | PP | ADF-GLS | |||
| Norway | 2 | –2.85 | –1.95 | –2.47 | –4.16* | –3.75* | –2.88* | |
| Sweden | 2 | –2.11 | –1.81 | –2.17 | –3.68* | –4.39* | –3.35* | |
| Finland | 2 | –2.12 | –1.80 | –1.90 | –4.15* | –5.05* | –3.48* | |
| Poland | 1 | –1.30 | –1.24 | –1.70 | –3.65* | –6.42* | –3.27* | |
| Germany | 1 | –1.11 | –0.97 | –0.97 | –4.14* | –5.36* | –3.98* | |
| Russia Northwest | 1 | –1.17 | –1.36 | –0.93 | –4.56* | –6.22* | –3.28* | |
| (1) SBIC = Schwartz Bayesian Criteria, ADF = Augmented Dickey-Fuller unit root test, PP = Phillips-Perron unit root test, ADF-GLS = Dickey-Fuller General Least Squares unit root test; (2) for the ADF-GLS tests in levels, one lag was used; (3) *significant at 1%, **significant at 5%, ***significant at 10% | ||||||||
Results showed that seven markets were cointegrated (Table 12). From these results, Norwegian prices were cointegrated with the following prices series: Russia Northwest, Poland, Finland, and Germany. Norway is a small producer compared with the other countries and therefore its prices follow the trend of larger markets.
| Table 12. Cointegration tests for sawlog prices in EUR, 2001–2012. | |||||
| Norway | Sweden | Finland | Germany | Russia Northwest | |
| Sweden | 16.68 (2) | - | |||
| Finland | 22.25 (2) | 15.74 (2) | - | ||
| Germany | 33.26 (3) | 14 -(2) | 16.28 (1) | - | |
| Russia Northwest | 19.25 (2) | 10.78 (2) | 11.50 (2) | 8.17 (2) | - |
| Poland | 22.71 (2) | 8.76 (2) | 16.58 (2) | 12.15 (2) | 22.72 (2) |
| (1) The number of lags is in parenthesis; (2) bold font indicates the series that are cointegrated | |||||
Furthermore, Russian and Polish prices were cointegrated and Finnish and Russian prices were not. This last result might be surprising as the share of Russian roundwood in the Finnish roundwood imports was 65% on average between 2005 and 2011 (FAO 2014). Finally, Finnish prices were cointegrated with German and Polish prices at the 1% significance level.
The VECMs were estimated for the cointegrating relationships identified above. The results showed that the LOP did not hold for any of the cases (Table 13). However, for Norwegian and Finnish sawlog prices in EUR prices the LOP may hold, because one cointegrating vector between the two series was found and also the long-term coefficients, β, were 1 and –1.19. Therefore, sawlog prices in Norway and Finnish expressed in EUR were closely connected during this period. For the rest of the models, all the long-term coefficients had opposite signs, but different numerical values.
| Table 13. VECM estimates for sawlog prices in EUR, 2001–2012. | |||
| Variable | β | α | χ2 |
| Norway | 1 | 1.440 | |
| Finland | –1.190 | 0.328 | 0.229 |
| C | –0.064 | ||
| Germany | 1 | 1.904 | |
| Norway | –1.715 | 0.347 | 0.168 |
| C | 2.596 | ||
| Norway | 1 | 0.180 | 1.597 |
| Poland | –0.210 | 0.206 | |
| C | –3.330 | ||
| Russia Northwest | 1 | 0.163 | |
| Poland | –1.511 | 0.321 | 0.069 |
| C | 2.433 | ||
| Russia Northwest | 1 | 0.953 | |
| Norway | –3.074 | 0.118 | 0.329 |
| C | 9.195 | ||
| Germany | 1 | 0.072 | |
| Finland | –1.87 | 0.232 | 0.788 |
| C | 3.522 | ||
| Finland | 1 | 2.264 | |
| Poland | –0.370 | –0.349 | 0.132 |
| C | –2.835 | ||
| (1) *Significant at 1%, **significant at 5%, ***significant at 10%; (2) the p-value is in italics, (3) C = constant | |||
For the models in which the short-term adjustment coefficients α was non-significant, constraints were imposed to include all the significant coefficients. The tests of overidentifying restrictions showed that the restrictions were significant in all cases. Furthermore, the short-term adjustment coefficients showed that all the prices adjusted rapidly in the short-term to changes in the other country’s prices.
4 Discussion
The results indicate that sawlog prices expressed in USD were cointegrated during 1995–2012 in the following countries: Norway with Sweden, Chile, and Germany; then Sweden and Germany; Chile and Sweden; Finland and Chile; Chile and Germany; and Brazil and Germany. These results further suggest the existence of a long-term relationship between selected sawlog markets even though some short-term deviations from the equilibrium might exist. However, the LOP did not hold for any of the cointegrated markets. On the other hand, sawlog prices in USD in Norway and Sweden shared a long-term relationship and the LOP may hold. In these two Scandinavian countries, sawlog prices were negotiated until early 1990s. Sawlog prices in Norway had been determined by central negotiations until 1984 when they were abandoned but regional negotiations continued until 1992, through which regional forest owners´ associations negotiated prices with the mills. Roundwood prices before 1995 were based on the owner´s association prices but currently are set in open markets. Therefore, when prices were set in open markets, these two markets adjust in the long term.
The LOP may also hold (i.e., the markets were partially integrated) for North American markets in the West for the period 2004–2012. Even though long-term relationships were identified in these markets, there were no short-term adjustments to changes in the vector of prices with the exception Douglas-fir sawlog prices of Canada West Coast to Douglas-fir prices of the US Northwest. These results suggest that sawlog prices of the same species (Douglas-fir), produced in the same region (Western North America) shared a long-term trend and adjusted to changes in the short-term. Douglas-fir prices in Canada West Coast share a long-term relationship with Douglas-fir prices in the US Northwest, but the former did not adjust in the short-term to changes in the latter. Hemlock sawlog prices in Canada West Coast also shared a long-term relationship with Douglas-fir prices in Canada West Coast but they did not adjust in the short term to changes in Douglas-fir prices in Canada West Coast.On the other hand, Douglas-fir prices in Canada West Coast shared a long-term relationship with coniferous sawlog prices of Canada West Interior and also adjusted in the short-term to changes in the sawlog prices in Canada West Interior. This result might be explained by the fact that the species analyzed are used to produce final products destined for to different markets. In Coastal British Columbia (Canada West Coast), hemlock is the most important species and lumber is exported to Japan. In Interior British Columbia (Canada West Interior), Douglas-fir the most important species and lumber is exported to the US. Conversely, the prices of North American markets in the East (US South, Canada East) were not cointegrated for the period 2002–2012.
Our results suggested that the SLA had an effect on sawlog price trends in this region for the period 2002–2012. This result in not unexpected since the markets in Western North America are closely connected. This result is possibly relevant to the softwood lumber trade dispute since delivered sawlog prices account for a large share of variable production costs. The relevance of this result for the ongoing trade dispute, however, is open to interpretation. The US side suggests that stumpage prices set by provincial governments in Canada are artificially low, amounting to a subsidy which results in higher lumber exports to the US. This dispute has been often analyzed by researchers (Zhang 2001; Gagné 2003; Kinnucan and Zhang 2004; Stennes and Wilson 2005; Luckert 2007; Baek 2012). While many authors analyzed the conflict in terms of economic welfare implications for both countries (Zhang 2001; Kinnucan and Zhang 2004; Stennes and Wilson 2005), others analyzed it in terms of identifying policy explanations to this trade conflict (Gagné 2003; Luckert 2007). This study focused on delivered (at the mill gate) sawlog prices and while the data indicate that the delivered sawlog prices in the US were higher than in Canada, there are many other factors that need to be examined before any implications of the SLA on these markets can be ascertained (Gagné 2003; Luckert 2007). The impact of the SLA imposition on the excess supply and lumber prices, as developed by Kinnucan and Zhang (2004), may be useful in interpreting this result. Among other impacts outside the dispute itself, some authors noted that the US substituted softwood (coniferous) lumber from Canada with increasing imports from Germany, Sweden and Austria starting in 1995 (Stennes and Wilson 2005). The reason for these shifts has been the increase in US prices due to the import quotas on Canadian lumber.
Sawlog prices in Finland and Germany did not move together between 1995 and 2012. As mentioned before, these two forest sectors have different structures. During 1995–2012, sawlog prices in EUR of Finland and Germany were not cointegrated. This is a similar result for prices in USD. In Finland, wood pulp production is highly concentrated when compared with sawnwood production. However, it should be noted that the pulp mills also own the majority of the sawmills. Sawlog prices were negotiated at a regional level until the mid-1990s. Sawlog purchases are presently conducted directly by the sawmilling industry. In Germany, sawmills are the largest sawlog consumer and the pulp mills are also playing an important role. The ownership of the sawmills is not highly concentrated and sawlog sales are usually conducted through intermediaries or wood dealers. These characteristics suggest different market structures and impacts on pricing mechanisms which might lead to different long-term trends of sawlog prices. It appears that in Finland sawmills might have more market power than in Germany.
On the other hand, while sawlog prices in USD in Norway and Sweden were non-stationary for the period 1995–2012, prices in EUR in these countries for the same period were stationary in levels and therefore cointegration tests could not be performed because these require prices to be non-stationary. This suggests that exchange rate can be identified as a relevant factor that may influence these results.
In 2001–2012, the LOP was close to holding between prices in EUR of Norway and Finland. Russian prices in EUR, however, were cointegrated with Norwegian and Polish prices in EUR in the period 2001–2012. Furthermore, Polish prices in EUR adjusted in the short term to Russian prices in EUR but the LOP did not hold among these two markets’ sawlog prices. In Poland, the state limits annual harvest levels leading to a shortage of roundwood, and especially of sawlogs. Consequently, there is intense competition for sawlogs among private companies and upward pressures on prices. In Russia, despite the fact that the national and local governments have been using auctions to sell roundwood, currently open market mechanisms are still not fully in place.
The results indicated that the existence of the common European market did not lead to a single sawlog market for sawlog prices in EUR during 2001–2012. However, some of those markets are cointegrated meaning that they share a long-term relationship. Therefore, external shocks, which may affect wood supply and prices, would have an impact on prices of other countries in the short-term only. Furthermore, Chilean sawlog prices shared long-term relationships with the Scandinavian countries – Norway, Sweden and Finland – but not with Brazil.
In terms of prices, we identified distortions to the markets, such as price setting mechanisms, export taxes, and market concentration. Most of the analyzed countries have had negotiated prices for part of the period, with the exceptions of Germany, the US, Chile, and Brazil. Furthermore, the forest resources of the countries analyzed are privately owned, with the exception of Russia and Poland, resulting in different market conditions which might affect sawlog prices.
Morales Olmos and Siry (2015) conducted a similar study for coniferous and non-coniferous pulpwood markets and analyzed WRI price data during 1988–2012. The geographical scope was somewhat different as major pulpwood markets not always coincide with coniferous sawlog markets. While several long-term relationships were identified primarily for coniferous pulpwood, the LOP generally did not hold for pulpwood markets. There are several similarities between these two sets of results. For example, a long-term relationship was found for coniferous pulpwood prices in the US South, US Northwest, and Canada West. In this analysis, long-term relationships were also identified between conifer sawlog prices in the US Northwest and Canada West. Further, Morales Olmos and Siry (2015) concluded that the LOP may hold between German and Norwegian conifer pulpwood and in this research, it may hold between Swedish and Norwegian sawlog prices. The similarities, and some differences, between coniferous pulpwood and sawlog markets may invite one to analyze both product markets together, especially where pulpwood and sawlogs are produced jointly and investigate the role of factors driving individual and global markets. Kuuluvainen et al. (2017) attempted to find a single model to analyze Finnish sawlog and pulpwood prices and, while the results did not yield easily to interpretation, pointed out the importance of continued research in this area.
It is also apparent that price series expressed in different currencies have different characteristics. Further research could address this issue by explicitly accounting for exchange rates. In addition, shifts in exchange rates must have some impact on the industry’s profitability, particularly in the short-term. Coniferous lumber trade between the US and Canada during 2002–2015 responded to exchange rate shifts, were Canadian dollar strengthened and eventually reached parity with USD. While several earlier SLA studies included exchange rates, the results have been inconclusive (Baek 2012). The inclusion of more recent data may help to provide a more conclusive answer.
It also is apparent that the conditions that must be met in order for the LOP to hold are rather restrictive, particularly when it comes to short term adjustments. The question is how to relax them in a meaningful way so that the results still help explain and understand market behavior. Further, the analysis could be expanded to account for factors that may better explain the speed and degree of adjustments between individual markets (exchange rates pass through, spatial arbitrage, transportation costs, speed of international trade adjustment, etc.). Additionally, we assume that forest products are homogenous and can be considered commodities. Commodity is a good characterized by a full or partial interchangeability. In other words, it is a good supplied without qualitative differentiation across markets (markets treat it as equivalent no matter who produces it). This assumption may reflect the reality in some cases better than the others. Commoditization of forest products increases with a degree of transformation in manufacturing, with finished products prices more likely to be integrated across markets than intermediate or primary products, which would have implications for how price adjustment mechanisms are structured and channeled (e.g., horizontally across sawlog markets or vertically through finished products markets) and whether they are driven by market-specific (e.g., housing demand in the US) or inter-market (e.g., competitive cost advantage) factors or both. Therefore, further research should consider finished products prices in different regions and reflect the characteristics of the industry, including the presence of vertically integrated companies.
Acknowledgements
The research presented in this manuscript was supported by the University of Georgia’s Harley Langdale, Jr. Center for Forest Business, TimberMart-South headquartered at the Daniel B. Warnell School of Forestry and Natural Resources at the University of Georgia, and the Wood Resources International (WRI) LLC. The authors would like to thank the reviewers for their valuable comments.
References
Baek J. (2012). The long-run determinants of U.S. lumber imported from Canada revisited. Forest Policy and Economics 14(1): 69–73. https://doi.org/10.1016/j.forpol.2011.07.007.
European Union (2014). The euro. http://europa.eu/about-eu/basic-information/money/euro/index_en.htm. [15 March 2014].
FAO (2013a). FAOSTAT. Forestry definitions. http://www.fao.org/forestry/statistics/80572/en/. [Cited 11 Nov 2013].
FAO (2013b). FAOSTAT. http://faostat.fao.org/site/626/default.aspx#ancor. [Cited 7 Sep 2013].
FAO (2014). FAOSTAT. Forestry trade flows. http://faostat.fao.org/site/628/default.aspx. [Cited 27 March 2014].
Gagné G. (2003). The Canada-US softwood lumber dispute: a test case for the development of international trade rules. International Journal 58(3) 335–368. https://doi.org/10.1177/002070200305800306.
Governments of Canada and the United States of America (2006). Softwood lumber agreement betweeen the Government of Canada and the Government of the United States of America. https://www.state.gov/documents/organization/107266.pdf.
Hamilton J.D. (1994). Time series analysis. Princeton University Press, Princeton, New Jersey.
Hänninen R.,Toppinen A., Ruuska P. (1997). Testing arbitrage in newsprint imports to United Kingdom and Germany. Canadian Journal of Forest Research 27(12):1946–1952. https://doi.org/10.1139/x97-164.
Hänninen R. (1998). The law of one price in United Kingdom soft sawnwood imports: a cointegration approach. Forest Science 44(1):17–23.
Johansen S. (1988). Statistical analysis of cointegration vectors. Journal of Economic Dynamics and Control 12(2–3): 231–254. https://doi.org/10.1016/0165-1889(88)90041-3.
Johansen S., Juselius K. (1990). Maximum likelihood estimation and inference on cointegration with applications to the demand for money. Oxford Bulletin of Economics & Statistics 52(2): 169–210. https://doi.org/10.1111/j.1468-0084.1990.mp52002003.x.
Juselius K. (2006). The cointegrated VAR model: methodology and applications. Oxford University Press Inc., New York.
Kinnucan H.W., Zhang D. (2004). Incidence of the 1996 Canada–U.S. Softwood. Lumber agreement and the optimal export tax. Canadian Journal of Agricultural Economics 52: 73–88. https://doi.org/10.1111/j.1744-7976.2004.tb00095.x.
Kuuluvainen J., Korhonen J., Xu D., Toppinen A. (2017). Price integration for domestic and imported sawlogs and pulpwood in Finland: an update. Journal of Forest Research 33(1): 71–80. https://doi.org/10.1080/02827581.2017.1327614.
Luckert M.K. (Marty) (2007). Property rights, forest rents, and trade: the case of US countervailing duties on Canadian softwood lumber. Forest Policy and Economics 9(6): 581–590. https://doi.org/10.1016/j.forpol.2006.05.007.
Morales Olmos V., Siry J. (2015). Global pulpwood markets and the Law of One Price. Mathematical and Computational Forestry and Natural Resources Sciences 7(1): 15–31.
Nagubadi V., Munn I.A., Tahai A. (2001) Integration of hardwood stumpage markets in the Southcentral United States. Journal of Forest Economics 7(1): 61–98.
OECD (2013). Monthly monetary and financial statistics (MEI) metadata: exchange rates (USD monthly averages). http://stats.oecd.org/Index.aspx?DataSetCode=MEI_FIN. [3 July 2013].
Perron P. (1991). Test consistency with varying sampling frequency. Econometric Theory 7(3): 341–368. https://doi.org/10.1017/S0266466600004503.
Perron P., Qu Z. (2007). A simple modification to improve the finite sample properties of Ng and Perron’s unit root tests. Economics Letters 94(1): 12–19. https://doi.org/10.1016/j.econlet.2006.06.009.
Shiller R.J., Perron P. (1985). Testing the random walk hypothesis: power versus frequency of observation. Economics Letters 18(4): 381–386. https://doi.org/10.1016/0165-1765(85)90058-8.
Stennes B., Wilson B. (2005). An analysis of lumber trade restrictions in North America: application of a spatial equilibrium model. Forest Policy and Economics 7: 297–308. https://doi.org/10.1016/S1389-9341(03)00067-4.
Toivonen R., Toppinen A., Tilli T. (2002). Integration of roundwood markets in Austria, Finland and Sweden. Forest Policy and Economics 4(1): 33–42. https://doi.org/10.1016/S1389-9341(01)00071-5.
Toppinen A. (1998). Incorporating cointegration relations in a short-run model of the Finnish sawlog market. Canadian Journal of Forest Research 28(2): 291–298. https://doi.org/10.1139/x98-010.
Toppinen A., Viitanen J., Leskinen P., Toivonen R. (2005). Dynamics of roundwood prices in Estonia, Finland and Lithuania. Baltic Forestry 11(1): 88–96.
Wood Resources International (2004). Wood Resource Quarterly, 2004 Q4. Wood Resources International, Seattle, USA.
Wood Resources International (2006). Wood Resource Quarterly, 2006 Q2. Wood Resources International, Seattle, USA.
Wood Resources International (2007). Wood Resource Quarterly, 2007 Q3. Wood Resources International, Seattle, USA.
Wood Resources International (2008). Wood Resource Quarterly, 2008 Q1. Wood Resources International, Seattle, USA.
Wood Resources International (2010). Wood Resource Quarterly, 2010 Q1. Wood Resources International, Seattle, USA.
Yang J., Bessler D.A., Leatham D.J. (2000). The Law of One Price: developed and developing country market integration. Journal of Agricultural and Applied Economics 32(3): 429–440. https://doi.org/10.1017/S107407080002054X.
Yin R., Newman D.H., Siry J. (2002). Testing for market integration among southern pine regions. Journal of Forest Economics 8(2): 151–166. https://doi.org/10.1078/1104-6899-00009.
Zhang D. (2001). Welfare impacts of the 1996 United States – Canada softwood lumber (trade) agreement. Canadian Journal of Forest Research 31(11): 1958–1967. https://doi.org/10.1139/x01-130.
Total of 34 references.
