Mulualem Tigabu  ,
Annika M. Felton
,
Annika M. Felton
Multivariate calibration of near infrared spectra for predicting nutrient concentrations of solid moose rumen contents
Tigabu M., Felton A. M. (2018). Multivariate calibration of near infrared spectra for predicting nutrient concentrations of solid moose rumen contents. Silva Fennica vol. 52 no. 1 article id 7822. https://doi.org/10.14214/sf.7822
Highlights
- Multivariate calibrations were established for predicting nutrient concentrations of solid moose rumen contents by near infrared spectroscopy (NIRS)
- Crude protein, available protein and ash contents were accurately predicted
- Prediction of microbial nitrogen, ash, acid-detergent fiber, neutral detergent fiber and lignin were satisfactory
- The results demonstrate that NIRS offers quick and inexpensive procedure to quantify nutrient concentrations of solid rumen contents.
Abstract
This study aimed at establishing calibrations to predict nutrient concentrations of solid moose (Alces alces L.) rumen content using near infrared spectroscopy (NIRS), as an alternative to expensive chemical analyses. NIR reflectance spectra of 148 dry pulverized samples were recorded. The scanned samples were then analyzed for crude protein, available protein, microbial nitrogen (N), ash, acid-detergent fiber (ADF), neutral detergent fiber (NDF) and lignin contents following standard chemical analysis procedures. The calibration models were derived by Orthogonal Projection to Latent Structure (OPLS) and validated using external prediction sets. The calibration models accurately predicted crude protein, available protein and ash contents (R2 = 0.99, 0.96, and 0.92, prediction error = 0.39, 0.72 and 0.53% dry matter, respectively) while NDF (R2 = 0.92; prediction error = 2.23% dry matter) and ADF (R2 = 0.89; prediction error = 1.94% dry matter) were predicted with sufficient accuracy and that of microbial-N (R2 = 0.81; prediction error = 1.25 mg yeast-RNA g–1 dry matter) and lignin (R2 = 0.84; prediction error = 1.05% dry matter) were acceptable. The ratio of performance to deviation values were > 3.0 for crude protein and available protein, between 3.0 and 2.5 for ADF, NDF and lignin, and 2.32 for microbial-N; attesting the robustness of the calibration models. It can be concluded that NIR spectroscopy offers a quick and inexpensive procedure for prediction of nutrient concentrations of solid rumen contents in wild herbivores.
Keywords
Alces alces;
lignin;
NIRS;
acid-detergent fiber;
crude protein;
microbial-N;
neutral detergent fiber
-
Tigabu,
Southern Swedish Forest Research Centre, Swedish University of Agricultural Sciences, Box 49, SE-230 53 Alnarp, Sweden
 http://orcid.org/0000-0003-2471-1168
E-mail
mulualem.tigabu@slu.se
http://orcid.org/0000-0003-2471-1168
E-mail
mulualem.tigabu@slu.se
- Felton, Southern Swedish Forest Research Centre, Swedish University of Agricultural Sciences, Box 49, SE-230 53 Alnarp, Sweden E-mail annika.felton@slu.se
Received 17 October 2017 Accepted 16 January 2018 Published 18 January 2018
Views 71131
Available at https://doi.org/10.14214/sf.7822 | Download PDF

1 Introduction
The functional traits of animals interact in complex ways with their food, and the ecological outcomes of these interactions are to a large degree mediated by nutrition (Raubenheimer et al. 2009). While nutrients and energy are crucial for fitness, and life itself, their relative concentrations in food items also mediate animals’ smaller scale foraging decisions (Felton et al. 2009) and movements in the landscape (Simpson et al. 2006). Knowledge about wild animals’ nutrient intake is therefore of value for management. This is evident with regards to large free-ranging herbivores, such as browsing ungulates. These large herbivores have a pronounced effect on the landscape, through their foraging, movements and interactions with humans and other animals in their habitat (Gill and Beardall 2001; Danell et al. 2006). An understanding of the diet composition of browsing ungulates, thus, provides a critical link between habitat quality, management, and animal well-being.
One way of studying the diet and nutrition of large free-ranging herbivores is to sample gut contents of individuals that are shot as part of the annual hunting effort. Using this approach, researchers may obtain hundreds of samples or more, in regional-scale studies necessary to answer questions relevant for game management. In the case of ruminants, a portion of the rumen content can provide information about the plant species they have consumed shortly before death and the nutritional composition of this combination of plants prior to complete digestion. Furthermore, nutritional analyses of rumen content can also provide information about microbial synthesis and how this may be affected by different diets and human interventions. However, conducting chemical analyses in the laboratory is costly and may prohibit large sample sizes. Development of alternative methods of analysis is therefore necessary if rumen sampling is to be used as an efficient research and monitoring tool.
Near infrared spectroscopy (NIRS) is a well-established analytical technique to determine the chemical and physico-chemical properties of a wide range of biomaterials. The NIR region covers the wavelength range 780–2500 nm, and absorption bands occur as a result of molecular bond vibrations, such as C–H, O–H, C–O and N–H. The molecular vibrations, in turn, give rise to overtones and combinations of the fundamental vibrations active in the mid-infrared region (Workman and Weyer 2012). A recent review has summarized a wide range of application of NIR spectroscopy in wildlife and biodiversity research to address several questions related to taxonomy, physiology, habitat evaluation and population monitoring (Vance et al. 2016). Previous studies have demonstrated the usefulness of fecal NIRS profiling to determine the nutritional status of free ranging ruminants (Landau et al. 2006; Showers et al. 2006; Galvez-Ceron et al 2013; Gil-Jemenez et al 2015; Jean et al 2015; Villamuelas et al 2017). NIRS has also proven its utility for nutritive evaluation of forage and diets in a wide range of applications (Andrés et al. 2005; Belanche et al. 2014; Foskolos et al. 2015). However, direct analyses of rumen contents by NIRS are largely missing (Redjadj et al. 2014; Jean et al. 2016).
Here, we demonstrate the use of modern NIRS as cost-effective analytical tool for large-scale wildlife research using moose (Alces alces L.) as a model species. Moose is a large browsing ungulate, and its population is naturally distributed throughout temperate and boreal forest lands of the northern hemisphere. It is an economically important species in game hunting in Scandinavia and elsewhere. The specific objective of this study was to evaluate the accuracy and efficacy of using NIRS to determine nutrient concentrations of solid moose rumen contents with regards to a range of different nutritional parameters: crude protein, available protein, neutral detergent fiber (NDF), acid detergent fiber (ADF), lignin and ash. In addition, we test a measure of microbial nitrogen (microbial-N, the fraction of total nitrogen in rumen content that originated from microbes) as an index of microbe synthesis.
2 Materials and methods
2.1 Sample collection and preparation
With voluntary assistance of local hunters, rumen samples were collected in seven moose management areas in southern Sweden. Each moose management area is divided into multiple moose management units (mean 16 000 ha); within which hunting teams carry out the yearly moose hunt. Rumen samples for this study were obtained from 55 such units, and more than 1 M ha are included in the study. The moose individuals they sampled were culled as part of the yearly hunt and as such our data collection was not biased towards sick individuals (Ericsson et al. 2013). Opportunistically, we also obtained samples from traffic injured moose within the study areas (7 individuals in total). We obtained rumen samples from 494 moose individuals shot between October 12, 2014 and February 22, 2015.
The collection of rumen samples was part of a large study of moose food and health, in which multiple organs and other samples were collected from the same individuals. Hunters were instructed how to collect the samples in the field through oral presentations, written material and an instruction video (available online) from researchers. Fresh rumen samples were collected immediately after harvest. After removing the entire intestine from the animal, the hunter opened the rumen, mixed the contents in order to decrease effects of a structured plant representation, and filled a 1 liter plastic container with rumen content. Excess rumen liquid was removed by first squeezing each fist full. The container was sealed with an air tight lid. Rumen samples were frozen shortly after sampling and stored at –20 °C. Thawed rumen samples were thoroughly mixed, and a fraction of approximately 200 g was dried at 60 °C for 48 h. The dried material was ground using a hammer mill (KAMAS Slagy 200B; 1 mm sieve).
2.2 Acquisition of NIR spectra
Each pulverized rumen sample was thoroughly mixed before drawing ca. 40 g sample for scanning. The sample was filled into standard sample cup (diameter = 3.8 cm and depth = 0.9 cm) and covered with a piece of hard paper. NIR reflectance spectra, expressed in the form of log
(1/Reflectance), were acquired with XDS Rapid Content Analyzer (FOSS NIRSystems, Inc.) from 780 to 2498 nm at an interval of 0.5 nm. Prior to acquiring the NIR spectrum of each sample, reference measurement was taken on the standard built-in reference of the instrument. For every sample, 32 monochromatic scans were made and the average value recorded. Out of 494 scanned samples, representative samples were selected for chemical analyses based on scores of Principal Component Analysis (PCA), which is suggested to be an easy and very useful approach for sample selection (Næs et al. 2002). The PCA had three significant components that explained 96% of the spectral variation. After inspecting the PCA score plot, we first selected samples that were farthest away from the center of the data in all principal components, and then samples within the larger cluster of scores were selected with an interval of ca. 6 points from the highest to the lowest scores. Accordingly 148 samples were selected for chemical analysis for all nutrients, except microbial-N for which 111 samples were possible to select.
2.3 Chemical analysis of samples
Selected samples were analyzed for the concentrations of ash, crude protein (total nitrogen), acid-detergent fiber (ADF), neutral detergent fiber (NDF) and lignin using conventional laboratory techniques. Residual moisture in all ground material was determined by oven drying at 103 °C for 16 h. Ash (total minerals) was determined by ignition at 550 °C for 3 h. Nitrogen concentration was determined by the Kjeldahl method using a 2020 Digestor and a 2400 Kjeltec Analyser Unit (FOSS Analytical A/S, Hillerød, Denmark). ADF and lignin were determined by using the detergent system of van Soest for fibre analysis (Van Soest et al. 1991). Samples were analyzed for ash-free NDF using heat stable α-amylase and sodium sulphite, and crucibles instead of filter bags (Chai and Uden 1998). To estimate the portion of non-digestible protein, we measured insoluble nitrogen remaining in the acid-detergent fiber fraction using the Kjeldahl method. Available protein (AP) was then calculated as total protein (total nitrogen multiplied by 6.25) minus non-digestible protein present in acid-detergent fiber (Licitra et al. 1996). To estimate microbial N, we determined total purine content as per Zinn and Owens (1986), with modifications according to Aharoni and Tagari (1991), with yeast-RNA (Roche 10109223001) as a standard.
2.4 Multivariate calibration
Preliminary calibration was performed on all samples and the residuals were examined to detect unusual observations. Consequently, outlying spectra were removed from the model based on high Hotelling’s T2 (a statistic used in multivariate quality control charts), residuals that were more than twice the pooled standard residuals (a statistic used to determine lack of fit of the model), or when observed values differed by more than 3 standard deviations from the predicted values. The number of outliers removed was 1%, 2%, 3% and 7% of the samples for microbial-N, ash, NDF and ADF, respectively. As the difference in lignin content of some samples was very small (< 0.5 g kg–1 dry matter), we selected 95 samples that differed in lignin content by ≥ 1 g kg–1 dry matter for fitting the calibration model. Furthermore, the lignin content was log-transformed for linearization purpose. Finally, the data sets were divided into calibration sets for training the models and prediction sets for model validation (Table 1). The prediction set were selected from the lowest to the highest values at an interval of five samples so that it represented the whole range of the data sets.
| Table 1. Descriptive statistics of nutrient concentrations of solid moose rumen content samples (% DM (dry matter), unless specified) in calibration and prediction sets. | ||||||
| Nutrient | Data set | n | Descriptive statistics | |||
| Minimum | Maximum | Mean | SD | |||
| Crude protein | Calibration | 118 | 8.29 | 25.66 | 13.46 | 3.41 |
| Prediction | 30 | 8.32 | 23.27 | 13.35 | 3.35 | |
| Available protein | Calibration | 118 | 6.17 | 24.19 | 11.49 | 3.41 |
| Prediction | 30 | 6.46 | 22.73 | 11.55 | 3.56 | |
| Microbial-N* | Calibration | 81 | 3.49 | 20.69 | 8.38 | 2.97 |
| Prediction | 21 | 3.87 | 15.97 | 7.93 | 2.71 | |
| Ash | Calibration | 117 | 4.60 | 14.00 | 7.69 | 1.69 |
| Prediction | 30 | 4.65 | 12.36 | 7.73 | 1.76 | |
| NDF** | Calibration | 113 | 35.34 | 69.74 | 56.32 | 6.91 |
| Prediction | 30 | 37.27 | 68.21 | 55.96 | 7.19 | |
| ADF** | Calibration | 111 | 14.10 | 48.14 | 34.54 | 7.30 |
| Prediction | 30 | 15.36 | 47.39 | 34.52 | 7.66 | |
| Lignin | Calibration | 74 | 97.90 | 227.90 | 179.26 | 26.69 |
| Prediction | 21 | 144.50 | 220.10 | 174.59 | 21.82 | |
| n = number of samples. SD = standard deviation. * microbial-N is expressed as mg yeast-RNA g–1 DM. ** NDF and ADF stand for neutral detergent fiber and acid-detergent fiber, respectively. | ||||||
A calibration model for each nutrient fraction was developed separately by Orthogonal Projection to Latent Structures (OPLS). The OPLS modelling approach had an integrated Orthogonal Signal Correction (OSC)-filter where it first removed spectral variations that had no correlation with the nutrient content analyzed and then fitted the calibration model based on predictive spectral variation (Trygg and Wold 2002). All calibrations were developed on mean-centered data sets and the number of significant model components were determined by a seven-segment cross validation. A component was considered significant if the ratio of the prediction error sum of squares to the residual sum of squares of the previous dimension was statistically smaller than 1.0 (Eriksson et al. 2006).
The computed models were validated using external prediction sets, which were excluded during calibration. The model performance was evaluated using ratio of performance to deviation (RPD), root mean square error (RMSE) of estimation and prediction and the coefficient of determination or the square correlation coefficient (R2) of reference analyses versus NIR values in the prediction set. RPD values were calculated by dividing standard deviation of the population by the standard error of prediction for cross-validation. The performance of the calibration models was assessed by RPD following the guideline suggested by Williams and Sobering (1996) for feed evaluation with slight modification as follows: a model with RPD value between 2 and 2.5 was considered as acceptable; values between 2.5 and 3 were considered sufficiently accurate; and values > 3 were considered highly accurate.
The RMSE was computed as measure of model robustness while the coefficient of determination (R2) was used to describe the relationship between values predicted by the models and values obtained through the use of the reference method.
To analyze absorption bands that influenced the calibration models, a parameter called Variable Influence on Projection (VIP) was computed. The VIP score for the predictive component (PRED_VIPOPLS) was computed following Galindo-Prieto et al. (2015). As the sum of squares of all VIP scores is equal to the number of spectral X variables contributed in each calibration model, the average VIP score would be 1.0. Thus, we considered predictors with VIP scores greater than 1.0 as highly relevant for quantitative calibration of nutrient contents, although a cut-off around 0.7–0.8 has been suggested to discriminate between relevant and irrelevant predictors (Eriksson et al. 2006). All calculations were performed using Simca-P+ software (Version 14.0.0.1359, Umetrics AB, Sweden).
3 Results
3.1 Spectral profile of solid rumen contents
The raw NIR reflectance spectra (expressed in the form of log 1/Reflectance) of nutrient concentration of solid rumen samples showed similar spectral profile along the whole NIR region with absorption peaks at 1190 nm, 1448 nm, 1730 nm, 1936 nm, 2150 nm, 2312 nm and 2354 nm (Fig. 1). Although no unique absorption peaks were discerned, the shorter NIR region (780–1100 nm) also contained sufficient information. The differences in absorbance values between spectra of minimum and maximum values of different nutrient fractions of solid rumen contents were clearly visible. For some of the nutrient fractions the subtle difference in absorbance values between spectra of mean and minimum values would be difficult to see on the plot at this scale of attenuation. It is worth noting that the absorbance values were higher for the spectra of mean and minimum values than the spectrum of maximum value for ADF and NDF, respectively. As a whole, it appeared that the NIR spectra contained sufficient information to develop calibration models for quantitative prediction of nutrient concentrations of solid rumen content samples.
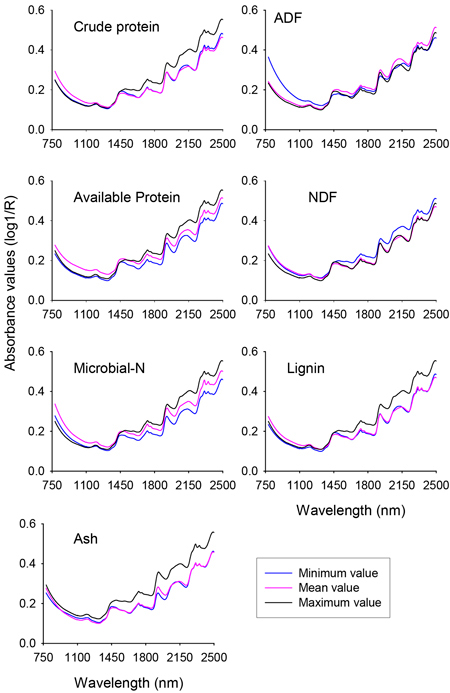
Fig. 1. Profile of NIR spectra for minimum, mean and maximum values of different nutrient concentrations of solid moose rumen contents. ADF and NDF stand for acid-detergent fiber and neutral detergent fiber, respectively.
3.2 Calibration and validation of prediction models
The range, mean and standard deviation (SD) of nutrient concentrations of solid rumen contents included in the calibration and validation sets are summarized in Table 1. The differences observed between the two sets in the mean and SD of each nutrient concentration were very small, thus it could be considered that samples used to develop the calibration models were similar to those included in the validation set. The OPLS model fitted to determine the nutrient concentrations of solid moose rumen samples decomposed the spectral data matrix into predictive (R2XP) and y-orthogonal spectral matrix (R2Xo), which accounted 13–29% and 71–87% of the total spectral variation, respectively (Table 2). This small proportion of predictive spectra described 98% of crude protein, 97% of available protein, 94% of ash, 90% of NDF, 90% of ADF, 87% of microbial-N and 86% of lignin concentrations with one significant component (A). The prediction accuracy (Q2) according to cross-validation was 96% for crude protein, 95% for available protein, 89% for ash, 88% for NDF and ADF, 80% for microbial-N and 81% for lignin concentration. The calibration error (RMSEE) was generally low, particularly for crude protein, available protein and ash contents (Table 2).
| Table 2. Statistical summary of models developed to predict nutrient concentrations (% DM (dry matter) unless specified) of solid moose rumen content samples by NIR spectroscopy. | |||||||
| Nutrient | A | R2Xp | R2Xo | R2y | Q2 | RMSEE | RPD |
| Crude protein | 1 + 8 | 0.127 | 0.872 | 0.977 | 0.964 | 0.538 | 5.22 |
| Available protein | 1 + 7 | 0.141 | 0.856 | 0.973 | 0.953 | 0.584 | 4.66 |
| Microbial-N* | 1 + 8 | 0.167 | 0.832 | 0.869 | 0.802 | 1.15 | 2.32 |
| Ash | 1 + 9 | 0.163 | 0.836 | 0.936 | 0.889 | 0.452 | 3.21 |
| NDF** | 1 + 6 | 0.179 | 0.818 | 0.904 | 0.882 | 2.23 | 2.52 |
| ADF** | 1 + 4 | 0.168 | 0.822 | 0.896 | 0.882 | 1.93 | 2.93 |
| Lignin | 1 + 7 | 0.289 | 0.710 | 0.859 | 0.813 | 1.07 | 2.57 |
| A = number of significant components to build the model (the first and second values represent the number of components for predictive and orthogonal variations, respectively). R2Xp = the predictive spectral variation. R2Xo = Y-orthogonal variation (spectral variation uncorrelated to the response). R2y = the modelled variation of nutrient content (the same as the coefficient of determination for cross-validation). Q2 = the predictive power of a model according to cross validation. RMSEE = root mean square error of estimation. RPD = ratio of performance to deviation. * Unit for microbial-N is mg yeast-RNA g–1 DM. ** NDF and ADF stand for neutral detergent fiber and acid-detergent fiber, respectively. | |||||||
For external validation sets, the calibration model predicted crude protein (R2 = 0.99, RMSEP = 0.39% DM), available protein (R2 = 0.96, RMSEP = 0.73% DM) and ash (R2 = 0.92, RMSEP = 0.53% DM) concentrations with high prediction accuracy (Fig. 2). The predictions of NDF (R2 = 0.92) and ADF (R2 = 0.89) concentrations were sufficiently accurate, despite slightly higher prediction errors (RMSEP = 2.23% DM and 1.94% DM, for NDF and ADF, respectively) than protein and ash contents. The prediction performances of the calibration models for lignin (R2 = 0.84; RMSEP = 1.05% DM) and microbial-N (R2 = 0.81; RMSEP = 1.25 mg yeast-RNA g–1 DM) concentrations were acceptable. The ratio of performance to deviation (RPD) value was > 3.0 for crude protein and available protein, ≥ 2.5 for ADF, NDF and lignin and 2.32 for microbial-N.
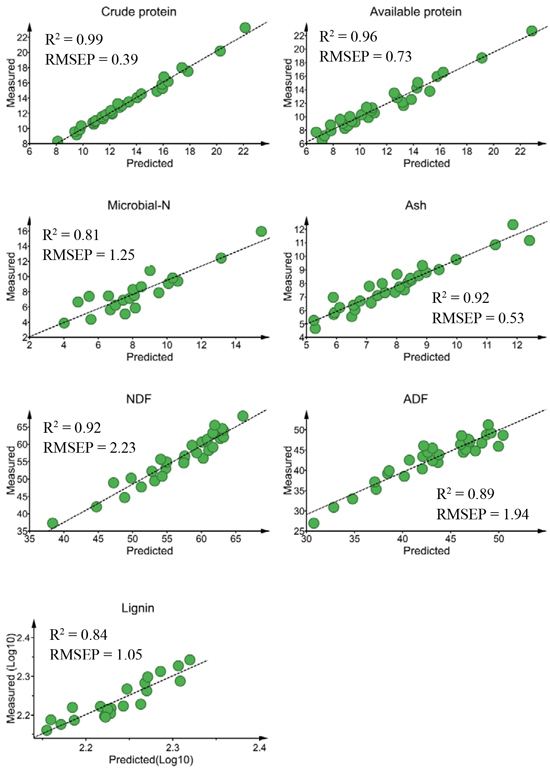
Fig. 2. Relationship between NIR predicted and measured nutrient concentrations of solid moose rumen contents for validation sets. Nutrient concentrations are expressed as % dry matter (DM)for all constituents except microbial-N (mg yeast-RNA g–1 DM). ADF, NDF RMSEP stand for acid-detergent fiber, neutral detergent fiber and root mean square error of prediction, respectively.
3.3 Absorption bands accounted for prediction of nutrient concentrations
The VIP scores depicting absorption bands that accounted for prediction of nutrient concentrations of solid moose rumen contents are shown in Fig. 3. In the shorter NIR region (780–1100 nm), absorption bands highly relevant (VIP > 1.0) for prediction of all nutrient concentrations except lignin appeared in 780–880 nm, albeit no distinct absorption maxima. In the longer NIR region (1100–2500 nm), absorption bands highly relevant for prediction of nutrient concentrations of solid rumen content were 1908–2069 nm and 2120–2464 nm, with major absorption maxima at 1990 nm, 2191 nm, 2311 nm and 2464 nm and minor peaks at 2050 nm, 2311nm, 2354 nm and 2413 nm. In addition, the absorption band in the 1720–1891 nm wavelength region with peaks at 1738 nm, 1877 nm and 1888 nm highly contributed to the predictions of microbial-N and NDF concentrations.
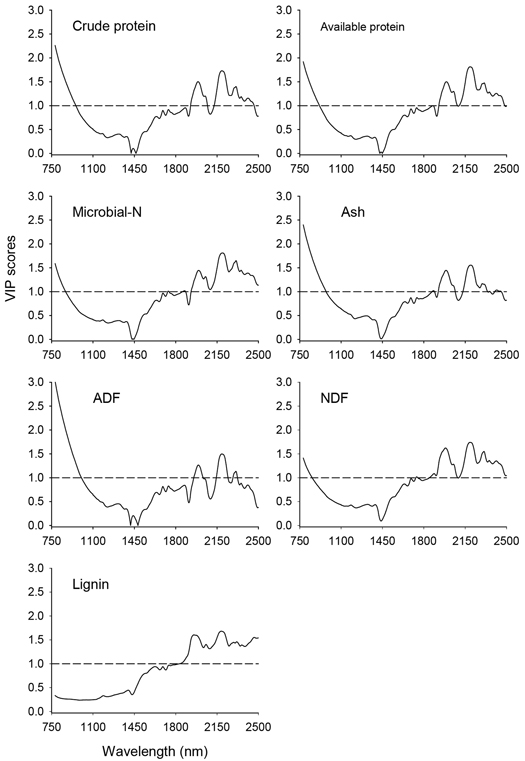
Fig. 3. Variable Influence on Projection (VIP) values depicting absorption bands that were accounted for prediction of nutrient concentrations of solid moose rumen contents. The horizontal dotted line is the cut-off limit for discriminating relevant (VIP > 1.0) and irrelevant predictors. ADF and NDF stand for acid-detergent fiber and neutral detergent fiber, respectively.
4 Discussion
The results demonstrated that nutrient concentrations of solid moose rumen contents can be successfully predicted by multivariate calibration of NIR spectra (Table 2; Fig. 2). Particularly, both calibration and prediction errors were small and close to each other and the prediction accuracy was more than 90% for crude protein, available protein and ash content of rumen samples. A model with prediction accuracy > 90% is considered excellent. Furthermore, the ratio of performance to deviation value for these nutrient fractions was more than 3, which attests the robustness of our calibration models. Unlike previous studies, which applied NIRS for determining the chemical composition of feed residues after in situ ruminal incubation (Berzaghi et al. 1997), predicting diet quality using fecal samples from white-tailed deer (Showers et al. 2006), and sheep (Li et al. 2007), and prediction of chemical composition of South African Medicago sativa L. hay (Scholtz et al. 2009), our results provide evidence for direct analyses of solid rumen contents by NIRS. This, in turn, provides a critical link between habitat quality, management, and animal well-being. Our results are comparable with the only available study on application of NIRS for determining the chemical composition of solid rumen contents by Redjadj et al. (2014).
The predictions of NDF and ADF concentrations were sufficiently accurate, as evidenced from large coefficient of determination for the relationship between NIR predicted and measured values as well as the ratio of performance to deviation, which is considered as acceptable for quantitative determination of nutrient contents (Williams and Sobering 1996). The performance of our prediction models of NDF and ADF are comparable to previous studies on solid rumen content samples (Redjadj et al. 2014), liquid rumen samples (Jean et al. 2016) of herbivores, a wide range of feeds for ruminants (Belanche et al. 2014) and meadow herbage (Andrés et al. 2005). For the prediction of microbial-N (R2 = 0.81; RMSEP = 1.25; RPD = 2.32) and lignin (R2 = 0.84; RMSEP = 1.05; RPD = 2.57), the model performance was comparably lower than that of protein and NDF. This might be related to the low levels and narrow ranges of microbial-N and lignin data sets, respectively, which is suggested to hampering its estimation by NIRS (Roberts et al. 2004). In addition, lignin is composed of a large group of aromatic compounds with marked variation in chemical fractions among samples depending on the type of plant species the animal consumed and the stage of maturity of the plant species (Van Soest 1994). Andrés et al. (2005) also suggested that the relatively low prediction accuracy of lignin in meadow herbage by NIRS could be partly attributed to heterogeneity of chemical fractions of lignin in the herbage. For free-browsing ungulates, like moose, it is legitimate to expect heterogeneity in chemical fractions of lignin in the diet due to spatio-temporal variation in the type, availability and maturity of the feed. Anyway, the model parameters for the prediction of microbial-N and lignin concentrations in our study are comparable or even better than those observed for duodenal digesta (microbial-N: R2 = 0.88, SEcv = 3.80; Atanassova et al. 1998) and other herbage (Lignin: R2adj = 0.66, SEP = 7.18 g kg−1 DM; Andrés et al. 2005).
The absorption bands that accounted for prediction of the different nutrient concentrations of solid moose rumen contents showed similar spectral profiles (Fig. 3). This is, indeed, expected as several compounds have overlapping absorption bands in the NIR region (Workman and Weyer 2012). Furthermore, the correlations between nutrient concentrations contribute to the observed overlap in absorption bands. For instance, we found negative correlation between crude protein and NDF (r = –0.90) and between crude protein and ADF (r = –0.90), which could explain the inverse spectral profiles of crude protein, NDF and ADF (Fig. 1). The absorption band in 780–1100 nm, albeit no unique absorption peaks, was relevant for prediction of all nutrient fractions except lignin. The absorption band is characteristic of the third overtone of C–H stretching vibration and second overtone N–H and C–H stretching vibrations due to absorption by CH3, CH2, ArNH2 (aromatic amino acids) and NH2 (Workman and Weyer 2012), but signals from third overtones are weak due to energy dissipation, and sensitivity of the silicon-detector; hence it is not always likely to see strong peak in this region. In fact, excluding this region during calibration resulted in poor performance of the fitted model (data not shown).
For prediction of protein contents and microbial-N, the observed absorption bands correspond to N–H combination bands (1990 nm) and various N–H stretching, bending and combinations in 2000–2463 nm region (Workman and Weyer 2012). Particularly, the 2148–2200 nm band has been demonstrated as useful to predict protein in forage (Andrés et al. 2005) and agricultural products (Shenk et al. 2001). Similar to our results, Atanassova et al. (1998) found absorption bands in 1720–1891 nm, 1930–2090 nm and 2090–2500 nm wavelength regions useful to predict microbial-N content of in sacco feed residues and duodenal digesta of sheep.
The absorption bands which explained most of the variation in NDF and ADF are related to cell wall materials (e.g. cellulose). The broad absorption band in 1700–2092 nm (with major absorption maxima at 1984 nm and minor peak at 1739 nm, 1887 nm, 2050 nm) corresponds to CH2 stretching, combination of O–H and C–O stretching while the band in 2100–2500 nm (with absorption maxima at 2190 nm and 2310 nm, and minor peak at 2354 nm) corresponds to combination of C–H stretching and CH2 deformation, C–H stretching and C–C stretching,
O–H/C–H cellulose and various combinations (Workman and Weyer 2012). For lignin, the observed absorption bands are associated with C–H stretching and C═O combination, aromatic ring bands (Workman and Weyer 2012). Most of the absorption bands for the prediction of NDF and ADF concentrations were similar to those described previously by other authors (Andrés et al. 2005; Belanche et al. 2014).
Interestingly, our calibration models derived by OPLS summarized the large spectral data set using one significant component by removing 71–87% of the total spectral variation that had no correlation with the nutrients analyzed. This large proportion of uncorrelated spectral variation could be attributed to spectral redundancy, light scattering and path length difference. As our NIR instrument measures the absorbance values at 0.5 nm wavelength window, it is reasonable to expect redundancy in absorbance values at this scale of resolution. Similar results have been reported in other studies (Daneshvar et al. 2015). Light scattering and path length differences might arise from inconsistent packing of the dry pulverized samples for scanning, which in turn, creates spectral noise. As a whole, the calibration models are parsimonious and provide additional information relevant for interpretation of multivariate calibration results. In conclusion, our results demonstrate that NIR spectroscopy offers a quick and inexpensive procedure for sufficiently accurate prediction of nutrient concentrations of solid rumen contents of wild herbivores. This, in turn, will allow rapid analysis of large number of samples to answer questions related to wildlife ecology and management.
Acknowledgement
This project was funded by the Swedish Environmental Protection Agency (13/274) and the Södra Research Fund. We thank staff and students who helped with analyses in the laboratory at the Dept. of Animal Nutrition and Management, Swedish University of Agricultural Sciences. We also thank all the hunters who collected samples.
References
Aharoni Y., Tagari H. (1991). Use of nitrogen-15 determinations of purine nitrogen fraction of digesta to define nitrogen metabolism traits in the rumen. Journal of Dairy Science 74(8): 2540–2547. https://doi.org/10.3168/jds.S0022-0302(91)78431-2.
Andrés S., Giráldez F.K. López S., Mantecón A.R, Calleja A. (2005). Nutritive evaluation of herbage from permanent meadows by near-infrared reflectance spectroscopy: 1. Prediction of chemical composition and in vitro digestibility. Journal of the Science of Food and Agriculture 85(9): 1564–1571. https://doi.org/10.1002/jsfa.2138.
Atanassova S., Todorov N., Djouvinov D. (1998). The possibility of near infrared spectroscopy for evaluation of microbial nitrogen content of in sacco feed residues and duodenal digesta of sheep. Journal of Near Infrared Spectroscopy 6(1): 167–174. https://doi.org/10.1255/jnirs.133-.
Belanche A., Weisbjerg M.R., Allison G.G., Newbold C.J., Moorby J.M. (2014). Measurement of rumen dry matter and neutral detergent fiber degradability of feeds by Fourier-transform infrared spectroscopy. Journal of Dairy Science 97(4): 2361–2375. https://doi.org/10.3168/jds.2013-7491.
Berzaghi P., Cozzi G., Andrighetto I. (1997). The use of near infrared analysis for in situ studies. Journal of Dairy Science 80(12): 3263–3270. https://doi.org/10.3168/jds.S0022-0302(97)76301-X.
Cederlund G., Ljungqvist H., Markgren G., Stålfelt G. (1980). Foods of moose and roe-deer at Grimsö in central Sweden: results of rumen content analyses. Swedish Wildlife Research 11: 171–247.
Chai W.H., Uden P. (1998). An alternative oven method combined with different detergent strengths in the analysis of neutral detergent fibre. Animal Feed Science and Technology 74(4): 281–288. https://doi.org/10.1016/s0377-8401(98)00187-4.
Danell K., Duncan P., Bergstrom R., Pastor J. (2006). Large herbivore ecology, ecosystem dynamics and conservation. Cambridge University Press, Cambridge, UK. 480 p. https://doi.org/10.1017/CBO9780511617461.
Daneshvar A., Tigabu M., Karimidoost A., Odén P.C. (2015). Single seed near infrared spectroscopy discriminates viable and non-viable seeds of Juniperus polycarpos. Silva Fennica 49(5) article 1334. https://doi.org/10.14214/sf.1334.
Ericsson G., Dalin A.-M., Steen M., Thulin C.-G., Wallin K., Hård af Segerstad C. (2013). DN debatt: överdrivna rapporter om massdöd bland vilda djur.
Eriksson L., Johansson E., Kettaneh-Wold N., Trygg J., Wikström C., Wold S. (2006). Multi- and megavariate data analysis. Basic principles and applications. Second revised and enlarged edition. Umetrics Academy, Umeå, Sweden. 425 p.
Felton A.M., Felton A., Raubenheimer D., Simpson S.J., Foley W.J., Wood J.T., Wallis I.R., and Lindenmayer D.B. (2009). Protein content of diets dictates the daily energy intake of a free-ranging primate. Behavioral Ecology 20(4): 685–690. https://doi.org/10.1093/beheco/arp021.
Foley W.J., McIlwee A., Lawler I., Aragones L., Woolnough A.P., Berding N. (1998). Ecological applications of near infrared reflectance spectroscopy a tool for rapid, cost-effective prediction of the composition of plant and animal tissues and aspects of animal performance. Oecologia 116(3): 293–305. https://doi.org/10.1007/s004420050591.
Foskolos A., Calsamiglia S., Chrenková M., Weisbjerg M.R., Albanell E. (2015). Prediction of rumen degradability parameters of a wide range of forages and non-forages by NIRS. Animal 9(7): 1163–1171. https://doi.org/10.1017/S1751731115000191.
Galindo-Prieto B., Eriksson L., Trygg J. (2015). Variable influence on projection (VIP) for OPLS models and its applicability in multivariate time series analysis. Chemometrics and Intelligent Laboratory Systems 146: 297–304. https://doi.org/10.1016/j.chemolab.2015.05.001.
Galvez-Ceron A., Serrano E., Bartolome J., Mentaberre G., Fernandez-Aguilar X., Fernandez-Sirera L., Navarro-Gonzalez N., Gasso D., Lopez-Olvera J.R., Lavin S., Marco I., Albanell E. (2013). Predicting seasonal and spatial variations in diet quality of Pyrenean chamois (Rupicapra pyrenaica pyrenaica) using near infrared reflectance spectroscopy. European Journal of Wildlife Research 59(1): 115–121. https://doi.org/10.1007/s10344-012-0672-9.
Gil-Jimenez E., Villamuelas M., Serrano E., Delibes M., Fernandez N. (2015). Fecal nitrogen concentration as a nutritional quality indicator for European rabbit. Ecological Studies. PLoS ONE 10(4): e0125190. https://doi.org/10.1371/journal.pone.0125190.
Gill R.M.A., Beardall V. (2001). The impact of deer on woodlands: the effects of browsing and seed dispersal on vegetation structure and composition. Forestry 74(3): 209–218. https://doi.org/10.1093/forestry/74.3.209.
Jean P.-O., Bradley R.L., Tremblay J.-P., Côté S.D. (2015). Combining near infrared spectra of feces and geostatistics to generate forage nutritional quality maps across landscapes. Ecological Applications 25(6): 1630–1639. https://doi.org/10.1890/14-1347.1.
Jean P.-O., Bradley R.L., Berthiaume R., Tremblay J.-P. (2016). Evaluating old and novel proxies for in vitro digestion assays in wild ruminants. Wildlife Society Bulletin 40(2): 359–367. https://doi.org/10.1002/wsb.663.
Landau S., Glasser T., Dvash L. (2006). Monitoring nutrition in small ruminants with the aid of near infrared reflectance spectroscopy (NIRS) technology: a review. Small Ruminant Research 61(1): 1–11. https://doi.org/10.1016/j.smallrumres.2004.12.012.
Li H., Tolleson D., Stuth J., Bai K., Mo F., Kronberg S. (2007). Faecal near infrared reflectance spectroscopy to predict diet quality for sheep. Small Ruminant Research 68(3): 263–268. https://doi.org/10.1016/j.smallrumres.2005.10.017.
Licitra G., Hernandez T.M., Van Soest P.J. (1996). Standardization of procedures for nitrogen fractionation of ruminant feeds. Animal Feed Science and Technology 57(4): 347–358. https://doi.org/10.1016/0377-8401(95)00837-3.
Næs T., Isaksson T., Fearn T., Davies T. (2002). A user friendly guide to multivariate calibration and classification. NIR Publications, Chichester, UK. 344 p.
Raubenheimer D., Simpson S.J., Mayntz D. (2009). Nutrition, ecology and nutritional ecology: toward an integrated framework. Functional Ecology 23(1): 4–16. https://doi.org/10.1111/j.1365-2435.2009.01522.x.
Redjadj C., Darmon G., Maillard D., Chevrier T., Bastianelli D., Verheyden H., Loison A., Said S. (2014). Intra- and interspecific differences in diet quality and composition in a large herbivore community. PLoS ONE 9(2): e84756. https://doi.org/10.1371/journal.pone.0084756.
Roberts C.A., Stuth J., Finn P.C. (2004). NIRS applications in forages and feedstuffs. In: Roberts C.A., Workman J., Reeves J. (eds.). Near infrared spectroscopy in agriculture. ASA Monograph 44. ASA, Madison, Wisconsin. p. 231–267.
Scholtz G.D.J., van der Merwe H.J., Tylutki T.P. (2009). Prediction of chemical composition of South African Medicago sativa L. hay from a near infrared reflectance spectroscopy spectrally structured sample population. South African Journal of Animal Science 39: 183–187.
Shenk J.S., Workman J.J., Westerhaus M.O. (2001). Application of NIR spectroscopy to agricultural products. In: Burns D.A., Ciurczak E.W. (eds.). Handbook of Near-Infrared Spectroscopy. Marcel Dekker Inc., New York. p. 419–474.
Showers S.E., Tolleson D.R., Stuth J.W., Kroll J.C., Koerth B.H. (2006). Predicting Diet Quality of White-Tailed Deer via NIRS Fecal Profiling. Rangeland Ecology & Management 59(3): 300–307. https://doi.org/10.2111/04-069.1.
Simpson S.J., Sword G.A., Lorch P.D., Couzin I.D. (2006). Cannibal crickets on a forced march for protein and salt. Proceedings of the National Academy of Sciences of the United States of America 103(11): 4152–4156. https://doi.org/10.1073/pnas.0508915103.
Trygg J., Wold S. (2002). Orthogonal projections to latent structures (O-PLS). Journal of Chemometrics 16(3): 119–128. https://doi.org/10.1002/cem.695.
Van Soest P.J. (1994). Nutritional Ecology of the Ruminant. 2nd edition. Cornell University Press, Ithaca, United States. 488 p.
Van Soest P.J., Roberston J.B., Lewis B.A. (1991). Methods for dietary fiber, and nonstarch polysaccharides in relation to animal nutrition. Journal of Dairy Science 74(10): 3583–3597. https://doi.org/10.3168/jds.S0022-0302(91)78551-2.
Vance C.K., Tolleson D.R., Kinoshita K., Rodriguez J., Foley William J. (2016). Near infrared spectroscopy in wildlife and biodiversity – review. Journal of Near Infrared Spectroscopy 24(1): 1–25. https://doi.org/10.1255/jnirs.1199.
Villamuelas M., Serrano E., Espunyes J., Fernandez N., Lopez-Olvera J.R., Garel M., Santos J., Parra-Aguado M.A., Ramanzin M., Fernandez-Aguilar X., Colom-Cadena A., Marco I., Lavin S., Bartolome J., Albanell E. (2017). Predicting herbivore faecal nitrogen using a multispecies near-infrared reflectance spectroscopy calibration. PLoS ONE 12(4): e0176635. https://doi.org/10.1371/journal.pone.0176635.
Williams P.C., Sobering D.C. (1996). How we do it: a brief summary of the methods we use in developing near infrared calibrations. In: Davies A.M.C., Williams P.C. (eds.). Near infrared spectroscopy: the future waves. NIR Publications, Chichester, UK. p 185–188.
Workman J., Weyer L. (2012). Practical guide and spectral atlas for interpretive near-infrared spectroscopy. 2nd edition. CRC Press, Taylor & Francis, Boca Raton, Florida. 326 p. https://doi.org/10.1201/b11894.
Zinn R.A., Owens F.N. (1986). A rapid procedure for purine measurement and its use for estimating net ruminal protein synthesis. Canadian Journal of Animal Science 66(1): 157–166. https://doi.org/10.4141/cjas86-017.
Total of 38 references.
