Rune Simonsen 
Optimal regeneration method – Planting vs. natural regeneration of Scots pine in northern Sweden
Simonsen R. (2013). Optimal regeneration method – Planting vs. natural regeneration of Scots pine in northern Sweden. Silva Fennica vol. 47 no. 2 article id 928. https://doi.org/10.14214/sf.928
Highlights
- Two regeneration methods were modelled on stand level and optimised numerically to maximise present value for a range of site indexes and locations
- Natural regeneration was optimal in most cases
- Planting was optimal for high site indexes, low rate of seedling mortality and for low discount rates
- Using genetically improved plant material greatly shifts the preference towards planting
Abstract
In this study the profitability of regenerating Scots pine (Pinus sylvestris L.) was examined for two methods; planting and natural regeneration with seed trees. The methods were modelled on stand level and optimised numerically using nonlinear optimisation. The analysis includes 7 site indexes, 16 to 28 expressed as dominant height in meters at an age of 100 years; and 8 localities in northern Sweden distributed on two latitudes, 60°N and 64°N and four altitudes, 100 to 400 m.a.s.l. Furthermore, two scenarios of genetically improved planting material were examined. The results show that the optimal choice of regeneration method depends on the location, site index and discount rate. Considering the same genetic regeneration material, natural regeneration was the optimal method for most of the evaluated sites. Planting was optimal only for stands of high site index and low rate of seedling mortality, which is associated with localities on low altitudes. The break even site index, where the two methods yielded the same net present value, was 27 on average (25 to 28). The choice between the two regeneration methods was found to be more economically important when the discount rate was low and for low site indexes. The option of using genetically improved plant material shift the preference towards planting. Thus, the two levels of genetic gain of +4% and +10% to maximum mean annual increment resulted in an average break even site index of 25 and 21 respectively.
Keywords
optimisation;
silviculture;
genetically improved planting material
-
Simonsen,
Department of Forest Economics, SLU, SE-901 83 Umeå, Sweden
E-mail
rune.simonsen@slu.se
Received 5 June 2012 Accepted 20 March 2013 Published 4 July 2013
Views 119829
Available at https://doi.org/10.14214/sf.928 | Download PDF

Supplementary Files
1 Introduction
This study examines the profitability of two methods for regenerating Scots pine (Pinus sylvestris L.) in northern Sweden. The methods are planting and natural regeneration with seed trees. The aims of the study were to examine; 1) which of the methods to choose for a certain location and site index, when the only goal was profit maximisation; 2) how critical the choice was for the outcome in land value and 3) how much the option of using genetically improved planting material affects the results. In Sweden, previous studies of optimal method of regeneration have included only a few stand locations and site index types. This study increases the knowledge by expanding the analysis to 56 different types of generation sites. These are represented by two latitudes, four altitudes and seven different site index classes. A numerical optimisation model was developed, which calculates the highest land value for the two methods of regeneration at a range of parameters that define the stand location and productivity. Since the method of regeneration affects all possible subsequent decisions, the model simultaneously optimise all decision variables concerning the regeneration, thinning and final harvest. The objective was to maximise the net present value of the forest stand.
The regeneration method determines the emergence of a new stand and its possible development, as well as what silvicultural system can be chosen. Moreover, it determines what options and choices are available during the rotation period and their timing. Therefore, it has always been a subject of research and debate concerning productivity, profitability, and recently also non-timber benefits. In Sweden the main focus of the debate has been on timber production aspects of regeneration, but also the implications to the environment, biodiversity and multiple use, has been discussed. The choice of regeneration method is a multi-criteria decision problem, related to the objectives the owner has for the forest property. These may differ a great deal but often include an aspect of economic result, which is the focal point of this paper.
The even aged silvicultural system completely dominates Swedish forestry and three methods of forest regeneration are of importance for Scots pine: planting, natural regeneration with seed trees and sowing. Regeneration is mandatory according to the Swedish Forestry Act. Some attempts of using continuous cover forestry have been made but after some bad experiences in the first half of the 20th century the system was abandoned (Oleskog et al. 2008). Also, the present forest legislation makes it a difficult system to use. The option of simply leaving the site to natural regeneration after clear felling is a risky strategy due to uncertain regeneration results. In most cases this method will result in legislative demands for complementary regeneration actions. In this paper the two methods most commonly used for scots pine, planting and natural regeneration were chosen for examination.
The economic performance of different regeneration methods has been compared in several studies in Sweden over the years. Most studies of production aspects of different regeneration methods include an economic analysis. Studies of predefined regeneration schedules without optimisation have been done for natural regeneration, sowing and planting of Scots pine and Norway spruce (Glöde et al. 2003). Karlsson (2006) compared planting of Norway spruce with natural regeneration of Birch. Of studies that include optimisation of the whole rotation period the majority deal with optimal density of planting. Gong (1998) evaluated the theoretical framework of constructing decision models optimising planting density and land expectation value. For Norway spruce the planting of optimal number of seedlings was studied analytically and numerically by Lohmander (1994). Both studies included elements of numeric and stochastic optimisation. Zhou (1998) studied the optimal intensity and management of natural regeneration of Scots pine in northern Sweden. Stochastic optimisation has been applied to decide whether planting or natural regeneration is preferred when the risk of seedling mortality is considered (Zhou 1999a). Hyytiäinen et al. (2006) combined experimental data and an optimisation model to analyse planting, sowing and natural regeneration for Scots pine in southern Finland.
2 Methods and data
2.1 Stand location and productivity
The stand location and productivity was defined by the latitude, altitude and site index. Based on the site index the state of the old stand before the regeneration harvest was determined using standard values from The Swedish Forest Agency’s thinning instruction (Skogsstyrelsen 1985). Here it was assumed that stands located on different latitudes and altitudes with the same site index and age have similar properties at time of regeneration harvest (Appendix A Table A1). Throughout the paper site index (SIH(100), m) is used as a measure of site productivity. It is defined as the average height in meters of the 100 thickest trees per ha (dominant height) at an age of 100 years from seed. The prefix T, in e.g. T24, indicates Scots pine (“Tall” in Swedish).
2.2 Model for stand development and yield
The model for stand development is deterministic and comprises of a number of functions. It is only applied to the new stand – that is after the old stand has been cut. In general it may be divided into two parts; 1) determination of the initial state of the new stand, and 2) calculation of the further development of the new stand from the initial state through thinning until final harvest. The initial state of the new stand is defined at a dominant height of 3 meters and is determined by the latitude, altitude, site index and stem number. Based on the site index and the dominant height, the age from seed and the form height are calculated (Eqs. b9 and b14 Appendix B). The form height expresses both average tree height and tree form and is defined as equal to stem volume over bark divided by the basal area. The latitude, altitude and site index are exogenously defined parameters. The initial stem number of the new stand is determined by the regeneration method, the plant mortality and the intensity of the pre-commercial thinning. The basal area is estimated using a function for young pine stands (Elfving 2007)(Eq. b10 Appendix B). Based on basal area and stem number the basal area weighted average diameter (dg) is calculated (Eq. b17 Appendix B). Finally, from the form height and basal area, the volume is calculated (Eq. b14 Appendix B) (Elfving 2007).
The further development of the stand is calculated with age from seed as the driving variable in combination with the decision variables for thinning and harvest. The growth model comprises of a function for dominant height (Eq. b9 Appendix B) (Elfving and Kiviste 1997) and a function for basal area increment (Eq. b11 Appendix B) (Elfving 2007). The reduction of basal area and stem number due to self-thinning (mortality) is calculated and subtracted from the stock before every thinning or harvest (Eqs. b12 and b13 Appendix B) (Elfving 2007). For un-thinned and dense stands the basal area was restricted by a function that determines the maximum basal area as a function of site index, latitude and dominant height (Eq. b16 Appendix B) (Elfving 2010). The standing timber stock was converted to merchantable timber volume under bark by the use of yield tables for Scots pine in northern and central Sweden (Eq. b15 Appendix B) (Cernold 1981a, Cernold 1981b).
2.2.1 Seedling mortality
For both planted and natural regenerated seedlings a function for mortality in young pine stands was used to reduce the stem number from regeneration to pre-commercial thinning. Thus, a function of latitude and altitude by Eriksson et al. (1980) which estimates the mortality rate of planted seedlings during the first twenty years after establishment was modified to a function for annual survival rate (Eq. b1 Appendix B). It was assumed that the annual survival rate was of the same magnitude over years. The survival rate was assumed to be the same for both natural regenerated seedlings and planted seedlings. After the time of pre-commercial thinning, the mortality was modelled by the growth model as explained above.
2.3 Prices and costs
The timber price was based on the average of three roadside pricelists for the regions of Umeå, Skellefteå and Örnsköldsvik obtained on the website of the forest owner association Norra Skogsägarna for the first quarter of 2009 (Norra 2009) (Appendix C Table C1). To reduce the impact of the fact that prices of timber and pulpwood tend to vary a lot over time, the present average assortment pricelist was adjusted by the average real timber price for northern Sweden for the period 1996 to 2009 (Swedish Forest Agency 2009). Thus, the quarterly average timber prices for northern Sweden for the years 1996 to 2009 were adjusted to 2009 price levels by using the consumer price index. The average of the real prices for the period divided by the average price of the first quarter 2009 yielded an adjustment factor that was used to adjust all assortment prices in the pricelist. The price of pulpwood minus cost for transportation to industry was adjusted in the same manner by using quarterly average pulpwood prices for the period (Appendix C Table C2). The adjusted pricelist and the price of pulpwood were converted to a roadside price function by using a stem price method, where the average price per cubic metre is determined by the average diameter of the harvested trees. The method is based on the relationship between the average tree diameter, an average outcome of the bucking and the prices of different log sizes weighted by a normal quality distribution for northern Sweden (Möller 2005) (Appendix C Fig. C1).
The cost functions for harvesting and thinning were based on functions by Holmen Skog adapted to the machine price level of 2009 provided by Norra Skogsägarna (Kraftsamling skog 2009). The cost for seed tree harvest was assumed to be 20% higher than for clear felling (Rosvall et al. 2007). In reality the cost of soil treatment depends on a large number of parameters such as the setup cost, the type of machine, soil and terrain conditions, spatial distribution of patches etc. On the other hand, it is not significantly affected by the number of patches (Back Tomas Ersson, Swedish University of Agricultural Sciences, pers. comm. 2013). Since most of these parameters are unspecified in the model the cost of soil treatment was assumed to be the same for all sites. For planted sites the cost of soil treatment was determined by adjusting the average cost of soil treatment for northern Sweden 2006 (Brunberg 2007) to the price level of 2009 using the consumer price index. For natural regeneration this was assumed to be about 10% higher than for planting (Westerberg and von Hofsten 1996). The costs for planting were assumed to be completely variable with the number of seedlings (Simonsen et al. 2010).
The cost functions for pre-commercial thinning, were constructed by using tables for performance in motor-manual cleaning and a per hour cost estimate for 2009 (Bergstrand et al. 1986; Lantz Skogsvård 2009). In order to calculate the cost of pre-commercial thinning it is necessary to determine the number of removed stems. For the scenario of naturally regenerated stands only one seedling per scarified patch is wanted. All other seedlings are removed in the pre commercial thinning. The number of pine seedlings occurring in the undisturbed humus cover was determined using functions by Hagner (1962) (Eqs. b5 and b6 Appendix B). Also, based on Hagner (1962) it was assumed that one birch seedling occurs in each scarified patch. The number of naturally regenerated spruce and pine seedlings present in the planted stands was assumed to equal that found on average by Ackzell (1994). Thus, the number of seedlings removed in pre-commercial thinning (see Table A2 in Appendix A), and therefore the cost of pre-commercial thinning depends on the site index, the regeneration method and the number of scarified patches.
All costs and prices were assumed to be real and stable over time. No taxes such as income tax etc. were included in the analyses. The exchange rate between Euro (EUR) and Swedish Krone (SEK) is the monthly average for February 2009 (1 EUR = 10.9003 SEK) (Sveriges Riksbank 2013). Data on costs used in the model are presented in Appendix C Table C3.
2.4 Methods of regeneration
2.4.1 Natural regeneration
The method of natural regeneration examined in this analysis is the seed tree method. The method includes a regeneration harvest where all but the seed trees are removed. This is followed by a soil treatment of patch scarification type, where a number of patches with favourable germination conditions are created. The seed trees are retained in the stand for a time period and will disperse their seeds and produce new seedling. The seedlings will often emerge all over the forest floor, but most of them and the largest of them are found in the scarified patches (Hagner 1962). The seed trees are subsequently removed and the new young stand will idealistically resemble an even aged planted stand, though often denser. Also the time span from regeneration to a certain seedling height is longer than for a planted stand.
In this analysis the functions of Hagner (1962) were used to model the number of seedlings produced on the scarified area (Eqs. b2, b3 and b4 Appendix B). The function for fresh sites was used for all site indexes except for site index T16 where the function for dry sites was applied. The size of each scarified patch was assumed constant at 0.5 × 0.5 m.
The seed-tree-period is a decision variable determined by the model, but restrictions were imposed for upper and lower bounds. The seed trees are retained in the stand until the dominant height of the seedlings has reached at least 30 cm to ensure an adequate seed fall. Also, in order to reduce damages on the seedlings when the seed trees are harvested these must be removed before the seedlings reach a dominant height of 1 m. In the model the results of these restrictions are that the seed tree periods range from 8 to 16 years, depending on site index.
Time loss
It takes time for seeds to germinate and produce seedlings of the same height as the planted seedling have when planted. Therefore, the method of natural regeneration result in a time loss compared to planting. The time loss was modelled by comparing the height of the highest natural regenerated seedling after seven years with the age of a planted stand of similar dominant height (Eqs. b7, b8 and b9 Appendix B) (Hagner 1962). The period of seven years was chosen since the emergence of new seedlings is very limited after a period of around seven years (Hagner 1962). The modelled time loss was 3.5 to 5.5 years depending on the number of seed trees and the site index.
Seed trees
The size of the seed trees was assumed to equal the mean tree size before regeneration harvest. The seed trees continue to grow and are harvested after the seed tree period has ended. The annual basal area increment of the seed trees was assumed to be 20% higher than the growth was before harvest (Rosvall et al. 2007). In average this results in an annual basal areal increment of 1.5%, which was used for all stands. The mortality of the seed trees is rather uncertain but it is probably larger than before regeneration harvest as is the case for all thinning actions. Therefore the annual mortality of the seed trees was assumed to be 0.5% which is around twice the mean annual mortality for the whole rotation period (Elfving 2010). As sensitivity analysis the effect of an even higher annual mortality of 1% was tested. At future regeneration harvests the same number of seed trees was retained and were harvested after the same seed tree period.
2.4.2 Planting
The alternative of regenerating by planting entails that the model gets to choose the number of seedlings planted. It was assumed that the area would be ready for planting one year after final harvest and that the plants used were one year old, which means that the stand age is equal to the plant age. In contrast to natural regeneration, the seed source for planting and thereby the genetic properties may be freely chosen. In the main analysis the seedlings were assumed to origin from local seed sources with the same genetic characteristics and productivity as the naturally regenerated seedlings. To capture the effect of improved planting material a sensitivity analysis was carried out by repeating the calculations for planting for two different levels of genetic gain to growth. The improved seedlings were assumed to origin from suitable seed orchards and result in an increase of the site index of 2% or 5%. When measured as increased MAI-max (mean annual increment at time of growth culmination), these correspond to on average 4% (3–5%) and 10% (7–12%) respectively depending on the stem number chosen by the model. The additional cost of improved seedlings was assumed to be 0.9c per seedling (Kraftsamling skog 2009).
2.5 Optimisation problem
The optimisation problem was to identify the regeneration method which results in the highest net present value given specified parameters for stand location and state of the old stand. The problem was divided up into a number of sub-problems that were solved separately. In Table 1 the parameters defining the stand location, productivity and demand to economic return are presented as well as the sub-problems. For each set of the parameters; latitude, altitude, site index and discount rate, eight sub-problems where optimised: Planting with 0to 3 thinnings and Natural regeneration with 0to 3 thinnings. Thus, the model allow for up to three thinnings which corresponds to what is used in normal Swedish forest practice. For each of the two regeneration methods, the sub-problem that resulted in the highest net present value represented the optimal solution. The sub-problems were solved each with 45 sets of random initial values of the decision variables to ensure that a good approximation of the global maximum was found. The optimisation was carried out using the GRG nonlinear solver engine embedded in Microsoft Excel 2010 (Appendix B).
| Table 1. Parameters defining stand location, productivity, discount rate and the resulting sets of optimisation sub-problems. | |||
| Parameters defining stand location, productivity, demand to economic return | |||
| Stand location | Latitude, °N | lat | = {60, 64} |
| Altitude, m.a.s.l. | alt | = {100, 200, 300, 400} | |
| Stand productivity | Site index, SIH(100) | SIH | = {T16, T18, T20, T22, T24, T26, T28} |
| Discount rate, % | r | = {1.0, 1.5, 2.0, 2.5, 3.0} | |
| The parameters above generate 280 combinations. For each of these, 2 × 4 sub-problems were solved separately. | |||
| Silvicultural decisions | Regeneration method | RM | = {Planting, Seed-tree-method} |
| Number of thinnings | TH | = {0, 1, 2, 3} | |
| m.a.s.l. = meters above sea level, SIH(100) = dominant height of stand in meters at an age of 100 years. The prefix T in e.g. T24 denotes Scots pine (“Tall” in Swedish). | |||
2.5.1 Decision variables
The number of decision variables for the eight sub-problems range from 3 to 12 for the planting methods and 5 to 14 for the natural regeneration methods. In general the decision variables can be divided into two groups, variables controlling the regeneration method and variables controlling the further development and harvest of the stand. For planting the number of seedlings per ha is the only decision variable controlling regeneration. For natural regeneration three decision variables related to the regeneration method are used i.e. the number of soil treated patches, the number of seed trees and the length of the seed tree period. For both methods the intensity of pre commercial thinning and the age of regeneration harvest are decision variables. Moreover, for each thinning three more decision variables are added, that is thinning age, thinning intensity and thinning form (diameter quota). In Table 2 the decision variables are presented.
| Table 2. Decision variables. | |
| Regeneration by planting | Natural regeneration by seed trees |
| · Number of seedlings planted (seedlings ha–1) | · Number of soil treatment patches (patches ha–1) |
| · Number of seed trees (stems ha–1) | |
| · Seed tree period, years | |
| · Intensity of pre commercial thinning, fraction of stems removed | |
| For each thinning i = {0, 1, 2, 3} | |
| · Age of thinning i, years | |
| · Intensity of thinning i, fraction of basal area removed | |
| · Diameter quota Q = Dt/Dr, where Dt is the diameter of stems removed by thinning and Dr is the diameter of the remaining stems | |
| · Age of final harvest, years | · Age of regeneration harvest, years |
2.5.2 Goal functions
The goal function was the total net present value. This comprises of firstly the value of the old stand harvested now and secondly the value of new stand and all future stands regenerated and treated in the same manner. Thus, for planting the goal function takes the following form:
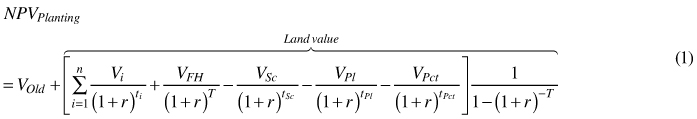
where NPV is the present value, VOld is the value of the old stand harvested at time zero, V is the net value, FH denotes the final harvest, Sc is the scarification, Pl is planting and Pct is the pre-commercial thinning. Also, i denotes thinning i = {0, 1, 2, 3}, for scenarios of no thinning (i = 0) the present value of thinning is zero. Moreover, r is the discount rate, t is time in years so that tSc < tPl < tPct < ti < T where T is the rotation period. For planting the second term in the equation equals the land value as formulated by Faustmann (1849).
For natural regeneration the goal function is:
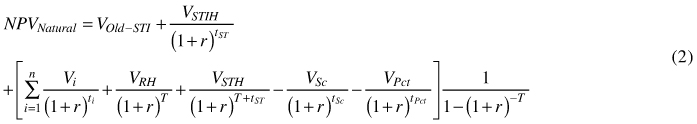
where VOld-STI denotes the value of the old stand except the seed trees that are retained, STIH is harvest of initial seed trees, RH denotes the regeneration harvest at time T – the rotation period (time span between regeneration harvest), STH is the harvest of the seed trees at time T + tST, where tST is the seed tree period. That is the seed trees are harvested later than the rotation period, this however poses no problem for the eternity calculations. For natural regeneration the stand generations are interlocked making it impossible to calculate a true land value. This is because the land is never bare and the regeneration is dependent on seed trees being present. However, an approximate land value for the case of natural regeneration can be defined as NPVNatural minus VOld. That is, we pretend the new stand can purchase the seedlings from the old stand paying the seed tree value foregone at final felling minus the income from seed tree harvest.
2.5.3 Restrictions
A number of restrictions were imposed on the model to keep parameters within the boundaries of the underlying functions and to meet legislative requirements.
Thinning
The dominant height for the first thinning was restricted to at least 8 m. The removal of basal area at thinning is restricted to between 20% and 35% and the maximum removal of stem number is 45%. The quota between the diameter of the removed stems and the diameter of the remaining stems must be between 0.7 and 1.2. The time span between thinnings must be at least 8 years. These restrictions are imposed to ensure that the thinnings are separable and that the stand does not break up. The functions for stand development are based on common forest practice. Therefore the model was restricted to results where the self-thinning (mortality) of stems was lower than 20% between thinnings.
Harvest age and number of seedlings
The Swedish forest law regulates the rotation period by a minimum harvest age, which varies between the different regions and site indexes (Skogsstyrelsen 2009). Furthermore, the law prescribes a minimum number of living seedlings at latest time of supplementary planting. These minimum restrictions were used for both regeneration alternatives. For natural regeneration it was assumed that only one seedling per patch could be retained for further stand development. The maximum number of patches was assumed to be 6000 per hectare. The excess seedlings were removed in the pre-commercial thinning. For sites that are difficult to regenerate, not all patches will yield seedlings and the number of scarified patches has to be larger than the minimum seedling number.
The only parameters that were subject of a sensitivity analysis were mortality and genetic gain to growth. No sensitivity analyses were conducted for prices and costs.
3 Results
The results differ slightly with different initial values of decision variables for the optimisation. The Solver optimisation engine sometimes gets trapped on solutions yielding a lower value of the goal function than the optimal one. For each sub-problem, 45 values of the goal function were calculated and the average value of these lies between 94 and 100 per cent of their maximum value. The relative difference between the highest and lowest value of the goal function is largest when the number of decision variables are large. Also, this is the case when the discount rate is low.
As expected the net present value is positively correlated to site index and negatively to the discount rate. The optimal regeneration method and number of thinnings are presented in Table 3. When considering genetically unimproved seedlings, planting is optimal only on sites of higher productivity. That is, when the site index is at least T26 for latitude 60°N and T28 for latitude 64°N. For T26 in the southern region planting is only optimal for discount rates lower than about 2%. For both latitudes none of the regeneration methods result in positive land value for T16 to T18 and discount rates of 2.5% to 3%.
| Table 3. Difference between the best scenario of planting and natural regeneration. Genetically unimproved planting material. Results for 8 different stand locations and 7 levels of productivity. | ||||||||||||||||
| Latitude °N | Altitude m.a.s.l. | Discount rate | Site index (SIH(100), m) | |||||||||||||
| T16 | T18 | T20 | T22 | T24 | T26 | T28 | ||||||||||
| 60 | 100 | 1.0% | –230 | N1 | –324 | N1 | –306 | N1 | –207 | N1 | –66 | N1 | 90 | P1 | 281 | P1 |
| 1.5% | –125 | N0 | –177 | N1 | –206 | N1 | –187 | N1 | –116 | N1 | 6 | P1 | 126 | P1 | ||
| 2.0% | –112 | N0* | –129 | N0 | –140 | N1 | –138 | N1 | –108 | N1 | –29 | N1 | 61 | P1 | ||
| 2.5% | –100 | N0* | –112 | N0* | –125 | N0* | –118 | N0 | –103 | N1 | –56 | N1 | 19 | P1 | ||
| 3.0% | –94 | N0* | –102 | N0* | –113 | N0* | –106 | N0* | –96 | N0 | –62 | N1 | –13 | N1 | ||
| 200 | 1.0% | –264 | N1 | –361 | N1 | –358 | N1 | –257 | N1 | –110 | N1 | 47 | P1 | 241 | P1 | |
| 1.5% | –138 | N0 | –194 | N1 | –232 | N1 | –221 | N1 | –150 | N1 | –8 | N1 | 127 | P1 | ||
| 2.0% | –125 | N0* | –138 | N0 | –156 | N1 | –162 | N1 | –131 | N1 | –56 | N1 | 50 | P1 | ||
| 2.5% | –112 | N0* | –122 | N0* | –134 | N0* | –124 | N0 | –121 | N1 | –78 | N1 | 8 | P1 | ||
| 3.0% | –105 | N0* | –112 | N0* | –123 | N0* | –116 | N0* | –106 | N0 | –72 | N1 | –23 | N1 | ||
| 300 | 1.0% | –293 | N1 | –398 | N1 | –417 | N1 | –313 | N1 | –158 | N1 | 15 | P1 | 185 | P1 | |
| 1.5% | –157 | N0 | –214 | N1 | –260 | N1 | –256 | N1 | –184 | N1 | –45 | N1 | 98 | P1 | ||
| 2.0% | –139 | N0* | –149 | N0 | –166 | N1 | –180 | N1 | –159 | N1 | –86 | N1 | 38 | P1 | ||
| 2.5% | –125 | N0* | –133 | N0* | –141 | N0 | –135 | N0 | –133 | N1 | –91 | N1 | –2 | N1 | ||
| 3.0% | –117 | N0* | –122 | N0* | –128 | N0* | –126 | N0* | –116 | N0 | –82 | N1 | –33 | N1 | ||
| 400 | 1.0% | –298 | N1 | –428 | N1 | –470 | N1 | –370 | N1 | –208 | N1 | –25 | N1 | 150 | P1 | |
| 1.5% | –174 | N0 | –218 | N1 | –277 | N1 | –285 | N1 | –221 | N1 | –81 | N1 | 74 | P1 | ||
| 2.0% | –155 | N0* | –162 | N0 | –167 | N1 | –186 | N1 | –184 | N1 | –103 | N1 | 25 | P1 | ||
| 2.5% | –139 | N0* | –145 | N0* | –151 | N0 | –148 | N0 | –139 | N1 | –108 | N1 | –25 | N1 | ||
| 3.0% | –131 | N0* | –133 | N0* | –139 | N0* | –137 | N0* | –128 | N0 | –90 | N0 | –50 | N1 | ||
| 64 | 100 | 1.0% | –339 | N1 | –426 | N1 | –455 | N1 | –349 | N1 | –186 | N1 | –13 | N1 | 75 | P1 |
| 1.5% | –159 | N0 | –205 | N1 | –236 | N1 | –258 | N1 | –207 | N1 | –60 | N1 | 97 | P1 | ||
| 2.0% | –141 | N0* | –151 | N0 | –154 | N0 | –160 | N1 | –154 | N1 | –97 | N1 | 43 | P1 | ||
| 2.5% | –127 | N0* | –137 | N0* | –141 | N0 | –136 | N0 | –119 | N0 | –77 | N1 | –5 | N1 | ||
| 3.0% | –120 | N0* | –126 | N0* | –131 | N0* | –128 | N0* | –116 | N0 | –76 | N0 | –33 | N0 | ||
| 200 | 1.0% | –371 | N1 | –430 | N1 | –486 | N1 | –414 | N1 | –242 | N1 | –66 | N1 | 34 | P1 | |
| 1.5% | –181 | N1 | –208 | N1 | –240 | N1 | –262 | N1 | –249 | N1 | –103 | N1 | 73 | P1 | ||
| 2.0% | –158 | N0* | –166 | N0 | –168 | N0 | –164 | N1 | –159 | N1 | –111 | N1 | –10 | N1 | ||
| 2.5% | –143 | N0* | –150 | N0* | –155 | N0 | –150 | N0 | –132 | N0 | –83 | N1 | –14 | N1 | ||
| 3.0% | –135 | N0* | –139 | N0* | –143 | N0* | –140 | N0* | –129 | N0 | –87 | N0 | –45 | N0 | ||
| 300 | 1.0% | –378 | N1 | –427 | N1 | –486 | N1 | –496 | N1 | –308 | N1 | –114 | N1 | 3 | P1 | |
| 1.5% | –201 | N0 | –207 | N1 | –240 | N1 | –263 | N1 | –256 | N1 | –150 | N1 | 40 | P1 | ||
| 2.0% | –178 | N0* | –179 | N0 | –180 | N0 | –168 | N0 | –161 | N1 | –113 | N1 | –12 | N1 | ||
| 2.5% | –163 | N0* | –163 | N0* | –166 | N0 | –160 | N0 | –141 | N0 | –90 | N0 | –20 | N0 | ||
| 3.0% | –154 | N0* | –151 | N0* | –154 | N0* | –150 | N0* | –137 | N0 | –95 | N0 | –51 | N0 | ||
| 400 | 1.0% | –362 | N1 | –373 | N1 | –474 | N1 | –510 | N1 | –391 | N1 | –187 | N1 | 15 | P1 | |
| 1.5% | –221 | N0 | –221 | N0 | –230 | N1 | –257 | N1 | –253 | N1 | –182 | N1 | –2 | N1 | ||
| 2.0% | –200 | N0* | –194 | N0 | –193 | N0 | –179 | N0 | –158 | N1 | –111 | N1 | –10 | N1 | ||
| 2.5% | –182 | N0* | –178 | N0* | –180 | N0 | –172 | N0 | –149 | N0 | –97 | N0 | –25 | N0 | ||
| 3.0% | –173 | N0* | –167 | N0* | –168 | N0* | –161 | N0* | –148 | N0 | –103 | N0 | –56 | N0 | ||
| Difference in net present value = (NPVPlanting – NPVNatural) in € ha–1. Thus, positive values mean that the best option for planting yields a higher net present value than the best natural regeneration. N denotes that natural regeneration is the optimal method, P denotes planting. The numbers 0 to 1 represents the optimal number of thinnings and * means that both methods result in negative land value. | ||||||||||||||||
Compared to planting, natural regeneration is less negatively affected by the harshness of a site (high seedling mortality rate, which increases with altitude and latitude). This is because a larger initial number of seedlings are needed on harsh sites to make up for a high mortality. In case of planting every seedling must be paid for whereas natural regenerated seedlings can be regulated by increasing the number of scarified patches or seed trees, which makes the increased mortality less costly for this alternative. The cost of soil treatment in this model is not affected by the number of patches, though a larger number of patches would imply a higher cost of pre-commercial thinning. Also, the growth is strongly correlated to the initial seedling number which favours dense young stands. The effect of the latitude is that natural regeneration is optimal for a greater number of sites in the northern location than in the southern.
Even though the model may choose up to three thinnings, all the optimal solutions include just one or no thinning. Two thinnings were optimal only for a few cases of natural regeneration on T28 with a discount rate of 1% but here planting was more profitable.
Of the optimal solutions it was profitable to use thinning in 50% of the stands at latitude 64°N and 65% for stands at latitude 60°N. The average removal of basal area in the first thinning was 21%.
In general thinning is used more often in natural regeneration than in planting. This is especially the case for latitude 64°N, where thinning is used in planted stands only for high site index at low discount rates.
The low number of thinnings is reflected in rather high stem numbers of around 1000 stems per hectare at time of regeneration harvest. It seems that the production loss suffered by reducing the number of trees is too large or the increase in net price related to diameter not large enough to make more thinnings optimal. Also, since the production level depends on the initial stem number, dense regeneration is optimal even when the net value of the first thinning is negative. Moreover, when a thinning is included in the optimal solution it is carried out much earlier than normally and the dominant height for the first thinning lies close to the lower limit of 8 m. The average thinning quota for the optimal solutions was 1.08. For the best solutions for planting it was 0.94 and for natural regeneration it was 1.08.
In Fig. 1 the average optimal regeneration harvest ages for all the sites are presented together with the minimum harvest age stipulated by the legislation. The bars show the maximum and minimum values. The largest difference is found on site indexes 18 to 22 at a discount rate of 2% and is due to differences in the number of thinnings chosen by the model on different latitudes.
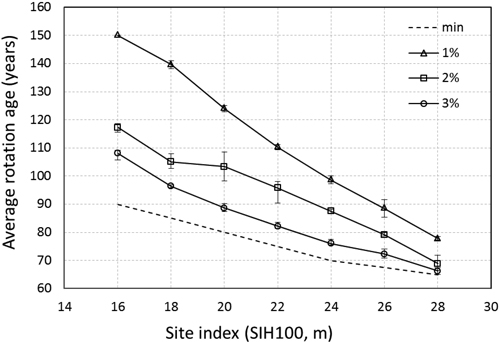
Fig. 1. Average age of regeneration harvest for all latitudes and altitudes and three discount rates. min denotes the minimum harvest age (Skogsstyrelsens föreskrifter… 2009). The bars denote maximum and minimum values.
3.1 Sensitivity analysis
Turning to the option of using improved planting material the results change in favour of planting. Even for a relatively small genetic gain of +2% to site index (+4% to MAI-max), the more common sites of T24 are optimal to regenerate by planting for low discount rates (Table 4 – compare to the first five rows in Table 3). For the larger genetic gain of +5% to site index (+10% to MAI-max) the majority of the examined site indexes should be planted. In Fig. 2 the Break-even site index is presented for a discount rate of 2.5% at 60°N. The Break-even site index, calculated by linear interpolation (linear extrapolation), is where the two methods result in the same net present value. Above the curves in Fig. 2 planting is the best option and beneath them natural regeneration is preferred. The average break even site indexes are 28.0 for unimproved, 25.4 for genetically improved +2% and 21.3 for genetically improved +5% (Fig. 2). The shift follows the same pattern for all examined localities, though the genetic gain has to be larger to reach the same break even site index for locations on higher altitude and latitude. The Break-even site index was positively correlated to the altitude and the discount rate.
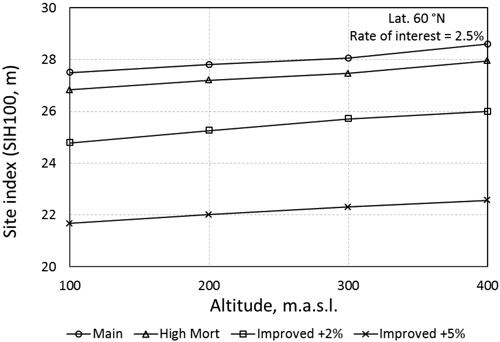
Fig. 2. Break-even site index at latitude 60°N and a discount rate of 2.5%. The break-even site index was calculated by linear interpolation except for the two points lying above SIH 28. Here linear extrapolation was used.
The scenario of using an annual mortality of seed trees of 1% had a rather limited effect, but do shift the optimal option somewhat in advantage of planting (Table 4). Hence, the average break even site index shifted from 28.0 to 27.4.
| Table 4. Difference in net present value between the best option for planting and for natural regeneration. Scenarios for two levels of genetic gain to growth compared to natural regeneration; and a scenario of higher mortality for seed trees compared to unimproved planting material. Latitude 60°N, Altitude 100 m.a.s.l. Compare to the first five rows in Table 3. | |||||||||||||||
| Scenario | Discount rate | Site index (SIH(100), m) | |||||||||||||
| T16 | T18 | T20 | T22 | T24 | T26 | T28 | |||||||||
| Genetically improved seedlings,+2% to site index | 1.0% | –178 | N1 | –235 | N1 | –151 | N1 | 28 | P1 | 271 | P1 | 553 | P1 | 908 | P1 |
| 1.5% | –108 | N0 | –145 | N1 | –134 | N1 | –67 | N1 | 74 | P1 | 261 | P1 | 474 | P1 | |
| 2.0% | –106 | N0* | –117 | N0 | –101 | N1 | –72 | N1 | –2 | N1 | 136 | P1 | 283 | P1 | |
| 2.5% | –100 | N0* | –107 | N0* | –107 | N0* | –77 | N0 | –35 | N1 | 54 | P1 | 165 | P1 | |
| 3.0% | –98 | N0* | –102 | N0* | –106 | N0* | –85 | N0* | –56 | N0 | 8 | P1 | 81 | P1 | |
| Genetically improved seedlings,+5% to site index | 1.0% | –76 | N1 | –67 | N1 | 138 | P1 | 447 | P1 | 847 | P1 | 1345 | P1 | 1956 | P1 |
| 1.5% | –62 | N0 | –61 | N1 | 8 | P1 | 163 | P1 | 414 | P1 | 711 | P1 | 1105 | P1 | |
| 2.0% | –79 | N0* | –73 | N0 | –15 | N1 | 62 | P1 | 208 | P1 | 430 | P1 | 676 | P1 | |
| 2.5% | –84 | N0* | –80 | N0* | –48 | N0* | 9 | P0 | 105 | P1 | 266 | P1 | 419 | P1 | |
| 3.0% | –88 | N0* | –84 | N0* | –64 | N0* | –26 | N0* | 37 | P0 | 156 | P1 | 252 | P1 | |
| Higher rate of annual mortality for seed trees, 1% instead of 0.5% | 1.0% | –201 | N1 | –294 | N1 | –271 | N1 | –167 | N1 | –21 | N1 | 131 | P1 | 332 | P1 |
| 1.5% | –103 | N0 | –152 | N1 | –177 | N1 | –155 | N1 | –79 | N1 | 47 | P1 | 171 | P1 | |
| 2.0% | –94 | N0* | –110 | N0 | –121 | N1 | –117 | N1 | –86 | N1 | –2 | N1 | 91 | P1 | |
| 2.5% | –90 | N0* | –99 | N0* | –109 | N0* | –98 | N0 | –86 | N1 | –32 | N1 | 45 | P1 | |
| 3.0% | –85 | N0* | –90 | N0* | –97 | N0* | –87 | N0* | –77 | N0 | –39 | N1 | 12 | P1 | |
| Difference in net present value = (NPVPlanting – NPVNatural) in € ha–1. Thus, positive values mean that the best option for planting yields a higher net present value than the best option for natural regeneration. N denotes that natural regeneration is the optimal method, P denotes planting. The numbers 0 to 1 represents the optimal number of thinnings and * means that both methods result in negative land value. | |||||||||||||||
For the scenario of unimproved planting material the choice of regeneration method was found to be more important for low discount rates and on sites of poor productivity. At high productivity the relative difference is rather small meaning that the choice of regeneration method is less important opposed to sites of low productivity where the relative difference is higher and the choice more critical. The relative difference in net present value for genetically improved seedlings increased with site index. These results hold for both latitudes studied.
3.2 Evaluation of restrictions – unimproved plant material
For planting the lowest required number of seedling is restraining for all the optimal solutions at 3% and 2.5% discount rate and most of the solutions at 2% and 1.5%. This indicates that it would be better to plant less seedlings than required by law for these cases which corresponds well to the findings of Lohmander (1994). For a discount rate of 1% it is optimal to plant more than required for half of the stands and these all had a site index larger than T18.
The optimal number of seed trees for natural regeneration was 50 per ha for discount rates of 1.5% or higher, which equals the minimum requirements of the underlying regeneration functions that allows between 50 and 250 seed trees per ha. This corresponds to the study of Zhou (1998) that used the same model for natural regeneration. The number of seed trees exceeded 50 only for a few stands at a discount rate of 1%. For discount rates of 3% the seed trees were retained until the new stand had reached a dominant height of 0.3 m, which was the minimum seed tree period. For a discount rate 1% the seed trees were retained until the new stand had reached a dominant height of 1 m, which is the maximum seed tree period. For discount rates in the span of 2.5% to 1.5% the seed tree period increases with lower interest rate. As to the number of seedlings, in natural regenerated stands, the requirements were just met for the majority of stands at a discount rate of 3%. However for a discount rate of 1% the majority produced more plants than required, with an average surplus of plants of about 1400 per hectare for 64°N and 900 per hectare for 60°N.
For natural regeneration the minimum harvest age as required by law was a restraining restriction only for a few sites of highest site index and a discount rate of 3%. For planting however the restriction was more restraining though it did not influence the choice of regeneration method.
4 Discussion and conclusions
The price function in this model is based on the average tree dimension and a normal distribution of quality for the region and does not take into account the quality effects of the pre-commercial thinning or other thinnings except for the effect on diameter. Stands that started out as dense are often associated with a higher timber quality because of larger selection potentials and uniform forest cover (Agestam et al. 1998). Another effect of denser stands is that the biomass production is positively correlated to stem number. The price model does not include biomass for energy production, which could favour denser stands.
Hence, it is possible that the boundary of optimality between the two methods of regeneration in practice lies more in favour of natural regeneration than this study shows. In parity with the findings in this analysis, Hyytiäinen et al. (2006) found that natural regeneration was preferred over planting at high discount rates, which was due to lower initial investment costs and possibly also the inclusion of timber quality in the analysis.
The classical Swedish silvicultural practice tends to emphasise the production aspects. The objective has been to produce as much as possible of as good a quality as possible on all sites. This is also reflected in the legislative requirement for good forest practice. In this study, the legislative minimum requirements for sites with low productivity result in low or negative land values when the discount rate is higher than 2%. Several other studies point in the same direction (Lohmander 1994; Gong 1995; Gong 1998; Zhou 1999b). Thus, the Swedish forest legislation is in conflict with the economic rationale of the forest owner. It also relates to the interesting problem of where to allocate scarce investment capital in forestry, since money invested in stands of low productivity could create a larger payoff by investment in measures enhancing timber growth on productive sites (Simonsen et al. 2010).
In Sweden the normal silvicultural practice is to perform one to three thinnings in Scots pine. The number of thinnings correlates positively to site index and typically only the poor sites of T20 or lower are thinned just once. This is in conflict with this study where a single thinning was found optimal in most cases. Also the option of no thinning was optimal for high discount rates and poor sites. Two or three thinnings were never optimal.
In this study, only planting and natural regeneration were analysed. Another relevant method is direct sowing, a fully automated process performed in connection with soil treatment. In many respects sowing resemble planting. The method has the advantage of being independent of seed trees and seed fall. Also, even though the seed consumption is far higher than for planting, the use of genetic improved seeds is possible. As with natural regeneration the seedling number can be increased at a low cost. One drawback compared to planting is the time-lag of around three years for the seeds to grow to the same seedling size as planted seedlings (Simonsen et al. 2010). The performance of sowing compared to natural regeneration and planting has been studied by Hyytiäinen et al. (2006). Here sowing outperformed natural regeneration at low (1%) discount rates and planting at medium and high (3% and 5%) discount rates. Moreover, sowing performed well compared to planting at all discount rates since and the low cost of regeneration for sowing compensated for the time-lag. Similar results were found in calculations done by Glöde et al. (2003). The method is still under development to reduce seed consumption etc. Thus, sowing could prove to be an attractive option in many cases.
The growth model assumes that the stands are fully homogeneous regarding density, age and species. In reality this is rarely the case, which should be kept in mind when viewing the results of this study. It would be interesting to develop the model further to use growth functions for single trees. This would make it possible to use a mix of tree species and a heterogeneous stand structure. Another interesting development would be to let the model decide when to harvest the old stand. This could be done by starting calculations with a state of the old stand at time of the lowest allowable harvest age.
The deterministic modelling approach in this study has the advantage of relatively programmable simplicity and strait forward conclusions. Obvious drawbacks are that the stochastic natures of many forest regeneration aspects are overlooked. Thus, the results may show that natural regeneration is preferred for the average outcome, but this average may very well include outcomes that are strongly in favour of planting – for instance if the cone maturation and seed fall for a particular year turns out really bad. This must be kept in mind when viewing the results of this study.
For northern Sweden especially the temperature limits the use of natural regeneration due to inferior seed production and seed maturation. Thus, sites where the temperature-sum (> +5 °C) of the growing season is lower than 800 day-degrees natural regeneration is not recommended and for sites with a temperature-sum in the range of 800 to 1000 day-degrees it is recommended to wait for a good seed year before the regeneration harvest is carried out (Karlsson and Örlander 2004). The lower seed production in cold areas is partly due to lower availability of nutrients and thus depends on the site productivity (Hagner 1965). The temperature-sum for the sites at latitude 64°N and 400 m.a.s.l. is lower than 800 day-degrees and the results from these sites should be viewed with caution.
The mortality of seedlings in this study is based on data for planted seedlings and depends only on the stand location (latitude and altitude) (Eriksson et al. 1980). Moreover, the mortality rate was assumed to be the same for both planted and naturally regenerated seedlings. In reality the mortality depends on many factors affecting the microclimate on the forest floor, such as topography, site index, soil humidity and texture, cover from seed trees ect. (Karlsson and Örlander 2004). Generally speaking, the mortality rate of planted seedlings tends to be higher than for naturally regenerated seedlings. The treatment of seedling mortality in this study may have favoured regeneration by planting.
Some of the functions used in the model are rather old (Hagner 1962; Eriksson et al. 1980) and this could pose a problem when the on-going climate changes are taken into consideration. Both functions use latitude and altitude for describing the local climate. Therefore, temperature changes that have taken place in the period since these studies were published are unaccounted for in the functions. According to Swedish Meteorological and Hydrological Institute the length of the average vegetation period in northern Sweden 1961–71 was 155 days versus 169 for the period 2002–11 (SMHI 2012). To what extend the validity of the functions is affected is a difficult question to answer. As to future climatic changes, it seems likely that warmer summer month will affect cone maturation in northern Sweden, resulting in more frequent good seed years. According to Hagner (1965) the seed production in good seed years can be as good on colder sites as on warmer but they occurs more seldom on colder sites. Another likely effect of a warmer climate is a lower rate of seedling mortality caused by frost damages but at the same time seedling damages from pathogens like insects and fungi is expected to increase (Eriksson 2007). Another expected effect is that the dry seasons will tend to become dryer and wet seasons wetter which will have consequences for seed germination and seedling survival. A warmer climate will prolong the growth period and affect the forest growth positively. This will affect the comparison between planting and natural regeneration similarly as the effect of a higher site index. That is, higher productivity results in a shift towards planting. Weighing all these effects against each other would be interesting but lies outside the scope of this paper.
It may be concluded that planting is preferred to natural regeneration only on the most productive sites. Also, planting competes better at low altitudes and low discount rates. These trends are particularly pronounced for the latitude of 64°N. However, these conclusions are valid only when the same genetic material is used for both planting and natural regeneration. When genetic enhanced planting material is available the calculations show that even low levels of improved growth shift the point of breakeven substantially to the advantage of planting. Seeds from the best Swedish seed orchards in northern Sweden can have genetic gains that exceed 15%. For genetic gains of this magnitude planting is preferred on all sites except the very poorest. Also, the North American Lodgepole pine (Pinus contorta L.) is capable of producing at least 35% more than the indigenous Scots pine. In the future the progress of tree breeding will have a large impact on which regeneration method to use, since stands of improved seedlings eventually can be used as seed source for natural regeneration.
Acknowledgements
Funding for this study was provided by Brattåsstiftelsen för skogsvetenskaplig forskning.
References
Ackzell L. (1994). Natural regeneration on planted clear-cuts in boreal Sweden. Scandinavian Journal of Forest Research 9: 245–250. doi:10.1080/02827589409382837.
Agestam E., Ekö P.M., Johansson U. (1998). Timber quality and volume growth in naturally regenerated and planted Scots pine stands in S. W. Sweden. Technical report. Fakulteten för skogsvetenskap, Institutionen för sydsvensk skogsvetenskap, Sveriges lantbruksuniversitet. Studia Forestalia Suecica. 204 p. ISBN 91-576-5555-3.
Bergstrand, K-G., Lindman J., Petré E. (1986). Underlag för prestationsmål för motormanuell röjning. [Instruments for use in setting productivity targets for motor-manual cleaning]. Forskningsstiftelsen Skogsarbeten, Redogörelse 7 (1986). 23 p. ISSN 1103-4580.
Brunberg T. (2007). Skogsbrukets kostnader och intäkter: 2006 – året mellan Gudrun och Per. Resultat från Skogforsk 9 (2007). 2 p. ISSN 1103-4173.
Cernold Å. (1981a). Utbytestabeller för rotstående skog – Norra Sverige. Centrala Sågverksföreningen Falun. 60 p.
Cernold Å. (1981b). Utbytestabeller för rotstående skog – Södra Sverige. Centrala Sågverksföreningen Falun. 81 p.
Elfving B. (2007). Ett prognosinstrument för analys av gallringsprogram. Swedish University of Agricultural Sciences, Department of Forest Ecology and Management. Unpublished. 3 p.
Elfving B. (2010). Natural mortality in thinning and fertilization experiments with pine and spruce in Sweden. Forest Ecology and Management 260: 353–360. doi:10.1016/j.foreco.2010.04.025.
Elfving B., Kiviste A. (1997). Construction of site index equations for Pinus sylvestris L. using permanent plot data in Sweden. Forest Ecology and Management 98: 125–134. doi:10.1016/S0378-1127(97)00077-7.
Eriksson H. (2007). Svenskt skogsbruk möter klimatförändringar. Rapport 8, 2007. Skogsstyrelsen. 49 p. ISSN 1100-0295.
Eriksson G., Andersson S., Eiche V., Ifver J., Persson A. (1980). Severity index and transfer effects on survival and volume production of Pinus sylvestris in northern Sweden. Studia Forestalia Suecica 156 1980. Department of Forest Genetics, Swedish University of Agricultural Sciences. 32 p. ISBN 91-38-05858-8.
Faustmann M. (1849). Calculation of the value of which forest land and immature stands possess for forestry. Republished with permission from Commonwealth Forestry Association in Journal of Forest Economics 1(1): 7–44. ISSN 1104-6899.
Frontline systems Inc. (2013). Basic solver – algorithms and methods used. http://www.solver.com/content/basic-solver-algorithms-and-methods-used. [Cited 22 Feb 2013] .
Fylstra D., Lasdon L., Watson J., Waren A. (1998). Design and use of the Microsoft Excel Solver. INTERFACES 28: 29–55. doi:10.1287/inte.28.5.29.
Glöde D., Hannerz M., Eriksson B. (2003). Ekonomisk jämförelse av olika föryngringsmetoder. Arbetsrapport 557 (2003). Skogforsk. 50 p. ISSN 1404-305X.
Gong P. (1995). Regeneration decision and land expectation value: numerical results of decision model evaluation and optimisation. Swedish University of Agricultural Sciences, Department of Forest Economics, Working Paper 219.
Gong P. (1998). Determining the optimal planting density and land expectation value a numerical evaluation of decision model. Forest Science 44(3): 356–364. ISSN 0015-749X.
Hagner S. (1962). Natural regeneration under shelterwood stands. An analysis of the method of regeneration, its potentialities and limitations in forest management in middle North Sweden. Academic dissertation. Skogshögskolan, Stockholm 1962. 263 p.
Hagner S. (1965). Om fröproduktion, fröträdsval och plantuppslag I försök med naturlig föryngring. Studia Forestalia Suecica 27. 43 p. ISSN 0039-3150.
Hyytiäinen K., Ilomäki S., Mäkelä A., Kinnunen K. (2006). Economic analysis of stand establishment for Scots pine. Canadian Journal of Forest Research 36(5): 1179–1189. doi:10.1139/x06-023.
Karlsson B. (2006). Trakthyggesbruk med gran och självföryngrad björk, en jämförande studie. Redogörelse från Skogforsk 4 (2006). 48 p. ISSN 1103-4580.
Karlsson C., Örlander G. (2004). Naturlig föryngring av tall. Rapport 4, 2004. Skogsstyrelsen. 88 p. ISSN 1100-0295.
Kraftsamling skog. (2009). Unpublished data material for the project: Beräkningsverktyget Kraftsamling Skog. http://www.skogforsk.se/sv/KunskapDirekt/KraftsamlingSkog/Kraftsamling-Skog/.
Lantz Skogsvård. (2009). http://www.skogsvard.se/rojning.asp. [Cited October 2009].
Lohmander P. (1994). The economically optimal number of plants, the damage probability and the stochastic roundwood market. In: Gonzalo L., Paredes V. (eds.). Proceedings of the International Symposium on System Analysis and Management Decisions in Forestry. p. 290–314.
Möller J.J. (2005). Automatisk kvalitetsklassning och stampris – framtidens affärsform. Resultat 22 (2005). Skogforsk. 4 p. ISSN 1103-4173.
Norra. (2009). Timber prices. http://www.norra.se/templates/Page.aspx?id=1073. [Cited 3 Aug 2009].
Oleskog G., Nilson K., Wikberg P.-E. (2008). Kontinuitetsskogar och Kontinuitetsskogsbruk – Slutrapport för delprojekt Skötsel – hyggesfritt skogsbruk. Rapport 22, 2008. Skogsstyrelsen. 78 p. ISSN 1100-0295.
Rosvall O., Simonsen R., Rytter L., Jacobson S., Elfving B. (2007). Tillväxthöjande skogsskötselåtgärder i privatskogsbruket – underlag för lönsamhetsberäkningar. Arbetsrapport från Skogforsk 640 2007. 60 p. ISSN 1404-305X.
Simonsen R., Rosvall O., Gong P., Wibe S. (2010). Profitability of measures to increase forest growth. forest policy and economics 12 (2010): 473–482. doi:10.1016/j.forpol.2010.03.002.
Skogsstyrelsen. (1985). Gallringsmallar. Skogsstyrelsen, Jönköping. 35 p.
Skogsstyrelsen. (2009). Skogsstyrelsens föreskrifter och allmänna råd till skogsvårdslagen (1979:429); Ändringar införda t.o.m. SKSFS 2008:8. http://www.svo.se/episerver4/dokument/sks/lagen/dokument/sksfs1993_2_konsoliderad.pdf. [Cited 29 Oct 2009].
SMHI. (2012). Swedish Meteorological and Hydrological Institute. Kunskapsbanken klimat vegetationsperiod. http://www.smhi.se/kunskapsbanken/klimat/vegetationsperiod-1.6270. [Cited 3 Aug 2009].
Sveriges Riksbank. (2013). Monthly average exchange rates. http://www.riksbank.se/en/Interest-and-exchange-rates/Monthly-aggregate-Exchange-rates/. [Cited 11 Feb 2013].
Swedish Forest Agency. (2009). Swedish Statistical Yearbook of Forestry (Skogsstatistisk årsbok). SDC; Swedish Forest Agency (Skogsstyrelsen), Analysis Department. http://www.svo.se/episerver4/templates/SFileListing.aspx?id=16863. [Cited 3 Aug 2009].
Thor M., Johansson A. (1999). Bokslut för svenskt skogsbruk 1998: Fortsatt sänkta kostnader, Resultat 20 (1999) Skogforsk, 4 p. ISSN 1103-4173.
Westerberg D., von Hofsten H. (1996). Markberedning under skärm. Resultat från skogforsk 8 (1996). 4 p. ISSN 1103-4173.
Zhou W. (1998). Optimal natural regeneration of Scots pine with seed trees. Journal of Environmental Management (1998) 53: 263–271. doi:10.1006/jema.1998.0210.
Zhou W. (1999a). Risk-based selection of forest regeneration methods. Forest Ecology and Management 115 (1999): 85–92. doi:10.1016/S0378-1127(98)00438-1.
Zhou W. (1999b). Justifying the high planting density for Scots pine in Swedish forestry. In: Optimal method and optimal intensity in reforestation, III. Doctoral thesis. Silvestria 110 (1999). 13 p. ISBN 91-576-5644-4.
Total of 40 references
