Eino Levkoev  ,
Lauri Mehtätalo,
Katri Luostarinen,
Pertti Pulkkinen,
Anatoly Zhigunov,
Heli Peltola
,
Lauri Mehtätalo,
Katri Luostarinen,
Pertti Pulkkinen,
Anatoly Zhigunov,
Heli Peltola
Development of height growth and frost hardiness for one-year-old Norway spruce seedlings in greenhouse conditions in response to elevated temperature and atmospheric CO2 concentration
Levkoev E., Mehtätalo L., Luostarinen K., Pulkkinen P., Zhigunov A., Peltola H. (2018). Development of height growth and frost hardiness for one-year-old Norway spruce seedlings in greenhouse conditions in response to elevated temperature and atmospheric CO2 concentration. Silva Fennica vol. 52 no. 3 article id 9980. https://doi.org/10.14214/sf.9980
Highlights
- Elevated temperature resulted in increased height growth, delayed onset and shortened duration of autumn frost hardiness development in Norway spruce seedlings
- Elevated temperature increased variation between genotypes in height growth and frost hardiness development
- Elevated atmospheric CO2 concentration had no effect on the development of height or autumn frost hardiness in Norway spruce seedlings.
Abstract
The mean temperature during the potential growing season (April–September) may increase by 1 °C by 2030, and by 4 °C, or even more, by 2100, accompanied by an increase in atmospheric CO2 concentrations of 536–807 ppm, compared to the current climate of 1981–2010, in which atmospheric CO2 is at about 350 ppm. This may affect both the growth and frost hardiness of boreal trees. In this work, we studied the responses of height and autumn frost hardiness development in 22 half-sib genotypes of one-year-old Norway spruce (Picea abies (L.) Karst.) seedlings to elevated temperatures and atmospheric CO2 concentration under greenhouse conditions. The three climate treatments used were: T+1 °C above ambient and ambient CO2; T+4 °C above ambient and ambient CO2; and T+4 °C above ambient and elevated CO2 (700 ppm). The height growth rate and final height were both higher under T+4 °C compared to T+1 °C. Temperature increase also delayed the onset, and shortened the duration, of autumn frost hardiness development. Elevated CO2 did not affect the development of height or frost hardiness, when compared to the results without CO2 elevation under the same temperature treatment. Higher temperatures resulted in greater variation in height and frost hardiness development among genotypes. Three genotypes with different genetic backgrounds showed superior height growth, regardless of climate treatment; however, none showed a superior development of autumn frost hardiness. In future studies, clonal or full-sib genetic material should be used to study the details of autumn frost hardiness development among different genotypes.
Keywords
climate change;
Picea abies;
needles;
tree growth;
seedlings;
cold acclimation
-
Levkoev,
University of Eastern Finland, Faculty of Science and Forestry, School of Forest Sciences, P.O. Box 111, FI-80101 Joensuu, Finland
E-mail
eino.levkoev@uef.fi
- Mehtätalo, University of Eastern Finland, Faculty of Science and Forestry, School of Computing, P.O. Box 111, FI-80101 Joensuu, Finland E-mail lauri.mehtatalo@uef.fi
- Luostarinen, University of Eastern Finland, Faculty of Science and Forestry, School of Forest Sciences, P.O. Box 111, FI-80101 Joensuu, Finland E-mail katri.luostarinen@uef.fi
- Pulkkinen, Natural Resources Institute Finland (Luke), Production systems, Haapastensyrjä Breeding Station, FI-16200 Läyliäinen, Finland E-mail pertti.pulkkinen@luke.fi
- Zhigunov, Saint-Petersburg State Forest Technical University, Forestry Faculty, RU-194021, Institutskiy per. 5, Saint-Petersburg, Russia E-mail a.zhigunov@bk.ru
- Peltola, University of Eastern Finland, Faculty of Science and Forestry, School of Forest Sciences, P.O. Box 111, FI-80101 Joensuu, Finland E-mail heli.peltola@uef.fi
Received 22 March 2018 Accepted 6 August 2018 Published 7 August 2018
Views 103553
Available at https://doi.org/10.14214/sf.9980 | Download PDF

Supplementary Files
1 Introduction
Projected atmospheric warming during the growing season may affect the development of height growth and autumn frost hardiness in young seedlings of boreal conifers. On one hand, warming may increase the growth of boreal conifer seedlings (Brix 1972). On the other hand, warming may negatively affect the development of autumn cold hardiness (Chang et al. 2016). This is because the development of autumn cold hardiness is triggered by decreasing temperature and photoperiod length (Beck et al. 2004; Chang et al. 2016), and warming may cause asynchrony in these environmental triggers (Chang et al. 2016). In addition, genotype transfers, used in practical forestry in the boreal zone, may negatively affect autumn cold hardening, as they are commonly transferred northward and northwestward, and have longer growing periods compared to the local genotypes (Skrøppa and Magnussen 1993). Failure to develop sufficient cold hardiness in autumn may result in frost damage, leading to a decreased vitality in the seedlings, an increased risk of wood-related defects, and mortality (Langvall 2000). This may also result in long-term economic losses for forestry. Therefore, a better understanding is needed concerning how genotype affects the development of autumn cold hardiness under climate change conditions.
In Finland, Norway spruce (Picea abies (L.) Karst.) is important to the forestry industry and accounts for 30% of the current volume of growing stock (Peltola 2014). Based on many previous studies, growth and the development of autumn cold hardiness in Norway spruce seedlings are affected by photoperiod length and the prevailing temperature during the growing season (Aronsson 1975; Christersson 1978; Skrøppa 1991; Dalen et al. 2001; Rostad et al. 2006). They are also affected by geographical origin and genotype (Johnsen and Apeland 1988; Skrøppa 1991; Hannerz and Westin 2000, 2005). In addition, temperature conditions during flowering (Johnsen et al. 1996), seed maturation of parent trees (Skrøppa et al. 2007), and the availability of growing resources, such as nutrients (Luoranen et al. 2008), all affect the development of autumn cold hardiness in Norway spruce seedlings.
Relatively little is still known about the onset and dynamics of development of autumn cold hardiness, in different genotypes of young Norway spruce seedlings under elevated temperature and atmospheric CO2 concentration. According to Ruosteenoja et al. (2016), the mean temperature during the potential growing season (April–September) may increase by 1 °C by 2030, and by 4 °C, or even more, by 2100, accompanied by an increase in atmospheric CO2 concentrations of 536–807 ppm, compared to the current climate of 1981–2010, in which atmospheric CO2 is at about 350 ppm.
In this work, we studied the responses of height growth and autumn frost hardiness development in 22 half-sib genotypes of one-year-old Norway spruce seedlings to elevated temperature and atmospheric CO2 concentration under greenhouse conditions. The following climate treatments were used: T+1.0–1.5 °C above ambient and ambient CO2-baseline climate treatment; T+4.0–4.5 °C above ambient and ambient CO2; and T+4.0–4.5 °C above ambient and elevated CO2 (700 ppm). We hypothesized that the climatic treatment and genotype would together affect the height growth and autumn frost hardiness development in young Norway spruce seedlings. We also hypothesized that some genotypes due to their half-sib origin and hybrid background of mother parent-trees would show both superior height growth and earlier autumn frost hardiness compared to others.
2 Materials and methods
2.1 Experimental design and seed material
Seed material was collected from a Norway spruce clonal trial, from trees that were harvested in winter 2015. The trial was established in 1974 in Imatra, southeastern Finland (61°08´N, 28°48´E, 60 m a.s.l.; 1300 growing degree days). Seeds of half-sib origin were collected from openly pollinated mother trees, representing 22 different genotypes, including five southern Finnish (F) and two southwestern Russian (R) clones, two Finnish–Swiss (F × S), eight Finnish–German (F × G), two Finnish–Latvian (F × L), and three Finnish–Estonian (F × E) provenance hybrid clones (Table 1).
| Table 1. Origins of clones and provenance hybrid clones (Gtype) used as seed donors. | |||||||
| Gtype | Geographical origin | Geographical location and elevation: parent 1 | Geographical location and elevation: parent 2 | ||||
| Latitude (N) | Longitude (E) | Elevation (m a.s.l.) | Latitude (N) | Longitude (E) | Elevation (m a.s.l.) | ||
| Finland × Switzerland (F × S) | |||||||
| V455 | 3/E1845 Muonio × E1771 Wintschgau | 67°58´ | 23°40´ | 150–250 | 46°30´ | 10°25´ | < 800 |
| V456 | 4/E1845 Muonio × E1771 Wintschgau | 67°58´ | 23°40´ | 150–250 | 46°30´ | 10°25´ | < 800 |
| Finland × Germany 1 (F × G1) | |||||||
| V447 | 6/E1832 Rovaniemi × E1770 Spiegelau | 66°29´ | 25°40´ | 250 | 48°57´ | 13°25´ | 700–800 |
| V448 | 8/E1832 Rovaniemi × E1770 Spiegelau | 66°29´ | 25°40´ | 250 | 48°57´ | 13°25´ | 700–800 |
| V449 | 10/E1832 Rovaniemi × E1770 Spiegelau | 66°29´ | 25°40´ | 250 | 48°57´ | 13°25´ | 700–800 |
| Finland × Germany 2 (F × G2) | |||||||
| V49 | E5520 Loppi × E1893 Carlsfeld | 60°37´ | 24°26´ | 120 | 50°24´ | 12°35´ | 900 |
| V302 | H3270 Loppi × E1766 Carlsfeld | 60°37´ | 24°26´ | 120 | 50°24´ | 12°35´ | 900 |
| Finland × Germany 3 (F × G3) | |||||||
| V381 | K1413 Pieksänmaa × E1890/2 Schielbach | 62°23´ | 27°04´ | 160 | 50°24´ | 12°18´ | 400–600 |
| V382 | K1413 Pieksänmaa × E1890/6 Schielbach | 62°23´ | 27°04´ | 160 | 50°24´ | 12°18´ | 400–600 |
| V383 | K1411 Pieksänmaa × E1890/8 Schielbach | 62°23´ | 27°04´ | 160 | 50°24´ | 12°18´ | 400–600 |
| Finland × Latvia (F × L) | |||||||
| V469 | E2672 Loppi × E943/2 Goldingen | 60°44´ | 24°30´ | 120 | 57°38´ | 22°00´ | < 100 |
| V470 | E2672 Loppi × E943/3 Goldingen | 60°44´ | 24°30´ | 120 | 57°38´ | 22°00´ | < 100 |
| Russia (R) | |||||||
| V325 | 513/2 Pskov Oblast | – | – | – | 57°48´ | 28°26´ | 100–200 |
| V327 | 513/8 Pskov Oblast | – | – | – | 57°48´ | 28°26´ | 100–200 |
| Finland × Estonia (F × E) | |||||||
| V386 | K1420 Pieksänmaa × E949/1 Perawald | 62°22´ | 27°04´ | 160 | 58°00´ | 27°30´ | < 100 |
| V388 | K1420 Pieksänmaa × E949/4 Perawald | 62°22´ | 27°04´ | 160 | 58°00´ | 27°30´ | < 100 |
| V389 | K1420 Pieksänmaa × E949/5 Perawald | 62°22´ | 27°04´ | 160 | 58°00´ | 27°30´ | < 100 |
| Finland (F) | |||||||
| V47 | Tree157, +8 Pornainen | 60°29´ | 25°30´ | 30 | – | – | – |
| V332 | E2937/4 Pöytyä | 60°43´ | 22°51´ | 90 | – | – | – |
| V43 | Tree300, +44 Miehikkälä | 60°47´ | 27°30´ | 60 | – | – | – |
| V48 | Tree92, +44 Miehikkälä | 60°47´ | 27°30´ | 60 | – | – | – |
| V465 | E3821/1 Ruokolahti | 61°19´ | 28°55´ | 100 | – | – | – |
The greenhouse experiment was conducted at the Haapastensyrjä research station of the Natural Resources Institute Finland (Luke) in southwest Finland (60°37´N, 24°25´E) in 2015. To investigate the effects of potential future climatic conditions on height growth and frost hardiness development in the 22 half-sib genotypes of one-year-old Norway spruce seedlings, we subjected them to three different climate treatments in separate greenhouse rooms (Fig. 1), similar to the methodology of Zeps et al. (2017). In each greenhouse room (11.5 m × 7.3 m), temperature and CO2 concentration could be adjusted independently from the other greenhouse rooms. During the study period, the mean monthly temperature (i.e., the ambient outdoor temperature) ranged from +16.0 °C in July, to 4.0 °C in October. The mean temperature during the study period was +10.5 °C. The frost-free period in 2015 lasted from May 16 (calendar day – CD – 136) to October 5 (CD 278).
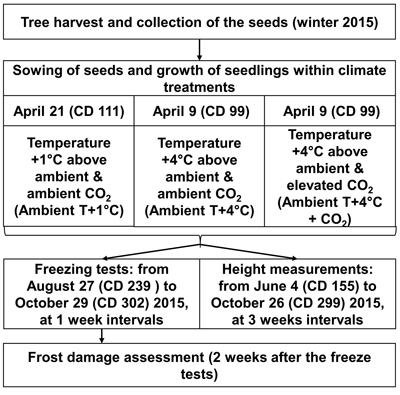
Fig. 1. Outline of experimental layout. CD – calendar day.
For the 2030 temperature scenario (Ambient T+1 °C), the temperature was maintained in real-time in the first greenhouse room at 1.0–1.5 °C above the ambient outdoor temperature. For the 2100 temperature scenario (Ambient T+4 °C), the temperature was maintained in real-time in the second greenhouse room at 4.0–4.5 °C above the ambient outdoor temperature. Elevation of the atmospheric carbon dioxide was considered only for the 2100 temperature scenario (Ambient T+4 °C + CO2), where, in the third greenhouse room, in addition to the temperature elevation, the CO2 concentration was elevated to 700 ppm, starting from May 18 (CD 138). The elevated CO2 level was kept higher in the daytime, but was allowed to decrease at night to a threshold of 650 ppm. The temperature was not allowed to fall below 0°C in any of the greenhouse rooms during the experiment. Seedlings under all climate treatments were grown in ambient light. The temperature and CO2 concentration projections for future climate were based on CMIP3 – Coupled Model Intercomparison Project Phase 3 (Special Report on Emissions Scenarios, SRESA1B; Jylhä et al. 2009), which correspond quite well with the most recent climate change projections of CMIP5 (e.g., Representative Concentration Pathway, RCP4.5; Ruosteenoja et al. 2016).
To simulate the prolonged growing season expected under elevated temperature, according to Ruosteenoja et al. (2011), sowing for Ambient T+1 °C was done on April 21 (CD 111), and for Ambient T+4 °C and Ambient T+4 °C + CO2 on April 9 (CD 99). The seeds were sown in Lännen B15 boxes with 96 containers (12 containers per row × 8 containers per column), filled with pre-fertilized peat (NPK 16–4–17). Seeds representing a certain genotype were planted in one column in the box, with a random assignment of the box column to the genotype. The boxes were placed on rolling tables in random order, 30 boxes per rolling table. The general level of seed germination was 69%. Therefore, two seeds per container were sown. One randomly chosen seedling was removed in cases where both seeds germinated in the container. Because of limited seed availability, replications of the climate treatments could not be performed.
In order to minimise any effects of heterogeneity in the growing conditions on the results of the experiment, the rolling tables were rotated about themselves by 180 degrees, four times per day. In addition, the positions of the rolling tables in each growing room were swapped once a week. Irrigation was applied to the seedlings around twice a week, regardless of climate treatment. The seedlings were evenly irrigated in each box. The minimal weight of each box with seedlings was 8 kg before irrigation, while the maximal weight was 10 kg after irrigation.
2.2 Height and frost hardiness assessment
Height (mm) was measured in 20–24 seedlings per genotype, for each climate treatment, in a period from June 4 (CD 155) to October 26 (CD 299) in 2015, once every three weeks. Artificial freeze tests were used to study the development of autumn frost hardiness. In total, 10 freeze tests were performed. They started on August 27 (CD 239) and continued until October 29 (CD 302), at seven-day intervals. Initially, it was planned that 5280 seedlings would be subjected to freeze testing (8 seedlings × 10 freeze test days × 22 genotypes × 3 climate treatments = 5280 seedlings); however, due to mortality, only 5034 seedlings (95%) were exposed to freeze testing.
For the freeze tests, the boxes with seedlings were moved from the growing rooms to a 19 m × 21 m freezing room. The freezing room was equipped with four heat exchangers, located in the corners. The treatments were arranged so that eight seedlings per genotype per climate treatment were tested on the same day. The freezing treatment consisted of a gradual decrease in temperature, by 3 °C h–1, until –10 °C was reached. The seedlings were kept at –10 °C for 2 h before the temperature was gradually raised (by 1 °C h–1) to the ambient temperature. The boxes with seedlings were placed on a thermo-isolated surface. Peat-filled boxes with no seedings were placed around the experimental material to limit cold air overflow around the edges, and for root system protection.
After the freezing treatment, the boxes with seedlings were returned to their respective greenhouse rooms. One person visually scored injuries to the needles, two weeks after the freeze test (Andersson 1992). Injury-scoring was based on the rate of chlorophyll breakdown, which resulted in browning of the needles. We applied an 11-point classification of the damage, which included classes from 0% (all needles intact) to 100% (all needles injured) damage, with 10% intervals.
2.3 Data analyses
The effects of the climate treatments on the mean height growth of the seedlings for each genotype was determined using a nonlinear mixed-effect model, based on the Hossfeld IV function (Zeide 1993; Mehtätalo et al. 2015):
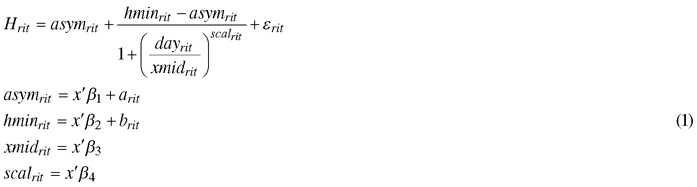
, where Hrit is the mean height of seedlings during the dayrit for a certain genotype i under climate treatment r; asymrit is the final height; hminrit is the height at the start of height measurement; xmidrit is the day that half the height was reached (asymrit – hminrit); scalrit is the scaling variable that controls the width of the curve; fixed part x’β includes the climatic treatment effect; arit and brit are random effects of asymrit and hminrit , respectively, that include the genotype effect; and εrit is the error term, with a normally distributed residual variance and zero mean. Random effects are assumed to be independent, with common bivariate normal distributions. Hypothesis tests of the fixed effects were based on the approximate conditional t-test (Pinheiro and Bates 2000).
The effects of within-genotype variations on height growth were considered in further analyses, using a nonlinear mixed-effect model. This was fitted separately for each climate treatment data subset because fitting to the complete dataset was not successful.
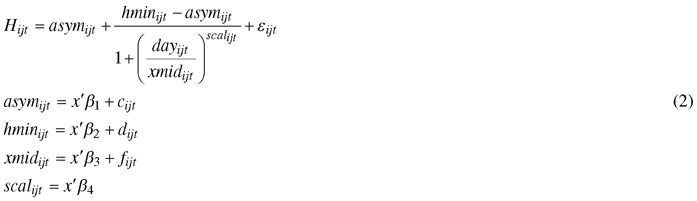
, where j stands for seedling within genotype i; fixed part x’β includes the genotype effect; cijt, dijt, and fijt are random effects of asymijt, hminijt, and xmidijt, respectively, that include the seedling level within the level of the box. The nonlinear models were fitted using the nlme package (Pinheiro et al. 2017) for R (R Core Team 2017).
A binary logistic mixed-effect model (GLMM) was used to study the effects of climate treatment and genotype on the development of autumn frost hardiness:
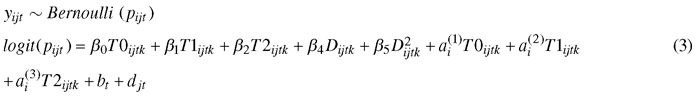
, where yijtk is the number of needles damaged by frost, pijt is the probability of needle damage; β0T0ijtk, β1T1ijtk, and β2T2ijtk are fixed effects for the climate treatment, β3Dijtk and β4D2ijtk are fixed effects of the freeze test day. The second order of the freeze test day term was needed to provide a satisfactory fit to the data. The random part includes the by-climate-treatment effects for genotype ai, and the effect of the box bt nested by the freeze day effect djt. For analysis, we converted percent damaged needles to number of damaged needles.
For the conversion, we assumed that each seedling had the same number of needles (estimated based on eight measured seedlings, representing different heights and genotypes). For example, 10% needle damage for a seedling was converted to number of damaged needles by 0.1 × mean number of needles per seedling. We also removed calendar days 295 and 302 from the analysis because of an absence of frost damage variation. We applied the lme4 package (Bates et al. 2015) for fitting GLMM in R. Hypothesis tests of the fixed effects were based on the Wald t-test, with the Satterthwaite approximation for decrease of freedom, as implemented in the lmerTest package (Kuznetsova et al. 2016).
Based on Eq. 3, we estimated the days with 99%, 50%, and 1% of damaged needles in seedlings for each genotype and climate treatment. The duration of frost hardiness development was calculated for each climate treatment as being the difference between the days with 99% and 1% damaged needles, as averaged over all genotypes within each the climate treatment. We applied the ggplot2 package for R (Wickham 2009) for data visualization.
3 Results
3.1 Effects of climate treatment and genotype on height development
The values for the final mean height (asym) for Ambient T+1 °C (119 mm) differ from those of Ambient T+4 °C (146 mm) and Ambient T+4 °C + CO2 (144 mm) (Fig. 2, Table 3). The day (xmid) half the mean final height was reached (asym–hmin) is earliest under Ambient T+4 °C + CO2 (CD 196), followed by Ambient +4 °C (CD 199), and Ambient +1 °C (CD 203) (Table 3). For asym and xmid, the climate treatments, except for Ambient T+4 °C and Ambient T+4 °C + CO2, differed from each other significantly (p < 0.05) (Table 2).
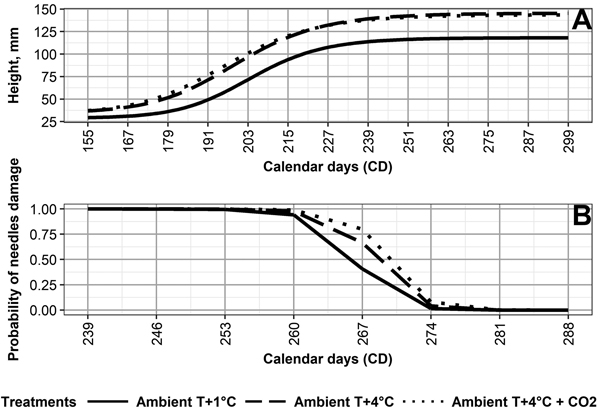
Fig. 2. (A) Height development of Norway spruce seedlings, and (B) probability of autumn frost damage in needles of Norway spruce seedlings, as averaged by the following climate treatments: 1 °C above ambient and ambient CO2 (Ambient T+1 °C), 4° C above ambient and ambient CO2 (Ambient T+4 °C), and 4 °C above ambient and elevated CO2 (Ambient T+4 °C + CO2).
| Table 2. Parameter estimates and standard errors (SE) for final mean height (asym), mean height at height measurement start (hmin), day (xmid) half mean height was reached (asym–hmin), and scaling variable (scal) and random effects for final mean height (asym) and mean height at height measurement start (hmin) of height development model (Eq. 1). | ||||||||||
| Para- meter | Treatment | Fixed part | Random part | |||||||
| Variance | Correlations | |||||||||
| Estimate | SE | asym Ambient T+1 °C | asym Ambient T+4 °C | asym Ambient T+4 °C + CO2 | hmin Ambient T+1 °C | hmin Ambient T+4 °C | hmin Ambient T+4 °C + CO2 | |||
| asym | Ambient T+1 °C | 118a | 2.22 | 10.202 | 1 | 0.671 | 0.808 | 0.722 | 0.488 | 0.719 |
| Ambient T+4 °C | 147b | 3.01 | 17.602 | 1 | 0.841 | 0.396 | 0.898 | 0.822 | ||
| Ambient T+4 °C + CO2 | 144b | 3.87 | 19.902 | 1 | 0.455 | 0.708 | 0.921 | |||
| hmin | Ambient T+1 °C | 29a | 1.65 | 1.402 | 1 | 0.5 | 0.639 | |||
| Ambient T+4 °C | 35b | 1.96 | 2.402 | 1 | 0.854 | |||||
| Ambient T+4 °C + CO2 | 37b | 1.91 | 2.902 | 1 | ||||||
| xmid | Ambient T+1 °C | 204a | 1.1 | – | ||||||
| Ambient T+4 °C | 201b | 1.1 | – | |||||||
| Ambient T+4 °C + CO2 | 201b | 1.1 | – | |||||||
| scal | Ambient T+1 °C | 17.60a | 1.443 | – | ||||||
| Ambient T+4 °C | 14.66b | 1.292 | – | |||||||
| Ambient T+4 °C + CO2 | 15.55b | 1.314 | – | |||||||
| ɛrjt | – | – | – | 10.302 | ||||||
| Different letters following estimated values indicate differences among climate treatments (p<0.05). Ambient T+1 °C – 1 °C above ambient and ambient CO2, Ambient T+4 °C – 4 °C above ambient and ambient CO2, Ambient T+4 °C + CO2 – 4 °C above ambient and elevated CO2. | ||||||||||
| Table 3. Parameter estimates for final mean height (asym), mean height at height measurement start (hmin), day (xmid) half mean height was reached (asym–hmin), scaling variable (scal), and genotypes (Gtype) of by-climate-treatment height development model (Eq. 2). | |||||||||||||
| Gtype | Origin | Ambient T+1 °C | Ambient T+4 °C | Ambient T+4 °C + CO2 | |||||||||
| asym | hmin | xmid | scal | asym | hmin | xmid | scal | asym | hmin | xmid | scal | ||
| V455 | F × S | 111 | 31 | 202 | 18.38 | 159 | 38 | 199 | 14.98 | 142 | 35 | 195 | 14.20 |
| V456 | F × S | 107 | 31 | 205 | 18.86 | 147 | 32 | 197 | 14.94 | 145 | 33 | 197 | 14.28 |
| V447 | F × G1 | 134 | 28 | 202 | 16.39 | 170 | 37 | 199 | 14.86 | 178 | 35 | 197 | 13.46 |
| V448 | F × G1 | 119 | 29 | 203 | 16.61 | 141 | 37 | 198 | 15.82 | 130 | 35 | 197 | 15.00 |
| V449 | F × G1 | 117 | 27 | 201 | 17.43 | 146 | 36 | 199 | 15.32 | 139 | 34 | 194 | 14.03 |
| V49 | F × G2 | 128 | 27 | 205 | 16.97 | 178 | 37 | 200 | 14.50 | 159 | 33 | 196 | 13.34 |
| V302 | F × G2 | 136 | 30 | 203 | 17.92 | 175 | 35 | 197 | 14.17 | 184 | 37 | 197 | 13.63 |
| V381 | F × G3 | 123 | 30 | 203 | 19.27 | 131 | 35 | 196 | 15.98 | 127 | 32 | 199 | 14.18 |
| V382 | F × G3 | 122 | 33 | 203 | 17.98 | 154 | 39 | 197 | 14.70 | 130 | 38 | 196 | 14.00 |
| V383 | F × G3 | 132 | 32 | 204 | 18.54 | 124 | 34 | 203 | 17.47 | 128 | 34 | 200 | 14.66 |
| V469 | F × L | 121 | 27 | 205 | 16.40 | 136 | 33 | 202 | 14.39 | 132 | 32 | 197 | 14.31 |
| V470 | F × L | 102 | 25 | 206 | 18.02 | 127 | 28 | 201 | 15.78 | 105 | 27 | 199 | 16.00 |
| V325 | R | 102 | 28 | 204 | 17.18 | 127 | 35 | 202 | 15.99 | 117 | 34 | 195 | 15.86 |
| V327 | R | 110 | 24 | 201 | 18.55 | 134 | 31 | 198 | 15.02 | 134 | 32 | 194 | 16.16 |
| V386 | F × E | 133 | 31 | 203 | 18.42 | 161 | 36 | 199 | 14.71 | 174 | 38 | 197 | 13.85 |
| V388 | F × E | 112 | 28 | 201 | 18.38 | 150 | 36 | 198 | 14.39 | 151 | 35 | 196 | 14.63 |
| V389 | F × E | 119 | 29 | 205 | 17.91 | 142 | 34 | 200 | 14.66 | 155 | 37 | 200 | 14.85 |
| V47 | F | 124 | 27 | 204 | 18.17 | 155 | 33 | 202 | 15.37 | 170 | 31 | 196 | 13.32 |
| V332 | F | 101 | 30 | 204 | 18.87 | 111 | 34 | 196 | 16.59 | 120 | 34 | 194 | 14.71 |
| V43 | F | 128 | 29 | 203 | 16.02 | 140 | 37 | 205 | 16.46 | 138 | 34 | 198 | 14.22 |
| V48 | F | 112 | 30 | 201 | 18.97 | 148 | 39 | 198 | 16.04 | 144 | 39 | 195 | 14.94 |
| V465 | F | 124 | 28 | 205 | 17.07 | 159 | 37 | 200 | 14.54 | 162 | 36 | 195 | 14.12 |
| All genotypes | 119 | 29 | 203 | 17.83 | 146 | 35 | 199 | 15.30 | 144 | 34 | 196 | 14.44 | |
| Mother tree origins are Finland × Switzerland (F × S), Finland × Germany (F × G), Finland × Latvia (F × L), Finland × Estonia (F × E), Russia (R), and Finland (F). Numbers 1, 2, and 3 for F × G mark different crosses for mother trees. Ambient T+1 °C – 1 °C above ambient and ambient CO2, Ambient T+4 °C – 4 °C above ambient and ambient CO2, Ambient T+4 °C + CO2 – 4 °C above ambient and elevated CO2. | |||||||||||||
Variations in final height among the genotypes (Table 2, Fig. 3) was the highest under Ambient T+4 °C + CO2, followed by Ambient T+4 °C, then Ambient T+1 °C. Relatively high correlations between final height and climate treatment (Table 2) also indicate that, in general, the performance of the genotypes is quite similar, regardless of climate treatment. For example, V302, V386, and V447 were consistently among the tallest genotypes, regardless of climate treatment (Fig. 3).
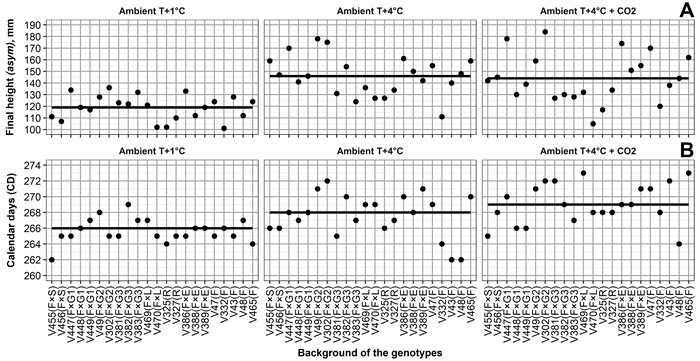
Fig. 3. (A) Final heights for Norway spruce genotypes, and by-climate-treatment mean final heights (solid line). (B) Calendar days of 50% frost damage probability in seedling needles for Norway spruce genotypes, and by-climate-treatment mean calendar days of 50% frost damage probability (solid line). Mother tree origins are Finland × Switzerland (F × S), Finland × Germany (F × G), Finland × Latvia (F × L), Finland × Estonia (F × E), Russia (R), and Finland (F). Numbers 1, 2 and 3 for F × G mark different crosses for mother trees. Climate treatments are Ambient T+1 °C – 1 °C above ambient and ambient CO2, Ambient T+4 °C – 4 °C above ambient and ambient CO2, Ambient T+4 °C + CO2 – 4 °C above ambient and elevated CO2. View larger in new window/tab.
3.2 Effects of climate treatment and genotype on frost hardiness development
Climate treatment significantly (p < 0.05) affected the probability of frost damage (Table 4). Seedlings grown under Ambient T+1 °C developed frost hardiness the earliest, followed by Ambient T+4 °C, and then Ambient T+4 °C + CO2 (Fig. 2, Table 4). This was opposite to the duration of frost hardiness development, being 32 days under Ambient T+1 °C, 28 days under Ambient T+4 °C, and 27 days under Ambient T+4 °C + CO2 (Supplementary file S2). Frost damage probability differed significantly (p < 0.05) between climate treatments, except for Ambient T+4 °C and Ambient T+4 °C + CO2 (Table 4).
| Table 4. Parameter estimates, standard errors (SE), and random effects of the frost hardiness development model (Eq. 3). View in new window/tab. |
Variation in frost hardiness development between genotypes (Table 4, Fig. 3) was the highest under Ambient T+4 °C and Ambient T+4 °C + CO2, followed by Ambient T+1 °C; however, variation in the probability of frost damage between the boxes with seedlings was higher than the variation caused by any climate treatment. Correlations between the climate treatments ranged from –0.02 between Ambient T+1 °C and Ambient T+4 °C + CO2 to 0.38 between Ambient T+4 °C and Ambient T+4 °C + CO2 (Table 4). This shows that, in terms of frost hardiness development, the genotypes perform quite differently among the climate treatments. For example, V43 showed the highest frost tolerance among the genotypes under Ambient T+4 °C (based on days of 50% frost damage probability estimates), average frost tolerance under Ambient T+1 °C, and the lowest frost tolerance under Ambient T+4 °C + CO2 (Fig. 3).
4 Discussion
4.1 Effects of climate treatment on height development
We hypothesized that changing environmental conditions, such as elevated temperature and atmospheric CO2 concentration, together with genotype, affected the development of height growth and autumn frost hardiness in one-year-old seedlings of Norway spruce. We also hypothesized that some genotypes had both superior height growth and earlier autumn frost hardiness compared to others. In line with our first hypothesis, a higher growth rate (xmid) and mean final height (asym) was observed for seedlings of different genotypes, under Ambient T+4 °C and Ambient T+4 °C + CO2, compared to Ambient T+1 °C (Table 3). A similar kind of response in height growth to elevated temperature was observed in one-year-old Sitka spruce (Picea sitchensis (Bong.) Carrière) and white spruce (Picea glauca (Moench) Voss) by Brix (1972), for example. On the other hand, in our study, differences in the sowing time between climate treatments might have affected the length of growing period under different climate treatments, and so the final height of the seedlings. The free height growth pattern of the one-year-old seedlings may have also contributed to differences observed in the height growth. Contrary to our first hypothesis, we found no significant effect (p > 0.05) of elevated atmospheric CO2 concentration either on height growth rate or final height of the seedlings, regardless of genotype (Table 2).
4.2 Effects of climate treatment on frost hardiness development
Our results show that the development of autumn frost hardiness was delayed by 5–7 days in seedlings of different genotypes under Ambient T+4 °C and Ambient T+4 °C + CO2, compared to Ambient T+1 °C (Suppl. file S2). This is in line with earlier findings, e.g., by Chang et al. (2016), who found impairment in autumn frost hardening in the three-year-old seedlings of the eastern white pine (Pinus strobus L.) that were grown under an elevated temperature. In our study, the cessation of autumn frost hardiness development was observed by October 7 (CD 280), regardless of climate treatment. As a result, the duration of frost hardiness development was shorter under Ambient T+4 °C and Ambient T+4 °C + CO2, compared to Ambient T+1 °C. Thus, elevated temperature shortened the period of frost hardiness development, regardless of the applied CO2 concentration. On the other hand, the temperature may have simultaneously prolonged free shoot growth in the seedlings and, thus, indirectly affected the development of autumn frost hardness. In previous studies, a strong relationship has been observed between autumn frost hardiness development and bud-set (i.e. growth cessation) in Norway spruce seedlings from an identified seed source (provenance genetic level) (Johnsen and Apeland 1988). On the other hand, a weaker or nonexistent relationship has been observed in Norway spruce seedlings of half-sib and full-sib families (Johnsen and Apeland 1988; Skrøppa 1991).
We found no significant (p > 0.05) effect of elevated atmospheric CO2 concentration on frost hardiness development of Norway spruce seedlings of different genotypes when comparing the performance of seedlings under Ambient T+4 °C and Ambient T+4 °C + CO2. In a previous study by Dalen et al. (2001), elevated CO2 concentration was found not to affect frost hardiness development in one-year-old seedlings of Norway spruce, and nor was it found to affect the onset of bud dormancy in young seedlings of Sitka spruce in another study (Murray et al. 1994). On the other hand, Bigras and Bertrand (2006) reported an enhancement of frost hardiness in one-year-old seedlings of black spruce (Picea mariana (Mill.) Britton, Sterns & Poggenb.) under an elevated CO2 concentration. Contradictorily, Chang et al. (2016) found that an elevated atmospheric CO2 concentration delayed the development of autumn frost hardiness in eastern white pine seedlings. In such previous studies, however, different experimental setups and methodologies of frost hardiness assessment were applied, which makes it difficult to compare the results between the different studies.
4.3 Effects of genotype on height and frost hardiness development
The elevation of temperature increased variability in the development of height growth and frost hardiness among and within genotypes. This result is in line with the previous findings of Andalo et al. (2005) in white spruce genotypes. The half-sib genotypes V302, V386, and V447 were consistently among the tallest in our study, regardless of climate treatment; however, the greater height growth of these genotypes could not be explained by geographical origin of the mother trees (data not presented).
In this study, a rather low consistency in the development of autumn frost hardiness was found across the climate treatments among the half-sib genotypes. This could imply that relatively high genetic variation exists in the genotypes. In addition, relatively high variability between the boxes with seedlings was observed (Table 4, Suppl. file S1); however, it was not possible to separate the effects of genetic factors and environmental conditions on frost hardiness development within the genotypes because of their half-sib origins. Based on our study, the selection of genotypes with early frost hardiness for projected future climate requires cloned or full-sib seedling material to reduce uncontrolled genetic variation within the genotypes, and to separate the genetic and environmental components of the variation.
Similarly to height growth, the development of autumn frost hardiness of the tested half-sib genotypes could not be explained by geographical origin of the mother trees (data not presented). In a previous study by Hannerz and Westin (2000), the development of autumn frost hardiness in Norway spruce seedlings from an identified seed source (provenance genetic level) was affected by genotype origin. Thus, the genetic level (provenance, half-sib, and full-sib) of the tested seedling material may undermine expected geographical trends in the development of height growth and autumn frost hardiness.
5 Conclusions
The climate treatments applied in this study affected the height growth rate and final height of young Norway spruce seedlings, regardless of genotype. Elevated temperature delayed the onset, and shortened the duration, of autumn frost hardiness development. We found no effects of elevated atmospheric CO2 concentration on the development of height or autumn frost hardiness. Higher temperature also increased variation in height and frost hardiness development among genotypes. Some genotypes showed superior height growth, regardless of climate treatment, but they did not show earlier autumn frost hardiness development. We could not separate the effects of genetic factors and environmental conditions on height and frost hardiness development within the genotypes because of their half-sib origin. In future studies, the clonal or full-sib genetic material should be used to study detailed differences between genotypes in the simultaneous development of height and autumn frost hardiness. Factorial experiments, with a higher number of replicates for each genotype, are also needed for such studies.
Acknowledgements
The scholarships provided by the Heikki Väänänen Fund in 2015 and the Faculty of Science and Forestry, University of Eastern Finland (UEF) in 2016–2018 to the first author, through the doctoral programme in Forests and Bioresources (early stage researcher position at FORES), are acknowledged. The support provided by the Strategic Research Council of the Academy of Finland for the FORBIO project (decision numbers 293380 and 314224 for years 2015–2017 and 2018–2021), led by Prof. Heli Peltola at the School of Forest Sciences, UEF, is also acknowledged. The Tornator Company and the city of Imatra are acknowledged for providing sample trees for this study. The Natural Resources Institute Finland (Luke), and Mr. Aulis Leppänen and Ms. Minna Mäkinen at Luke, are acknowledged for maintenance and measurement of the greenhouse experiment, respectively. Ms. Clotilde Hubert at Agrocampus Ouest, Rennes, France, is acknowledged for assistance in preliminary data analysis.
References
Andalo C., Beaulieu J., Bousquet J. (2005). The impact of climate change on growth of local white spruce populations in Quebec, Canada. Forest Ecology and Management 205(1–3): 169–182. https://doi.org/10.1016/j.foreco.2004.10.045.
Andersson B. (1992). Forecasting Pinus sylvestris field mortality by freeze tests – methods and applications. Dissertation. Swedish University of Agricultural Sciences, Umeå.
Aronsson A. (1975). Influence of photo and thermoperiod on the initial stages of frost hardening and dehardening of phytotron-grown seedlings of Scots pine (Pinus sylvestris L.) and Norway spruce (Picea abies (L.) Karst.). Studia Forestalia Suecica 128: 1–19.
Bates D., Maechler M., Bolker B., Walker S. (2015). Fitting linear mixed-effects models using lme4. Journal of Statistical Software 67(1): 1–48. https://doi.org/10.18637/jss.v067.i01.
Beck E.H., Heim R., Hansen J. (2004). Plant resistance to cold stress: mechanisms and environmental signals triggering frost hardening and dehardening. Journal of Biosciences 29(4): 449–459. https://doi.org/10.1007/BF02712118.
Bigras F.J., Bertrand A. (2006). Responses of Picea mariana to elevated CO2 concentration during growth, cold hardening and dehardening: Phenology, cold tolerance, photosynthesis, and growth. Tree Physiology 26(7): 875–888. https://doi.org/10.1093/treephys/26.7.875.
Brix H. (1972). Growth response of Sitka spruce and white spruce seedlings to temperature and light intensity. Information Report BC-X-74. Canadian Forestry Service, Pacific Forest Research Centre, Victoria (BC).
Chang C.Y., Frechette E., Unda F., Mansfield S.D., Ensminger I. (2016). Elevated temperature and CO2 stimulate late-season photosynthesis but impair cold hardening in pine. Plant Physiology 172: 802–818. https://doi.org/10.1104/pp.16.00753.
Christersson L. (1978). The influence of photoperiod and temperature on the development of frost hardiness in seedlings of Pinus sylvestris and Picea abies. Physiologia Plantarum 44(3): 288–294. https://doi.org/10.1111/j.1399-3054.1978.tb08634.x.
Dalen L.S., Johnsen O., Ogner G. (2001). CO2 enrichment and development of freezing tolerance in Norway spruce. Physiologia Plantarum 113(4): 533–540. https://doi.org/10.1034/j.1399-3054.2001.1130412.x.
Hannerz M., Westin J. (2000). Growth cessation and autumn frost hardness in one-year-old Picea abies progenies from seed orchards and natural stands. Scandinavian Journal of Forest Research 15(3): 309–317. https://doi.org/10.1080/028275800447931.
Hannerz M., Westin J. (2005). Autumn frost hardiness in Norway spruce plus tree progeny and trees of the local and transferred provenances in central Sweden. Tree Physiology 25(9): 1181–1186. https://doi.org/10.1093/treephys/25.9.1181.
Johnsen Ø., Apeland I. (1988). Screening early autumn frost hardiness among progenies from Norway spruce seed orchards. Silva Fennica 22(3): 203–212. https://doi.org/10.14214/sf.a15510.
Johnsen Ø., Skrøppa T., Junttila O., Dæhlen O.G. (1996). Influence of the female flowering environment on autumn frost hardiness of Picea abies progenies. Theoretical and Applied Genetics 92(7): 797–802. https://doi.org/10.1007/BF00221890.
Jylhä K., Ruosteenoja K., Räisänen J., Venäläinen A., Tuomenvirta H., Ruokolainen L., Saku S., Seitola T. (2009). The changing climate in finland: estimates for adaptation studies. ACCLIM Project Report 2009. [In Finnish, with an extended abstract in English]. Finnish Meteorological Institute, Helsinki, Finland.
Kuznetsova A., Brockhoff P.B., Christensen R.H.B. (2016). lmerTest: tests in linear mixed effects models. R package version 2.0-33. https://CRAN.R-project.org/package=lmerTest. [Cited 21 March 2018].
Langvall O. (2000). Interactions between near-ground temperature and radiation, silvicultural treatments and frost damage to Norway spruce seedlings. Dissertation. Swedish University of Agricultural Sciences, Alnarp.
Luoranen J., Lahti M., Rikala R. (2008). Frost hardiness of nutrient-loaded two-year-old Picea abies seedlings in autumn and at the end of freezer storage. New Forests 35(3): 207–220. https://doi.org/10.1007/s11056-007-9072-5.
Mehtätalo L., de-Miguel S., Gregoire T.G. (2015). Modeling height-diameter curves for prediction. Canadian Journal of Forest Research 45(7): 826–837. https://doi.org/10.1139/cjfr-2015-0054.
Murray M.B., Smith R.I., Leith I.D., Fowler D., Lee H.S.J., Friend A.D., Jarvis P.G. (1994). Effects of elevated CO2, nutrition and climatic warming on bud phenology in Sitka spruce (Picea sitchensis) and their impact on the risk of frost damage. Tree Physiology 14(7–8–9): 691–706. https://doi.org/10.1093/treephys/14.7-8-9.691.
Peltola A. (ed.) (2014). Finnish statistical yearbook of forestry. Vammalan Kirjapaino Oy, Helsinki Finland. ISBN 9789514024504.
Pinheiro J.C., Bates D.M. (2000). Mixed-effects models in S and S-plus. Springer. ISBN 0-387-98957-0.
Pinheiro J., Bates D., DebRoy S., Sarkar D. (2017). Core team. nlme: linear and nonlinear mixed effects models. R package version 3.1-131. https://CRAN.R-project.org/package=nlme. [Cited 21 March 2018].
R Core Team (2017). R: a language and environment for statistical computing. R Foundation for Statistical Computing, Vienna, Austria. https://www.R-project.org/. [Cited 21 March 2018].
Rostad H., Granhus A., Fløistad I.S., Morgenlie S. (2006). Early summer frost hardiness in Picea abies seedlings in response to photoperiod treatment. Canadian Journal of Forest Research 36(11): 2966–2973. https://doi.org/10.1139/x06-167.
Ruosteenoja K., Jylhä K., Kämäräinen M. (2016). Climate projections for Finland under the RCP forcing scenarios. Geophysica 51: 17–50.
Ruosteenoja K., Räisänen J., Pirinen P. (2011). Projected changes in thermal seasons and the growing season in Finland. International Journal of Climatology 31(10): 1473–1487. https://doi.org/10.1002/joc.2171.
Skrøppa T. (1991). Within-population variation in autumn frost hardiness and its relationship to bud-set and height growth in Picea abies. Scandinavian Journal of Forest Research 6(1–4): 353–363. https://doi.org/10.1080/02827589109382673.
Skrøppa T., Kohmann K., Johnsen Ø., Steffenrem A., Edvardsen Ø.M. (2007). Field performance and early test results of offspring from two Norway spruce seed orchards containing clones transferred to warmer climates. Canadian Journal of Forest Research 37(3): 515–522. https://doi.org/10.1139/X06-253.
Skrøppa T., Magnussen S. (1993). Provenance variation in shoot growth components of Norway spruce. Silvae Genetica 42: 111–120.
Wickham H. (2009). ggplot2: elegant graphics for data analysis. Springer-Verlag, New York. https://doi.org/10.1007/978-0-387-98141-3.
Zeide B. (1993). Analysis of growth equations. Forest Science 39(3): 594–616. https://doi.org/10.1093/forestscience/39.3.594.
Zeps M., Jansons Ā., Matisons R., Stenvall N., Pulkkinen P. (2017). Growth and cold hardening of European aspen seedlings in response to an altered temperature and soil moisture regime. Agricultural and Forest Meteorology 242: 47–54. https://doi.org/10.1016/j.agrformet.2017.04.015.
Total of 33 references.
