Dipak Mahatara  ,
Amul K. Acharya,
Bishnu P. Dhakal,
Dipesh K. Sharma,
Sunita Ulak,
Prashant Paudel
,
Amul K. Acharya,
Bishnu P. Dhakal,
Dipesh K. Sharma,
Sunita Ulak,
Prashant Paudel
Maxent modelling for habitat suitability of vulnerable tree Dalbergia latifolia in Nepal
Mahatara D., Acharya A. K., Dhakal B. P., Sharma D. K., Ulak S., Paudel P. (2021). Maxent modelling for habitat suitability of vulnerable tree Dalbergia latifolia in Nepal. Silva Fennica vol. 55 no. 4 article id 10441. https://doi.org/10.14214/sf.10441
Highlights
- Dalbergia latifolia is a vulnerable species of Nepal with very few conservation priorities
- Habitat suitability modelling for this species is essential to endorse different conservation interventions
- 43 presence locations and different environmental variables were retained for model prediction in Maxent
- Province 2 was found most suitable habitat for the growth of D. latifolia, with western most province as unsuitable.
Abstract
Dalbergia latifolia Roxb., commonly known as rosewood, is one of the highly valuable tropical timber species of Nepal. The tree species was widely distributed in the past, however, over-exploitation of natural habitat, deforestation, forest conversion for agriculture, illegal logging and the invasion of alien species resulted in the classification of this species as vulnerable by the IUCN (International Union for Conservation of Nature) category. So, the prediction of habitat suitability and potential distribution of the species is required to develop restoration mechanisms and conservation interventions. In this study, we modelled the suitable habitat of D. latifolia over the entire possible range of Nepal using a Maxent model. We compiled 23 environmental variables (19 bioclimatic, 3 topographic and a vegetative layer), however, only 12 least correlated variables along with 43 spatially representative presence locations were retained for model prediction. We used a receiver operating characteristic (ROC) curve to assess the model’s performance and a Jackknife procedure to evaluate the relative importance of predictor variables. The model was statistically significant with an area under the curve (AUC) value of 0.969. The internal Jackknife test indicated that elevation was the most important variable for the model prediction with 71.3% contribution followed by mean temperature of driest quarter (9.8%). The most (>0.6) suitable habitat for the D. latifolia was 235 484 hectares with large sections of area in two provinces whereas, the western most provinces were not suitable for D. latifolia as per Maxent model. The information presented here can provide a framework for nature conservation planning, monitoring and habitat management of this rare and endangered species.
Keywords
rosewood;
satisal;
distribution mapping;
environmental variables;
Maxent modelling
-
Mahatara,
Forest Research and Training Centre, Government of Nepal, P.O. Box 3339, Babarmahal, Kathmandu 44600, Nepal
E-mail
honeystar73@gmail.com
- Acharya, Forest Research and Training Centre, Government of Nepal, P.O. Box 3339, Babarmahal, Kathmandu 44600, Nepal E-mail acharya.amulkumar@gmail.com
- Dhakal, Forest Research and Training Centre, Government of Nepal, P.O. Box 3339, Babarmahal, Kathmandu 44600, Nepal E-mail dhakalbp.shorea@gmail.com
- Sharma, Forest Research and Training Centre, Government of Nepal, P.O. Box 3339, Babarmahal, Kathmandu 44600, Nepal E-mail dipeshsharmadiyu2015@gmail.com
- Ulak, Forest Research and Training Centre, Government of Nepal, P.O. Box 3339, Babarmahal, Kathmandu 44600, Nepal E-mail sunitaulak@gmail.com
- Paudel, Agriculture Forestry University, P.O. Box 13712 Rampur, Chitwan, Nepal E-mail prashant.paudel88@gmail.com
Received 13 September 2020 Accepted 15 July 2021 Published 21 July 2021
Views 110993
Available at https://doi.org/10.14214/sf.10441 | Download PDF

1 Introduction
Geographic position, altitudinal variation and climatic conditions create different ecosystems and habitats that dictate the distribution of vegetation. In addition, soil fertility, topography and irradiance play vital role in habitat distribute in local/small scale. Habitat which is combination of the space and all abiotic environmental factors and other organisms (Yi et al. 2016), plays a significant role in the distribution and existence of species in different location. Forest are the most vital and valuable renewable natural resource of the globe, and acts as a prime repository for a significant portion of terrestrial biological diversity (Bozzano et al. 2014). Furthermore, forests play a dynamic role in the protection of the fragile biodiversity of mountain ecosystems, and they support the livelihoods of forest-based communities (Thomson 2000). In this century, due to the combined impacts of urban expansion, global warming, forest fires, over-exploitation, and the invasion of alien species, our forest resources are in imminent danger (Seto et al. 2012), resulting in twenty percent of the plant species in the risk of extinction (Nic Lughadha et al. 2020) globally. Recently, in-situ and ex-situ conservation approaches have been adopted by conservationists to conserve rare and endangered wild flora and fauna under challenging conditions. So, from this conservation perspective it is crucial to monitor and assess potential suitable habitat of threatened species in order to rehabilitate them in their ecosystem (Gaston 1996).
Different environmental characteristics have significant roles in limiting the distribution of species (Wiens 2011). So, the relationships between species and the environment are the most used parameters for species distribution modelling and mapping under prevailing conditions. Models for predicting the potential geographic distributions can be used for habitat suitability mapping and conservation plan preparation of globally important species (Graham et al. 2004; Guisan and Thuiller 2005). Numerous species distribution modeling methods are available to simulate the spatial distribution of plant species along with the study of spatial patterns of species diversity (Wisz et al. 2008; Graham et al. 2006) and impacts of climate change (Saran et al. 2010). However, to assess the habitat suitability for rare and endangered plant species, very few predictive models are developed because of comparatively small sample size (Pearson et al. 2007). The most frequently used species distribution models are Maxent, random forest, boosted regression trees, generalized additive models, and multivariate adaptive regression spines, which have similar predictive performances (García-Callejas and Araújo 2016). In this study, we used the maximum entropy algorithm (Maxent) because it requires only species presence (or occurrence) data along with environmental information, and it deals effectively with limited occurrence data of small sample sizes (Merow et al. 2013; Elith et al. 2011). It is based on the maximum-entropy principle, where the best approximation to an unknown distribution is that which maximizes entropy while satisfying any known constraints (Jaynes 1957). Because of its high performance with both spatially biased data (Loiselle et al. 2008) and limited occurrence records (Pearson et al. 2007), it has been one of the most frequently used (Elith et al. 2006) modelling techniques (Ortega-Huerta and Townsend Peterson 2008). In addition, this model can use both continuous and categorical environmental variables as input variables and incorporates the interactions between the variables (Phillips et al. 2006) and best suited for countries like Nepal with diverse geographical and environmental conditions. Despite this, Maxent has some limitations such as sampling bias of occurrences, selection of features and the region used for background sampling (Elith et al. 2011; Kramer‐Schadt et al. 2013).
Dalbergia latifolia Roxb. (Fabaceae) is a slow growing, predominantly single-stemmed deciduous tree that reaches over 40 m in height and found commonly within Dalbergia sissoo Roxb. (Jackson 1994) and other deciduous forests (Nath et al. 2011). This species occurs naturally up to 1000 m altitude (Jackson 1994) in India, Nepal, Indonesia (Soerianegara and Lemmens 1994) and Malaysia (Praciak et al. 2013) , however large scale plantations have been established across Kenya, Myanmar, Nigeria, Philippines and Vietnam (Orwa et al. 2009). D. latifolia is one of the most valuable timber trees in the Indian sub-continent (Praciak et al. 2013), where bark and leaves are locally used as medicine (Jain et al. 2005; Padal et al. 2010). Moreover, bark is also used as ethno-veterinary medicine in India (Selvaraju et al. 2011). Due to its high value for multiple uses (Troup 1921), it is over-exploited in its natural range (Thapa 2004), which has resulted in a ban on the harvest, transportation and export for commercial purposes of this species (GoN 2001) in Nepal. D. latifolia is protected under the Indian forest act, 1927 and also in Forest act, 2019 of Nepal and reported as “Vulnerable” by International Union for Conservation of Nature (Damaiyani and Prabowo 2019). Despite the enormous threats, there have been very limited concentrated efforts to address conservation concerns, such as mapping of the distribution pattern in Nepal. Over the last few decades, the majority of the studies were focused on the genetics and ex-situ conservation of D. latifolia, however, the availability of suitable habitat for large scale plantation has not been determined. Information on the potential habitat availability of this vulnerable tree species can be important conservation tool, in order to permit conservation initiatives, reintroduction and restoration in its preferred habitat.
In this study, we used a Maxent model to predict the potential distribution of D. latifolia across Nepal and to identify the environmental factors associated with this distribution. Due to varying topographic condition and the formation of micro-climatic zones in small altitudinal gradients, environmental factors alter more frequently from east to west than north to south of the country. For this, we hypothesized that D. latifolia has a distribution range from eastern to mid-western parts of Nepal up to 1000 m altitude and that bioclimatic and topographical factors, and companion vegetation are the major influencing variables determining its distribution.
2 Materials and methods
2.1 Study area
The study was carried out in Nepal, which has an area of 0.147 million square kms and lies between India and China in the latitudes of 26°22´N to 30°27´N and longitudes of 80°04´E to 88°12´E (Fig. 1). The variation in physiography associated with the range in elevation from 60 m to 8848 m (Mount Everest) resulted in a variety of biomes (McColl 2014) in five distinct physiographic regions: High Himalaya, High Mountain, Middle Mountain, Siwalik, and Terai (Uddin et al. 2015). The average annual rainfall is 1600 mm, but it varies by eco-climatic zone, which form different micro-climatic conditions within broader physiographic zones. According to land cover mapping, both forest and other wooded lands together cover 6.61 million hectares, 44.74% of total area of the country with altogether 443 tree species belonging to 239 genera and 99 families (DFRS 2015). Even though Nepal covers a relatively small area, it harbors 35 forest types (Stanton 1972), which are often categorized into ten major groups (MoFSC 2014) and 118 ecosystems (Dobremez 1970), where numerous endemic flora and fauna species of global importance are recorded.
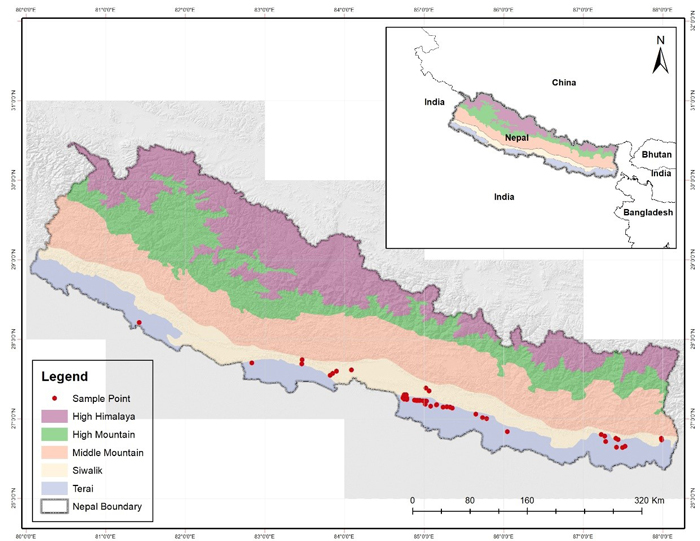
Fig. 1. Map of study area with the five distinct physiographic regions and presence locations of Dalbergia latifolia in Nepal. View larger in new window/tab.
2.2 Input data
2.2.1 Presence Record and Spatial Filtering
The information regarding the occurrence of D. latifolia was obtained from meetings with Division Forest Offices (DFOs) of Terai and Inner-Terai regions of Nepal. After first level of screening, focus group discussions were organized with related stakeholders and local people in order to get the occurrence information. Field surveys were conducted to determine the occurrence locations and to record the phenotypic information in different locations representing all climatic zones, physiographic regions and management regimes. Altogether, 230 presence locations were recorded mostly from the tropical mixed hardwood forest and sub-tropical region of the country with higher concentration in the eastern part (Fig. 1). These records were from 11 different districts (Bardiya, Kapilvastu, Palpa, Nawalparasi, Makawanpur, Bara, Parsa, Rautahat, Sarlahi, Sunsari and Jhapa).
Presence records collected from the field may pose sampling bias due to the variety of disturbances from the connected road networks, urbanization and by focusing the particular vegetation type/ forest stand (Kadmon et al. 2004). To minimize the sampling bias the data need to be collected using spatial extent of the region with planned sampling regime (Barry et al. 2006). However, having zero spatial error would be only possible in the ideal data set. And in order to minimize this bias, we managed spatial filters of grid sizes 2 km × 2 km by retaining only one presence data in each grid cell. Thus, only 43 presence data were used for model prediction in Maxent.
2.2.2 Environmental Variables
We used different environmental layers of climatic, topographic, and non-climatic data as potential predictors of D. latifolia habitat distribution. These were primarily chosen on the basis of their biological relevance to species distribution and other habitat modelling studies (Kumar et al. 2006; Pearson et al. 2007; Xu et al. 2019). For climatic layers, we used 19 bioclimatic variables (Table 1) developed by Hijmans et al. (2005), produced as interpolated climatic surfaces for global lands other than Antarctica using 1950–2000 climatic data (Fig. 2). Moreover, the topographic factors, such as slope, aspect and altitude, also play significant role for the growth of a species (Karami et al. 2015). Digital Elevation Model (DEM) data was obtained from worldclim website (https://www.worldclim.org/) and it was used to get slope and aspect using R 4.0.0.
| Table 1. List of 19 bioclimatic variables used for habitat suitability model development for Dalbergia latifolia. All of the descriptions and values are based on WorldClim data (Hijmans et al. 2005; O’Donnell et al. 2012). | |||||
| Code | Bioclimatic Variable | Unit | Minimum | Maximum | Scaling Factor |
| Bio1 | The annual mean temperature | Degrees Celsius | –290 | 320 | 10 |
| Bio2 | Mean diurnal range: (Mean of monthly (max temp – min temp)) | Degrees Celsius | 9 | 214 | 10 |
| Bio3 | Isothermality: (Mean diurnal range/annual temperature range) × 100 or (BIO2/BIO7) × 100 | Percentage | 7 | 96 | 100 |
| Bio4 | Temperature Seasonality: (Standard deviation ×100) | Degrees Celsius | 62 | 22 721 | 100 |
| Bio5 | Maximum Temperature of Warmest Month: maximum temperature value across all months within a given year | Degrees Celsius | –96 | 490 | 10 |
| Bio6 | Minimum Temperature of Coldest Month: minimum temperature value across all months within a given year | Degrees Celsius | –573 | 258 | 10 |
| Bio7 | Temperature Annual Range: (Bio5 – Bio6) | Degrees Celsius | 53 | 725 | 10 |
| Bio8 | Mean Temperature of Wettest Quarter | Degrees Celsius | –285 | 378 | 10 |
| Bio9 | Mean Temperature of Driest Quarter | Degrees Celsius | –521 | 366 | 10 |
| Bio10 | Mean Temperature of Coldest Quarter | Degrees Celsius | –143 | 383 | 10 |
| Bio11 | Mean Temperature of Coldest Quarter | Degrees Celsius | –521 | 289 | 10 |
| Bio12 | Annual Precipitation: This is the sum of all total monthly precipitation values | Millimeters | 0 | 11 401 | 1 |
| Bio13 | Precipitation of Wettest Month | Millimeters | 0 | 2949 | 1 |
| Bio14 | Precipitation of Driest Month | Millimeters | 0 | 752 | 1 |
| Bio15 | Precipitation Seasonality: (Coefficient of Variation) | Fraction | 0 | 265 | 100 |
| Bio16 | Precipitation of Wettest Quarter | Millimeters | 0 | 8019 | 1 |
| Bio17 | Precipitation of Driest Quarter | Millimeters | 0 | 2495 | 1 |
| Bio18 | Precipitation of Warmest Quarter | Millimeters | 0 | 6090 | 1 |
| Bio19 | Precipitation of Coldest Quarter | Millimeters | 0 | 5162 | 1 |
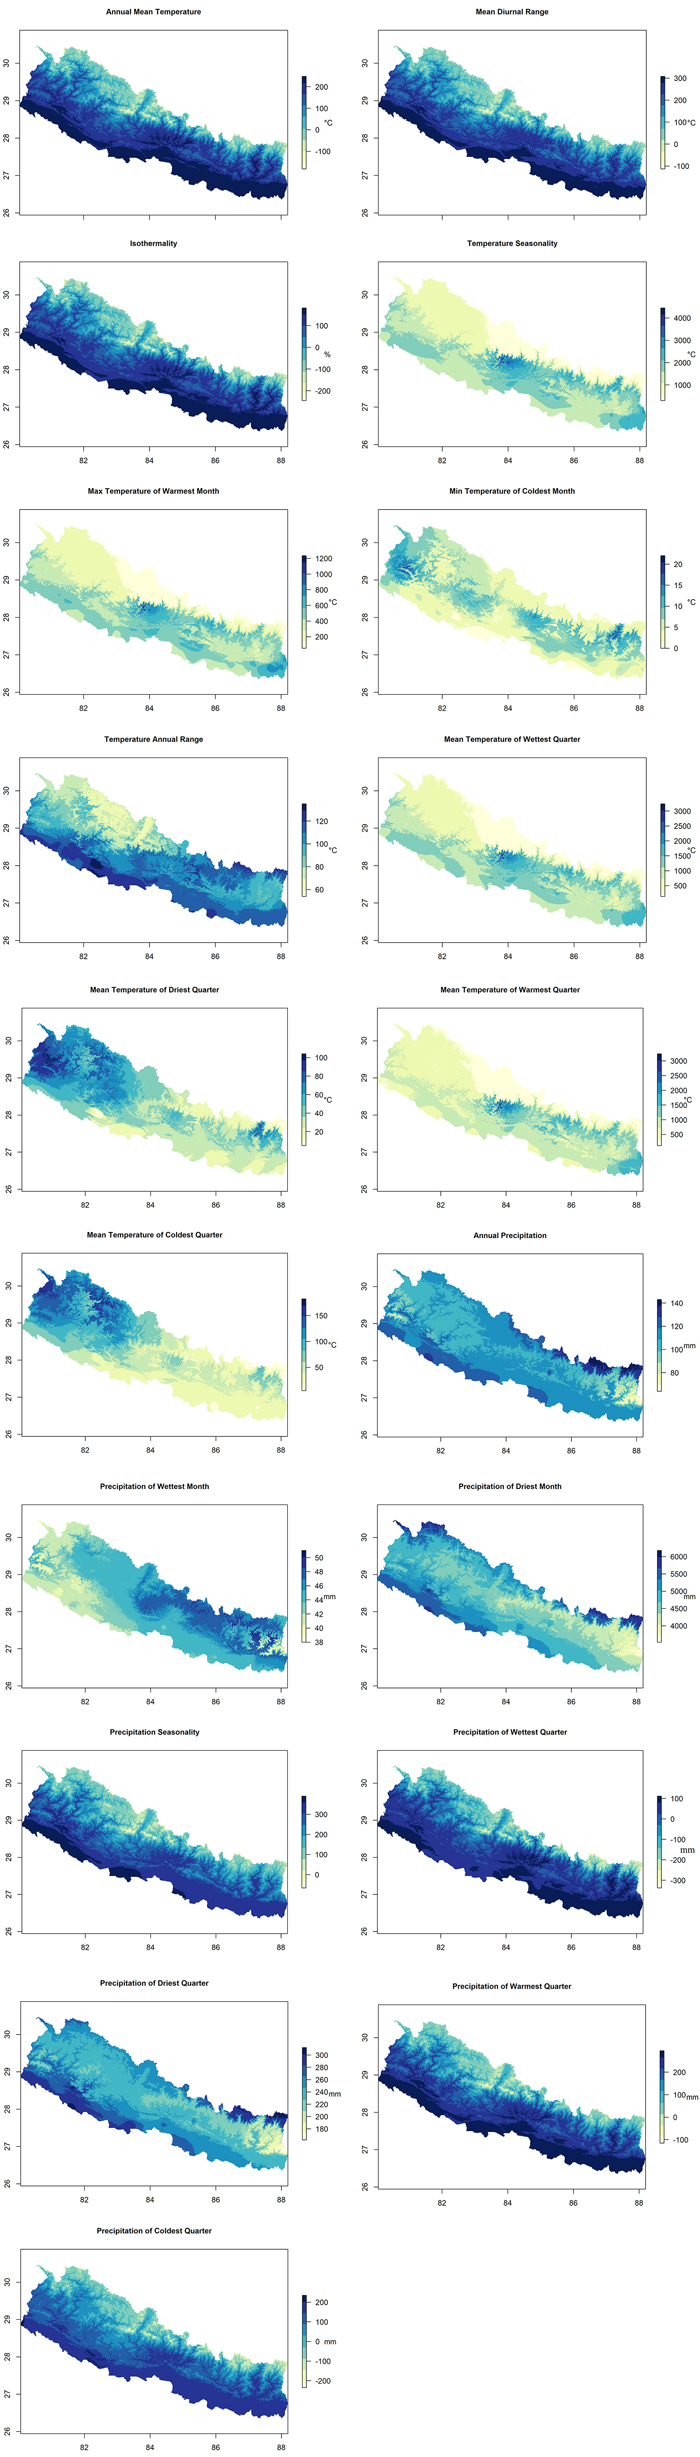
Fig. 2. Spatial distribution of selected Bioclimatic variables used for mapping and habitat suitability modelling of Dalbergia latifolia in Nepal (Table 1). These spatial products were derived from 19 original (modification was not made) bioclimatic variables developed by Hijmans et al. (2005) (posted on the Bioclim website; https://www.worldclim.org/). Scaling factor (see Table 1) is used in the units of the studied variables. (Note: “°C” is degree centigrade, “mm” is millimeter and “%” is percentage). View larger in new window/tab.
To minimize correlations between the predictor variables, multicollinearity among all of the variables was examined by cross-correlations (Pearson correlation coefficient, r). Among different highly cross-correlated variables (r > ±0.75, alpha = 0.05), only one was included based on the potential biological relevance to the distribution and for the ease of interpretation (Kumar et al. 2006). Thus, predictor variables were reduced to 12 from 23 for mapping of potential suitable habitat.
2.2.3 Mapping and modelling
We used Maxent software, version 3.4.1 (https://biodiversityinformatics.amnh.org/open_source/maxent/) to predict the potential suitable habitat of D. latifolia in Nepal. Maxent is a maximum entropy-based machine learning program that takes presence only data as an input, as well as a set of environmental covariates of a defined geography to provide a probability distribution model as a final output (Merow et al. 2013).
After completion of the distribution modelling and mapping, we assessed the statistical significance of the model. In the majority of modelling work, independent datasets are generated for the purpose of model validation by splitting the field data into training and test/validation (Fielding and Bell 1997; Guisan and Zimmermann 2000). However, for the modelling of endangered and threatened species, splitting of data sets for validation purposes may not be possible because of the very limited number of samples. So, in this study, we used a Jackknife procedure to examine the importance of individual variables for model prediction as proposed by Pearson et al. (2007). Jackknife predicts the importance of the environmental covariates under the basis of area under curve (AUC) gains for three different scenarios (without variable, with only one variable and with all variables). Beside this, we used the receiver operating characteristic (ROC), and the AUC method to evaluate the model’s goodness of fit. The model with the highest AUC value was considered as the best performer. AUC measures the predictive performance of the model by comparing the ability of the model to random prediction, and values range from 0to 1 (Phillips et al. 2006). The final suitability map had values ranging from 0–1, which was further regrouped into four classes for the purpose of interpretation: 0–0.2 is unsuitable; 0.2–0.4 is low; 0.4–0.6 is moderate; and 0.6–1 is high suitability (Ansari and Ghoddousi 2018).
3 Results
3.1 Model validation and key environmental variables
The Maxent model predicted the potential suitable habitat for D. latifolia with satisfactory statistical accuracy, with an AUC value of 0.969. The Maxent model’s internal Jackknife test indicated that the variables with higher importance in predicting habitat suitability were ‘Elevation’ and ‘Mean temperature of driest quarter’ (Fig. 3). These two environmental variables presented the highest gain in comparison to the rest of the others and hence contained the most valuable information. Similarly, the results for the response of the model to each variable showed consistent results with the internal Jackknife test. The most highly contributing variables were Elevation (71.3%); Mean temperature of driest quarter (9.8%) and Slope (6.4%), whereas, other remaining variables contributed less than 6% to the final model (Table 2).
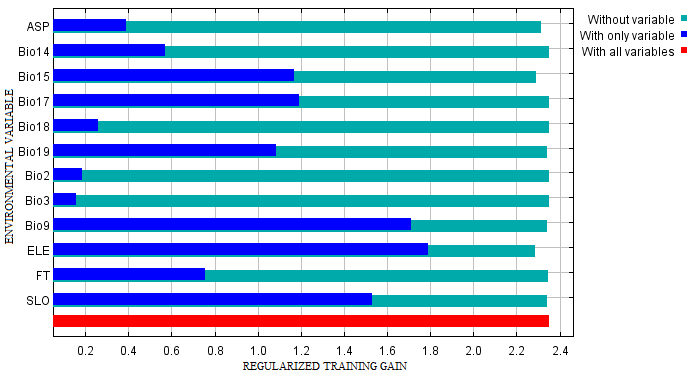
Fig. 3. The Jackknife test for evaluating the relative importance of environmental variables for Dalbergia latifolia Maxent model on habitat suitability. (Note: “ASP” is aspect; “Bio14 is Precipitation of driest period; “Bio15” is Precipitation seasonality; “Bio17” is Precipitation of driest quarter; “Bio18” is Precipitation of warmest quarter; “Bio19” is Precipitation of coldest quarter; “Bio2” is Mean diurnal range; “Bio3” is isothermality; “Bio9” is Mean temperature of driest quarter; “ELE” is elevation; “FT” is forest types and “SLO” is slope).
| Table 2. Selected environmental variables and their percent contribution in the Maxent model on habitat suitability for Dalbergia latifolia in Nepal. | |||
| Code | Environmental Variables | Percent Contribution | Cumulative Percent Contribution |
| ELE | Elevation (m) | 71.3 | 71.3 |
| Bio9 | Mean temperature of driest quarter (°C) | 9.8 | 81.1 |
| SLO | Slope (degree) | 6.4 | 87.5 |
| Bio15 | Precipitation seasonality | 5.8 | 93.3 |
| ASP | Aspect (degree) | 3.0 | 96.3 |
| Bio19 | Precipitation of coldest quarter (mm) | 1.2 | 97.5 |
| Bio18 | Precipitation of warmest quarter (mm) | 0.9 | 98.4 |
| FT | Forest type | 0.8 | 99.2 |
| Bio2 | Mean diurnal range/ mean of monthly max. and min. temp. (°C) | 0.8 | 100 |
| Bio14 | Precipitation of driest period (mm) | 0 | 100 |
| Bio17 | Precipitation of driest quarter (mm) | 0 | 100 |
| Bio3 | Isothermality | 0 | 100 |
3.2 Relationship between major environmental variables and geographical distribution
Fig. 4A indicates that the distribution of D. latifolia with a > 0.5 probability of presence was limited to between approximately 60–300-meters in altitude. Outside of this window the distribution of the species sharply declined with increasing altitude, with very low rates of presence above 1000 meter. The probability of presence increased sharply with the rise of mean temperature of the driest quarter and the highest probability of presence was obtained within the temperature range of 22–25 °C (Fig. 4B). Similarly, the probability of presence increased with rise in monthly precipitation from 100 to 125 mm and thereafter sharply decreased (Fig. 4C). Whereas, a negative relationship was found between precipitation of coldest quarter and probability of presence of D. latifolia (Fig. 4D).
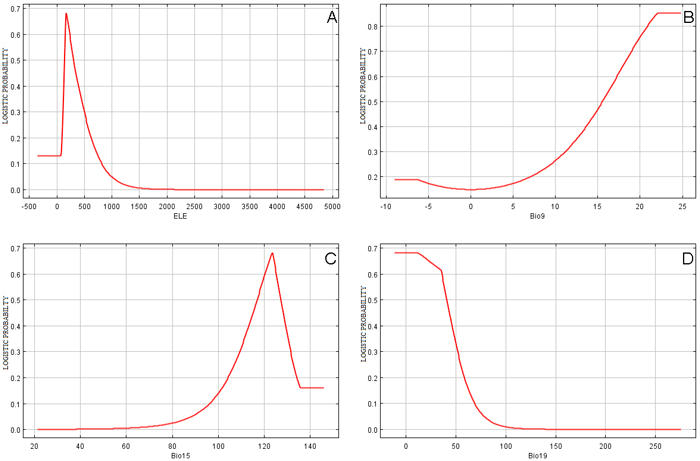
Fig. 4. Relationships between top environmental predictors and the probability of presence of Dalbergia latifolia in Nepal: (A) “ELE” is Elevation in Meter, (B) “Bio9” is Mean temperature of driest quarter in °C, (C) “Bio15” is Precipitation seasonality in mm and (D) “Bio19” is Precipitation of coldest quarter in mm. View larger in new window/tab.
3.3 Potential distribution of Dalbergia latifolia in Nepal
The Maxent model predicted that Central as well as Eastern parts of the Terai region of Nepal were the most suitable habitats for D. latifolia with very low habitat suitability in the Western region. The model result showed that an area of 222 403 hectares had high potential, a 111 712-hectare area showed moderate potential while a 269 583-hectare area showed low potential for the growth of D. latifolia. Similarly, an area of approximately 7.2 million hectares was predicted to be unsuitable (Fig. 5). The map shows that the Chure foothills and the surrounding area of eastern Nepal has high potential habitat suitability for D. latifolia and the majority of the area falls in the Parsa National Park and its surroundings.
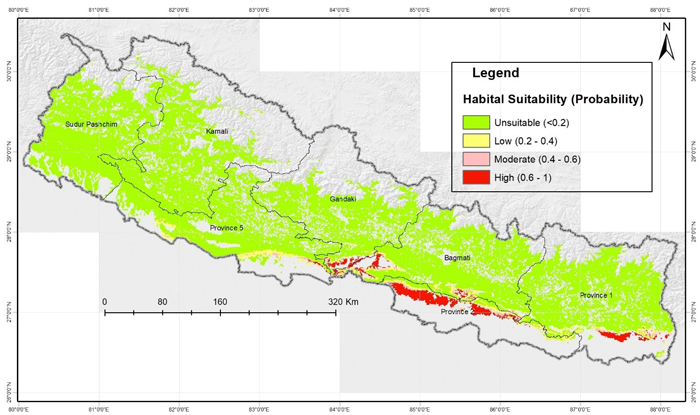
Fig. 5. Predicted potential suitable habitats of Dalbergia latifolia in Nepal using Maxent modelling. View larger in new window/tab.
It was found that more than half of the suitable habitat is located only in province 2 (Table 3). The eastern most province (Province 1) and the province with capital city (Bagmati Province) both have similar areas with higher potential (Table 3). Whereas, western most provinces (Karnali and Sudur Paschim) were found least suitable for growing D. latifolia (Fig. 5).
| Table 3. Predicted potential suitable habitat area of Dalbergia latifolia for different provinces in Nepal. | ||||||||
| Province name | High (0.6–0.8) | Moderate (0.4–0.6) | Low (0.2–0.4) | Unsuitable (<0.2) | ||||
| Area (ha) | Area ratio (%) * | Area (ha) | Area ratio (%) * | Area (ha) | Area ratio (%) * | Area (ha) | Area ratio (%) * | |
| Province-2 | 129 805 | 58.36 | 33 668 | 30.14 | 63 221 | 23.45 | 75 703 | 1.04 |
| Province-1 | 37 560 | 16.89 | 22 017 | 19.71 | 50 807 | 18.85 | 1 307 501 | 17.93 |
| Bagmati | 32 814 | 14.75 | 31 771 | 28.44 | 62 440 | 23.16 | 1 275 727 | 17.49 |
| Gandaki | 19 120 | 8.60 | 9510 | 8.51 | 12 395 | 4.60 | 951 522 | 13.05 |
| Province-5 | 3104 | 1.40 | 14 746 | 13.20 | 80 719 | 29.94 | 1 083 272 | 14.85 |
| Karnali | 0 | 0.00 | 0 | 0.00 | 0 | 0.00 | 1 297 958 | 17.80 |
| Sudur Pashchim | 0 | 0.00 | 0 | 0.00 | 0 | 0.00 | 1 301 748 | 17.85 |
| Grand total | 222 403 | 100.00 | 111 712 | 100.00 | 269 583 | 100.00 | 7 293 430 | 100.00 |
| * Refers to the ratio of predicted area to the corresponding area of habitat suitability type. | ||||||||
4 Discussion
Among the 12 variables considered for predicting the habitat suitability of D. latifolia, elevation was the major driver of its distribution in Nepal. Moreover, mean temperature in the driest quarter, slope and precipitation seasonality also contributed to its distribution. It was found that central and eastern regions with elevation 60–300 m have a higher chance (p > 0.5) of high habitat suitability in natural condition. The two eastern most provinces (Province 1 and 2) represent more than 75% of total suitable habitat for growing D. latifolia in Nepal.
The response curves (Fig. 4) for elevation showed that the highest habitat suitability lies in the range of 200–1000 meters. This is similar to Jackson (1994) who reported D. latifolia to have a widespread distribution in the East Asia-Indian subcontinent up to the altitude of 1000 m in evergreen or deciduous forests with deep, well-drained and moist soils (Soerianegara and Lemmens 1994; Krishnamurthy et al. 2010). Moreover, Praciak et al. (2013) concluded that in India, D. latifolia was wide spread up to an altitude of 1350 m, ranging from the Himalayan tract to southern India. However, the area with the least amount of potential habitat is mostly represented by the forests of higher altitude regions where mean temperature fluctuates in winter and summer (Jackson 1994). Beside this, temperature and precipitation related variables were also found to be important predictors in defining the suitable habitat of D. latifolia. It tolerates minimum temperatures as low as 0–6 °C (Tchoundjeu and Atangana 2011) and the response curve for mean temperature of the driest quarter was consistent with the prediction of best suited temperature as 20–25 °C. Additionally, studies have shown that the annual rainfall in its natural habitat ranges from 750–5000 mm (Louppe et al. 2008) and it can tolerate up to 6 dry months per year with only 40 mm of mean monthly rainfall (Tchoundjeu and Atangana 2011). Our results also showed that the optimum occurrence probability of D. latifolia would be obtained with an average monthly precipitation of around 120 mm and the average minimum precipitation during the coldest quarter was found to be 50 mm. This shows that D. latifolia prefers tropical environments to grow and spread, therefore, the elevation, mean temperature and precipitation of the coldest quarter were the limiting factors for areas suitable for D. latifolia. The low relative importance of non-climatic variables (Forest type) as shown by internal Jackknife procedure and variable importance test indicate that D. latifolia has not any specific preference for the trees it grows in association with and that it can grow in different forest types. Kadambi (1954) reported that it commonly grows with Tectona grandis L.f, Terminalia species, Anogeissus latifolia Roxb. ex DC. (International Plant Names Index 2019) and bamboos in Nepal, however further studies are needed to figure out the effect of forest density and invasion of exotic species for promoting plantation in different densities, particularly in a degraded landscape.
The model showed that the forests of the Central region of Nepal, particularly the range of the Parsa National Park, was the most suitable habitat of D. latifolia, whereas the abundance of high-quality habitat decreases from east to west. The density of D. latifolia was reported to be good in the predicted potential habitat in the past, however due to the multipurpose values of the tree for veneers, flooring, moldings, guitar industry, carvings and paneling (Orwa et al. 2009), its occurrence is now becoming very low in its natural habitat. This study only predicted potential habitat of D. latifolia in forest lands and there might also be large areas of potential habitat outside forest lands as well.
Since, Maxent predicts the fundamental niche (different from occupied niche) rather than the realized niche, the predicted potential habitat through Maxent modelling almost always appears over-estimated (Pearson et al. 2007; Kumar and Stohlgren 2009). However, in reality the species might have failed to disperse from its geographic range due to the various anthropogenic and natural barriers (Yang et al. 2013). Although the environmental variables used in this study were limited to only climatic, topography and forest type, they were found able to predict the potential habitat with a high degree of precision. This potential habitat distribution map for D. latifolia can be one of the guiding tools for the forest resource managers and land use planners in order to set priorities for restoration in its natural habitat as well as to initiate different conservation interventions. Beside this, the predicted potential habitat may not be occupied by the species presently, thus the identified habitat can be the best candidate areas to be considered for conservation prioritizations with ex-situ management.
5 Conclusion
We used a maximum entropy model and based on three sets of environmental variables we assessed the potential suitable habitat of D. latifolia in Nepal. Our results revealed that the environmentally suitable area for D. latifolia in Nepal are limited to the lowland Terai and less elevated Churia of the Central and Eastern regions. Elevation and the Mean temperature of driest quarter were found to be the most important environmental variables to define the habitat suitability for D. latifolia followed by Slope and Precipitation characteristics. The habitat suitability map might be more realistic if we were able to add more environmental covariates, such as soil factors and anthropogenic threats, which will be strongly recommended for future researchers. The study could be useful to optimize D. latifolia distribution by conducting conservation activities in areas of high and moderate suitability where the species is currently lacking.
Acknowledgements
We sincerely thank to the former Director General of FRTC, Dr. Deepak Kumar Kharal and former Deputy Director General of FRTC, Mr. Yam Prasad Pokharel for their continuous feedback from project development to finalization. Similarly, we are very grateful towards our Director General Mr. Meghnath Kafle and Deputy Director General Mr. Dhirendra Kumar Pradhan for their enormous motivation and support to draft the manuscript. We are obliged to all of the division forest offices of our transect for their cooperation during data collection phase. More specifically, we would also like to credit Mr. Rajaram Aryal and Mr. Prabesh Shrestha for their technical guidance.
Funding
This work is a part of annual program of Forest Research and Training Center and some additional data were also collected on author’s interest. We did have 2500$ to accomplish the entire data collection activities and report writing.
Author’s contribution
The overall project was designed by Mr. Dipak Mahatara and he was completely engaged to the project management, data collection as well as the preparation of this manuscript. Mr. Bishnu Prasad Dhakal and Mr. Dipesh Sharma were involved to collect the field data and to draft this manuscript. Mrs. Sunita Ulak supervised the project as a senior officer at FRTC and contributed to make the manuscript more robust. Mr. Amul Kumar Acharya and Mr. Prashant Paudel analyzed the field data and managed the overall technicalities of this manuscript.
Data availability
This project was the annual program of Forest Research and Training Center and the overall project management and manuscript preparation activities was conducted as per the government norms. The whole research materials, dataset and the analysis code would be available upon the formal request to the organization. There is not any conflict of interest to the submitted version of manuscript.
References
Ansari M, Ghoddousi A (2018) Water availability limits brown bear distribution at the southern edge of its global range. Ursus 29: 13–24. https://doi.org/10.2192/URSUS-D-16-00017.1.
Barry S, Elith J (2006) Error and uncertainty in habitat models. J Appl Eco 43: 413–423. https://doi.org/10.1111/j.1365-2664.2006.01136.x.
Bozzano M, Jalonen R, Thomas E, Boshier D, Gallo L, Cavers S, Bordács S, Smith P, Loo J (eds)(2014) Genetic considerations in ecosystem restoration using native tree species. State of the world’s forest genetic resources – thematic study. FAO, Rome & Bioversity International. ISBN 978-92-5-108469-4.
Damaiyani J, Prabowo H (2019) Conservation strategy of a vulnerable species of ‘Rosewood’ (Dalbergia latifolia Roxb) by insect pollinator identification. J Phys Conf Ser 1363, article id 012005. https://doi.org/10.1088/1742-6596/1363/1/012005.
DFRS (2015) State of Nepal’s forests. Forest Resource Assessment (FRA) Nepal, Department of Forest Research and Survey (DFRS). Kathmandu, Nepal. ISBN 978-9937-8896-3-6.
Dobremez JF (1970) Biogeographie du Centre Nepal. Bulletin de l’Association de Géographes Français 47: 79–90. https://doi.org/10.3406/bagf.1970.5948.
Elith J, Graham HC, Anderson RP, Dudík M, Ferrier S, Guisan A, Hijmans RJ, Huettmann F, Leathwick JR, Lehmann A, Li J, Lohmann LG, Loiselle BA, Manion G, Moritz C, Nakamura M, Nakazawa Y, Overton JMcC., Townsend Peterson A, Phillips SJ, Richardson K, Scachetti-Pereira R, Schapire RE, Soberón J, Williams S, Wisz MS, Zimmermann NE (2006) Novel methods improve prediction of species’ distributions from occurrence data. Ecography 29: 129–151. https://doi.org/10.1111/j.2006.0906-7590.04596.x.
Elith J, Phillips SJ, Hastie T, Dudík M, Chee YE, Yates CJ (2011) A statistical explanation of MaxEnt for ecologists. Divers Distrib 17: 43–57. https://doi.org/10.1111/j.1472-4642.2010.00725.x.
Fielding AH, Bell JF (1997) A review of methods for the assessment of prediction errors in conservation presence/absence models. Environ Conserv 24: 38–49. https://doi.org/10.1017/S0376892997000088.
García-Callejas D, Araújo MB (2016) The effects of model and data complexity on predictions from species distributions models. Ecol Modell 326: 4–12. https://doi.org/10.1016/j.ecolmodel.2015.06.002.
Gaston KJ (1996) Species richness: measure and measurement. In: Gaston KJ (ed) Biodibersity: a biology of numbers and difference, Blackwell Science, Oxford, pp 77–113.
GoN (2001) Notice of the Ministry of Forest and Soil Conservation. Nepal Gazette part 3, December 31, 2001.
Graham CH, Ferrier S, Huettman F, Moritz C, Townsend Peterson A (2004) New developments in museum-based informatics and applications in biodiversity analysis. Trends Ecol Evol 19: 497–503. https://doi.org/10.1016/j.tree.2004.07.006.
Graham CH, Moritz C, Williams SE (2006) Habitat history improves prediction of biodiversity in rainforest fauna. PNAS 103: 632–636. https://doi.org/10.1073/pnas.0505754103.
Guisan A, Thuiller W (2005) Predicting species distribution: offering more than simple habitat models. Ecol Lett 8: 993–1009. https://doi.org/10.1111/j.1461-0248.2005.00792.x.
Guisan A, Zimmermann NE (2000) Predictive habitat distribution models in ecology. Ecol Modell 135: 147–186. https://doi.org/10.1016/S0304-3800(00)00354-9.
Hijmans RJ, Cameron SE, Parra JL, Jones PG, Jarvis A (2005) Very high resolution interpolated climate surfaces for global land areas. Int J Climatol 25: 1965–1978. https://doi.org/10.1002/joc.1276.
International Plant Names Index (2019) The International Plant Names Index Collaborators [Dataset] https://doi.org/10.15468/uhllmw. Accessed via GBIF.org on 2020-09-30.
Jackson JK (1994) Manual of afforestation in Nepal. Forest Research and Survey Centre, Ministry of Forest and Soil Conservation, Kathmandu.
Jain A, Katewa SS, Galav PK, Sharma P (2005) Medicinal plant diversity of Sitamata wildlife sanctuary, Rajasthan, India. J Ethnopharmacol 102: 143–157. https://doi.org/10.1016/j.jep.2005.05.047.
Jaynes ET (1957) Information theory and statistical mechanics. Phys Rev 106, article id 620. https://doi.org/10.1103/PhysRev.106.620.
Kadambi K (1954) The silviculture of Dalbergia latifolia Roxb. Monograph of Indian trees 1. Government of India, Manager of Publications, Delhi.
Kadmon R, Farber O, Danin A (2004) Effect of roadside bias on the accuracy of predictive maps produced by bioclimatic models. Ecol Appl 14: 401–413. https://doi.org/10.1890/02-5364.
Karami R, Mehrabi HR, Ariapoor A (2015) The effect of altitude and slope in the species diversity of herbaceous plants (case study: watershed Miandar Qarootag-Gilangharb). J Appl Environ Biol Sci 5: 197–204.
Kramer‐Schadt S, Niedballa J, Pilgrim J. D, Schröder B, Lindenborn J, Reinfelder V, Stillfried M, Heckmann I, Scharf AK, Augeri DM (2013) The importance of correcting for sampling bias in MaxEnt species distribution models. Divers Distrib 19: 1366–1379. https://doi.org/10.1111/ddi.12096.
Krishnamurthy Y L, Prakasha HM, Nanda A, Krishnappa M, Dattaraja HS, Suresh HS (2010) Vegetation structure and floristic composition of a tropical dry deciduous forest in Bhadra Wildlife Sanctuary, Karnataka, India. Trop Ecol 51: 235–246.
Kumar S, Stohlgren TJ (2009) Maxent modeling for predicting suitable habitat for threatened and endangered tree Canacomyrica monticola in New Caledonia. J Ecol Nat Environ 1: 94–98.
Kumar S, Stohlgren TJ, Chong GW (2006) Spatial heterogeneity influences native and nonnative plant species richness. Ecology 87: 3186–3199. https://doi.org/10.1890/0012-9658(2006)87[3186:SHINAN]2.0.CO;2.
Loiselle BA, Jørgensen PM, Consiglio T, Jiménez I, Blake JG, Lohmann LG, Montiel OM (2008) Predicting species distributions from herbarium collections: does climate bias in collection sampling influence model outcomes? J Biogeogr 35: 105–116. https://doi.org/10.1111/j.1365-2699.2007.01779.x.
Louppe D, Oteng-Amoaka AA, Brink M (eds) (2008) Plant resources of tropical Africa. Prota 7: 562–563.
McColl RW (ed) (2014) Encyclopedia of world geography. Infobase Publishing. ISBN 978-0-8160-7229-3.
Merow C, Smith MJ, Silander Jr JA (2013) A practical guide to MaxEnt for modeling species’ distributions: what it does, and why inputs and settings matter. Ecography 36: 1058–1069. https://doi.org/10.1111/j.1600-0587.2013.07872.x.
MoFSC (2014) Nepal national biodiversity strategy and action plan 2014–2020. Government of Nepal Kathmandu, Ministry of Forests and Soil Conservation, Singhadurbar, Kathmandu, Nepal.
Nath CD, Pélissier R, Ramesh BR, Garcia C (2011) Promoting native trees in shade coffee plantations of southern India: comparison of growth rates with the exotic Grevillea robusta. Agroforest Syst 83: 107–119. https://doi.org/10.1007/s10457-011-9401-8.
Nic Lughadha E, Bachman SP, Leão TCC, Forest F, Halley JM, Moat J, Acedo C, Bacon KL, Brewer RFA, Gâteblé G, Gonçalves SC, Govaerts R, Hollingsworth PM, Krisai-Greilhuber I, de Lirio EJ, Moore PGP, Negrão R, Onana JM, Rajaovelona LR, Razanajatovo H, Reich PB, Richards SL, Rivers MC, Cooper A, Iganci J. Lewis GP, Smidt EC, Antonelli A, Mueller GM, Walker BE (2020). Extinction risk and threats to plants and fungi. Plants People Planet 2: 389–408. https://doi.org/10.1002/ppp3.10146.
O’Donnell MS, Ignizio DA (2012) Bioclimatic predictors for supporting ecological applications in the conterminous United States. U.S. Geological Survey Data Series 691. https://doi.org/10.3133/ds691.
Ortega-Huerta MA, Townsend Peterson A (2008) Modeling ecological niches and predicting geographic distributions: a test of six presence-only methods. Revista Mexicana de Biodiversidad 79: 205–216.
Orwa C, Mutua A, Kindt R, Jamnadass R, Simons A (2009) Agroforestree database: a tree reference and selection guide, version 4.0. World Agroforestry Centre, Kenya.
Padal SB, Murty PP, Rao DS, Venkaiah M (2010) Ethnomedicinal plants from Paderu division of Visakhapatnam district, A.P, India. J Phytol 2: 70–91.
Pearson R. G, Raxworthy C. J, Nakamura M, Townsend Peterson A. (2007) Predicting species distributions from small numbers of occurrence records: a test case using cryptic geckos in Madagascar. J Biogeogr 34: 102–117. https://doi.org/10.1111/j.1365-2699.2006.01594.x.
Phillips SJ, Anderson RP, Schapire RE (2006) Maximum entropy modeling of species geographic distributions. Ecol Modell 190: 231–259. https://doi.org/10.1016/j.ecolmodel.2005.03.026.
Praciak A, Pasiecznik N, Sheil D, van Heist M, Sassen M, Sousa Correia C, Dixon C, Fyson G, Rushforth K, Teeling C (eds) (2013) The CABI encyclopedia of forest trees. CABI, Oxfordshire, UK.
Saran S, Joshi R, Sharma S, Padalia H, Dadhwal VK (2010) Geospatial modeling of Brown oak (Quercus semecarpifolia) habitats in the Kumaun Himalaya under climate change scenario. J Indian Soc Remot 38: 535–547. https://doi.org/10.1007/s12524-010-0038-2.
Selvaraju A, Ayyanar M, Rathinakumar SS, Sekar T (2011) Plants used in ethno-veterinary medicine by malayali tribals in Salem district of Tamil Nadu, India. Med Plants - Int J Phytomed Relat Ind 3: 209–215. https://doi.org/10.5958/j.0975-4261.3.3.034.
Seto KC, Güneralp B, Hutyra LR (2012) Global forecasts of urban expansion to 2030 and direct impacts on biodiversity and carbon pools. PNAS109: 16083–16088. https://doi.org/10.1073/pnas.1211658109.
Soerianegara I, Lemmens RHMJ (eds) (1994) Timber trees: major commercial timbers. PROSEA: Plant Resources of South-East Asia 5/1.
Stanton JDA (1972) Forest of Nepal. John Murray Publishers, London.
Stevens GC (1992) The elevational gradient in altitudinal range, an extension of Rapoport’s latitudinal rule to altitude. Am Nat 140: 893–911. https://doi.org/10.1086/285447.
Tchoundjeu Z, Atangana A. R (2011) Irvingia gabonensis (Aubry-Lecomte ex O’Rorke) Baill. In: van der Vossen HAM, Mkamilo GS (eds) [Internet] Record from Protabase. PROTA, Wageningen, Netherlands.
Thapa HB (2004) Early growth, thinning yield and estimated biomass of standing trees of Dalbergia latifolia Roxb. in the eastern Terai, Nepal. Banko Janakari 14: 31–40. https://doi.org/10.3126/banko.v14i1.17057.
Thomson L (2000) South Pacific regional initiative on forest genetic resources (SPRIG) – phase 2. Forest Genetic Resources 28: 39–40. FAO, Rome.
Troup RS (1921) The silviculture of Indian trees. Published under the authority of His Majesty’s Secretary of State for India in Council. Clarendon Press, Oxford. https://doi.org/10.5962/bhl.title.24363.
Uddin K, Shrestha HL, Murthy MSR, Bajracharya B, Shrestha B, Gilani H, Pradhan S, Dangol B (2015) Development of 2010 national land cover database for the Nepal. J Environ Manage 148: 82–90. https://doi.org/10.1016/j.jenvman.2014.07.047.
Wiens JJ (2011) The niche, biogeography and species interactions. Philos Trans R Soc Lond B Biol Sci 366: 2336–2350. https://doi.org/10.1098/rstb.2011.0059.
Wisz MS, Hijmans RJ, Li J, Townsend Peterson A, Graham CH, Guisan A, NCEAS Predicting Species Distributions Working Group (2008) Effects of sample size on the performance of species distribution models. Divers Distrib 14: 763–773. https://doi.org/10.1111/j.1472-4642.2008.00482.x.
Xu D, Zhuo Z, Wang R, Ye M, Pu B (2019) Modeling the distribution of Zanthoxylum armatum in China with Maxent modeling. Glob Ecol Conserv 19, article id e00691. https://doi.org/10.1016/j.gecco.2019.e00691.
Yang X-Q, Kushwaha SPS, Saran S, Xu J, Roy PS (2013) Maxent modeling for predicting the potential distribution of medicinal plant, Justicia adhatoda L. in Lesser Himalayan foothills. Ecol Eng 51: 83–87. https://doi.org/10.1016/j.ecoleng.2012.12.004.
Yi Y, Cheng X, Yang Z-F, Zhang S-H (2016) Maxent modeling for predicting the potential distribution of endangered medicinal plant (H. riparia Lour) in Yunnan, China. Ecol Eng 92: 260–269. https://doi.org/10.1016/j.ecoleng.2016.04.010.
Total of 58 references.
