Eva-Maria Nordström  ,
Hampus Holmström,
Karin Öhman
,
Hampus Holmström,
Karin Öhman
Evaluating continuous cover forestry based on the forest owner’s objectives by combining scenario analysis and multiple criteria decision analysis
Nordström E.-M., Holmström H., Öhman K. (2013). Evaluating continuous cover forestry based on the forest owner’s objectives by combining scenario analysis and multiple criteria decision analysis. Silva Fennica vol. 47 no. 4 article id 1046. https://doi.org/10.14214/sf.1046
Highlights
- Scenario analysis and multiple criteria decision analysis were combined to evaluate alternative forest management strategies for Linköping municipality, Sweden
- Continuous cover forestry (CCF) promoted ecological and social objectives better than even-aged forestry but was worse for economic objectives
- Ecological and social objectives were important to the municipality and thus, in summary, CCF seemed to be a suitable strategy.
Abstract
Forests are increasingly managed both to provide a sustainable yield of timber and for supplying a range of ecosystem services in line with the concept of sustainable forest management. Several incommensurable interests must then be considered, and it is necessary to strike a balance between different objectives. In evaluation of trade-offs to be made, both objective factors and subjective values need to be taken into account. In recent years, continuous cover forestry (CCF) has been put forward as an alternative to even-aged forestry. The aim of this study was to use scenario analysis in combination with multi criteria decision analysis (MCDA) to evaluate whether CCF is a suitable strategy based on the decision makers’ objectives and preferences for sustainable forest management in a specific landscape. This approach was applied to a planning case on the forest estate of the Linköping municipality in southwestern Sweden. The scenario analyses provided insights into relevant quantitative factors, while the MCDA evaluation helped in clarifying the objectives of the forest management and in assessing the relative importance of various objectives. The scenario analyses showed that in this case CCF is a good management strategy in ecological and social terms but yields worse economic outcomes than conventional even-aged forestry. In the Linköping case, there was a relatively strong emphasis on ecological and social aspects and thus, in summary, CCF seemed to be the most suitable option.
Keywords
forest planning;
decision making;
sustainable forest management;
uneven-aged forestry
-
Nordström,
Swedish University of Agricultural Sciences, Department of Forest Resource Management, Skogsmarksgränd, SE-901 83 Umeå, Sweden
E-mail
eva-maria.nordstrom@slu.se
- Holmström, Swedish University of Agricultural Sciences, Department of Forest Resource Management, Skogsmarksgränd, SE-901 83 Umeå, Sweden E-mail hampus.holmstrom@slu.se
- Öhman, Swedish University of Agricultural Sciences, Department of Forest Resource Management, Skogsmarksgränd, SE-901 83 Umeå, Sweden E-mail karin.ohman@slu.se
Received 26 February 2013 Accepted 9 October 2013 Published 20 November 2013
Views 165886
Available at https://doi.org/10.14214/sf.1046 | Download PDF

1 Introduction
Increasing focus on sustainable forest management means that nowadays forests are managed not only to provide a sustainable yield of wood but also for supplying a range of other ecosystem services. In addition, multifunctional forest management frequently concerns multiple values and perspectives, and inevitable trade-offs among conflicting objectives, e.g., in publicly owned forests. This has led to a search for alternatives to even-aged forestry, which has been the standard management system in northern Europe and other parts of the boreal zone over the last 60 years (Oleskog et al. 2008). In even-aged forestry the forest is divided into stands and a cycle of final felling, regeneration and thinning is performed over the course of each rotation period to produce a relatively homogeneous forest structure within each stand with respect to age, height, diameter, and in many cases, species composition. For instance, forestry in Finland and Sweden is highly mechanized and relies on harvesting technologies designed for even-aged forest management. Even-aged forestry is therefore typically considered to be the economically and technically optimal management system in these countries. An alternative that has been mentioned and that have received increased attention in Scandinavia is continuous cover forestry (CCF). CCF is “characterized by selective harvesting; the stand age is undefined and forest development does not follow a cyclic harvest-and-regeneration pattern” (Gadow 2001, in Pommerening and Murphy 2004). There is ongoing research and debate on how these alternative management systems, even-aged forestry and CCF, fulfill the objectives of sustainable forest management (Kuuluvainen et al. 2012). For example, in old forests that have historically been subjected to selective felling but have never been clear felled, CCF is considered to promote ecological objectives because these forests contain species that depend on forest continuity (Jonsson et al. 2005). In urban forests, CCF may be more compatible with recreational use because it does not generate clear-felled areas (Rydberg and Falck 2000). Studies on the effects of CCF on economic output show mixed results (Kuuluvainen et al. 2012). In comparing the economic performance of CCF with even-aged forestry, some studies conclude that even-aged foresty is generally superior (e.g., Wikström 2000; Andreassen and Øyen 2002), while others find that CCF perform better than even-aged forestry (e.g., Tahvonen at al. 2010). The differences between the studies depend to a large extent on the model setup, and factors that seem to be influential are the economic assumptions (e.g., harvesting costs and discount rate), the initial state of the forest (i.e., standing stock, age structure, and, for even aged stands, stand age), as well as the growth models used (e.g., rate of ingrowth) (Knoke 2012; Kuuluvainen et al. 2012). Many of the field studies (e.g., Erefur et al. 2008) and modeling studies (e.g., Wikström 2000; Pukkala et al. 2011) on CCF have focused on its effects at the stand level. There have been few investigations into its economic, social, and ecological impact at the landscape level (Axelsson et al. 2007; Knoke 2012) and, to our knowledge, none in relation to the forest owners goals.
Scenario analysis is one potential tool that can be used to predict the long-term effects of specific forest management systems on ecosystem services based on forest inventory data and growth models. However, in addition it is necessary to make trade-offs between conflicting objectives, and the various scenarios will have different outcomes with respect to each of the objectives considered. The optimal scenario in any given case will thus be partially determined by the preferences of the decision maker, and it is necessary to perform preference modeling when evaluating scenarios in order to make appropriate compromises between different objectives. Thus, when evaluating different management systems, we need tools that can predict their effects on ecosystem services but also methods that can take subjective preferences of decision makers into account. A promising method that has been suggested for explicitly including the preferences of decision makers and stakeholders in forest planning is multiple criteria decision analysis (MCDA) (e.g., Kangas et al. 1996; Pykäläinen et al. 1999; Kangas et al. 2001; Ananda and Herath 2003; Sheppard and Meitner 2005; Pykäläinen et al. 2007; Hiltunen et al. 2008; Nordström et al. 2010). MCDA is an umbrella term describing a collection of formal approaches for handling cases in which multiple conflicting objectives must be considered in the planning process and for analyzing their relative importance. Performing this analysis supports and augments the decision maker’s knowledge and understanding of their preferences for the objectives. Therefore, we propose that integrating MCDA with scenario analysis can support the planning process by providing a tool for structuring and organizing the evaluation of scenarios, e.g., in the case of evaluating effects of different management systems.
The objective of this study is to evaluate whether CCF is a suitable strategy based on the decision makers’ objectives and preferences for sustainable forest management in a specific landscape. This is done by combining scenario analysis with MCDA since the evaluation and choice of management system in a particular planning situation should depend both on the present and future state of the forest as well as on the objectives and preferences of the decision maker.
The combined approach was applied in a planning process for the forest estate of Linköping municipality in southwestern Sweden. In the first step of the forest planning process, the objectives and the structure of the problem were defined. Next, three scenarios involving different levels of CCF were generated using the Heureka system (Wikström et al. 2011). Finally, these scenarios were evaluated with respect to each of the objectives and the relative importance of each objective was assessed using MCDA method, resulting in a ranking of the scenarios according to the preferences of the decision makers.
2 Material and methods
2.1 Scenario analysis using the Heureka decision support system
One of the main tools used to evaluate the effects of CCF in this work was scenario analysis, performed using the Heureka forest decision support system. The Heureka system is a decision support system for the analysis and planning of forest landscape management that was recently developed at the Swedish University of Agricultural Sciences (Wikström et al. 2011). The foundation of the Heureka system is projections of the tree cover development. Data on current forest conditions, the applied management actions, and known ecosystem processes are used to predict the future state of the forest and the provision of ecosystem services. Forecasts can be made for a large number of variables, including common forest variables such as timber volume, age, species distribution and the output of various primary products (sawlogs, pulpwood, and biomass) as well as factors such as recreation index and the amount of carbon storage in trees and soil. The Heureka system requires input data in the form of stand registers and maps. Once this has been provided, scenarios are simulated in two steps: (1) treatment simulation, and (2) treatment selection. In step 1, a number of alternative treatment schedules are generated for each stand in the area to be analyzed. A treatment schedule is a sequence of treatments (e.g., regeneration, thinning and clear cutting) that is performed over the period covered by the simulation. Treatment schedules are generated by assigning the stands in the area to different management systems, which are associated with specific management categories that control the generation of treatment schedules. In step 2, a result in the form of a management plan or a scenario is selected by assigning a single treatment schedule to each stand. The most appropriate treatment schedule for each stand is selected using the system’s built-in optimization tool based on the overall objective function and specified constraints.
CCF is implemented in Heureka as a continually repeated series of selective harvests. Because it does not involve any final felling or clear cutting, CCF management regimes cannot be defined in terms of rotation periods. By default, the selective harvests are simulated as thinnings from above, i.e., harvesting of the largest trees, following a pre-defined selection guide. The type of harvest (from above or from below, the tree species targeted, etc.) and the volume to harvest, as well as the interval between two sequential selective harvests, can be re-defined by the user to adapt the simulation to the conditions at hand. Models for natural regeneration are used to simulate the ingrowth of new trees, which is likely to occur to fill in gaps in the canopy generated by harvesting, and it is assumed that planting is not needed. The harvesting costs are variable relative to the volume harvested and are calculated based on spatial individual tree models. There are no fixed costs included. A more detailed discussion on the simulation of CCF using Heureka and the related economic calculations has been presented by Wikström (2008).
2.2 Multiple criteria decision analysis
The other main tool used to evaluate the effects of CCF in this study was MCDA; i.e., more specifically, the SMART method. MCDA is a tool for analyzing complex problems that cannot be solved using ordinary unstructured decision making. The various MCDA techniques that are available can be classified in a number of ways. One of the common classifications distinguishes between Multiple Objective Decision Analysis (MODA) and Multiple Attribute Decision Analysis (MADA) (Malczewski 1999). The major difference between these two groups is the number of alternatives that are evaluated. In a forestry context, MODA techniques can be used to generate a number of management plans that cannot be improved with respect to one objective without impairing the outcome for other objectives. MADA techniques, on the other hand, can be used to select the best alternative from a limited number of options. For example, in a forestry context, MADA could be used in situations where it is necessary to evaluate the performance of a limited number of management scenarios for a landscape with respect to timber production, biodiversity, and recreational use.
2.2.1 The SMART method
The MCDA technique used in this work is a MADA variant from the SMART method family (Simple Multi-Attribute Rating Technique) (von Winterfeldt and Edwards 1986). This approach has been used in a number of studies on multi-objective forest planning (Kajanus et al. 2004; Ananda and Herath 2009). In this work, we followed the procedure described in Kangas and Kangas (2005), which requires that the objectives and available solutions be identified and formulated in an objective hierarchy. Objectives can be defined as statements of something that one wants to achieve. They are commonly expressed with reference to some variable and have a preferential direction, i.e., they are of the form “an increase in this variable is desirable” or “a decrease in this variable is desirable” (Keeney 1992). A hierarchy can be defined as a tree-like structure in which objectives are organized according to how they relate to one-another. After the objective hierarchy has been established, points are assigned to each of the alternatives (which in this case are the different scenarios) and to the different objectives based on the decision maker’s preferences. For each objective, the decision maker gives a score of 100 to the scenario that he or she thinks performs best for that particular objective. Proportionally smaller scores are then given to the other scenarios according to their performance with respect to the objective in question. Multiple scenarios can be given the same score if the decision maker so chooses. This process is repeated until scores have been assigned for each scenario with respect to every objective. The next step involves ranking the importance of the different objectives. The decision maker assigns a score of 100 to the most important objective, with less important objectives receiving proportionally smaller scores. This process is repeated for each level and branch of the objective hierarchy. Once all scenarios and objectives have been evaluated, the scores are converted into weightings between 0and 1. If there are multiple decision makers, weightings are first calculated for each decision maker separately and then an average of the individual weightings is calculated to produce a common weighting. The result is a ranking of the alternatives based on the preferences of the decision makers.
3 Case study
3.1 Linköping’s municipal forests
The municipality of Linköping currently owns approximately 2600 hectares of forest, most of which is situated close to the city of Linköping. These forests are used extensively for recreational purposes by the area’s inhabitants. In addition, 340 ha of the forest lands are protected nature reserves. The average standing stock density is 151 m3sk/ha, and the forest consists primarily of spruce (Picea abies) dominated sites (60%) with an average annual growth of 8.6 m3sk/ha. The remaining area is pine (Pinus sylvestris) dominated sites and has an average annual growth of 5.9 m3sk/ha. The forest’s current average stand age is 68 years.
The forestry is certified by the Forest Stewardship Council (FSC), which means that it must be managed in a way that satisfies ecological, social and economic sustainability requirements (FSC 2010). There is a forest management plan that is especially focused on recreation and also a policy for the municipality forest estate. The management plan places special emphasis on the forest’s recreational uses. In the municipality’s policy, the forest is classified into three different zones based on its recreational value (Linköpings kommun 2006). Zone 1 is the so-called “recreation forest” and consists of sites that are adjacent to residential areas and recreational facilities. These sites are very valuable for recreation and are regularly visited by large numbers of people. They also provide important play areas for children. Zone 2 is referred to as “recreation forest with some production forestry” and is also used for recreation. People often visit this zone for specific recreational activities, and may move across large areas of land while doing so. Typical visitors to this zone include runners, horse riders, cyclists and hikers. Zone 3 is known as “production forest with general consideration for environmental values” and consists of sites that see the least recreational usage. The forests within each zone are managed according to different guidelines, and the purpose of the zoning is to facilitate management that accommodates diverse recreational activities as well as productive forestry. Because CCF is considered to be superior to even-aged forestry in terms of creating socially and recreationally useful urban forests, the municipal authorities wanted to examine the long-term consequences of applying CCF across the majority of their forested holdings. The authors of this paper were therefore asked to design and perform an evaluation process. The case study and the results are presented in a working report in Swedish intended for the municipality and users of the Heureka system (Öhman et al. 2013).
3.2 The process
3.2.1 The Intelligence phase
The approach used to evaluate CCF followed the general planning process suggested by Simon (1960) and consisted of three phases: (i) Intelligence, (ii) Design, and (iii) Choice (Fig. 1).
The aim of the intelligence phase was to define the problem. In this study, this meant defining the objectives that CCF should be evaluated against. The phase was initiated during a one-day meeting with the municipality’s forest manager and ecologist. In this meeting, a general outline of the process was presented by the authors and the expectations of the forest manager and the ecologist were discussed. In addition, the objectives of the municipality were discussed. The objectives proposed in the meeting, together with the statements in the municipality’s general forest policy (Linköpings kommun 2006), its environmental protection program (Linköpings kommun 2008), and the forest management plan, were then used to construct an objective hierarchy.
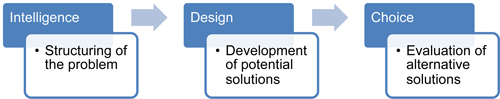
Fig. 1. The general three phase planning process described by Simon (1960) that was adapted to and used in the case study of Linköping.
3.2.2 The Design phase
The aim of the second phase was to generate three different scenarios (A, B and C) in which CCF was applied to different proportions of the municipality’s forest holdings. For each scenario, the expected outcome with respect to each of the objectives was predicted over a 100 year period, which is the commonly used horizon for long-term forest planning as it covers a rotation period. The longer the horizon, the more the uncertainty of the projections increases. The scenarios were developed using the two step procedure of the Heureka system, (see section 2.1). In the first step, the treatment simulation, a set of treatment schedules was simulated for each stand. In scenario A, the objective was to mimic as closely as possible the management regime outlined in the current forestry policy of the municipality. For zone 1 this meant that for 25% of the forest only treatment schedules applying no management at all were simulated, and for the rest of the area treatment schedules applying CCF were simulated. In zone 2, schedules applying no management at all were simulated for 25% of the forest area. For the rest of the area, schedules applying a management with prolonged rotations and promoting broadleaves were simulated. In zone 3 treatment schedules consisting of conventional thinnings and clear cuttings were simulated. The purpose of scenario B was to simulate a management were CCF was used to the greatest possible extent. Thus, for scenario B, CCF-based treatment schedules were applied to zone 3 stands, while stands in zones 1 and 2 were treated according to the current policy. The schedules were thus generated in the same way as in scenario A for zone 1 and 2. Scenario C was designed to represent a compromise between even-aged forestry and CCF. Therefore, treatment schedules applying both conventional even-aged forestry and CCF were simulated for all of the zone 3 stands. Stands in zones 1 and 2 had schedules simulated based on the current policy in the same way as scenario A and B.
In this study, CCF was simulated using the default settings in Heureka. Thus, thinning from above was applied. The harvested volume was between 20–40% in each thinning. The lowest allowable standing stock after thinning was define by §10 in the Swedish Forestry Act (SFS 1979:429), which sets a lower limit for the standing stock after thinning.
In the second step, treatment selection, a single treatment schedule was selected for each stand using an optimization model consisting of an objective function and constraints. In scenario A, the net present value (NPV), i.e., the discounted revenues and costs from future forestry (e.g., Wikström 2000), was maximized under the constraint that all stands should be managed with even-aged forestry. In scenario B, the NPV from future forestry was maximized under the constraint that all stands in zone 3 should be managed with CCF. In scenario C, the area managed using CCF was maximized under the constraint that the NPV should not be less than 90% of the NPV achieved using only conventional even-aged forestry, i.e., the NPV for scenario A. For all three scenarios, the discount rate used for calculating NPV was 2%. Two common constraints were applied to all three scenarios: (i) an even-flow constraint requiring that the harvested volume for any one simulated five year period did not deviate from the average harvested volume for all five year periods by more than 10%, and (ii) a adjacency constraint that prevented the size of any clear cut from being greater than five hectares in any one five year period. The optimization model was thus a typical standard model I formulation (Johnson and Scheurman 1977), with the exception of the adjacency restrictions and the binary constraints for the decision variables. The model was formulated with the optimization modeling system included in the Heureka system and the stated problem was solved using a traditional branch and bound algorithm with CPLEX 11.0.
3.2.3 The Choice phase
The aim of the third phase was to determine the preferences of the decision maker for the different scenarios with respect to their outcomes and to assess the relative importance of the different objectives using the SMART method. In the choice phase, the forest manager and the municipal ecologist (henceforth referred to as the decision makers) participated in a one day workshop during which they evaluated the various scenarios using the SMART method as implemented in the Heureka system (Wikström et al. 2011). Before the evaluation was conducted, they were given a brief overview of the methods used to generate the different scenarios and of how the MCDA software works. The decision makers were provided with computers that had the Heureka system installed and the scenarios already set up. The scenarios were presented in figures that illustrated the outcomes of the three different scenarios for each objective over the entire planning horizon. In addition, we provided a table that showed the average value of each objective over time, the average trend in each objective over time, the variation in each objective, and the maximum and minimum values for each objective over the entire planning horizon for all three scenarios. This was done to give the decision makers an idea of the variation and trends in the data. The decision makers were then told how to use the SMART method to express their prioritization of the different scenarios with respect to each objective, and how to express their prioritization of the different objectives. These prioritizations were converted into weightings; individual weightings were calculated for each individual maker, and average weightings were then computed based on the two sets of individual weightings. The results of the exercise were presented and discussed towards the end of the workshop, and a sensitivity analysis was performed to show the consequences of changing the decision makers’ prioritizations in various directions.
4 Results
The main output of the intelligence phase was an objective hierarchy describing the objectives of Linköping municipality (see Fig. 2 and Table 1). The design phase generated three scenarios, whose outcomes with respect to the objectives are summarized in Table 2 (for see outcomes of the scenarios on each criterion, see Appendix A, Fig. A1-A13). In the SMART evaluation performed during the choice phase the decision makers relied mainly on Fig. A1-A13 for illustration. The table showing various measures of variations over time was not as useful to them and it was not possible to determine whether anyone measure of variation was more useful for a criterion than others.
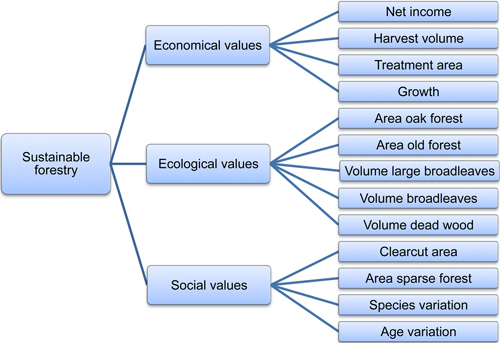
Fig. 2. Objective hierarchy for the case study stated by the municipality’s forest manager and the ecologist alongside the statements in the municipality’s general forest policy.
| Table 1. A description of the objectives considered when drawing up the objective hierarchy. | |
| Objective | Description |
| Net income (SEK) | The net income from forestry measured in Swedish Crowns (SEK). In Heureka, the net income was defined as revenues minus costs. |
| Harvested volume (m3/ha and year) | The volume of harvested wood. If harvest levels are relatively even over time, there will be a even flow of wood for industrial uses, the forest will produce an even income, and the age distribution of its trees will be relatively even over time. In Heureka, the harvested volume was defined as the total harvested volume, which includes wood obtained from final fellings, thinnings, selective fellings and fellings of shelterwood and seed trees. |
| Treated area (ha and year) | The area undergoing harvesting, i.e., final felling or thinning, or any silvicultural treatment, e.g., cleaning, fertilization, soil preparation or planting. If a large area is to be treated in a given period, this may require more time or resources than are available. In Heureka, the treated area was defined as the sum of the total harvested area and the area to which any silvicultural treatments were being applied. |
| Average growth (m3/ha and year) | The average annual growth for the landscape considered. A high and even growth indicates that the forest is being optimally and sustainably managed. In Heureka, the average growth was defined as the annual gross growth, i.e., natural mortality was accounted for. |
| Area oak forest (ha) | The presence of oak forests can increase biodiversity at both the stand and the landscape level, since many rare species depend on oaks. In Heureka, the area of oak forest was defined as the area of forest in which oaks accounted for more than 25% of the standing wood volume. |
| Area old forest (ha) | Old forests are becoming increasingly rare, but they are important for biodiversity because many species rely on them. In Heureka, the area of old forest was defined as the area of forest older than 90 years. |
| Volume large broadleaves (m3/ha) | Large broadleaved trees are becoming rare and are important for biodiversity because many species are dependent on old and large broadleaves. In Heureka, the volume of large broadleaves was defined as the volume of broadleaves with a diameter greater than 25 cm (at 1.3 m from the ground). |
| Volume broadleaves (m3/ha) | Broadleaves in general are important for biodiversity since many species are dependent on them. In Heureka, the broadleaf volume was defined as the total volume of all broadleaved tree species. |
| Volume dead wood (m3/ha) | Dead wood is important for biodiversity because many species depend on its presence. In Heureka, the dead wood volume was defined as the volume of raw and hard dead wood, i.e., dead wood belonging to decay classes 0 and 1 (in Heureka) or hard dead wood according to the definition used in the Swedish National Forest Inventory (SLU, 2012). |
| Clearcut area (ha) | Clearcut areas are areas where final felling recently has been performed and a new forest has not yet been established. In Heureka, the clearcut area was defined as the sum of the area allocated for final felling and the area of forest younger than 5 years. |
| Area sparse forest (ha) | Sparse forest is the typical recreational forest – it is quite light and has good visibility. In Heureka, sparsely forested areas were defined as forest sites with trees heights above 10 m and fewer than 1000 stems per ha. |
| Variation in tree species (share of coniferous trees) | Variation in tree species may increase the recreational value of the forest. Spruce and pine are the most common tree species in Swedish forests, so the relative abundance of coniferous trees was used as a proxy for tree species variation. In Heureka, the variation in tree species was defined as the proportion of the total wood volume in each stand from coniferous species. |
| Variation in age (years) | Old forests have a high recreational value, but variation in tree age can also increase a forest’s recreational value by creating variation at the landscape level. In Heureka, the variation in age was defined as the standard deviation in the total age of the forest (expressed as a percentage of the average age). |
| Table 2. The outcome for the three scenarios in terms of the mean value for each objective over the entire 100 year horizon of the simulation. | |||
| A | B | C | |
| Net income (SEK) | 1 861 512 | 1 313 356 | 1 672 569 |
| Harvested volume (m3/ha and year) | 3.52 | 2.46 | 3.11 |
| Treated area (ha and year) | 111.37 | 86.90 | 102.08 |
| Average growth (m3/ha and year) | 4.88 | 3.89 | 4.48 |
| Area oak forest (ha) | 372.85 | 437.50 | 389.83 |
| Area old forest (ha) | 1022.26 | 1453.13 | 1195.49 |
| Volume large broadleaves (m3/ha) | 51.46 | 63.25 | 57.59 |
| Volume broadleaves (m3/ha) | 70.18 | 83.65 | 78.14 |
| Volume dead wood (m3/ha) | 6.52 | 7.28 | 6.89 |
| Clearcut area (ha) | 52.71 | 0.26 | 25.94 |
| Area sparse forest (ha) | 1399.03 | 1890.81 | 1641.39 |
| Variation in tree species | 34.6% | 35.3% | 34.8% |
| Variation in age | 35.82 | 29.55 | 32.27 |
The SMART procedure resulted in weights for the objectives and weights for the alternatives in terms of each objective. These data were pooled to produce an overall ranking of the different scenarios based on the preferences of the decision makers (see Figs. 3–5). Based on this overall ranking, scenario B seems to be the most suitable for the municipality of Linköping, given the preferences expressed by the forest manager and the municipal ecologist (Fig. 3). The ecologist ranked scenario B highest, while the forest manager ranked scenarios B and C equally highly. Scenario A, which involved the use of even-aged forestry in all three zones, was the least preferred option.
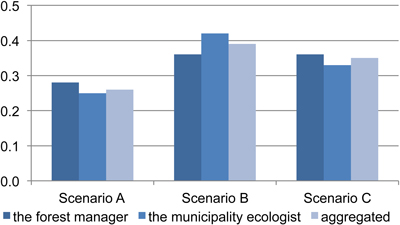
Fig. 3. Overall ranking of the three scenarios for the municipality of Linköping.
Scenario B was given the lowest ranking in economic terms (Fig. 4a). Based on their individual evaluations of the scenarios, the ecologist considered scenario A to be the best economically while the forest manager ranked scenario C more highly in this sense. Scenario B, which primarily involved uneven-aged forestry, seemed to be the preferred option with respect to ecological objectives, followed by the compromise alternative of scenario C. Scenario A, which was based on exclusively even-aged forestry had the lowest ecological ranking (Fig. 4b). With respect to the social objectives, the ecologist assigned the highest ranking to scenario B, while the forest manager assigned equally high rankings to scenarios B and C (Fig. 4c). Scenario A again received the lowest ranking in this case (Fig. 4c).
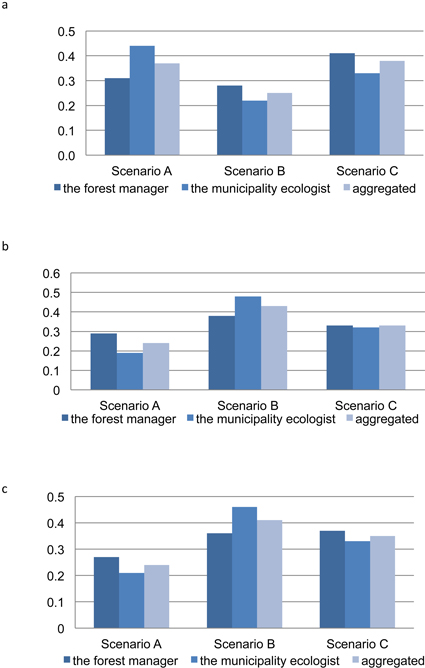
Fig. 4. Ranking of the three scenarios for the municipality of Linköping from a) the economic perspective, b) the ecological perspective and c) the social perspective.
Net income was considered to be the most important economic objective by a long way (Fig. 5a). However, the forest manager also assigned some importance to harvested volume, treated area and average growth, all of which are related to silviculture in some way (Fig. 5a). All of the ecological objectives were given relatively similar overall weightings (Fig. 5b). However, the ecologist considered the oak forest area, volume of dead wood and old forest area to be somewhat more important than the other ecological objectives (Fig. 5b). The most important social objective was minimizing the clear cut area, while the extent of sparsely forested areas and the level of tree species variation were considered less important. The least important social variable was the variation in tree age (Fig. 5c).
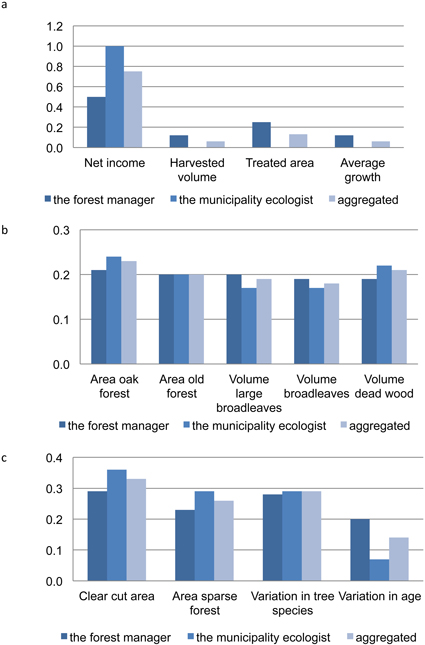
Fig. 5. Ranking of a) the economic objectives, b) the ecological objectives and c) the social objectives.
5 Discussion
The complexity of forest management planning has increased over the last few decades. Today, a broad set of objectives must be considered in the decision making process. The case study presented here illustrates the sort of problems that forest managers may encounter where economic, ecological and social values need to be considered. Unlike previous studies on this topic, the present study emphasizes both long-term effects on different ecosystem services and the relative importance of different objectives for evaluating CCF in a specific case. The results from the scenario analysis show that the CCF strategy performed better for almost all ecological and social objectives but is worse from an economic perspective. This contradicts previous estate-level studies of the economics of CCF (Knoke 2012). The MCDA evaluation showed that the decision makers placed a high priority on ecological and social objectives in Linköping, so CCF (Scenario B) seems to be the most suitable option in this case.
In an evaluation of this sort, which is designed to help forest owners to select an appropriate forest management strategy, both objective facts and subjective values need to be considered. In the Linköping case, the scenario analyses performed using the Heureka system based on data from the forest management plan provided factual information to support decision making, while the MCDA evaluation helped the decision makers to clarify their objectives and their preferences with regard to these objectives. However, while the results obtained clearly show that scenario analysis in conjunction with MCDA can be a valuable tool for combining information on objective facts and subjective values to obtain a better understanding of the problem at hand, some limitations of the method and possible improvements need to be addressed.
A critical issue in the scenario analysis is the accuracy with which the Heureka system models CCF, since the diverging outcome on economic performance of CCF compared with existing estate-level studies most likely results from differences in modeling approach and assumptions. Heureka is an advanced forest decision support system with sophisticated and realistic models. These are used to create so-called model forests that represent present and future states of the studied forest. These model forests are created starting at year zero of the simulation, since the initial state of the forest is actually a representation or model of the real forests based on forest data. The forests analyzed in Heureka are thus models of reality, which we assume to be broadly accurate. The growth and yield models in Heureka are primarily based on data for forests managed using an even-aged approach. Since there is relatively little historical forest data on the effects of CCF, the growth and yield models used today may be less reliable for simulating CCF than for even-aged forestry. However, tests comparing data from historical selective cuttings to results obtained using models suggest that the models’ predictions are accurate enough to be useful in such cases (Wikström 2008). Another issue that should be mentioned is how the effect of applying CCF to initially even-aged forest is simulated in Heureka. In reality, to continually manage even-aged forest with CCF means that the forest will be transformed into uneven-aged forest. This transition phase may be long, most likely exceeding the 100 year planning horizon in this study, and economic output from CCF may be lower in the transition phase compared with the final uneven-aged stage (Schou et al. 2012). The length of the transition phase will vary depending on the initial state of the forest and how CCF is applied. Since CCF is simulated as repeated thinnings from above in this case study, the transition phase will generally be very long. In addition, the limit for lowest allowable standing stock after thinning set by the Forestry Act may prolong the transition, decrease the economic output and impair the natural regeneration (Kuuluvainen et al. 2012). However, our aim is not to evaluate CCF in general, but to evaluate the consequences of applying CCF in the Linköping case in terms of the effects on the objectives of the decision makers. Thus, in evaluating the effects of CCF in this specific case we have to take into account that the initial state of the forest in Linköping is in reality to a large extent even-aged. Potentially CCF could have performed better with regard to the economic criteria if a larger part of the forest would have been uneven-aged initially.
One of the most important questions to answer regarding MCDA is “what should be considered when using MCDA and how should the method be implemented in practice”? The choice of specific MCDA method should be adapted to the specific planning situation at hand and to the characteristics of the situation, e.g., the number of decision makers and their level of expertise as well as the number and nature of the available options and objectives (Guitoni and Martel 1998; Nordström et al. 2010). In this case, the decision makers had no previous knowledge of MCDA or training in its use, and the evaluation was performed in a single session. We therefore chose to use SMART, since it is a relatively straightforward method and is implemented in the Heureka system. AHP (Saaty 1990), which is also implemented in the Heureka system, could potentially have been a viable alternative to SMART. However, we considered it to be more demanding for the decision makers, given the short period of time available for learning. Inadequate understanding of the pairwise comparisons that AHP relies on could have resulted in the articulation of inconsistent preferences (Nordström et al. 2010). In the case study, three realistic scenarios involving different degrees of CCF were developed, all of which could reasonably be implemented in practice. Only three scenarios were considered in order to keep the evaluation process from becoming excessively demanding for the decision makers. However, because of the limited number of scenarios considered, it is likely that some potentially interesting mix of CCF and even-aged forestry were overlooked. In general, a wide range of alternatives is available when dealing with forest planning problems because there will usually be a large number of stands to consider, all of which can be assigned to different treatments at different points in time (Rauscher et al. 2000). Forest planning problems are therefore typically MODA-type problems. When such problems are addressed using a MADA approach (as was done in this case and in many others), the challenge at hand changes from a question of designing potential plans to one of choosing from a defined set of discrete alternatives. This makes the method by which these alternatives are defined very important, because the decision space is restricted and interesting solutions may thus be discarded. This could potentially be alleviated by iterating on the evaluation process as the decision maker learns more about the characteristics of the forest system and comes to a stronger understanding of the trade-offs between different objectives. This would enable the creation of additional scenarios. For example, evaluation of the initial set of alternatives could result in the identification of gaps in the scenarios considered or reveal a new direction of improvement. One of the difficulties of using MCDA to evaluate long-term scenarios has to do with deciding at what point in time the performance of the alternatives should be evaluated with respect to each objective (Montibeller and Franco 2010). Should we look at the situation at the end of the simulated period (i.e., after 100 years in this case)? Alternatively, should we look at a range of time points (e.g., 25, 50, and 75 years into the simulated period) or consider the outcome over the course of the entire simulation? We tried to determine which measure of variation provided the most useful information for each objective. However, the decision makers’ responses to our questions on this topic were ambiguous and it is not possible to draw any reliable conclusions from this.
In this work, the municipality of Linköping was represented by the forest manager and the municipal ecologist. While their individual preferences were somewhat different, they were sufficiently similar that it seemed appropriate to aggregate their preferences by taking the arithmetic mean with respect to each outcome, i.e., by assigning equal weightings to their opinions (Nordström et al. 2012). The differences between the emphases the forest manager and the ecologist placed on economic and ecological factors probably reflect their different areas of competence to some extent (Fig. 4 and Fig. 5). The forest manager seemed to have a more differentiated view of the economic objectives in the sense that harvested volume, treated area and average growth – all of which relate to forest management – were of some importance to him but not to the ecologist. Similarly, the ecologist seemed to have a more differentiated view regarding the importance of the ecological objectives. However, it should be noted that both the manager and the ecologist should ultimately represent and act in the interest of the municipality’s inhabitants. In addition, real decisions on forest policy often are often political and made by the representatives in the municipal council.
6 Conclusions
The results presented in this study suggest that CCF may be a suitable forest management strategy in cases where ecological and social aspects are important, but is less effective than even-aged forestry in economic terms. Therefore, the preferences and priorities of the decision makers will determine which of the two is more appropriate in any given case. In this work, scenario analysis and MCDA were used together in the decision making process in an approach that we believe is very useful for supporting strategic decisions and for combining subjective and objective modelling. However, it is important to remember that MCDA is a decision support method. That is to say, its purpose is not primarily to produce the best solution or even the “truth”, but rather to provide a more detailed understanding of the problem at hand. Through an MCDA process, the decision maker learns more about the possibilities and limitations of various alternatives, and the trade-offs between different objectives. In this way, it increases their ability to make an informed decision and to identify policies that are likely to achieve their overall objectives.
References
Ananda J., Herath G. (2003). The use of Analytic Hierarchy Process to incorporate stakeholder preferences into regional forest planning. Forest Policy and Economics 5: 13–26. http://dx.doi.org/10.1016/S1389-9341(02)00043-6.
Ananda J., Herath G. (2009). A critical review of multi-criteria decision making methods with special reference to forest management and planning. Ecological Economics 68: 2535–2548. http://dx.doi.org/10.1016/j.ecolecon.2009.05.010.
Andreassen K., Øyen B.H. (2002). Economic consequences of three silvicultural methods in unevenaged mature coastal spruce forests of central Norway. Forestry 75: 483–488. http://dx.doi.org/10.1093/forestry/75.4.483.
Axelsson R., Angelstam P., Svensson J. (2007). Natural forest and cultural woodland with continuous tree cover in Sweden: How much remains and how is it managed? Scandinavian Journal of Forest Research 22: 545–558. http://dx.doi.org/10.1080/02827580701806661.
Erefur C., Bergsten U., de Chantal M. (2008). Establishment of direct seeded seedlings of Norway spruce and Scots pine: effects of stand conditions, orientation and distance with respect to shelter tree, and fertilisation. Forest Ecology and Management 255: 1186–1195. http://dx.doi.org/10.1016/j.foreco.2007.10.024.
FSC. (2010). Swedish FSC standard for forest certification including SLIMF indicators. Forest Stewardship Council, Uppsala. http://se.fsc.org/download.fm-standard-sweden-v2-1.281.pdf. [Cited 27 September 2013].
Guitouni A., Martel J-M. (1998). Tentative guidelines to help choosing an appropriate MCDA method. European Journal of Operational Research 109: 501–521. http://dx.doi.org/10.1016/S0377-2217(98)00073-3.
Hiltunen V., Kangas J., Pykäläinen J. (2008). Voting methods in strategic forest planning – experiences from Metsähallitus. Forest Policy and Economics 10: 117–127. http://dx.doi.org/10.1016/j.forpol.2007.06.002.
Jonsson B.G., Kruys N., Ranius T. (2005). Ecology of species living on dead wood – lessons for dead wood management. Silva Fennica, 39: 289–309.
Johnson K.N., Scheurman H.L. (1977). Techniques for prescribing optimal timber harvest and investment under different objectives: discussion and synthesis. Forest Science Monograph 18, Supplement to Number 1.
Kajanus M., Kangas J., Kurttila M. (2004). The use of value focused thinking and the A’WOT hybrid method in tourism management. Tourism Management 25: 499–506. http://dx.doi.org/10.1016/S0261-5177(03)00120-1.
Kangas J., Loikkanen T., Pukkala T., Pykäläinen J. (1996). A participatory approach to tactical forest planning. Acta Forestalia Fennica 251. 24 p.
Kangas J., Kangas A. (2005). Multiple criteria decision support in forest management – the approach, methods applied, and experiences gained. Forest Ecology and Management 207: 133–143. http://dx.doi.org/10.1016/j.foreco.2004.10.023.
Kangas A., Kangas J., Pykäläinen J. (2001). Outranking methods as tools in strategic natural resources planning. Silva Fennica 35: 215–227.
Keeney R.L. (1992). Value-focused thinking – a path to creative decisionmaking. Harvard University Press, Cambridge, Massachusetts. 432 p.
Knoke T. (2012). The economics of continuous cover forestry. In: Pukkala T., von Gadow K. (eds.). Continuous cover forestry. Springer Verlag, Dordrecht. p. 167–194. http://dx.doi.org/10.1007/978-94-007-2202-6_5.
Kuuluvainen T., Tahvonen O., Aakala T. (2012). Even-aged and uneven-aged forest management in boreal Fennoscandia: a review. Ambio 41: 720–737. http://dx.doi.org/10.1007/s13280-012-0289-y.
Linköpings kommun. (2006). Policy för Linköpings kommuns skogsinnehav. Teknik- och samhällsbyggnadsnämnden, Linköpings kommun. http://www.linkoping.se/Global/Milj%C3%B6%20och%20h%C3%A4lsa/Gemensamt/Policyer%20och%20riktlinjer/Policy_kommunens_skogsinnehav060215.pdf. [Cited 27 September 2013].
Linköpings kommun. (2008). Naturvårdsprogram för Linköpings kommun. Strategier och åtgärder 2008–2011. Linköpings kommun. http://www.linkoping.se/Global/Om%20kommunen/Gemensamt/Planer%20och%20program/PoPMilj%C3%B6/Naturvardsprogramslutversion.pdf. [Cited 27 September 2013].
Malczewski J. (1999). GIS and multicriteria decision analysis. John Wiley and Sons, New York. 408 p.
Montibeller G., Franco A. (2010). Multi-criteria decision analysis for strategic decision making. In: Zopounidis C., Pardalos P.M. (eds.). Handbook of multicriteria analysis. Springer Verlag, Berlin/Heidelberg. p. 25–48. http://dx.doi.org/10.1007/978-3-540-92828-7_2.
Nordström E-M., Eriksson L.O., Öhman K. (2010). Integrating multiple criteria decision analysis in participatory forest planning: Experience from a case study in northern Sweden. Forest Policy and Economics 12: 562–574. http://dx.doi.org/10.1016/j.forpol.2010.07.006.
Nordström E-M., Öhman K., Eriksson L.O. (2012). Approaches for aggregating preferences in participatory forest planning – an experimental study. The Open Forest Science Journal 5: 23–32. http://dx.doi.org/10.2174/1874398601205010023.
Öhman K., Holmström H., Nordström E.-M. (2013). Utvärdering av kontinuitetsskogsbruk för Linköpings kommunskogar. Arbetsrapport 385. Institutionen för skoglig resurshushåll-ning, Sveriges lantbruksuniversitet, Umeå. http://pub.epsilon.slu.se/9492/1/Ohman_K_et_al_130313.pdf. [Cited 7 October 2013].
Oleskog G., Nilson K., Wikberg P-E. (2008). Kontinuitetsskogar och kontinuitetsskogsbruk. Slutrapport för delprojekt skötsel – hyggesfritt skogsbruk. Rapport 22. Skogsstyrelsen, Jönköping. http://www.skogsstyrelsen.se/Global/myndigheten/Projekt/kontinuitetsskog%20och%20hyggesfritt/Rapport_22_2008_Kontinuitetsskogar%20och%20kontinuitetsskogsbruk_Slutrapport%20f%C3%B6r%20delprojekt%20sk%C3%B6tsel_hyggesfritt%20skogsbruk.pdf. [Cited 27 September 2013].
Pommerening A., Murphy S.T. (2004). A review of the history, definitions and methods of continuous cover forestry with special attention to afforestation and restocking. International Journal of Forest Research 77: 27–44.
Pukkala T., Lähde E., Laiho O., Salo K., Hotanen J-P. (2011). A multifunctional comparison of even-aged and uneven-aged forest management in a boreal region. Canadian Journal of Forest Research 41: 851–862. http://dx.doi.org/10.1139/x11-009.
Pykäläinen J., Hiltunen V., Leskinen P. (2007). Complementary use of voting methods and interactive utility analysis in participatory strategic forest planning: experiences gained from western Finland. Canadian Journal of Forest Research 37: 853–865. http://dx.doi.org/10.1139/X06-241.
Pykäläinen J., Kangas J., Loikkanen T. (1999). Interactive decision analysis in participatory strategic forest planning: experiences from state owned boreal forests. Journal of Forest Economics 5: 341–364.
Rauscher H.M., Lloyd F.T., Loftis D.L., Twery M.J. (2000). A practical decision-analysis process for forest ecosystem management. Computers and Electronics in Agriculture 27: 195–226. http://dx.doi.org/10.1016/S0168-1699(00)00108-3.
Rydberg D., Falck J. (2000). Urban forestry in Sweden from a silvicultural perspective: a review. Landscape and Urban Planning 47: 1–18. http://dx.doi.org/10.1016/S0169-2046(99)00068-7.
Saaty T.L. (1990). The Analytic Hierarchy Process: planning, priority setting, resource allocation. 2nd edition. RWS Publications, Pittsburgh.
Schou E., Jacobsen J.B., Kristensen K.L. (2012). An economic evaluation of strategies for transforming even-aged into near-natural forestry in a conifer-dominated forest in Denmark. Forest Policy and Economics 20: 89–98. http://dx.doi.org/10.1016/j.forpol.2012.02.010.
Sheppard S.R.J., Meitner M. (2005). Using multi-criteria analysis and visualisation for sustainable forest management planning with stakeholder groups. Forest Ecology and Management 207: 171–187. http://dx.doi.org/10.1016/j.foreco.2004.10.032.
Simon H.A. (1960). The new science of management decision. Harper and Row, New York. 50 p. http://dx.doi.org/10.1037/13978-000.
Tahvonen O., Pukkala T., Laiho O., Lähde E., Niinimäki S. (2010). Optimal management of uneven-aged Norway spruce stands. Forest Ecology and Management 260: 106–115. http://dx.doi.org/10.1016/j.foreco.2010.04.006.
Wikström P. (2000). A solution method for uneven-aged management applied to Norway spruce. Forest Science 46: 452–463.
Wikström P. (2008). Jämförelse av ekonomi och produktion mellan trakthyggesbruk och blädning i skiktad granskog – analyser på beståndsnivå baserade på simulering. Rapport 24, Skogsstyrelsen, Jönköping, Sverige. http://www.skogsstyrelsen.se/Global/myndigheten/Projekt/kontinuitetsskog%20och%20hyggesfritt/Rapport_24_2008_J%C3%A4mf%C3%B6relse%20av%20ekonomi%20och%20prouduktion%20mellan%20trakthyggesbruk%20och%20bl%C3%A4dning%20i%20skiktad%20granskog_analyser%20p%C3%A5%20best%C3%A5ndsniv%C3%A5%20baserade%20p%C3%A5%20simuleringar.pdf. [Cited 27 September 2013].
Wikström P., Edenius L., Elfving B., Eriksson L.O., Lämås T., Sonesson J., Öhman K., Wallerman J., Waller C., Klintebäck F. (2011). The Heureka forestry decision support system: an overview. Mathematical and Computational Forestry & Natural-Resource Sciences 3: 87–94.
von Winterfeldt D., Edwards W. (1986). Decision analysis and behavioral research. Cambridge University Press, Cambridge. 604 p.
Total of 40 references
Appendix A – Scenario outcomes
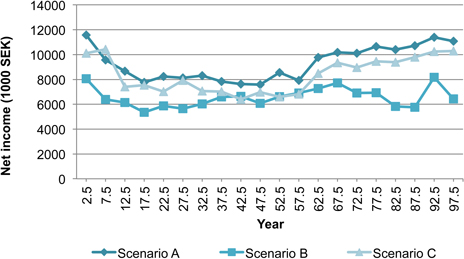
Fig. A1. The net income for the three scenarios over the planning horizon of 100 years (divided into 20 five-year periods).
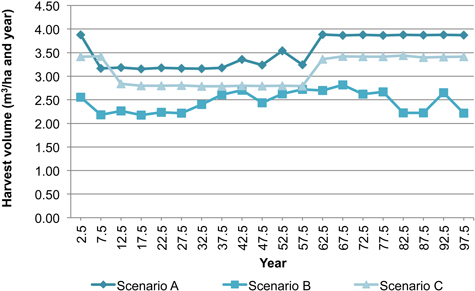
Fig. A2. The harvest volume for the three scenarios over the planning horizon of 100 years (divided into 20 five-year periods).
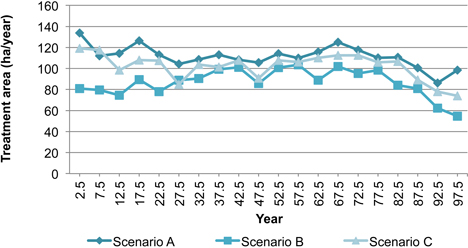
Fig. A3. The treatment area for the three scenarios over the planning horizon of 100 years (divided into 20 five-year periods).
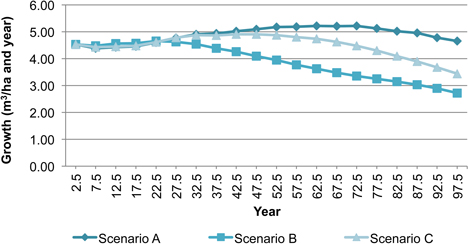
Fig. A4. The growth for the three scenarios over the planning horizon of 100 years (divided into 20 five-year periods).
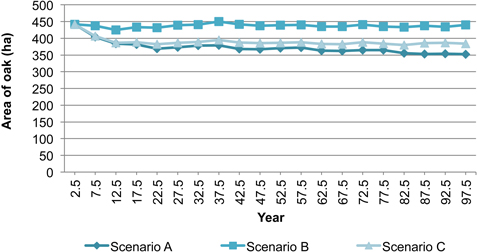
Fig. A5. The area of oak for the three scenarios over the planning horizon of 100 years (divided into 20 five-year periods).
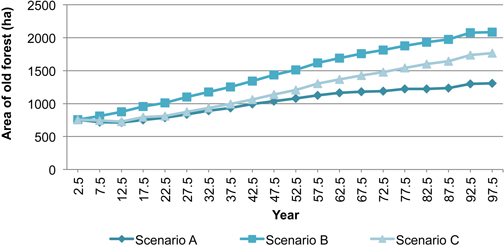
Fig. A6. The area of old forest for the three scenarios over the planning horizon of 100 years (divided into 20 five-year periods).
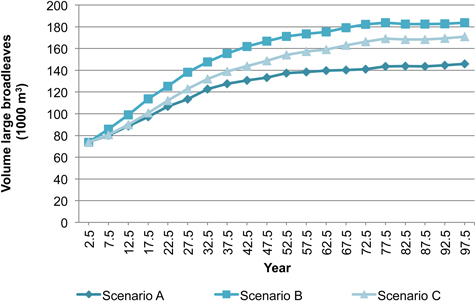
Fig. A7. The volume of large broadleaves for the three scenarios over the planning horizon of 100 years (divided into 20 five-year periods).
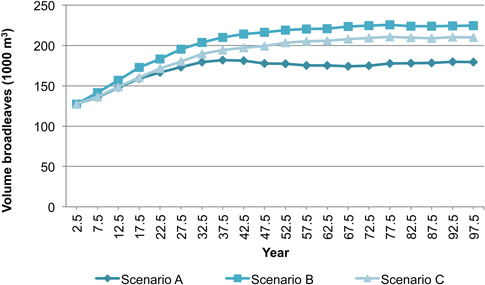
Fig. A8. The volume of broadleaves for the three scenarios over the planning horizon of 100 years (divided into 20 five-year periods).
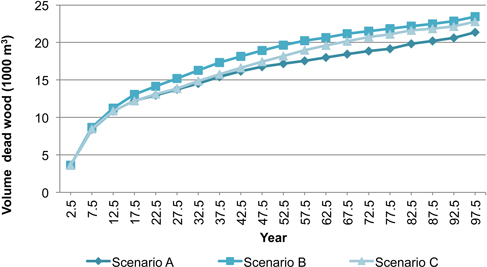
Fig. A9. The volume of dead wood for the three scenarios over the planning horizon of 100 years (divided into 20 five-year periods).
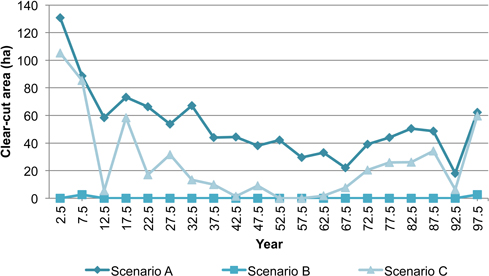
Fig. A10. The area of clear-cut forest land for the three scenarios over the planning horizon of 100 years (divided into 20 five-year periods).
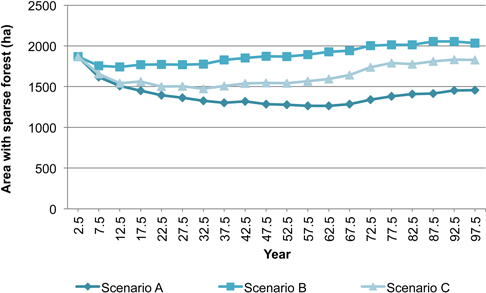
Fig. A11. The sparsely forested land area for the three scenarios over the planning horizon of 100 years (divided into 20 five-year periods).
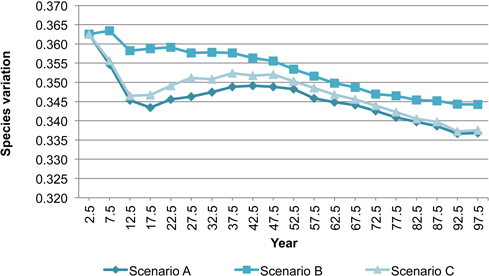
Fig. A12. The species variation for the three scenarios over the planning horizon of 100 years (divided into 20 five-year periods).
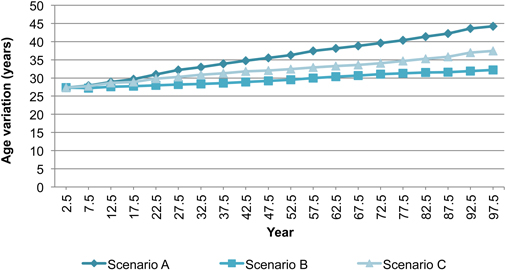
Fig. A13. The tree age variation for the three scenarios over the planning horizon of 100 years (divided into 20 five-year periods).
