Shaoqin Yang,
Lita Yi,
Nuonan Ye,
Mengyuan Wu,
Meihua Liu 
Spatial pattern dynamics of Cyclobalanopsis myrsinifolia in mixed broad-leaved forests on Tianmu Mountain, eastern China, 1996–2012
Yang S., Yi L., Ye N., Wu M., Liu M. (2022). Spatial pattern dynamics of Cyclobalanopsis myrsinifolia in mixed broad-leaved forests on Tianmu Mountain, eastern China, 1996–2012. Silva Fennica vol. 56 no. 1 article id 10520. https://doi.org/10.14214/sf.10520
Highlights
- Spatial distribution pattern monitoring of Cyclobalanopsis myrsinifolia was performed over 16 years in a 1 ha plot
- The importance value of C. myrsinifolia decreased between 1996 and 2012
- The spatial distribution pattern changed at a spatial scale of 0–25 m
- The drivers of the variation in spatial distribution were intra- and interspecific mutual relationships.
Abstract
Studies of the spatial patterns of dominant plant species may provide significant insights into processes and mechanisms that maintain stand stability. This study was performed in a permanent 1 ha plot in evergreen and deciduous broad-leaved mixed forests on Tianmu Mountain. Based on two surveys (1996 and 2012), the dynamics of the spatial distribution pattern of the dominant population (Cyclobalanopsis myrsinifolia (Blume) Oersted) and the intra- and interspecific relationships between C. myrsinifolia and other dominant species populations were analyzed using Ripley’s K(r) function. We identified the importance value of a species in a community, which is the sum of the relative density, relative frequency, and relative dominance. The drivers of spatial distribution variation and the maintenance mechanisms of the forest were discussed. The results showed that the importance value of C. myrsinifolia within the community decreased over the past 16 years. The C. myrsinifolia population exhibited a significantly aggregated distribution within a spatial scale of 0–25 m in 1996 whereas it changed to a random distribution at scales larger than 5.5 m in 2012. From 1996 to 2012, the spatial distribution patterns between C. myrsinifolia and Cyclocarya paliurus (Batal.) Iljinsk. and between C. myrsinifolia and Cunninghamia lanceolata (Lamb.) Hook did not change significantly. In 1996, C. myrsinifolia and Daphniphyllum macropodum Miq. were positively associated at the scale of 0–25 m; this relationship was strongly significant at the scale of 6–10 m. However, there was no association between the populations of two species in terms of the spatial distribution at the scale of 0–25 m in 2012. Our findings indicate that the drivers of variation in the spatial distribution of the C. myrsinifolia population were intra- and interspecific mutual relationships as well the seed-spreading mechanism of this species.
Keywords
forest dynamics;
spatial distribution;
East Asia;
evergreen and deciduous broad-leaved mixed forests
- Yang, Zhejiang Forest Resources Monitoring Center, Hangzhou 310020, China E-mail 20080095@zafu.edu.cn
- Yi, School of Forestry and Biotechnology, Zhejiang A & F University, Lin’an 311300, China E-mail yilita@zafu.edu.cn
- Ye, School of Forestry and Biotechnology, Zhejiang A & F University, Lin’an 311300, China E-mail 542243187@qq.com
- Wu, School of Forestry and Biotechnology, Zhejiang A & F University, Lin’an 311300, China E-mail 326585523@qq.com
-
Liu,
School of Forestry and Biotechnology, Zhejiang A & F University, Lin’an 311300, China
E-mail
mhliu@zafu.edu.cn
Received 1 February 2021 Accepted 28 December 2021 Published 12 January 2022
Views 58252
Available at https://doi.org/10.14214/sf.10520 | Download PDF

1 Introduction
Studying the spatial patterns of a particular species can provide useful information about the regeneration process of the species (Vargas-Gaeta et al. 2010; Owen et al. 2017) and can reveal its potential ecological process, such as intra- and interspecific relationships, the seed-spreading mechanism, and the mutual relationships with its growing environment. As important spatial properties and basic quantity characteristics of a population (He and Duncan 2000; Bunyavejchewin et al. 2003; Pillay and Ward 2012), spatial distribution patterns of forest trees are generated by the biological and ecological characteristics of a population, the interspecific relationships and environmental conditions combined (Dale 1999), and influential ecological processes (e.g., tree-tree interactions, resources, and habitat distributions) (Pacala and Deutschman 1995; Canham et al. 2004). The spatial distribution patterns differ among species and may change during stand development (Zhang et al. 2012), usually as an important indicator of stand history, population dynamics, and species interactions with the environment, as well as the dynamics of forest communities (Vessella et al. 2015; Buckley et al. 2016). All of these are important for mechanistically understanding the formation of a population and the maintenance mechanism of species coexistence.
The spatial structure of a forest is largely determined by the relationships within neighboring groups of trees (Gaertner et al. 2009). It is clear that the main factors in a forest structure are the spatial distribution of the neighboring trees and species diversity (Murray-Smith et al. 2010), which can cause different spatial patterns. Growth and interaction of trees through competition for limited resources are influenced by their location, local density, and species composition (Mack and Harper 1977; Antonovics and Levin 1980; Peterson and Squiers 1995). Recently, some researchers have carried out relevant studies to explain and evaluate spatial distribution (Burkle et al. 2016; Orellana et al. 2016). Woody plants have a dominant status in a forest ecosystem, which spatial distribution patterns could indicate the mechanism of population structure formation and potential ecological process (Ripley 1977; Barot et al. 1999). Trees are the major woody plant species within the forest communities, of which the dominant species also have important significance in the formation and maintenance of the community structure (Asada et al. 2017). The dominant species usually account for a high proportion of the biomass. Both theory and experimental evidence (Huston 1997; Aarssen 1997) suggest that the extent to which a plant species affects ecosystem functions is likely to be closely predictable from its contribution to the total plant biomass. Mass-ratio theory proposes that immediate controls are proportional to primary production inputs and are determined to an overwhelming extent by the traits and functional diversity of the dominant species (Grime 1998). Therefore, investigation of the dynamic variation patterns of dominant tree species is helpful for understanding the characteristics of spatial distribution variation of that dominant population and can also reveal internal drivers of dynamic changes in the population via the variation pattern and its impact on ecosystem function and viability (Kang et al. 2017). Relevant studies have suggested that spatial correlation within dominant plant populations could reflect the mutual effects of the dominant species or the difference in their environmental adaptabilities (Wiegand et al. 2007). Consequently, the variation pattern of interspecific spatial correlation has become important for explaining interspecific relationships from the perspective of the spatial variation pattern of populations.
The importance of dominant species with respect to the forest structure is crucial for forest management practices. However, the potential contribution to forest ecosystem succession of the spatial distributions of dominant species has not yet been fully recognized. Insufficient studies have been conducted to assess the driving mechanism of stand structure by exploring inter- and intraspecific relationships of dominant species, especially in mixed evergreen and deciduous broad-leaved forests, characterized by complex structures, high productivities, and biodiversity. One method for exploring spatial plant dynamics is to use a point pattern analysis of fully mapped plant locations (Buckley et al. 2016). Point pattern analysis overcomes the deficiencies of traditional methods that can only analyze distribution patterns in a single dimension and has been widely applied in the analysis of population distribution patterns (Spielman 2017). Spatial statistics such as Ripley’s K function (Ripley 1979) and the pair-correlation function (Hand 2008) can be used to quantify the small-scale spatial correlation structure of a spatial pattern in a stand.
Cyclobalanopsis microphylla (Blume) Oersted is an evergreen broad-leaved tree belonging to Cyclobalanopsis. It is one of the dominant tree species in subtropical evergreen deciduous broad-leaved mixed forests in China and has strong adaptability. C. microphylla, with a height of 15 m, occurs in mountainous mixed forests at an altitude of 500–2600 m, usually in the upper part of Cyclobalanopsis glauca (Thunberg) forest.
We established a 1 ha fixed monitoring sample field in a mixed evergreen and deciduous broad-leaved forest on Tianmu Mountain (eastern China) to investigate the spatial distribution patterns of the dominant species and the spatial correlations at different stages, as well as the internal mechanism of competition during the process of natural development of communities. In the present study, based on the survey data of the community in 1996 and 2012, we analyzed (1) the variation pattern of the spatial distribution of C. myrsinifolia, the dominant population in the sample field in 1996 and 2012, which can provide an accurate understanding of the status and effect of C. myrsinifolia on the community, and (2) the drivers behind the change in the spatial distribution of the C. myrsinifolia population based on intra- and interspecific relationships during the 16-year period, which makes an interesting and novel contribution to our understanding of the formation and maintenance mechanism of mixed evergreen and deciduous broad-leaved forest in East Asia. We also (3) explained how stand development determined spatial distribution in terms of intra- and interspecific relationships. Compared to Western countries and the tropics, such monitoring data are rarely analyzed and presented scientifically for the temperate regions of East Asia. The analysis and results can provide useful information for the process of species renewal and maintenance of stand stability and can reveal their potential ecological processes. This study provides meaningful knowledge for predicting the spatial patterns of dominant tree species in mixed evergreen and deciduous broad-leaved forests and may have further important implications for management, recovery, and rebuilding of the mixed forest under silvicultural treatments.
2 Materials and methods
2.1 Study site
The study site is located in the Tianmu Mountain National Nature Reserve (30°18´–30°25´N, 119°24´–119°28´E), Zhejiang Province, eastern China (Fig. 1). The reserve has a total area of 4284 ha with 4261.1 ha of forest area or 98.1% forest coverage. The elevation ranges from 300 m to 1506 m above sea level. The area has a transitional tropical climate from a central subtropical to a northern subtropical zone and is affected by marine warm and wet airflow from the southeast, with four different seasons, high precipitation, and moderate sunlight. From the piedmont to the mountaintop, the average annual temperature within the reserve ranges from 14.8 to 8.8 °C, respectively, with 209–235 frost-free days, 159–183 annual rainy days, 1390–1870 mm annual precipitation, and 76–81% relative humidity. The soils in the reserve are calcareous red, brown, and yellow soils that are distributed across the piedmont areas and in areas with altitudes less than 600 m, higher than 600 m, and 600–1200 m, respectively. The vertical zonal vegetation types within the reserve have clear boundaries: the evergreen broad-leaved forest (< 870 m) mainly comprises species such as Cyclobalanopsis glauca (Thunberg) Oersted, Cyclobalanopsis gracilis (Batal.) Iljinsk., Castanopsis sclerophylla (Lindl. et Paxton) Schottky, Litsea coreana var. sinensis (Allen) Yang et P. H. Huang, Liquidambar formosana Hance, and Zelkova schneideriana Hand.-Mazz. The mixed evergreen and deciduous broad-leaved forest (870–1100 m) mainly comprises tree species such as C. myrsinifolia, Lithocarpus glabra (Thunb.) Nakai, Litsea auriculata Chien et Cheng, Quercus glandulifera Bl. var. brevipetidata (A. DC.) Nakai, and Daphniphyllum macropodum Miq. The deciduous broad-leaved forest (1100–1380 m) mainly comprises tree species such as Pterostyrax corymbosus Sieb. et Zucc., Quercus fabri Hance, Castanea seguinii Dode, Cornus controversa Hemsley, Platycarya strobilacea Sieb. et Zucc., Acer sinopurpurascens W. C. Cheng, and Pinus taiwanensis Hayata. The deciduous coppice forest (1380–1500 m) mainly comprises species such as Viburnum sargentii Koehne, Malus hupehensis (Pamp.) Rehd., Lindera obtusiloba Bl., and Dendrobenthamia japonica var. chinensis (Osborn) Fang (Tang et al. 2006).
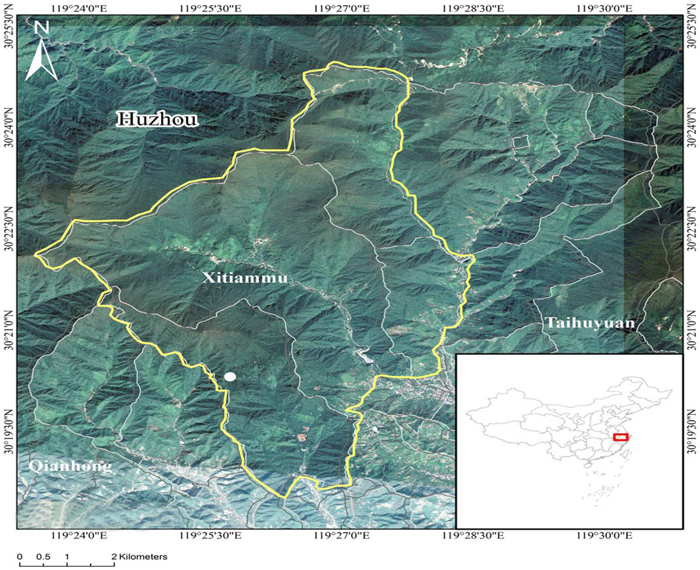
Fig. 1. Location of the study site on Tianmu Mountain in eastern China. Maps were generated using ArcGIS 10.0.
2.2 Plot establishment and surveys
To monitor the long-term dynamic succession of zonal vegetation in Tianmu Mountain reserve, a permanent 1 ha plot (100 m × 100 m) was established in a fixed sample field in the Lion Tail region of Tianmu Mountain, eastern China, in 1996 (Fig. 1). The 1 ha plot was divided into 25 400 m2 subplots (20 m × 20 m) using the total station system (NTS-300R). The following survey was conducted in these 25 subplots. The sample field (30°20´N, 119°26´E) with a central elevation of 1065 m was covered with mixed evergreen and deciduous broad-leaved forest. The study plot was located in the interior of the protected area. Logging or other forest management activities have not been documented in our area of study. Except for local residents and researchers, access to the protected area is prohibited.
We surveyed the sample field in 1996 and 2012. All living trees with a diameter at breast height (DBH) larger than 10 cm within the sample field were located by the triangle coordinate system based on the southwestern origin and northeastern point. We recorded the following information: location coordinates, name of species, DBH, total height, crown width, height beneath the branch, and growing state of each species.
3 Data analysis
3.1 Dominant species determination
The importance value (IV) of each species was used as data in community analysis and dominant species determination. IV (Curtis et al. 1951) was calculated by the following formula:
![]()
where relative abundance is the proportion of the total number of plants in that population to the total number of plants in the community, relative dominance is the proportion of the total basal area at breast height of a population to the total basal area at breast height of all plants in that community, and relative height is the proportion of the total height of plants in a population to the total height of plants in that community. A higher IV of a species indicates greater dominance.
3.2 Population distribution pattern
Spatial patterns were analyzed at multiple scales to understand the community structure. Ripley’s K(r) function (Ripley 1977) analyzes population spatial patterns and interspecific relationships at inclusive scales and has been applied in spatial pattern analysis (Takahashi et al. 2012). Univariate analysis of Ripley’s K(r) function can be conducted according to Jia et al. (2016), which is defined as the spatial patterns of the same tree species or of the same DBH/height class at a range of distances (Jia et al. 2016):
![]()
where r is the distance between plant individuals; A is the area of the sample field; n is the number of plant individuals within the field; uij is the distance between individuals i and j; wij indicates the inverse of the proportion, which is a weighting factor correcting for edge effects; and Ir(uij) is the indicator function (Jia et al. 2016). K(r) was linearized by square root transformation L(r) to stabilize the variance and simplify the interpretation of K(r):

where r is the distance between plant individuals (Jia et al. 2016). The Monte Carlo method was used to obtain the 99% confidence interval to carry out significance testing of random result diversion states. A population has an aggregated distribution if L(r) is greater than the confidence interval (L(r) > 0), a uniform distribution if L(r) is less than the confidence interval (L(r) < 0), and a random distribution if L(r) is within the confidence interval (L(r) = 0).
3.3 Interspecific spatial relationships
The analysis of interspecific relationships involves a point pattern analysis of two species, or it could be considered to be the spatial associations between two species in the same DBH/height class. Intra- and interspecific relationships were calculated by the following formula:

where n1 and n2 represent the number of individuals of species 1 and 2, respectively, and i and j represent individuals of species 1 and 2. The other symbols are the same as in (2). In the same way, K12(r) can be replaced by L12(r) through the following formula:

The functions of L12(r) are the same as in (3). When L12(r) is within the confidence interval (L12(r) = 0), the two species are considered to be independent (no correlation) at the scale of r. When L12(r) is greater than the confidence interval (L12(r) > 0), the two species are positively spatially associated. When L12(r) is less than the confidence interval (L12(r) < 0), the two species are negatively spatially associated.
3.4 Data processing
All spatial analyses were performed using the package “spatstat” in R (version 3.5; R Foundation for Statistical Computing, Vienna, Austria). We used the Monte Carlo method to test the null hypothesis; for bivariate spatial interactions between two groups, the null hypothesis is spatial independence. The estimated function was compared to the theoretical function under the null hypothesis through a test statistic whose expected null-hypothesis value was zero at all distances. We conducted 500 Monte Carlo simulations to generate an envelope curve with a 99% confidence interval to test the significance of the point pattern analysis. To minimize the effect of the lateral correction of data, the scale of pattern analysis was restrained to within 0–25 m (Wiegand and Moloney 2004).
4 Results
4.1 Variations in species combinations within the community
As shown in Table 1, in 1996, the stand was forested by 14 tree species with DBH ≥10 cm and IV ≥ 1%, including 156 individuals of C. myrsinifolia with a 20.93% IV (which is the most dominant population within the community), as well as 79 individuals of C. paliurus and 65 individuals of Cunninghamia lanceolata (Lamb.) Hook with IVs of 16.53% and 11.65%, respectively, which had a dominant status within the community. In 2012, there were 12 tree species with DBH ≥ 10 cm and IV ≥ 1%, including 114 individuals of C. myrsinifolia with a 15.12% IV (slightly lower than that in 1996 but still dominating the entire community), as well as 64 individuals of C. paliurus and 58 individuals of C. lanceolata with IVs of 12.21% and 11.19%, respectively. There was no change in the dominant status of these two species (P < 0.05). A comparison of the numbers and IVs of D. macropodum in 1996 and 2012 indicated a strong increase in the two indexes during the 16 years. In 2012, the dominance of D. macropodum within the community exceeded that of C. lanceolata, with 106 individuals and an IV of 11.49%.
| Table 1. Importance value (%) and abundance of the dominant species (IV ≥ 1%) at different stages in a 1.0 ha (100 m × 100 m) mixed broad-leaved forest plot on Tianmu Mountain, eastern China. | |||||
| Year | Species | Average height (m) | DBH (cm) | Importance value (%) | Abundance |
| 1996 | Cyclobalanopsis myrsinifolia | 8.11 ± 2.04 | 18.49 ± 7.58 | 20.93 | 156 |
| Cyclocarya paliurus | 14.54 ± 5.26 | 26.51 ± 11.46 | 16.53 | 79 | |
| Cunninghamia lanceolata | 11.19 ± 5.53 | 26.07 ± 11.53 | 11.65 | 65 | |
| Liquidambar acalycina | 21.44 ± 6.43 | 40.90 ± 18.74 | 9.42 | 29 | |
| Cryptomeria fortunei | 23.67 ± 13.23 | 92.96 ± 66.59 | 9.09 | 9 | |
| Litsea auriculata | 16.57 ± 3.34 | 33.74 ± 8.99 | 3.21 | 14 | |
| Catalpa ovata | 11.93 ± 4.94 | 23.5 ± 16.78 | 2.78 | 15 | |
| Eurya hebeclados | 6.12 ± 1.14 | 13.80 ± 4.43 | 2.66 | 25 | |
| Lithocarpus harlandii | 6.9 ± 1.08 | 18.74 ± 5.72 | 2.44 | 20 | |
| Daphniphyllum macropodum | 9.92 ± 1.89 | 31.81 ± 7.23 | 2.05 | 12 | |
| Cladrastis wilsonii | 8.18 ± 3.74 | 25.47 ± 7.67 | 1.99 | 11 | |
| Dendrobenthamia japonica | 7 ± 1.03 | 14.08 ± 3.39 | 1.82 | 16 | |
| Pseudolarix amabilis | 24.2 ± 11.97 | 45.01 ± 29.46 | 1.63 | 5 | |
| Cyclobalanopsis multiervis | 8.1 ± 1.52 | 18.38 ± 5.46 | 1.31 | 10 | |
| 2012 | Cyclobalanopsis myrsinifolia | 7.32 ± 2.77 | 17.87 ± 6.30 | 15.12 | 114 |
| Cunninghamia lanceolata | 12.58 ± 5.42 | 27.45 ± 11.61 | 12.21 | 64 | |
| Cyclocarya paliurus | 12.72 ± 5.40 | 31.19 ± 10.59 | 11.91 | 58 | |
| Daphniphyllum macropodum | 6.08 ± 2.88 | 17.87 ± 6.30 | 11.49 | 106 | |
| Liquidambar acalycina | 16.9 ± 4.88 | 42.69 ± 17.48 | 9.67 | 32 | |
| Cryptomeria fortunei | 16.89 ± 11.29 | 78.54 ± 59.25 | 8.05 | 10 | |
| Lithocarpus brevicaudatus | 7.47 ± 4.84 | 23.83 ± 4.66 | 5.57 | 47 | |
| Litsea auriculata | 13.75 ± 4.22 | 40.14 ± 4.10 | 3.43 | 15 | |
| Nyssa sinensis | 11.83 ± 3.50 | 33.98 ± 15.80 | 3.03 | 16 | |
| Dendrobenthamia japonica | 6.03 ± 4.23 | 18.88 ± 3.53 | 2.76 | 26 | |
| Cyclobalanopsis stewardiana | 8.99 ± 1.11 | 25.32 ± 8.44 | 2.05 | 14 | |
| Eurya hebeclados | 4.78 ± 1.62 | 13.23 ± 2.07 | 1.86 | 20 | |
4.2 Analysis of the distribution pattern variation of Cyclobalanopsis myrsinifolia
As the dominant species within the community, C. myrsinifolia is crucial to the construction and ecological equilibrium of the community. As shown in Fig. 2, a comparison of the spatial distribution patterns of C. myrsinifolia in 1996 and 2012 indicated that in 1996, C. myrsinifolia had significantly aggregated distribution (P < 0.01) at a spatial scale of 0–25 m, whereas in 2012, it only had significantly aggregated distribution (P < 0.01) within a range of 0–5.5 m, with random distribution at a scale greater than 5.5 m. This result indicates that from 1996 to 2012, the spatial distribution pattern of C. myrsinifolia experienced substantial changes under habitat variation and intra- and interspecific mutual effects. The result is not only a reflection of the change in the C. myrsinifolia population but also an external presentation of interspecific mutual relationships.
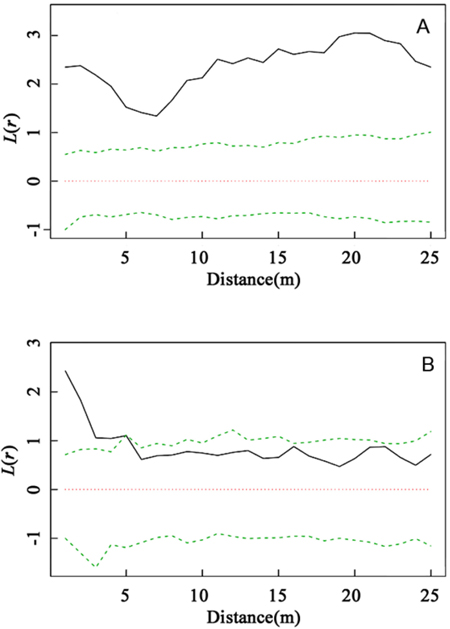
Fig. 2. Intraspecific interaction based on univariate L(r) values for Cyclobalanopsis myrsinifolia in 1996 (A) and C. myrsinifolia in 2012 (B). Univariate L(r) analysis of the spatial pattern of C. myrsinifolia in 1996 (A) and 2012 (B). The solid line shows the actual L(r) value, the green dotted lines show the 99% confidence envelope for the pattern expected from a random distribution of plant localities calculated via Monte Carlo simulations. An L(r) value greater than the confidence interval indicates an aggregated population distribution. An L(r) value less than the confidence interval indicates that the population is uniformly distributed. An L(r) value within the confidence interval indicates the population is randomly distributed.
4.3 Analysis of spatial distribution pattern variation of Cyclobalanopsis myrsinifolia and its major associated dominant species
C. lanceolata, C. paliurus, and D. macropodum are populations that had relatively high dominance but less than that of C. myrsinifolia. The spatial distribution of the four species in 1996 and 2012 (Fig. 3) showed that in 1996, three dominant species – C. myrsinifolia, C. lanceolata, and C. paliurus – were widely distributed across the whole sample field while D. macropodum only appeared in a small area. In 2012, the number of D. macropodum individuals increased significantly, and the four dominant species were widely distributed across the sample field. Overall, the existence of intersections (competition) among C. myrsinifolia, C. lanceolata, D. macropodum, and C. paliurus was revealed, and correlations among these species changed over time.
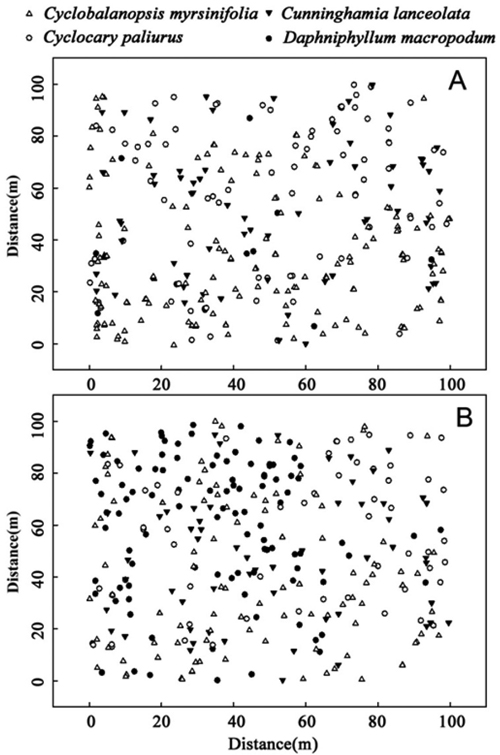
Fig. 3. Spatial distribution of the four main species, Cyclobalanopsis myrsinifolia, Cunninghamia lanceolata, Cyclocarya paliurus and Daphniphyllum macropodum, in 1996 (A) and 2012 (B) in a 1.0 ha (100 m ×100 m) plot on Tianmu Mountain.
As indicated in Fig. 4A, in 1996, there was positive correlation (P > 0.05) between C. myrsinifolia and C. paliurus at a scale of 0–3 m, and the spatial correlation changed with the scale. The two species had a negative correlation (P > 0.05) at a scale of 3–25 m. Compared with that in 1996, the spatial distribution pattern of C. myrsinifolia and C. paliurus in 2012 did not show significant variation, but as indicated in Fig. 4B, when r > 20 m, the two species presented a trend toward a significantly negative correlation. From 1996 to 2012, the spatial distribution pattern of C. myrsinifolia and D. macropodum showed relatively large variation. The result reveals that in 1996, C. myrsinifolia and D. macropodum had a positive correlation at a scale of 0–25 m and a significantly positive correlation at a scale of 6–10 m (Fig. 4B). However, in 2012, the spatial distribution of the two species showed no correlation at a scale of 0–25 m (Fig. 4D). C. myrsinifolia and C. lanceolata had a negative correlation (P > 0.05) at a scale of 0–25 m in 1996 (Fig. 4E). The spatial distribution patterns of the two species basically stayed the same in 2012 as in 1996, only shifting from a non-significant negative correlation to a non-significant positive correlation at a scale of 5–10 m (Fig. 4F).
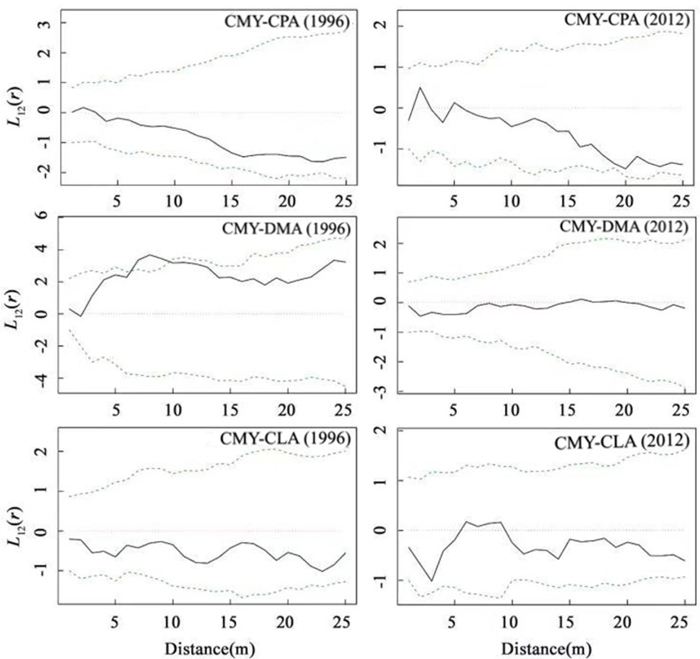
Fig. 4. Bivariate analysis of the spatial patterns of Cyclobalanopsis myrsinifolia and Cyclocarya paliurus, Cyclobalanopsis myrsinifolia and Cunninghamia lanceolata, Cyclobalanopsis myrsinifolia and Daphniphyllum macropodum in 1996 and 2012. The solid line in the panel shows the actual L12(r) value, and dotted lines show the 99% confidence envelope for the pattern expected from a random distribution of plant localities calculated via Monte Carlo simulations. CMY, Cyclobalanopsis myrsinifolia; CPA, Cyclocarya paliurus; CLA, Cunninghamia lanceolata; DMA, Daphniphyllum macropodum.
5 Discussion
As the dominant species in the mixed evergreen and deciduous broad-leaved forest on Tianmu Mountain, C. myrsinifolia experienced a slight attenuation of its dominant status during the 16-year period. Its distribution pattern shifted from an aggregated distribution at a scale of 0–25 m in 1996 to an aggregated distribution at a small scale and a random distribution at a large scale in 2012. The aggregated distribution pattern facilitated the expression of the effects of the population to form a suitable environment, defend against the invasion of external species, and maintain the normal development of the population. However, with development of the population, competition would result in the utilization of resources. Species would then try to prevent interspecific competition through the self-thinning effect (Stoyan and Penttinen 2000). It is reasonable to deduce that from 1996 to 2012, with the stabilization of the dominant status within the community, C. myrsinifolia would eliminate some individuals through intraspecific self-thinning to take up more resources for subsequent growth and mitigate intraspecies competition, leading to the random distribution pattern of C. myrsinifolia at a large scale in 2012. In addition, studies have indicated that seeds of C. myrsinifolia are nuts with an oval or elliptical shape, present in relatively large volumes. Gravity causes seed to fall mainly around the parent tree, which restricts the spread of seeds. Such a biological property (Condit 1992) might also be the reason that C. myrsinifolia had an aggregated distribution within a small scale.
The variation of the spatial distribution pattern of plant populations is not only influenced by intraspecies effects and seed-spreading mechanisms but is also critically affected by interspecific mutual effects (Schoener 1983). Interspecific association is a description of the mutual relationship between two plant populations in a certain period. Positive or negative association characteristics might be the result of interspecific mutual effects or the expression of the convergence or divergence of habitats of species. The distribution of dominant species changed with the succession of communities, in which the interspecific relationships between dominant species and other species with relatively high dominance might be among the drivers of the process. In our study, weak negative correlations existed among C. paliurus, C. lanceolata, and C. myrsinifolia, which indicated weak competition between C. myrsinifolia and the other two species or different habitat preferences. C. myrsinifolia, C. paliurus, and C. lanceolata are shade-intolerant tree species. As a fast-growing species, C. lanceolata can reach a height of 40 m, and C. paliurus can reach a height of 10–30 m; both species were located in the middle and upper layers of the forest, whereas the mature height of C. myrsinifolia trees is usually about 10 m. The three species exhibited obvious vertical layer differentiations, showing the competition for light resources. Communities always succeed toward stable stages (Jia et al. 2016). Although there was competition between C. myrsinifolia and C. paliurus and between C. myrsinifolia and C. lanceolata, in order to acquire more resources for survival, C. myrsinifolia presented a fairly low probability of encountering C. paliurus or C. lanceolata during the process of succession, showing weak negative correlations. Moreover, the interspecific relationships between C. myrsinifolia and C. paliurus as well as between C. myrsinifolia and C. lanceolata had been stabilized in 1996 and did not change much during the 16-year period. Considering the relationship between the C. myrsinifolia population and other populations in the community, the C. myrsinifolia population had a large-scale pattern due to its self-sparing effect, and its small-scale distribution always showed an aggregation distribution because of seed dispersal.
From 1996 to 2012, the population of D. macropodum increased. The positive correlation between C. myrsinifolia and D. macropodum in 1996 indicated the similar habitat requirements of the two species or that C. myrsinifolia provided survival conditions for D. macropodum to inhabit an area. D. macropodum seedlings require dark and wet conditions for growth. Although these seedlings tend to prefer more sunlight when they grow up, they still show obvious advantages in terms of photosynthesis under weak light conditions (Zhao et al. 2015). The canopy of C. myrsinifolia provided a dark and wet habitat for the growth of D. macropodum seedlings, improving the growth of this species. The photosynthetic advantage of mature D. macropodum trees under weak light conditions also had crucial effects on the gradual increasing dominance of D. macropodum within the community. The highly shade-tolerant D. macropodum grew better than C. myrsinifolia although both species were distributed in the upper vertical layer of the forest. A higher shade-tolerance level has higher light energy utilization efficiency under shade conditions, which increases biomass proportion and enhances competitiveness. The abundance and importance value of D. macropodum during the 16-year period exhibited an increasing tendency, whereas those of C. myrsinifolia decreased. There are differences in the photosynthesis of C. myrsinifolia and D. macropodum. The obvious advantage of the photosynthesis of D. macropodum is beneficial to the improvement of productivity and the proportion of biomass, indicating the replacement of the dominant status of C. myrsinifolia by D. macropodum in future succession. The comparison of the spatial pattern and interspecific spatial associations suggested that differences in seed dispersal, competitive ability, responses to stand conditions, and light environments developed among these species. In summary, the comparative analysis of the dominant species explained the differences in the spatial pattern. Intra- and interspecific relationships and seed-spreading mechanisms drove the spatial distribution change of C. myrsinifolia at the forest scale.
This study explored at a temporal scale the spatial distribution pattern of C. microphylla, which is the dominant species in the mixed evergreen, deciduous, and broad-leaved forest community in the Tianmu Mountain Nature Reserve. It was found that the drivers of the spatial distribution change of C. myrsinifolia were intra- and interspecific relationships as well as the seed-spreading mechanism of this species. Differences in plant functional traits may have a profound impact on ecosystems. The results showed that it would be necessary to conduct consistent monitoring of mixed evergreen and deciduous forests on Tianmu Mountain, especially the dynamic changing trend of the D. macropodum population. Our results indicate that space can be used instead of time in the study of forest succession, and this method can be used to analyze population structures and distribution patterns according to different stages of population development in East Asia. This method can precisely explain the dynamic mechanism of population structure changes to a certain extent (Stoyan et al. 2000).
Authors’ contributions
Shaoqin Yang and Lita Yi contributed to the conception of the research questions and design of the work. Nuonan Ye analyzed the data and wrote the original draft. Mengyuan Wu participated in the interpretation of data and results. Meihua Liu had the overall responsibility for the study.
Funding
The study was funded by the Natural Science Foundation of Zhejiang Province (LY19C160005, 2015C33020) and the National Natural Science Fund (31570611, 31100325).
Declaration of openness of research materials, data, and code
Collected inventory data are available upon request from corresponding author Meihua Liu.
References
Aarssen LW (1997) High productivity in grassland ecosystems: Effected by species diversity or productive species? Oikos 80: 183–184. https://doi.org/10.2307/3546531.
Antonovics J, Levin D A (1980) The ecological and genetic consequences of density-dependent regulation in plants. Ann Rev Ecol Syst 11: 411–452. https://doi.org/10.1146/annurev.es.11.110180.002211.
Asada I, Yamazaki H, Yoshida T (2017) Spatial patterns of oak (Quercus crispula) regeneration on scarification site around a conspecific overstory tree. Forest Ecol Manag 393: 81–88. https://doi.org/10.1016/j.foreco.2017.03.011.
Barot S, Gignoux J, Menaut J (1999) Demography of a savanna palm tree: predictions from comprehensive spatial pattern analyses. Ecology 80: 1987–2005. https://doi.org/10.1890/0012-9658(1999)080[1987:DOASPT]2.0.CO;2.
Buckley HL, Case BS, Zimmerman JK, Thompson J, Myers JA, Ellison AM (2016) Using codispersion analysis to quantify and understand spatial patterns in species-environment relationships. New Phytol 211: 735–749. https://doi.org/10.1111/nph.13934.
Bunyavejchewin S, Lafrankie JV, Baker PJ, Kanzaki M, Ashton PS, Yamakura T (2003) Spatial distribution patterns of the dominant canopy dipterocarp species in a seasonal dry evergreen forest in western Thailand. Forest Ecol Manag 175: 87–101. https://doi.org/10.1016/S0378-1127(02)00126-3.
Burkle LA, Myers JA, Belote T (2016) Wildfire disturbance and productivity as drivers of plant species diversity across spatial scales. Ecosphere 6: 1–14. https://doi.org/10.1890/ES15-00438.1.
Canham CD, Lepage PT, Coates KD (2004) A neighborhood analysis of canopy tree competition: effects of shading versus crowding. Can J For Res 34: 778–787. https://doi.org/10.1139/x03-232.
Condit R (1995) Research in large, long-term tropical forest plots. Trends Ecol Evol 10: 18–22. https://doi.org/10.1016/S0169-5347(00)88955-7.
Curtis J, McIntosh R (1951) An upland forest continuum in the prairie-forest border region of Wisconsin. Ecology 32: 476–496. https://doi.org/10.2307/1931725.
Dale MRT (1999) Spatial pattern analysis in plant ecology. Cambridge University Press, Cambridge, UK. https://doi.org/10.1017/CBO9780511612589.
Gaertner M., Breeyen AD, Hui C, Richardson DM (2009) Impacts of alien plant invasions on species richness in Mediterranean-type ecosystems: a meta-analysis. Prog Phys Geogr 33: 319–338. https://doi.org/10.1177/0309133309341607.
Garbarino M, Weisberg PJ, Motta R (2009) Interacting effects of physical environment and anthropogenic disturbances on the structure of European larch (Larix decidua Mill.) forests. Forest Ecol Manag 257: 1794–1802. https://doi.org/10.1016/j.foreco.2008.12.031.
Grime JP (1998) Benefits of plant diversity to ecosystems: immediate, filter and founder effects. J Ecol 86: 902–910. https://doi.org/10.1046/j.1365-2745.1998.00306.x.
Hand DJ (2008) Statistical analysis and modelling of spatial point patterns by Janine Illian, Antti Penttinen, Helga Stoyan, Dietrich Stoyan. Int Stat Rev 76: 458–458. https://doi.org/10.1111/j.1751-5823.2008.00062_23.x.
He FL, Duncan RP (2000) Density-dependent effects on tree survival in an old-growth douglas fir forest. J Ecol 88: 676–688. https://doi.org/10.1046/j.1365-2745.2000.00482.x.
Huston MA (1997) Hidden treatments in ecological experiments: re-evaluating the ecosystem function of biodiversity. Oecologia 110: 449–460 https://doi.org/10.1007/s004420050180.
Jia G, Yu X, Fan D, Jia J (2016) Mechanism underlying the spatial pattern formation of dominant tree species in a natural secondary forest. PloS One 11, article id e0152596. https://doi.org/10.1371/journal.pone.0152596.
Kang H, Zheng Y, Liu S, Chai Z, Chang M, Hu Y, Li G, Wang D (2017) Population structure and spatial pattern of predominant tree species in a pine–oak mosaic mixed forest in the Qinling Mountains, China. J Plant Interact 12: 78–76. https://doi.org/10.1080/17429145.2017.1283069.
Mack RN, Harper JL (1977) Interference in dune annuals: spatial pattern and neighbourhood effects. J Ecol 65: 345–363. https://doi.org/10.2307/2259487.
Murray-Smith C, Brummitt NA, Oliveira-Filho AT, Bachman S, Moat J, Lughadha EMN, Lucas EJ (2010) Plant diversity hotspots in the atlantic coastal forests of Brazil. Conserv Biol 23: 151–163. https://doi.org/10.1111/j.1523-1739.2008.01075.x.
Orellana E, Filho AF, Netto SP, Vanclay JK (2016) Predicting the dynamics of a native Araucaria forest using a distance-independent individual tree-growth model. For Ecosyst 3: 1–11. https://doi.org/10.1186/s40663-016-0071-x.
Owen SM, Sieg CH, Meador AJS, Fulé PZ, Iniguez JM, Baggett LS, Fornwalt PJ, Battaglia MA (2017) Spatial patterns of ponderosa pine regeneration in high-severity burn patches. Forest Ecol Manag 405: 134–149. https://doi.org/10.1016/j.foreco.2017.09.005.
Pacala SW, Deutschman DH (1995) Details that matter: the spatial distribution of individual trees maintains forest ecosystem function. Oikos 74: 357–365. https://doi.org/10.2307/3545980.
Peterson CJ, Squiers ER (1995) An unexpected change in spatial pattern across 10 years in an aspen white-pine forest. J Ecol 83: 847–855. https://doi.org/10.2307/2261421.
Pillay T, Ward D (2012) Spatial pattern analysis and competition between Acacia karroo trees in humid savannas. Plant Ecol 213: 1609–1619. https://doi.org/10.1007/s11258-012-0115-4.
Ripley BD (1977) Modelling spatial patterns. J R Stat Soc B 39: 172–212. https://doi.org/10.1111/j.2517-6161.1977.tb01615.x.
Ripley BD (1979) Tests of ‘randomness’ for spatial point patterns. J R Stat Soc B 41: 368–374. https://doi.org/10.1111/j.2517-6161.1979.tb01091.x.
Schoener T (1983) Field experiments on interspecific competition. Am Nat 122: 240–285. https://doi.org/10.1086/284133.
Spielman SE (2017) Point pattern analysis. In: Richardson D, Castree N, Goodchild MF, Kobayashi A, Liu W, Marston RA (eds) International encyclopedia of geography: people, the earth, environment and technology. John Wiley & Sons Inc., New Jersey. https://doi.org/10.1002/9781118786352.wbieg0849.
Stoyan D, Penttinen A (2000) Recent applications of point process methods in forestry statistics. Stati Sci 15: 61–78. https://doi.org/10.1214/ss/1009212674.
Takahashi MK, Kubota T, Horner LM, Keller NA, Abrahamson WG (2012) The spatial signature of biotic interactions of a clonal and non-clonal palmetto in a subtropical plant community. Ecosphere 3: 1–12. https://doi.org/10.1890/ES12-00101.1.
Tang M, Zhou G, Shi Y, Chen Y, Wu Y, Zhao M (2006) Study of dominant plant populations and their spatial patterns in evergreen broadleaved forest in Tianmu Mountain, China. Chinese J Plant Ecol 30: 743–752. https://doi.org/10.17521/cjpe.2006.0096.
Vargas-Gaete R, Cuevas JG, Quesne CL, Reif A, Bannister J (2010) Spatial distribution and regeneration strategies of the main forest species on Robinson Crusoe Island. Rev Chil Hist Nat 83: 349–363. https://doi.org/10.4067/S0716-078X2010000300003.
Vessella F, Salis A, Scirè M, Piovesan G, Schirone B (2015) Natural regeneration and gender-specific spatial pattern of Taxus baccata in an old-growth population in Foresta Umbra (Italy). Dendrobiology 73: 75–90. https://doi.org/10.12657/denbio.073.008.
Wiegand T, Moloney KA (2004) Rings, circles, and null-models for point pattern analysis in ecology. Oikos 104: 209–229. https://doi.org/10.1111/j.0030-1299.2004.12497.x.
Wiegand T, Gunatilleke S, Gunatilleke N, Okuda T (2007) Analyzing the spatial structure of a Sri Lankan tree species with multiple scales of clustering. Ecology 88: 3088–3102. https://doi.org/10.1890/06-1350.1.
Zhang Q, Bi R, Zhang J, Nyobe L, Miao Y, Liu X (2012) Dynamic analysis on spatial pattern of dominant tree species of cold-temperate coniferous forest in the succession process in the Pangquangou Nature Reserve. Acta Ecol Sin 32: 5713–5720. https://doi.org/10.5846/stxb201108191220.
Zhao M, Pang C, Yang S, Luo Y, Yu S (2015) Spatial patterns of Daphniphyllum macropodum in Tianmu Mountain, Zhajiang Province. J Zhejiang Univ (Science Edition) 42: 47–53. https://doi.org/10.3785/j.issn.1008-9497.2015.01.007.
Total of 39 references.
Send to email
