Yao Anicet Gervais Kouamé  ,
Mathieu Millan,
Aya Brigitte N'Dri,
Tristan Charles-Dominique,
Marcel Konan,
Adama Bakayoko,
Jacques Gignoux
,
Mathieu Millan,
Aya Brigitte N'Dri,
Tristan Charles-Dominique,
Marcel Konan,
Adama Bakayoko,
Jacques Gignoux
Multispecies allometric equations for shrubs and trees biomass prediction in a Guinean savanna (West Africa)
Kouamé Y. A. G., Millan M., N'Dri A. B., Charles-Dominique T., Konan M., Bakayoko A., Gignoux J. (2022). Multispecies allometric equations for shrubs and trees biomass prediction in a Guinean savanna (West Africa). Silva Fennica vol. 56 no. 2 article id 10617. https://doi.org/10.14214/sf.10617
Highlights
- New allometric equations were developed for predicting aboveground and belowground biomass (AGB and BGB) of trees and multi-stemmed shrubs in the Guinean savannas based on field measurements, providing information for West African mesic savannas and filling a critical knowledge gap
- AGB and BGB of trees were better predicted from the quantity ρDb2H (with ρ the specific wood density in g cm–3, Db the stem basal diameter in cm, and H the tree height in m)
- Obtaining accurate estimates of AGB and BGB in multi-stemmed shrubs required additional consideration of the total number of stems
- The root/shoot biomass ratio decreased with increasing of the stem size (measured by Db) for trees but remains relatively unchanged for shrubs.
Abstract
Currently, tools to predict the aboveground and belowground biomass (AGB and BGB) of woody species in Guinean savannas (and the data to calibrate them) are still lacking. Multispecies allometric equations calibrated from direct measurements can provide accurate estimates of plant biomass in local ecosystems and can be used to extrapolate local estimates of carbon stocks to the biome scale. We developed multispecies models to estimate AGB and BGB of trees and multi-stemmed shrubs in a Guinean savanna of Côte d’Ivoire. The five dominant species of the area were included in the study. We sampled a total of 100 trees and 90 shrubs destructively by harvesting their biometric data (basal stem diameter Db, total stem height H, stump area SS, as well as total number of stems n for shrubs), and then measured their dry AGB and BGB. We fitted log-log linear models to predict AGB and BGB from the biometric measurements. The most relevant model for predicting AGB in trees was fitted as follows: AGB = 0.0471 (ρDb2H)0.915 (with AGB in kg and ρDb2H in g cm–1 m). This model had a bias of 19%, while a reference model for comparison (fitted from tree measurements in a similar savanna ecosystem, Ifo et al. 2018) overestimated the AGB of trees of our test savannas by 132%. The BGB of trees was also better predicted from ρDb2H as follows: BGB = 0.0125 (ρDb2H)0.6899 (BGB in kg and ρDb2H in g cm–1 m), with 6% bias, while the reference model had about 3% bias. In shrubs, AGB and BGB were better predicted from ρDb2H together with the total number of stems (n). The best fitted allometric equation for predicting AGB in shrubs was as follows: AGB = 0.0191 (ρDb2H)0.6227 n0.9271. This model had about 1.5% bias, while the reference model overestimated the AGB of shrubs of Lamto savannas by about 79%. The equation for predicting BGB of shrubs is: BGB = 0.0228 (ρDb2H)0.7205 n0.992 that overestimated the BGB of the shrubs of Lamto savannas with about 3% bias, while the reference model underestimated the BGB by about 14%. The reference model misses an important feature of fire-prone savannas, namely the strong imbalance of the BGB/AGB ratio between trees and multi-stemmed shrubs, which our models predict. The allometric equations we developed here are therefore relevant for C stocks inventories in trees and shrubs communities of Guinean savannas.
Keywords
carbon stocks;
allometric equations;
shrubs;
trees;
aboveground and belowground biomass;
Guinean savannas
-
Kouamé,
UFR Sciences de la Nature, UFR-SN/ Station d’Ecologie de Lamto (CRE), Pôle de recherche Environnement et Développement Durable, Université NANGUI ABROGOUA, 02 BP 801 Abidjan 02, Côte d’Ivoire); Institute of Ecology and Environmental Sciences IEES-Paris (Sorbonne Université, CNRS, Université Paris Diderot, IRD, UPEC, INRA), 4 Place Jussieu, 75005, Paris, France
 https://orcid.org/0000-0002-0847-2569
E-mail
kouameyag@gmail.com
https://orcid.org/0000-0002-0847-2569
E-mail
kouameyag@gmail.com
-
Millan,
Centre for African Ecology, School of Animal, Plant and Environmental Sciences, University of the Witwatersrand, Private Bag 3, Johannesburg, South Africa; Global Change Biology Group, Department of Botany and Zoology, Stellenbosch University, Private Bag X1, Matieland 7602, South Africa; Institute of Botany of the Czech Academy of Sciences, v.v.i, Dukelská 135, Třeboň, 379 01, Czech Republic
https://orcid.org/0000-0002-0151-6055
E-mail
mathieu.millan@gmail.com
-
N'Dri,
UFR Sciences de la Nature, UFR-SN/ Station d’Ecologie de Lamto (CRE), Pôle de recherche Environnement et Développement Durable, Université NANGUI ABROGOUA, 02 BP 801 Abidjan 02, Côte d’Ivoire
https://orcid.org/0000-0002-6333-6279
E-mail
brigitte.aya@gmail.com
-
Charles-Dominique,
Institute of Ecology and Environmental Sciences IEES-Paris (Sorbonne Université, CNRS, Université Paris Diderot, IRD, UPEC, INRA), 4 Place Jussieu, 75005, Paris, France
https://orcid.org/0000-0002-5767-0406
E-mail
tristan.charles-dominique@sorbonne-universite.fr
- Konan, UFR Sciences de la Nature, UFR-SN/ Station d’Ecologie de Lamto (CRE), Pôle de recherche Environnement et Développement Durable, Université NANGUI ABROGOUA, 02 BP 801 Abidjan 02, Côte d’Ivoire E-mail marcelkonan.lamto@gmail.com
- Bakayoko, UFR Sciences de la Nature, UFR-SN/ Station d’Ecologie de Lamto (CRE), Pôle de recherche Environnement et Développement Durable, Université NANGUI ABROGOUA, 02 BP 801 Abidjan 02, Côte d’Ivoire E-mail bakadamaci@yahoo.fr
-
Gignoux,
Institute of Ecology and Environmental Sciences IEES-Paris (Sorbonne Université, CNRS, Université Paris Diderot, IRD, UPEC, INRA), 4 Place Jussieu, 75005, Paris, France
https://orcid.org/0000-0003-3853-9282
E-mail
jacques.gignoux@upmc.fr
Received 9 August 2021 Accepted 9 May 2022 Published 12 May 2022
Views 144240
Available at https://doi.org/10.14214/sf.10617 | Download PDF

Supplementary Files
1 Introduction
An accurate assessment of carbon (C) stocks and dynamics in savanna ecosystems is currently required for a better estimate of C balance in Africa (Ciais et al. 2011; Ifo et al. 2018). The African continent is extensively covered by savannas (Murphy et al. 2016), a biome in which woody and grassy plants coexist with varying relative abundance. Despite their lower density and smaller size compared to forests trees, savanna trees account for a significant contribution to the C budget of Africa (Delmas et al. 1991; Grace et al. 2006). Unfortunately, very little field data is available in African savannas and even more dramatically in the wet savannas, despite their large spatial extent. The total cover of the Guinean savannas is estimated to be about 600 million ha of land from western Senegal to eastern Nigeria, of which only ~10% is used for agriculture (Nyerges and Green 2000; World Bank 2009; Dinerstein et al. 2017), suggesting a high but undervalued carbon sequestration potential in this region. It is well established that both aboveground biomass (AGB) and belowground biomass (BGB) of savanna trees are significant contributors to the C sink, and should thereby be accurately estimated to calculate C balance (Loiola et al. 2015; Koala et al. 2017; Ifo et al. 2018). Currently, data is critically needed in tropical ecosystems (including forests and savannas), calling for developing new methods alleviating the practical challenges associated to digging out root systems; most current estimates of net primary productivity of woody plants and associated C stocks are derived from variables describing the aboveground compartment only (Yuen et al. 2013; Koala et al. 2017; Paul et al. 2019; Zhou et al. 2020). Estimating the BGB is a key step in refining tropical savanna models as a significant carbon stock is found belowground (Jackson et al. 1996; Mokany et al. 2006).
Allometric equations are necessary for estimating C stocks in vegetations around the world, as direct destructive measurements cannot be used at large scales (Addo-Danso et al. 2016; Ouédraogo et al. 2020). Initial destructive measurements in the field are however required to provide robust models (Picard et al. 2012). Allometric equations are statistical models estimating the tree biomass from their biometric characteristics, such as stem diameter or total tree height (Picard et al. 2012; Maulana et al. 2016). These equations are usually calibrated from field measurements on either a single species or a group of species chosen to describe a vegetation type (Ribeiro et al. 2011; Picard et al. 2012). The accuracy of the models always depends both upon the number of measurements per species and upon the range of environmental conditions from which individuals are sourced (Picard et al. 2012; Colgan 2013; Chave et al. 2014). For instance, landscape heterogeneity (not explicitly accounted for) induces larger error in allometric models and can be a source of sampling error propagation (van Breugel et al. 2011; Picard et al. 2012; Mbow et al. 2014). If significant information about the above- and belowground stocks of C is available in the dry sub-Saharan savannas, additional efforts are urgently needed to describe the wet savannas (i.e., Guinean savannas). These two types of savannas are controlled by very contrasted environmental drivers: drought and herbivory in dry savannas, fire and plant competition in wet savannas (Osborne et al. 2018). These separate drivers selected species with distinct suites of traits (Maurin et al. 2014; Charles-Dominique et al. 2016; Osborne et al. 2018; Kindermann et al. 2022), and could impact strongly the investment in belowground parts that is on average higher in fire dominated places (Frost et al. 1986; Gignoux et al. 1997; Tomlinson et al. 2012; Fidelis et al. 2013; February et al. 2019).
In West African dry savannas (Sudanian savannas), several multispecies allometric equations are available to estimate both AGB and BGB of savanna trees (Sawadogo et al. 2010; Chabi et al. 2016; Koala et al. 2017; Dimobe et al. 2018; Bayen et al. 2020; Ganamé et al. 2021). The situation is different in West African wet savannas (Guinean savannas) as very few equations have been proposed (like Ifo et al. 2018) and the estimation of tree biomass in this region commonly uses general pantropical equations (Djagbletey et al. 2018; Amara et al. 2019; Atsri et al. 2020), notably the equation suggested by Chave et al. (2014). While Guinean and Sudanian savannas host similar species, the overall communities are disjoint and carbon allocation strategies and biomass distribution in plants (AGB vs. BGB) is likely to differ as these two systems experience distinct fire and precipitation regimes (Tomlinson et al. 2012; Osborne et al. 2018). This implies that models should be informed by data sourced for each phytogeographic zone. A recent global analysis (Qi et al. 2019) highlighted the important variations of the root/shoot biomass ratio (RSR) across biomes and vegetation types, according to environmental variables including temperature, rainfall, plant height, shoot biomass, latitude, all differing between Guinean and Sudanian savannas. In tropical savannas, fire and herbivory induce rapid changes in vegetation structure affecting the ratio between above- and belowground tree parts (Frost et al. 1986; Sankaran et al. 2005; Staver et al. 2009; Tomlinson et al. 2012; Scogings and Sankaran 2019). In wet savannas, fire is recognized as the main factor controlling the growth dynamic of woody plants (Sankaran et al. 2005; Bond 2008; Staver et al. 2011; N’Dri et al. 2022) and should promote a higher RSR compared to dry savannas (Gignoux et al. 2006; Tomlinson et al. 2012; Pausas et al. 2018; Wigley et al. 2019; Le Stradic et al. 2021). Last, large-scale models have been developed for woody plants assuming they are all trees, while most individuals composing a savanna stand can be developing as shrubs, with several small diameter stems (Zizka et al. 2014). Both trees and shrubs are abundant in savannas and usually have long life-spans of comparable magnitude (Bond and Midgley 2001; Gignoux et al. 2006; N’Dri et al. 2014; Gaillard et al. 2018). The pantropical allometric equation proposed by Chave et al. (2014): first, is not designed to accurately describe shrubs that could have very different RSR from trees (Qi et al. 2019); second, implies recording their diameter at breast height (dbh) that is not practical for multi-stemmed shrubs (Tietema 1993; Paul et al. 2017; Magarik et al. 2019; Kindermann et al. 2022) because a majority are shorter than 1.3 m or too branched at this height. These problems affecting plant biomass estimations are amplified in savannas by the fire action. Indeed, frequent fires in savannas favor shrubs with large underground storage organs, by repeatedly killing their aboveground parts in earlier growth stages. This situation leads to a mismatch between AGB and BGB compared to an undisturbed case (Gignoux et al. 1997; Tomlinson et al. 2012; Swemmer and Ward 2019).
In this study, we measured aboveground and belowground biomass of the five dominant woody species of the savanna of the Lamto Scientific Reserve (Côte d’Ivoire) corresponding to a typical Guinean savanna (Menaut and Abbadie 2006). We then measured a few easy to record variables and tested how they could be used to estimate AGB and BGB for these species. Therefore, we propose multispecies allometric models for West African Guinean savannas, predicting total AGB and BGB of trees and shrubs. We calibrated our models using destructive sampling carried out on nine plots located in three different savanna physiognomies (open shrubby savanna, dense shrubby savanna, tall woody savanna) and the predictions of the allometric equations fitted here were compared to those of existing equations for a similar savanna ecosystem.
2 Material and methods
2.1 Study area and sampling sites
The study was carried out from 2017 to 2020 at the Lamto Scientific Reserve (LSR). LSR is located in the middle Côte d’Ivoire (6°13´–6°25´N and 5°15´–4°97´W) and belongs to the Pre-forest sector of the Guinean domain (Fig. 1) and to the Guinean forest-savanna mosaic ecoregion (Olson et al. 2001). In the LSR area, fire has been held responsible for the presence of savannas where climate should be able to sustain rainforests (Monnier 1968). Adjanohoun (1964) defines Guinean savannas as “stretches of tall grass enclosed in dense forests or between these and open forests− they are scattered with trees and palms− they contain relict patches of dense forest and are crossed by numerous gallery forests− without fire they develop into dense semi-deciduous forests’’. Over the 20-year period from 1998 to 2017, the average annual temperature and precipitation of LSR region were 28.5 °C and 1218 mm respectively. Rainfall periods are: a long rainy season from February to November, usually interrupted by a short dry season in August and a dry season from December to January. Temperatures are fairly constant between 27 and 29 °C throughout the year (Tiemoko et al. 2020).
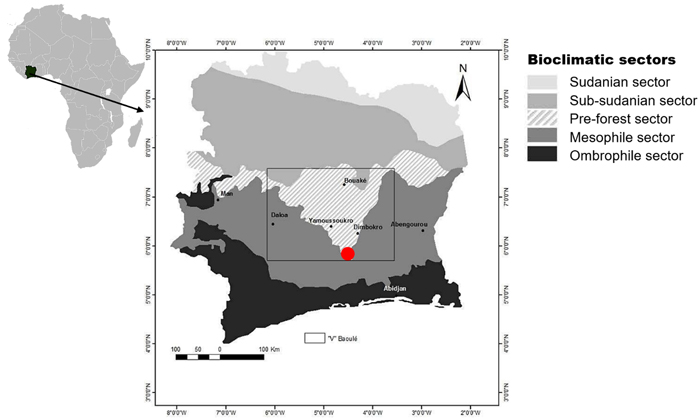
Fig. 1. Location of the study site: Lamto Scientific Reserve (in solid red circle), in Côte d’Ivoire. View larger in new window/tab.
LSR is about 80% Guinean savannas, with variable tree densities (Menaut and Abbadie 2006), the 20% remaining consist in gallery forests and forest islands. Thanks to the high-water availability, the savanna of LSR supports the development of a dense, diversified and tall grass layer, that can overtop the shrubs layer (Menaut and Abbadie 2006; Koffi et al. 2019). The total net primary production of the vegetation, including the aboveground and belowground net primary production of herbaceous and woody plants, were estimated to be 22–43 t ha–1 yr–1 of dry matter. The woody vegetation contributes at most 20% to this production (Menaut and César 1979; Menaut and Abbadie 2006). Three facies of savanna can be distinguished based on the cover of the woody and herbaceous species (Menaut and Abbadie 2006): a grassy savanna, dominated by the perennial grass Loudetia simplex (Nees) C.E.Hubb. (Poaceae) (woody cover < 7%) − a shrubby savanna, dominated by Andropogonaceae of the genera Andropogon L. and Hyparrhenia Andersson ex E.Fourn. (7% < woody cover < 62%) − and a woody savanna, with a discontinuous herbaceous layer and a very dense shrub layer (woody cover > 62%). When drying up, the grass layer provides abundant fuel for fires burning annually through the reserve, usually in mid-January. In the Lamto savannas, and generally in all the wet savanna ecosystems, regular burning of vegetation exerts a stabilizing effect on the habitat by preventing massive tree invasion (Monnier 1968; Menaut and Abbadie 2006; N’Dri et al. 2022).
Our study was conducted within three savanna physiognomies of the Lamto savannas (Supplementary file S1: Fig. 1): an open shrubby savanna, a dense shrubby savanna and a woody savanna. Sampling sites consisted of nine 0.5-hectare plots (50 m × 100 m) pre-established in 2016, with three plots representative of each savanna physiognomy (Suppl. file S1: Fig. 2).
2.2 Species of the study
We considered the most abundant woody species of the Lamto savannas. The woody layer of Lamto savannas is composed of about 90% of adult trees of the following four species: Bridelia ferruginea Benth. (Phyllanthaceae), Crossopteryx febrifuga (Afzel. ex G.Don) Benth. (Rubiaceae), Cussonia arborea Hochst. ex A.Rich. (Araliaceae), and Piliostigma thonningii (Schum.) Milne-Redh. (Fabaceae) (Menaut and Abbadie 2006). Annona senegalensis Pers. (Annonaceae) is also an abundant species but only in the shrub layer. According to Adjanohoun (1964), these five species belong to the Brachiaria Brachylopha Stapf (Poaceae) association and are native to the Sudano-Zambezian region before being acclimatized to humid conditions. Among these species, C. arborea and C. febrifuga grow only as single-stemmed trees from young to adult stages, whereas P. thonningii and B. ferruginea exist as single-stemmed trees or multi-stemmed shrubs, and A. senegalensis maintains a shrubby growth form in both young and old developmental stages (Monnier 1968; Menaut 1971). Photos of some specimens of each species are presented in Suppl. file S1: Fig. 3.
2.3 Sampling design
A total of 190 individuals among the five dominant species were collected − 90 of which were multi-stemmed shrubs and 100 were single stemmed trees (Table 1). The sampled shrubs were divided into three classes, based on the number of stems: 3–5 stems, 6–10 stems, and >10 stems. Trees were sampled in three classes of the stem basal diameter (Db): Db < 10 cm, 10 cm ≤ Db ≤ 15 cm and Db > 15 cm. Considering that the length of lateral roots of some woody plants can reach more than 20 m in the Lamto savannas (Monnier 1968), we distributed the total number of individuals to be sampled evenly among the nine study plots, with 10 shrubs per plot and 11 or 12 trees per plot. We sampled in such a way as to obtain samples of each species in the three studied savanna physiognomies. On each sampling site, the distance between two sampled individuals was kept to ~15–20 m.
| Table 1. Sampling criteria and number of trees and shrubs sampled per species. Among the five dominant woody species of LSR’s savanna, two (Crossopteryx febrifuga and Cussonia arborea) grow only in a typical single-stemmed tree, two (Piliostigma thonningii and Bridelia ferruginea) grow both as a single-stemmed tree or as a multi-stemmed shrub and one (Annona senegalensis) grows exclusively as a shrub. | |||||
| Species | Shrubs | Trees | Total | ||
| n | N | Db (cm) | N | ||
| A. senegalensis | 3–5 | 15 | - | - | 30 |
| A. senegalensis | 6–10 | 10 | - | - | |
| A. senegalensis | >10 | 5 | - | - | |
| B. Ferruginea | 3–5 | 15 | <10 | 10 | 55 |
| B. Ferruginea | 6–10 | 10 | 10–15 | 10 | |
| B. Ferruginea | >10 | 5 | >15 | 5 | |
| C. Febrifuga | - | - | <10 | 10 | 25 |
| C. Febrifuga | - | - | 10–15 | 10 | |
| C. Febrifuga | - | - | >15 | 5 | |
| C. arborea | - | - | <10 | 10 | 25 |
| C. arborea | - | - | 10–15 | 10 | |
| C. arborea | - | - | >15 | 5 | |
| P. thonningii | 3–5 | 15 | <10 | 10 | 55 |
| P. thonningii | 6–10 | 10 | 10–15 | 10 | |
| P. thonningii | >10 | 5 | >15 | 5 | |
| Total | 90 | 100 | N = 190 | ||
| n: number of stems per individual; N: number of samples; Db: stem basal diameter. | |||||
2.4 Measurement of dendrometric parameters of trees and shrubs
For trees, the total height of individuals (H) was measured using interlocking graduated stakes reaching a total height of 12 m. The basal diameter (Db, diameter above the aerial part of the stump) was directly measured for small-sized stems (Db ≤ 5 cm), using a caliper. For the individuals with basal diameter greater than 5 cm, we first measured the stem basal circumference also above the aerial part of the stump using a measuring tape, and then converted the circumference to diameter.
For shrubs, the total number of stems (n) for one individual was determined. We measured the individual’s maximum height (H), which corresponds to the height of the tallest stem, and the height (hi) and basal diameter (di) of each stem (i = 1…n). We also estimated an equivalent basal diameter (Db) for each individual multi-stemmed shrub from the sum of cross-sectional areas at the base of all the stems, according to the Eq. 1.

where Sb,i corresponds to the cross-sectional area at the base of each stem i (i = 1…n).
For each tree and shrub sampled, the total circumference of the stump (CS) was measured (see Suppl. file S1: Fig. 4) and was used to estimate the corresponding surface area of the stump (SS) according to Eq. 2.
![]()
2.5 Excavation and root removal
From the plant base, we exposed the main roots and the proximal parts of each lateral root in the first soil horizons by digging soil using a pickaxe, a daba (a kind of hoe with a short handle) and a machete. Each root was then excavated from its insertion zone towards its distal end. Fine roots (diameter < 2 mm, Jackson et al. 1996) were not sampled.
2.6 Determination of the dry biomass for each plant compartment
The aboveground part of each sample was cut at ground level and then divided into compartments: trunk, branches and leaves for large trees (Db > 10 cm); main stem, twigs and leaves for smaller trees (Db < 10 cm) and shrubs. Similarly, the belowground compartment of each sample was removed from the soil and divided into taproot and lateral roots. The stump was counted as a component of the belowground compartment.
The carbon mass represents about 40–50%, on average, of a plant’s dry biomass (Martin and Thomas 2011; Ma et al. 2018). To obtain the total dry biomass of samples in our study, the total fresh biomass of each component of the aboveground compartment (the trunk, large branches plus twigs and leaves for trees, and the stems including twigs and leaves for shrubs) was weighed after felling the stems and digging up the roots. The total fresh biomass (Bf) of above- and belowground components of large trees were obtained in the field to the nearest 25 g. The fresh biomass of shrubs components and that of all subsamples were obtained in the laboratory to the nearest 0.1 g. Five fresh subsamples of each sample were collected and weighed to obtain their fresh mass (bf), together totaling about 0.2–1 kg of stems (including twigs) for shrubs, 1–5 kg of trunk, 0.5–1 kg of branches plus twigs and 0.5–1 kg of stump for trees, 0.1–0.5 kg of leaves and 0.1–1 kg of roots (including tap root and lateral roots) for all the samples. All the subsamples were then oven-dried. The woody parts (trunk/stem, branches and twigs, roots) were dried at 105 °C and the leaves were dried at 75 °C, until a constant dry biomass (bd) was obtained after 3 to 5 days of drying. After drying the subsamples, the average water content (WC) of each sample of the different aboveground and belowground components was estimated using Eq. 3. The total dry biomass (Bd) of each aboveground and belowground component was thus deduced from Eq. 4, and then the total dry mass of the aboveground and belowground compartments (AGB and BGB) of each sample was estimated by summing all the Bd of their different components.

![]()
where WC (%) is the water content of one sub-sample; bf and bd are respectively the fresh biomass and dry biomass of each sub-sample of the sample of the aboveground and belowground components of plants; Bf and Bd (kg) are respectively the total fresh biomass and total dry biomass of each sample.
2.7 Statistical analysis, development and evaluation of the allometric equations
All the statistical analysis and graphics were performed using the version 4.0.2 of the R software (R core team 2020). Data were recorded in spreadsheets attached as Suppl. file S2, which metadata are in Suppl. file S3. The Suppl. file S4 includes all R-codes used to perform statistical tests and graphics.
Merging data of all the tree species together, the variation of the total aboveground biomass (AGB), the total belowground biomass (BGB) and the root/shoot biomass ratio (RSR) of trees were studied in relation to the different classes of the basal diameter (Db), using one-way ANOVA and Tukey’s HSD (honestly significant difference) tests. We similarly evaluated the variation of AGB, BGB and RSR of shrubs according to different classes of the total number of stems (n) and different classes of the equivalent basal diameter of stems (Db) using ANOVA or Student’s t-test. Differences in RSR between growth forms were tested using the Student’s t-test.
The reference model we retained to predict AGB and BGB after preliminary graphical exploration is the linearized logarithmic form of the power function: the allometric equations were fitted using log-log linear models relating AGB or BGB to the one or several predictors. All the variables measured in the field were considered as potential predictors or independent variables: the total number of stems (n), the stem basal diameter (Db, in cm) corresponding to the equivalent basal diameter of stems for multi-stemmed shrubs, the stem total height (H, in m) corresponding to the stem maximum height for multi-stemmed shrubs and the surface area of the stump (SS, in cm2). We used also, as explanatory variable, a proxy for plant biomass (w, in g cm–1 m) corresponding to the product ρDb2H, where the term Db2H represents a proxy of the stem volume V (V = αDb2H, with e.g., α = π/12 for a cone and α = π/4 for a cylinder, and most stem tapers with intermediate α values); ρ is the wood specific density (in g cm–3). For multi-stemmed shrubs Db2H was estimated for each individual from the basal diameter (di) and the height (hi) of each stem (i) according the Eq. 5.
![]()
The wood density values considered in this study represent the averages obtained from wood density values provided by the following studies or databases: N’Dri et al. (2018a), Ifo et al. (2018), Aabeyir et al. (2020), the Global wood density database (Zanne et al. 2009), the African Wood Density Database (Carsan et al. 2012). N’Dri et al. (2018a) study was achieved on tree samples of the LSR and provides a species-specific value for Bridelia ferruginea, Crossopteryx febrifuga, Cussonia arborea and Piliostigma thonningii. Ifo et al. (2018) also provide a species-specific value, for Annona senegalensis, B. ferruginea and C. febrifuga. Aabeyir et al. (2020) provide a species-specific value for C. febrifuga and P. thonningii. A genus-level average value was extracted from the African Wood Density Database for C. arborea, while the Global wood density database provides a species-specific value for C. febrifuga and allowed us to compute a genus-level average value for A. senegalensis, B. ferruginea and C. arborea.
We initially checked for multicollinearity between the independent variables (n, Db, H, w and SS) by determining the variance inflation factor (VIF, Belsley 1980) associated with each variable in the regression models of AGB and BGB. The VIF was computed according the Eq. 6. It represents the score of a given independent variable highlighting the degree to which other independent variables explain this variable. In this study, we considered an independent variable as non-collinear to other(s) when the VIF value was not exceeding 10 (Midi and Bagheri 2010).

where VIFj is the variance inflation factor for the jth predictor and can take on values from unity to infinity.
After removing the predictors with a VIF value > 10, all the remaining independent variables were used in a first full model, and then we investigated for the best models for predicting AGB and BGB by eliminating some of the predictors using stepwise selection (Zhang 2016). The criteria for evaluating the performance of the models were the p-value of each independent variable, the model simplicity (i.e., with fewer predictors), the adjusted coefficient of determination (Adj. R2) and the Akaike information criterion (AIC). The validation assumptions of the models were tested by examining the residuals versus fitted values to check for homogeneity of variance and the normality of residuals (Suppl. file S3).
The logarithmic transformation of data induces a bias in the biomass estimation when reverting to the initial variables (Baskerville 1972). A correction of AGB and BGB estimates was therefore necessary and consisted of multiplying the estimated biomass by a correction factor (CF) calculated as (Sprugel 1983, Eq. 7):

where CF is the correction factor and RSE is the residual standard error of the regression.
In the next step, we tested whether the relation between AGB or BGB and the quantitative independent variables retained in the final model differed significantly (P-value < 0.05) according to growth form and species as categorical explanatory variables, using analysis of covariance (ANCOVA). ANCOVA combines linear regression and ANOVA and tests if the slopes of the interactions between the different terms of the categorical variable and of a given quantitative variable are different from each other (Crawley 2013). With regards to the growth form, when the interactions were significant, we fitted separate models for trees and shrubs individually. In the case of non-significant interactions, a single prediction model for both trees and shrubs would be better. We also examined for differences in regression parameters between the different species.
Finally, the AGB and BGB prediction models fitted in this study were compared to those of Ifo et al. (2018) fitted from tree measurements in the savanna of the Plateau Batéké (Congo) by using basal diameter as a predictor instead of dbh (equation 3 for AGB and equation 5 for BGB in their study). Three of the studied species in our study were part of the Ifo et al. (2018) study, namely Annona senegalensis, Bridelia ferruginea and Crossopteryx febrifuga. Models were compared on the basis of the model bias. The model bias is a measure of systematic deviation of model predictions from observed data (Chave et al. 2014; Aabeyir et al. 2020) and was computed from Eq. 8.

where Bobs,i is the observed biomass of the ith sample, Best,i is the predicted biomass of the ith sample, N is the number of samples.
3 Results
3.1 Distribution of dendrometric parameters and variation of aboveground biomass, belowground biomass and root/shoot biomass ratio
The total height (H) of the samples of single-stemmed trees ranged from 0.75 to 7.5 m, with an average value of 3.43 m. The basal diameter (Db) of stems ranged from 2 to 59 cm, with an average value of 14 cm. The stump surface area (SS) ranged from 3 cm2 to 3555 cm2 (average 313 cm2). The shrubs had between 3 and 23 stems, and maximum heights (H) ranged from 0.75 to 2.5 m. The equivalent basal diameter (Db) of the stems of shrubs ranged from 2 to 9 cm, while the stump surface area ranged from 25 to 2477 cm2.
RSR significantly differed between growth forms, either considering all species (P < 0.001, Fig. 2A), or considering separately those species that present both growth forms (P < 0.001 for each species, Fig. 2B). Overall, the mean RSR of shrubs (estimated at 1.8 ± 0.7) was higher than that of trees (estimated at 0.9 ± 0.72) (Fig. 2A). The total aboveground dry biomass (AGB) ranged from 0.1 to 139.23 kg (average 18.8) in trees and from 0.1 to 5.16 kg (average = 0.85) in shrubs (Fig. 3). The total belowground dry biomass (BGB) ranged from 0.12 to 71.71 kg (average 9.98) in trees and from 0.11 to 9.21 kg (average 1.62) in shrubs (Fig. 3). The RSR was significantly higher in smaller trees (Db < 10 cm) compared to larger trees (Db > 10 cm) (one-way ANOVA, F(2,97) = 21.49, P < 0.001, Fig. 3C): it was greater than 1 (BGB > AGB) in smaller trees and less than 1 (BGB < AGB) in larger trees. In shrubs, the RSR did not vary significantly with the individual number of stems nor with Db (one-way ANOVA, P > 0.05). As in small trees with Db < 10 cm, the RSR was generally greater than 1 (BGB > AGB) in shrubs, regardless of their Db and number of stems (Fig. 3F).
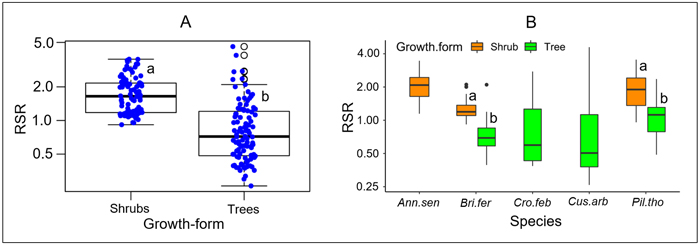
Fig. 2. Distribution of the root/shoot biomass ratio (RSR) according to its growth form. In Panel A, species are pooled according to their growth form; specific values are shown in panel B. The different box colors in panel B correspond to different growth forms. The lower-case letters next to box plots indicate, when different, groups of significantly different values at the 95% threshold according to Student’s t-test. At intraspecific level (panel B), comparison of RSR between growth forms was done only for species including both growth forms (tree and shrub). Plant species: Ann.sen (Annona senegalensis); Bri.fer (Bridelia ferruginea); Cro.fer (Crossopteryx febrifuga); Cus.arb (Cussonia arborea); Pil.tho (Piliostigma thonningii).
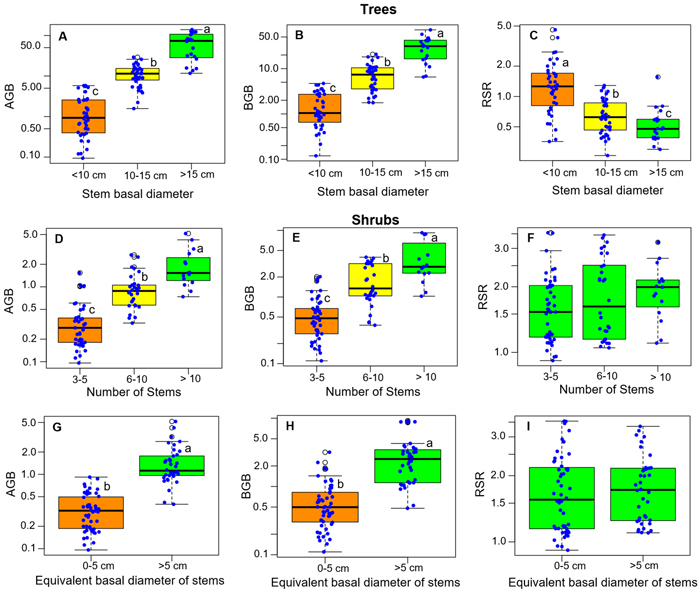
Fig. 3. Distribution of the total above- and belowground biomass (AGB and BGB) and of the root/shoot biomass ratio (RSR) according to classes of basal diameter, number of stems and stem equivalent basal diameter for shrubs. The box colors and lower-case letters next to box plots indicate, when different, groups of significantly different values at the 95% threshold according to Tukey’s HSD post-hoc test by class of each variable (panels 3A–3E) or to Student’s t-test (panels 3G–3I). View larger in new window/tab.
3.2 Allometric equations for predicting AGB and BGB
Except for the variable Db with associated VIF = 11.25, all the other independent variables had VIF < 10 and were included in the full starting model for stepwise regression. At conventional level, only effects of variables w (proxy for stem biomass computed from stem volume, w = ρDb2H) and n (total number of stems) were found to be statistically significant (P < 0.05) for predicting AGB and BGB considering by both tree and shrub measurements. After application of the stepwise selection procedure (Suppl. file S5: Text 1 and Text 2), the final models predicted AGB and BGB from w and n, with Adj-R2 = 0.91 and AIC = 309 for the AGB prediction model, and Adj-R2 = 0.83 and AIC = 352 for the BGB prediction model. However, on the one hand, the ANCOVA test (Table 2) showed strong interaction between w and the growth form in the AGB prediction model. On the other hand, the interaction between n and the growth form seemed to be trivial since all trees had n = 1 stem, while n strongly varied in shrubs. In the BGB prediction model, the interaction between the w and the growth form was not significant, but the model was also affected by the difference in dispersion of n values between trees and shrubs. In addition, analysis of the data distribution showed that trees reach a much larger aerial volume (Db2H) than shrubs − the average aerial volume of the sampled trees was about 151.1 dm3 (min = 0.265; max = 1909.165), which is about 42 times larger than that of the shrubs, which was 3.6 dm3 (min = 0.609; max = 12.902). For these reasons, we finally fitted separate models for predicting AGB and BGB for trees and shrubs.
| Table 2. Effects of growth form, w (ρDb2H in g cm–1 m) and n (total number of stems) and their interaction on the estimation of the aboveground and belowground biomass (AGB and BGB) in Lamto trees and shrubs. For trees, Db (cm) corresponds to the stem basal diameter and H (m) represents the total height in the term ρDb2H. For shrubs, the term Db2H corresponds to the sum of di2hi (i = 1…n) of the n stems, where di (cm) and hi (m) are respectively the basal diameter and the total height of each stem. ρ (g cm–3) is the woody specific density. | ||||
| Dependent variables | Source of variation | Mean Sq | F value | P value |
| ln(AGB) | Growth form | 242.31 | 1021.72 | <0.001*** |
| ln(w) | 332.04 | 1400.05 | <0.001*** | |
| ln(n) | 11.07 | 46.68 | <0.001*** | |
| Growth form: ln(w) | 2.55 | 10.74 | <0.01** | |
| ln(BGB) | Growth form | 107.24 | 356.31 | <0.001*** |
| ln(w) | 214.84 | 713.83 | <0.001*** | |
| ln(n) | 23.10 | 76.75 | <0.001*** | |
| Growth form: ln(w) | 0.03 | 0.09 | >0.05 | |
In trees, AGB and BGB were better predicted from w (Table 3). The results of ANCOVA tests revealed significant interaction (P < 0.001) between w and species (Suppl. file S5: Table 1), resulting in the variation of regression coefficients and the goodness of AGB and BGB prediction models between species (Table 4). Regardless to the AGB prediction model, Adj-R2 significantly increased in Crossopteryx febrifuga and Piliostigma thonningii (0.96 and 0.94 respectively), while Adj-R2 decreased in Bridelia ferruginea and Cussonia arborea (0.86 and 0.87 respectively; Table 4). The same pattern was found for the BGB prediction model; Adj-R2 significantly increased in C. febrifuga and P. thonningii (0.97 and 0.91 respectively) and decreased in B. ferruginea and C. arborea (0.76 and 0.71 respectively; Table 4). Ultimately, AGB was predicted in trees according to Eq. 9 and BGB was predicted following Eq. 10, including the bias correction factor (Eq. 7). Fig. 4A and Fig. 4B show the graphical representation of the two models respectively, and the normal probability plot and other quantile distributions that allowed us to validate the assumptions of each model are provided in Suppl. file S5: Fig. 1 and Suppl. file S5: Fig. 2 respectively.
| Table 3. Regression parameters of the fitted allometric models for predicting above- and belowground biomass (AGB and BGB in kg) of trees and shrubs measured in the Guinean savanna of Lamto Scientific Reserve. Variable w corresponds to the product ρDb2H (g cm–1 m) and variable n represents the total number of stems. For trees, Db (cm) corresponds to the stem basal diameter and H (m) represents the total height in the term ρDb2H. For shrubs, the term Db2H corresponds to the sum of di2hi (i = 1…n) of the n stems, where di (cm) and hi (m) are respectively the basal diameter and the total height of each stem. ρ (g cm–3) is the woody specific density. Values in brackets = standard error (se) of the estimated value; Adj-R2 = Adjusted R square; AIC = Akaike information criterion; CF = Correction factor due to logarithmic transformation; a, b and c are constants and represent the regression coefficients of the models. | |||||||
| Model | Regression coefficients | Adj-R2 | AIC | CF | |||
| a (se) | b (se) | c (se) | |||||
| Trees | ln(AGB) = a + b ln(w) | –3.2191 (0.18) *** | 0.9150 (0.03) *** | - | 0.90 | 176.19 | 1.1780 |
| ln(BGB) = a + b ln(w) | –2.2527 (0.18) *** | 0.6899 (0.03) *** | - | 0.82 | 181 | 1.1875 | |
| Shrubs | ln(AGB) = a + b ln(w) + c ln(n) | –4.0272 (0.17) *** | 0.6227 (0.06) *** | 0.9271 (0.09) *** | 0.84 | 80.27 | 1.0699 |
| ln(BGB) = a + b ln (w) + c ln(n) | –3.9059 (0.23) *** | 0.7205 (0.09) *** | 0.9920 (0.13) *** | 0.77 | 136.56 | 1.1347 | |
| Table 4. Difference between species of the regression parameters of the fitted allometric models for predicting above- and belowground biomass (AGB and BGB in kg) of trees and shrubs measured in the Lamto Scientific Reserve. Variable w corresponds to the product ρDb2H (g cm–1 m) and variable n represents the total number of stems. For trees, Db (cm) corresponds to the stem basal diameter and H (m) represents the total height in the term ρDb2H. For shrubs, the term Db2H corresponds to the sum of di2hi (i = 1…n) of the n stems, where di (cm) and hi (m) are respectively the basal diameter and the total height of each stem. ρ (g cm–3) is the woody specific density. Values in brackets = standard error (se) of the estimated value; Adj-R2 = Adjusted R square; CF = Correction factor due to logarithmic transformation; a, b and c are constants and represent the regression coefficients of the models. | |||||||
| Growth form | Model for biomass prediction | Species | Regression coefficients | Adj-R2 | CF | ||
| a (se) | b (se) | c (se) | |||||
| Trees | ln(AGB) = a + b ln(w) | B. ferruginea | –1.9674 (0.32) *** | 0.7226 (0.06) *** | - | 0.86 | 1.0822 |
| C. febrifuga | –4.1332 (0.24) *** | 0.1000 (0.04) *** | - | 0.96 | 1.1059 | ||
| C. arborea | –3.2339 (0.39) *** | 0.9374 (0.07) ** | - | 0.87 | 1.2743 | ||
| P. thonningii | –3.1290 (0.28) *** | 0.9167 (0.05) *** | - | 0.94 | 1.0293 | ||
| ln(BGB) = a + b ln(w) | B. ferruginea | –1.7230 (0.38) *** | 0.6116 (0.07) *** | - | 0.76 | 1.1176 | |
| C. febrifuga | –3.0946 (0.18) *** | 0.7650 (0.03) *** | - | 0.97 | 1.0564 | ||
| C. arborea | –1.8752 (0.40) *** | 0.5928 (0.08) ** | - | 0.71 | 1.2989 | ||
| P. thonningii | –2.1070 (0.26) *** | 0.7361 (0.05) *** | - | 0.91 | 1.0678 | ||
| Shrubs | ln(AGB) = a + b ln(w) + c ln(n) | A. senegalensis | –4.4805 (0.20) *** | 0.8738 (0.10) *** | 0.8865 (0.12) *** | 0.94 | 1.0264 |
| B. ferruginea | –3.3522 (0.24) *** | 0.7027 (0.07) *** | 0.5083 (0.12) *** | 0.86 | 1.0463 | ||
| P. thonningii | –4.2124 (0.20) *** | 0.1112 (0.13) >0.05 | 1.7147 (0.17) *** | 0.94 | 1.0293 | ||
| ln(BGB) = a + b ln (w) + c ln(n) | A. senegalensis | –4.5151 (0.37) *** | 1.0006 (0.19) *** | 1.0992 (0.22) *** | 0.86 | 1.0954 | |
| B. ferruginea | –3.4570 (0.29) *** | 0.8295 (0.08) *** | 0.5008 (0.14) ** | 0.84 | 1.0718 | ||
| P. thonningii | –3.8090 (0.37) *** | 0.3054 (0.24) >0.05 | 1.5140 (0.30) *** | 0.84 | 1.0989 | ||
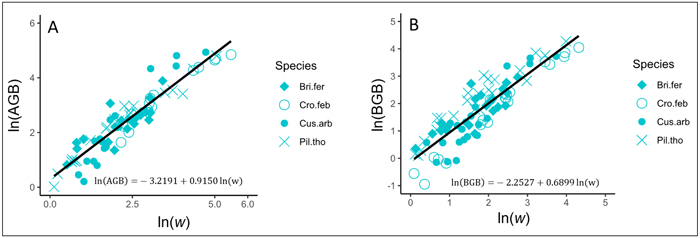
Fig. 4. Fits of the best models predicting the above- and belowground biomass (AGB and BGB) of trees in the savanna of the Lamto Scientific Reserve: A) Fit of the best model predicting AGB in trees; B) Fit of the best model predicting BGB in trees. AGB and BGB are well predicted from the variable w (g cm–1 m) = ρDb2H, where Db (cm) and H (m) represent the stem basal diameter and the stem total height, respectively; ρ (g cm–3) is the woody specific density. Tree species are shown with different symbols. View larger in new window/tab.
![]()
![]()
with AGB and BGB in kg and w = ρDb2H in g cm–1 m.
In shrubs, AGB and BGB were better predicted using both w and n in the prediction models (Table 3). Given two shrubs with the same aerial volume but different numbers of stems, the one with the greater number of stems is expected to have the greater BGB (Fig. 5B). As a result, in species growing both as multi-stemmed shrubs and single-stemmed trees, individuals growing in shrubby growth form have potentially higher BGB than young trees with same aerial size. The results of ANCOVA tests (Suppl.file S5: Table 1) revealed significant interaction (P < 0.001) between species and w (P < 0.05) and between species and n (P < 0.01); therefore, regression coefficients and the goodness of AGB and BGB prediction models varied between species (Table 4). Overall, the Adj-R2 of both AGB and BGB prediction models increased at the specific level. For AGB prediction model, we found the same value of Adj-R2 = 0.94 in Annona senegalensis and Piliostigma thonningii, while in Bridelia ferruginea, the Adj-R2 reached 0.86 (Table 4). With respect to the BGB prediction model, the Adj-R2 reached 0.84 in B. ferruginea and P. thonningii, and was 0.86 in A. senegalensis (Table 4). Ultimately, AGB was predicted in shrubs following Eq. 11 and BGB was predicted according to Eq. 12. Fig. 5A and Fig. 5B show the graphical representation of the two models respectively. The normal probability plot and other quantile distributions that allowed us to validate the assumptions of each model are provided in Suppl. file S5: Fig. 3 and Suppl. file S5: Fig. 4 respectively.
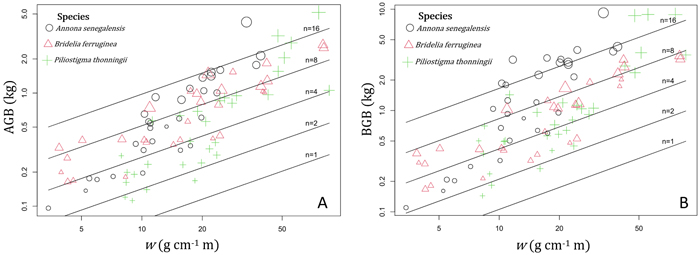
Fig. 5. Variation of the aboveground biomass (AGB) and belowground biomass (BGB) of shrubs according to the variable w = ρDb2H and the total number of stems (n). In the term ρDb2H, ρ (g cm–3) is the woody specific density and the term ρDb2H corresponds to the sum of di2hi (i = 1…n) of the n stems (with di = basal diameter in cm and hi = total height of each stem in m). The different symbols and color of data points correspond to the different shrub species, and the size of points is proportional to log(n). View larger in new window/tab.
![]()
![]()
with AGB and BGB in kg, w = ρDb2H in g cm–1 m and n = total number of stems in individual shrub.
3.3 Comparison with others allometric equations fitted for Guinean savanna trees
The AGB prediction model of Ifo et al. (2018) – fitted from tree measurements in the Guinean savanna of the Plateau Batéké (Congo) using basal diameter as a predictor instead of dbh – overestimated the AGB of trees measured in Lamto savannas with a 133% bias. This bias is very high compared to the 19% overestimation with the allometric equation fitted in our study (Table 5). Using the shrub dataset, Ifo et al. equation overestimated the AGB by about 79%, against 1.5% overestimation with our equation. Conversely, the BGB prediction model of Ifo et al. (2018) better predicted the BGB of Lamto savannas trees with only 2.7% overestimation, compared to the allometric equation we fitted in this study that overestimated the BGB by 6%. But the Ifo et al. (2018) model underestimated the BGB of shrubs of Lamto savannas by 14%, while our equation overestimated the BGB of shrubs by only 2.7% (Table 5).
| Table 5. Comparison of model accuracy between the allometric models fitted to trees and shrubs measurements of the savanna of Lamto Scientific Reserve and the allometric equations adjusted by Ifo et al. (2018) from trees measurements in the savanna of the Plateau Batéké in Congo basin. The variable w corresponds to the product ρDb2H (g cm–1 m), where Db (cm) and H (m) respectively represent the stem basal diameter and the total height in trees; and in shrubs the term Db2H corresponds to the sum of di2hi (i = 1…n) of the n stems (di = basal diameter in cm; hi = total height of each stem in m). ρ (g cm–3) is the woody specific density. Written alone, Db (cm) corresponds to the stem basal diameter for trees and to the equivalent basal diameter of stems for shrubs (see Eq. 1 for detail relative to the measure of the equivalent basal diameter in shrubs). | ||||
| Models fitted in this study | Ifo et al. (2018) models | |||
| Trees | Shrubs | Trees | Shrubs | |
| Model | AGB = 4.71 10–2 (w)0.9150 | AGB = 1.91 10–2 (w)0.6227 (n)0.9271 | AGB = 9.31 10–2 (w)0.9135 | |
| Model bias (%) | 19.04 | 1.48 | 132.48 | 78.76 |
| Model | BGB = 1.25 10–1 (w)0.6899 | BGB = 2.28 10–2 (w)0.7205 (n)0.9920 | BGB = 12.58 10–2 (ρDb2)0.8640 | |
| Model bias (%) | 6.04 | 2.70 | 2.65 | –14.05 |
4 Discussion
We developed multi-species allometric equations to predict the total aboveground biomass (AGB) and the total belowground biomass (BGB) of trees and shrubs in the Guinean savannas. Our study was carried out in a Guinean savanna of Côte d’Ivoire and considered the dominant woody species of this biome, i.e., Crossopteryx febrifuga, Piliostigma thonningii, Cussonia arborea, Bridelia ferruginea and Annona senegalensis (Menaut and César 1979). The notion of dominant species in a given ecosystem generally refers to a large population size or the size of individuals of some species, usually observed/measured at aboveground level. However, the dominance concept can also be applied to species or individuals with significant belowground proportions (Ottaviani et al. 2020), as it is the case for shrubs in savanna ecosystems. Neglecting shrub biomass in woody biomass measurements in savannas may therefore lead to a relatively large underestimation of C stocks in this biome, contributing to uncertainties in the carbon balance of Africa. For example, in the shrubby savannas of Lamto, where we conducted this study, the average tree density can be estimated at 380/ha (30% of total woody density) and the average shrub density at 900/ha (70% of woody density), based on floristic inventories (N’Dri et al., unpublished data) conducted on nine 0.5-ha plots described by N’Dri et al. (2018b). Considering these proportions and the average of directly measured AGB and BGB of trees and shrubs, we found that shrubs represent about 10% of the total AGB and more importantly, 27% of the total BGB. Ignoring the shrub biomass would therefore represent a significant underestimation of the total woody biomass in Lamto savannas. Another source of underestimation of woody biomass in savannas is the use of a default root/shoot biomass ratio (RSR) – as indicated in the 2006 IPCC Guidelines for national greenhouse gas inventories (Eggleston et al. 2006) – for estimating the BGB of trees. For example, in Côte d’Ivoire, the default RSR used in the implementation of REDD+ is 1/5, i.e., BGB = 0.2 AGB. According to our predictions, the average BGB of trees in the Lamto savannas is about 6 t ha–1 of dry matter. While applying the IPCC default RSR, the BGB would be estimated to about 2.3 t ha–1, i.e., about 160% underestimated. The use of allometric equations developed in this study could therefore contribute to the enhancement of tree BGB measurements in Guinean savannas, which is a requirement to get financial compensation related to REDD+ and others C sequestration activities in these environments (Picard et al. 2012).
Among several explanatory variables we tested, w = ρDb2H was found to be the most relevant for better prediction of AGB and BGB of trees in the Lamto savannas. Our results support the suggestion of Chave et al. (2014) who proposed a single allometric model for estimating AGB of tropical trees using the combined variable ρD2H as unique predictor when wood specific gravity (ρ), trunk diameter (D) and total tree height (H) are available. Indeed, from the exploration of a very large database consisting of direct measurements of over 4000 trees from 58 sites, Chave et al. (2014) found that the AGB of tropical trees was reliably predicted by ρD2H, regardless of the vegetation type, the provenance, and the environmental factors. This finding was very relevant and is helpful in the context of regionalization or extrapolation of allometric equations for estimating tree biomass and carbon stocks at broader scales (Picard et al. 2012). Although Chave et al. (2014) analysis focused on the AGB of tropical forest trees – excluding trees with dbh < 5 cm – our results showed that the AGB and the BGB of the Lamto savannas trees are also better estimated (Adj-R2 = 0.90 and 0.82 respectively) using w = ρD2H as the single predictive variable. Ifo et al. (2018) and Aabeyir et al. (2020) also highlighted the accuracy of estimates of the AGB of trees using ρD2H as single predictor, respectively in the Central African and West African wet savannas. The power of ρD2H for predicting tree biomass, especially for estimating the AGB, is due to its being a good proxy of tree biomass. Indeed, ρD2H describes a minimal model where the trunk/stem is considered as an integrative compartment of all the mechanical and functional constraints of the tree, while being massive and having a fairly simple shape (between cylinder and cone). We can therefore assume that the trunk/stem volume, calculated from a realistic hypothesis about its shape (the square of the diameter times the height), is a good predictor of the AGB of trees (Crow and Schlaegel 1988). However, the use of the basal diameter rather than the diameter at breast height (dbh) – that is widely used for biomass prediction in forest trees – is more reliable for predicting tree biomass in West African savannas (Sawadogo et al. 2010; Amadou 2020; Ouédraogo et al. 2020). The base of the stem represents the best part for measuring accurately stem diameter in savanna trees, as higher up stems are generally deformed due to regular fire damage. Also, dbh is an unpractical measure for multi-stemmed shrubs (Tietema 1993; Paul et al. 2017; Magarik et al. 2019; Kindermann et al. 2022) since a majority reaches stem heights shorter than 1.3 m and can total a large number of stems (more than 20 in our case).
The use of the pantropical allometric equation of Chave et al. (2014) often mis-estimated the biomass of savanna trees at the local scale, i.e., at site-specific or species-specific levels (Chabi et al. 2016; Beirne et al. 2019; Ganamé et al. 2021). This has been attributed, on the one hand, to the difference in size between the local and the pantropical databases, and on the other hand, to the fact that the pantropical equation was fitted from data of many sites (58 sites) and numerous species with different ecological characteristics (Djomo et al. 2010; Fayolle et al. 2013; Henry et al. 2013; Chave et al. 2014; Goussanou et al. 2016; Beirne et al. 2019). If we agree that using ρD2H as single predictor leads to more accurate estimates of the AGB of tropical trees, then the regression of AGB by ρD2H should be readjusted for savanna trees using specific field data and at a given spatial scale (Ifo et al. 2018). If tree species used to fit allometric equations share the same growing conditions and functional traits, we expect (i) regression parameters of AGB on ρD2H to be good and specific for the growing environment, and (ii) AGB (and BGB) estimates from ρD2H to be more accurate (van Breugel et al. 2011; Picard et al. 2012; Mbow et al. 2014). To generalize, we believe that the pantropical approach would be more interesting and consensual if applied to each specific biome by harvesting data from different sites with the same ecological drivers. In this regard, the multispecies allometric models provided here may be relevant for the Guinean savanna ecoregion or the wet savanna ecoregion, where trees have similar physiognomy and functional traits (Osborne et al. 2018). In wet savannas, the high frequency of fire has led trees species to develop common functional traits such as: high ability to regrow rapidly after fire, high growth rate of bark between two successive fire episodes, shade intolerance, low specific leaf area, and high RSR at young ontogenic stages (Gignoux et al. 1997; Bond et al. 2008; Dantas and Pausas 2013; Parr et al. 2014; Charles-Dominique et al. 2015).
According to Chave et al. (2014), the environmental variability results mainly in variation in height-diameter allometries of trees across the vegetation types they studied (i.e., tropical wet, dry and moist forests). Concerning savanna ecosystems, several studies have pointed out that frequent fires can affect the architecture and the growth form of woody species (Hoffmann and Solbrig 2003; Mlambo and Mapaure 2006; Zizka et al. 2014; Moncrieff et al. 2014; Stevens 2021; Clarke et al. 2021). For example, some savanna species such as Bridelia ferruginea and Piliostigma thonningii we studied here grow as both single-stemmed trees and multi-stemmed shrubs, due to the variability of fire effects on stems in the early growth stages. The construction of a single stem versus multiple stems may suggest two different strategies of carbon investment in the AGB (Higgins et al. 2007; Sheffer et al. 2014; Götmark et al. 2016; Yang et al. 2020) that can result in a variation of the height-diameter allometries among and within species.
According to our results, the height-diameter relationship varied according to the growth form and species (Suppl. file S5: Table 2), and the inclusion of stem number (n) as a secondary predictive variable associated with ρDb2H improved the allometric models for predicting AGB and BGB in both trees and shrubs communities of Lamto savannas (Table 2). In the single allometric model proposed by Chave et al. (2014) all trees were assumed to have a single stem, hence the form factor (defined as the ratio between AGB and ρDb2H) varied weakly across vegetation types. If the variation in the total number of stems (n) between vegetation types was considerable, as would be the case by taking into account both tree and shrub vegetations, it is logical to assume that the form factor would be dependent on n and would differ across vegetation types and according to the species or the growth form. All the trees harvested in our study had a single stem while n varied from 3 to 23 in shrubs. Although the number of stems was implicitly accounted for the Db2H calculation in shrubs by summing the db2h of all the individual stems, the variable n nevertheless significantly contributed to improve AGB and BGB prediction when data of trees and shrubs were taken together or by using only the dataset on shrubs. In addition, the variance inflator factor (VIF) associated with the variable n indicated no collinearity with the other variables. The number of stems was also identified by Lufafa et al. (2009) as a good predictor of BGB in some shrub communities of Senegal. We think that the association of w with n can be explored as a way to extend the pantropical model of Chave et al. (2014) to savannas and other biomes where multi-stemmed shrubs are abundant.
Our results suggested that the higher the number of voluminous stems, the greater the BGB of shrubs (Fig. 5B). Some observations in the field reveal the limits to this relationship. As long as individuals maintain the same regrowth vigor (expressed by the number and/or the size of stems) and stems remain alive over time, this relationship holds. However, some older individuals have their resprouting abilities decreasing, probably due to the repeated injuries by fire. They reach a senescence phase that does not follow the same allocation patterns (Gatsuk et al. 1980). Older individuals typically have a very large root system, retained over time, while their shoot system has been both removed by fire and reconstituted with smaller volume, size and number of stems when the plant is senescent (Gatsuk et al. 1980). As a large proportion of woody species in frequently disturbed environments by fire have traits promoting their persistence and an overall strategy based on survival, not fast growth or reproduction (Bond and Midgley 2001), we urgently need more information about plants allocation patterns and how they are modulated along their ontogeny.
On the one hand, we noted a relative similarity in BGB estimates of trees between the prediction from our equation and the prediction of the Ifo et al. (2018) equation (Table 5), although the two models are fitted with different predictors: ρDb2H in our study and ρDb for Ifo et al. (2018). Existence of collinearity between Db and ρDb2H can justify the fact that both variables ρDb and ρDb2H have same significant effects on BGB variation. However, since the stem height-diameter relationship for a same species or a group of species can differ across savanna environments depending on specific environmental conditions (e.g., fire frequency, presence or not of large herbivores, tree-grass competition), the use of ρDb2H rather than ρDb as predictor of trees biomass seems to be more appropriate. On the other hand, our results showed a major gap in the AGB estimates between the prediction made from the allometric equation we developed and the prediction from the reference model (Table 5). This gap could be explained by the differences between the specific wood densities used in each study. For the common species of both studies, namely Bridelia ferruginea and Crossopteryx febrifuga, the specific wood densities were larger in our study: 0.64 versus 0.61 for B. ferruginea and 0.724 versus 0.579 for C. febrifuga. Concerning the other species, only Cussonia arborea had a smaller wood density than the species studied in Ifo et al. (2018) (Suppl. file S5: Table 3). The difference in wood specific densities may induce relative overestimation or underestimation of AGB at the individual-level or species-level, which would affect the global AGB estimates at the stand-level. Another reason that could explain the gap in AGB estimation between our equation and the Ifo et al. equation is the difference of the Db2H/AGB ratio between samples. Our investigations showed that for the same tree species and the same Db2H value, the AGB measured for the Ifo et al. (2018) samples were relatively larger (Fig. 6) although the wood specific densities we used in our study were higher. In the Lamto savannas, the Db2H/AGB ratio of trees can be substantially affected for some species, notably for C. febrifuga (much less for B. ferruginea and P. thonningii), due to the interaction between fire and termites that causes progressive hollowing of the tree trunk (N’Dri et al. 2011, 2014). This phenomenon is generally observed in large trees (Db > 10 cm), that represented 60% of our trees sample. However, biomass losses due to the hollowing of tree trunks were not directly quantified in this study. In order to achieve realistic and reliable estimates, Kindermann et al. (2022) emphasized the need to account for biomass losses due to disturbance when estimating of the AGB of woody plants in disturbance-prone ecosystems. Indeed, it is difficult to sample undamaged and/or regularly shaped adult trees in disturbance-prone ecosystems such as savannas, since the tree growth cycles and aboveground architecture are continuously affected by disturbance (Archibald and Bond 2003; Moncrieff et al. 2011; Hempson et al. 2020).
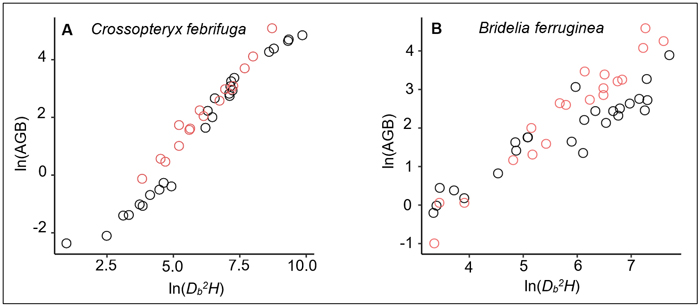
Fig. 6. Relationships between the aboveground biomass (AGB) and aboveground volume (Db2H) for: A) 41 Crossopteryx febrifuga trees and B) 44 Bridelia ferruginea trees. The black dots correspond to data measured in Lamto savannas, while the red dots represent the measured data in Ifo et al. (2018) study. The Ifo et al. data used here were extracted from the figure 4a of their study showing a plot of the aboveground biomass versus wood density times tree height times square diameter at the base for 88 trees from five species measured in the savannas of the Plateau Batéké in Congo. We extracted only data related to Crossopteryx febrifuga and Bridelia ferruginea (16 trees and 19 trees respectively); and Db2H were inferred from ρDb2H values.
Because we used an expanded range of sizes for trees and shrubs, the allometric equations developed here can be easily adapted to other data. The range of root/shoot biomass ratio (RSR) in our sample (0.36–4.6) is roughly similar to the range reported for shrublands (including savannas) by Mokany et al. (2006) (i.e., 0.335–4.250). This similarity may be explained by the inclusion of a fairly wide range of sample sizes, from very small individuals (basal diameter < 5 cm) to large individuals (basal diameter reaching more than 50 cm). According to our results, RSR is not constant in trees and decreases with aerial size (i.e., with age), while RSR does not vary in shrubs over time. This highlights two major points: (i) the size of the aerial part of shrubs depends directly on the size of root reserves, hence on the total size of the root system. Previous studies such as Schutz et al. (2009) and Zhu et al. (2012) have shown that shrubs life-history, notably the resprouting ability, is correlated to root reserves, after analyzing carbohydrate concentrations and pool size in the root system of numerous individuals. The dependence of the aerial part of shrubs on the root system is explained here by a non-significant variation of RSR over time. (ii) in trees, the aboveground compartment can survive fire without the need for large root reserves (Vesk 2006), thanks to its size and bark thickness (Bond and Midgley 2001; Charles-Dominique et al. 2016; Osborne et al. 2018). Contrary to shrubs, belowground biomass has ceased to be critical for survival to fire.
5 Conclusion
This study provides the first database on biomass allometry of trees and shrubs for the Guinean savannas, filling a critical knowledge gap. It also provides new multi-specific allometric models for estimating total aboveground biomass (AGB) and total belowground biomass (BGB) of trees and shrubs in Guinean savannas. Given the relevance of the results and the quality of the sample and sampling methods, the allometric equations developed are recommended for biomass estimation in this ecoregion and can be tested in other Guinean savannas outside of the Lamto Reserve. In particular, the results of this study will help to improve the Forest Reference Level (FRL) in the framework of the REDD+ mechanism (Reduction of Greenhouse Gas Emissions from Deforestation and Forest Degradation) application in Côte d’Ivoire.
Our work can be improved if additional efforts for data collection are completed in other Guinean savannas. This may be useful for refining the equations fitted here and should take into account: (i) the difference in traits between trees and shrubs, (ii) biomass allocation patterns in species in relation to the developmental stage of individuals, (iii) biomass losses due to disturbance: for example, the dynamics of hollowing of trees due to fire-termites interaction that affect the volume-biomass ratio.
Funding
This research was supported by the ARTS Program of the French Research Institute for Development (IRD). MM received support from a NRF-SASSCAL grant (number 118588) and from the Grant Agency of the Czech Republic (22-10897S) and long-term research development project of the Czech Academy of Sciences [No. RVO 67985939].
Acknowledgements
We are very grateful to the entire team that assisted us during the ARTS program. We are also grateful to the Institute of Ecology and Environmental Sciences of Paris for its support to obtain the ARTS funding. We thank the Ivorian office of parks and reserves and the scientific director of Lamto reserve for their collaboration, and also all the people who helped us to collect data in the field. The remarks, comments and suggestions of reviewers have made a valuable contribution to the improvement of the paper; we would like to thank all of them.
Declaration of openness of data and code
All the data are submitted with the present manuscript. Upon acceptance, we authorize the publisher to archive the data in an online library for any interested reader to access.
Authors contribution
Y.A.G.K, J.G, A.B.N and A.B. designed the study. Y.A.G.K, M.M, M.K, T.C.-D. and J.G. conducted the field experimentations in Lamto savannas and Y.A.G.K and M.K collected the data. Y.A.G.K., T.C.-D, J.G., M.M. and A.B.N wrote the manuscript. Y.A.G.K and J.G. produced all the figures. All authors analyzed and interpreted the data, contributed to the refinement of the manuscript in its successive versions and approved the final version.
References
Aabeyir R, Adu-Bredu S, Agyare WA, Weir MJC (2020) Allometric models for estimating aboveground biomass in the tropical woodlands of Ghana, West Africa. For Ecosyst 7, article id 41. https://doi.org/10.1186/s40663-020-00250-3.
Abbadie L (1984) Nouvelles données sur l’évolution saisonnière des phytomasses et sur la production primaire de la strate herbacée des savanes de Lamto (Côte d’Ivoire). [New data on the seasonal evolution of phytomasses and on the primary production of the herbaceous stratum of the Lamto savannas (Côte d’Ivoire)]. Annals of the University of Abidjan E 17: 83–109.
Addo-Danso SD, Prescott CE, Smith AR (2016) Methods for estimating root biomass and production in forest and woodland ecosystem carbon studies: a review. Forest Ecol Manag 359: 332–351. https://doi.org/10.1016/j.foreco.2015.08.015.
Adjanohoun E (1964) Végétation des savanes et des rochers découverts en Côte d’Ivoire centrale. [Vegetation of savannas and rocks discovered in central Côte d’Ivoire]. ORSTOM Memoirs 7th edition. ORSTOM, Paris.
Amadou MLM, Ahmadou H, Ibrahim A, Alexandre T, Jacob MT, Adamou I (2020) Use basal diameter to establish mixed species allometric equations predicting woody stand biomass in the Sudano-guinea savannahs of Ngaoundere, Cameroon. JAERI 21:1–12. https://doi.org/10.9734/jaeri/2020/v21i430137.
Amara E, Heiskanen J, Aynekulu E, Pellikka PKE (2019) Relationship between carbon stocks and tree species diversity in a humid Guinean savanna landscape in northern Sierra Leone. South For 81: 235–245. https://doi.org/10.2989/20702620.2018.1555947.
Archibald S, Bond WJ (2003) Growing tall vs growing wide: tree architecture and allometry of Acacia karroo in forest, savanna, and arid environments. Oikos 102: 3–14. https://doi.org/10.1034/j.1600-0706.2003.12181.x.
Atsri HK, Kokou K, Abotsi KE, Kokutse AD, Cuni-Sanchez A (2020) Aboveground biomass and vegetation attributes in the forest-savannah mosaic of Togo, West Africa. Afr J Ecol 58: 733–745. https://doi.org/10.1111/aje.12758.
Baskerville GL (1972) Use of logarithmic regression in the estimation of plant biomass Canadian. Can J Forest Res 2: 49–53. https://doi.org/10.1139/x72-009.
Bayen P, Noulèkoun F, Bognounou F, Lykke AM, Djomo A, Lamers JPA, Thiombiano A (2020) Models for estimating aboveground biomass of four dryland woody species in Burkina Faso, West Africa. J Arid Environ 180, article id 104205. https://doi.org/10.1016/j.jaridenv.2020.104205.
Beirne C, Miao Z, Nuñez CL, Medjibe VP, Saatchi S, White LJT, Poulsen JR (2019) Landscape‐level validation of allometric relationships for carbon stock estimation reveals bias driven by soil type. Ecol Appl 29, article id e01987. https://doi.org/10.1002/eap.1987.
Belsley DA, Kuh E, Welsch RE (1980) Regression diagnostics: identifying influential data and sources of collinearity. Wiley, New York. https://doi.org/10.1002/0471725153.
Bond WJ (2008) What limits trees in C4 grasslands and savannas? Annu Rev Ecol Evol S 39: 641–659. https://doi.org/10.1146/annurev.ecolsys.39.110707.173411.
Bond WJ, Midgley JJ (2001) Ecology of sprouting in woody plants: the persistence niche. Trends Ecol Evol 16: 45–51. https://doi.org/10.1016/S0169-5347(00)02033-4.
Bond WJ, Silander Jr JA, Ranaivonasy J, Ratsirarson J (2008) The antiquity of Madagascar’s grasslands and the rise of C4 grassy biomes. J Biogeogr 35: 1743–1758. https://doi.org/10.1111/j.1365-2699.2008.01923.x.
Brown S (1997) Estimating biomass and biomass change of tropical forests: A primer. UN FAO forestry paper 134. Food and Agriculture Organization, Rome.
Carsan S, Orwa C, Harwood C, Kindt R, Stroebel A, Neufeldt H, Jamnadass R (2012) African wood density database. World agroforestry centre, Nairobi. http://apps.worldagroforestry.org/treesandmarkets/wood/. Accessed 12 December 2021.
Chabi A, Lautenbach S, Orekan VOA, Kyei-Baffour N (2016) Allometric models and aboveground biomass stocks of a West African Sudan Savannah watershed in Benin. Carbon Balance Manage 11, article id 16. https://doi.org/10.1186/s13021-016-0058-5.
Charles-Dominique T, Staver AC, Midgley GF, Bond WJ (2015) Functional differentiation of biomes in an African savanna/forest mosaic. S Afr J Bot 101: 82–90. https://doi.org/10.1016/j.sajb.2015.05.005.
Charles-Dominique T, Davies TJ, Hempson GP, Bezeng BS, Daru BH, Kabongo RM, Maurin O, Muasya AM, van der Bank M, Bond WJ (2016) Spiny plants, mammal browsers, and the origin of African savannas. PNAS 113: E5572–E5579. https://doi.org/10.1073/pnas.1607493113.
Chave J, Réjou-Méchain M, Búrquez A, Chidumayo E, Colgan MS, Delitti WBC, Duque A, Eid T, Fearnside PM, Goodman RC, Henry M, Martínez-Yrízar A, Mugasha WA, Muller-Landau HC, Mencuccini M, Nelson BW, Ngomanda A, Nogueira EM, Ortiz-Malavassi E, Pélissier R, Ploton P, Ryan CM, Saldarriaga JG, Vieilledent G (2014) Improved allometric models to estimate the aboveground biomass of tropical trees. Glob Change Biol 20: 3177–3190. https://doi.org/10.1111/gcb.12629.
Ciais P, Bombelli A, Williams M, Piao SL, Chave J, Ryan CM, Henry M, Brender P, Valentini R (2011) The carbon balance of Africa: synthesis of recent research studies, Philos T Roy Soc A 369: 2038–2057. https://doi.org/10.1098/rsta.2010.0328.
Clarke MF, Kelly LT, Avitabile SC, Benshemesh J, Callister KE, Driscoll DA, Ewin P, Giljohann K, Haslem A, Kenny SA, Leonard S, Ritchie EG, Nimmo DG, Schedvin N, Schneider K, Watson SJ, Westbrooke M, White M, Wouters MA, Bennett AF (2021) Fire and its interactions with other drivers shape a distinctive, Semi-Arid ‘Mallee’ ecosystem. Front Ecol Evol 9, article id 647557. https://doi.org/10.3389/fevo.2021.647557.
Colgan, MS, Asner, GP, Swemmer T (2013) Harvesting tree biomass at the stand level to assess the accuracy of field and airborne biomass estimation in savannas. Ecol Appl 23: 1170–1184. https://doi.org/10.1890/12-0922.1.
Crawley MJ (2013) The R Book second edition. John Wiley & Sons Ltd, London.
Crow TR, Schlaegel BE (1988) A guide to using regression equations for estimating tree biomass. North J Appl For 5: 15–22. https://doi.org/10.1093/njaf/5.1.15.
Dantas V de L, Pausas JG (2013) The lanky and the corky: fire-escape strategies in savanna woody species. J Ecol 101: 1265–1272. https://doi.org/10.1111/1365-2745.12118.
Delmas RA, Loudjani P, Podaire A, Menaut J-C (1991) Biomass burning in Africa: an assessment of annually burned biomass. In: Levine JS (ed) Global biomass burning: atmospheric, climatic, and biospheric implications. MIT Press, Cambridge, Massachusetts, pp 126–132.
Dimobe K, Mensah S, Goetze D, Ouédraogo A, Kuyah S, Porembski S, Thiombiano A (2018) Aboveground biomass partitioning and additive models for Combretum glutinosum and Terminalia laxiflora in West Africa. Biomass Bioenerg 115: 151–159. https://doi.org/10.1016/j.biombioe.2018.04.022.
Dinerstein E, Olson D, Joshi A, Vynne C, Burgess ND, Wikramanayake E, Hahn N, Palminteri S, Hedao P, Noss R, Hansen M, Locke H, Ellis EC, Jones B, Barber CV, Hayes R, Kormos C, Martin V, Crist E, Sechrest W, Price L, Baillie JEM, Weeden D, Suckling K, Davis C, Sizer N, Moore R, Thau D, Birch T, Potapov P, Turubanova S, Tyukavina A, de Souza N, Pintea L, Brito JC, Llewellyn OA, Miller AG, Patzelt A, Ghazanfar SA, Timberlake J, Klöser H, Shennan-Farpón Y, Kindt R, Lillesø J-PB, van Breugel P, Graudal L, Voge M, Al-Shammari KF, Saleem M (2017) An ecoregion-based approach to protecting half the terrestrial realm. Bioscience 67: 534–545. https://doi.org/10.1093/biosci/bix014.
Djagbletey ED, Logah V, Ewusi-Mensah N, Tuffour HO (2018) Carbon stocks in the Guinea savanna of Ghana: estimates from three protected areas. Biotropica 50: 225–233. https://doi.org/10.1111/btp.12529.
Djomo AN, Ibrahima A, Saborowski J, Gravenhorst G (2010) Allometric equations for biomass estimations in Cameroon and pan moist tropical equations including biomass data from Africa. For Ecol Manag 260: 1873–1885. https://doi.org/10.1016/j.foreco.2010.08.034.
Eggleston HS, Buendia L, Miwa K, Ngara T, Tanabe K (2006) IPCC guidelines for national greenhouse gas inventories 4th volume: agriculture, forestry and other land use, chap 3: Consistent representation of lands national greenhouse gas inventories program. Institute for Global Environmental Strategies, Japan.
Fayolle A, Doucet J-L, Gillet J-F, Bourland N, Lejeune P (2013) Tree allometry in Central Africa: testing the validity of pantropical multi-species allometric equations for estimating biomass and carbon stocks. For Ecol Manag 305: 29–37. https://doi.org/10.1016/j.foreco.2013.05.036.
February EC, Coetsee C, Cook GD, Ratnam J, Wigley B (2019) Physiological traits of savanna woody species – adaptations to resource availability. In: Scogings PF, Sankaran M (eds) Savanna woody plants and large herbivores. John Wiley & Sons Ltd, pp 309–329. https://doi.org/10.1002/9781119081111.ch11.
Fidelis A, di S Lyra MF, Pivello VR (2013) Above- and belowground biomass and carbon dynamics in Brazilian Cerrado wet grasslands. J Veg Sci 24: 356–364. https://doi.org/10.1111/j.1654-1103.2012.01465.x.
Frost PGH, Medina E, Menaut JC, Solbrig OT, Swift M, Walker BH (1986) Responses of savannas to stress and disturbance. Biology International Special Issue 10. International Union of Biological Sciences, Paris.
Gaillard C, Langan L, Pfeiffer M, Kumar D, Martens C, Higgins SI, Scheiter S (2018) African shrub distribution emerges via a trade‐off between height and sapwood conductivity. J Biogeogr 45: 2815–2826. https://doi.org/10.1111/jbi.13447.
Ganamé M, Bayen P, Ouédraogo I, Balima LH, Thiombiano A (2021) Allometric models for improving aboveground biomass estimates in West African savanna ecosystems. Trees, Forests and People 4, article id 100077. https://doi.org/10.1016/j.tfp.2021.100077.
Gatsuk LE, Smirnova OV, Vorontzova LI, Zaugolnova LB, Zhukova LA (1980) Age states of plants of various growth forms: a review. J Ecol 68: 675−696. https://doi.org/10.2307/2259429.
Gignoux J, Clobert J, Menaut J-C (1997) Alternative fire resistance strategies in savanna trees. Oecologia 110: 576–583. https://doi.org/10.1007/s004420050198.
Gignoux J, Barot S, Menaut J-C, Vuattoux R (2006) Structure, long-term dynamics, and demography of the tree community. In: Abbadie L, Gignoux J, Le Roux X, Lepage M (eds) Lamto: structure, functioning, and dynamics of a savanna ecosystem. Ecological Studies 179. Springer, New York, pp 335–364. https://doi.org/10.1007/978-0-387-33857-6_18.
Götmark F, Götmark E, Jensen AM (2016) Why Be a Shrub? A basic model and hypotheses for the adaptive values of a common growth form. Front Plant Sci 7, article id 1095. https://doi.org/10.3389/fpls.2016.01095.
Goussanou CA, Guendehou S, Assogbadjo AE, Kaire M, Sinsin B, Cuni-Sanchez A (2016) Specific and generic stem biomass and volume models of tree species in a West African tropical semi-deciduous forest. Silva Fenn 50, article id 1474. https://doi.org/10.14214/sf.1474.
Grace J, Jose JS, Meir P, Miranda HS, Montes RA (2006) Productivity and carbon fluxes of tropical savannas. J Biogeogr 33: 387–400. https://doi.org/10.1111/j.1365-2699.2005.01448.x.
Hempson GP, Archibald S, Staver C (2020). In: Scogings PF, Sankaran M (eds) Savanna woody plants and large herbivores. John Wiley & Sons Ltd, pp 439–468. https://doi.org/10.1002/9781119081111.ch13.
Henry M, Bombelli A, Trotta C, Alessandrini A, Birigazzi L, Sola G, Vieilledent G, Santenoise P, Longuetaud F, Valentini R, Picard N, Saint-André L (2013) GlobAllomeTree: international platform for tree allometric equations to support volume, biomass and carbon assessment. iForest 6: 326−330. https://doi.org/10.3832/ifor0901-006.
Higgins SI, Bond WJ, February EC, Bronn A, Euston-Brown DI, Enslin B, Govender N, Rademan L, O’Regan S, Potgieter AL (2007) Effects of four decades of fire manipulation on woody vegetation structure in savanna. Ecology 88: 1119–1125. https://doi.org/10.1890/06-1664.
Hoffmann WA, Solbrig OT (2003) The role of topkill in the differential response of savanna woody species to fire. For Ecol Manage 180: 273–286. https://doi.org/10.1016/S0378-1127(02)00566-2.
Ifo AS, Gomat HY, Wenina YEM, Lokegna DL, Nzonzi ORM, Ngala GCA, Henry M, Boundzanga GC, Jourdain C, Picard N, Loumeto JJ (2018) Carbon stocks and tree allometries in the savannahs of the Plateau Batéké, central Africa. For Ecol Manage 427: 86–95. https://doi.org/10.1016/j.foreco.2018.05.065.
Jackson RB, Canadell J, Ehleringer JR, Mooney HA, Sala OE, Schulze ED (1996) A global analysis of root distributions for terrestrial biomes. Oecologia 108: 389–411. https://doi.org/10.1007/BF00333714.
Kindermann L, Dobler M, Niedeggen D, Linstädter A (2022) A new protocol for estimation of woody aboveground biomass in disturbance-prone ecosystems. Ecol Indic 135, article id 108466. https://doi.org/10.1016/j.ecolind.2021.108466.
Koala J, Sawadogo L, Savadogo P, Aynekulu E, Heiskanen J, Saïd M (2017) Allometric equations for belowground biomass of four key woody species in West African savanna-woodlands. Silva Fenn 51, article id 1631. https://doi.org/10.14214/sf.1631.
Koffi K, N’Dri A, Lata J, Konaté S, Srikanthasamy T, Konan M, Barot S (2019) Effect of fire regime on the grass community of the humid savanna of Lamto, Ivory Coast. J Trop Ecol 35: 1−7. https://doi.org/10.1017/S0266467418000391.
Le Stradic S, Roumet C, Durigan G, Cancian L, Fidelis A (2021) Variation in biomass allocation and root functional parameters in response to fire history in Brazilian savannas. J Ecol 109: 4143– 4157. https://doi.org/10.1111/1365-2745.13786.
Loiola PP, Scherer-Lorenzen M, Batalha MA (2015) The role of environmental filters and functional traits in predicting the root biomass and productivity in savannas and tropical seasonal forests. For Ecol Manage 342: 49–55. https://doi.org/10.1016/j.foreco.2015.01.014.
Lufafa A, Diédhiou I, Ndiaye NAS, Séné M, Kizito F, Dick RP, Noller JS (2009) Allometric relationships and peak-season community biomass stocks of native shrubs in Senegal’s Peanut Basin. J Arid Environ 73: 260–266. https://doi.org/10.1016/j.jaridenv.2008.09.020.
Ma S, He F, Tian D, Zou D, Yan Z, Yang Y, Zhou T, Huang K, Shen H, Fang J (2018) Variations and determinants of carbon content in plants: a global synthesis. Biogeosciences 15: 693–702. https://doi.org/10.5194/bg-15-693-2018.
Martin AR, Thomas SC (2011) A reassessment of carbon content in tropical trees. PLoS ONE 6, article id e23533. https://doi.org/10.1371/journal.pone.0023533.
Maulana SI, Wibisono Y, Utomo S (2016) Development of local allometric equation to estimate total aboveground biomass in Papua tropical forest. IJFR 3: 107–118. https://doi.org/10.20886/ijfr.2016.3.2.107-118.
Maurin O, Davies TJ, Burrows JE, Daru BH, Yessoufou K, Muasya AM, van der Bank M, Bond WJ (2014) Savanna fire and the origins of the “underground forests” of Africa. New Phytol 204: 201–214. https://doi.org/10.1111/nph.12936.
Mbow C, Verstraete MM, Sambou B, Diaw AT, Neufeldt H (2014) Allometric models for aboveground biomass in dry savanna trees of the Sudan and Sudan-Guinean ecosystems of Southern Senegal. J Forest Res 19: 340–347. https://doi.org/10.1007/s10310-013-0414-1.
Menaut J-C (1971) Etude de quelques peuplements ligneux d’une savane guinéenne de Côte d’Ivoire. [Study of some woody communities in a Guinean savanna of Côte d’Ivoire]. 3rd cycle doctoral thesis in Plant Biology, Faculty of Sciences of Paris, France.
Menaut J-C, Abbadie L (2006) Vegetation. In: Abbadie L, Gignoux J, Le Roux X, Lepage M (eds) Lamto: structure, functioning, and dynamics of a savanna ecosystem. Ecological Studies 179. Springer, New York, pp 62– 74. https://doi.org/10.1007/0-387-33857-8.
Menaut J-C, César J (1979) Structure and primary productivity of Lamto savannass, Ivory Coast Ecology 60: 1197–1210. https://doi.org/10.2307/1936967.
Midi H, Bagheri A (2010) Robust multicollinearity diagnostic measure in collinear data set. In: Mastorakis NE, Mladenov V (eds) ASM’10. Proceedings of the 4th International Conference on Applied Mathematics, Simulation, Modelling, Corfu Island Greece, 22–25 July 2010. WSEAS, Stevens Point, pp 138–142.
Mlambo D, Mapaure I (2006) Post-fire resprouting of Colophospermum mopane saplings in a southern African savanna. J Trop Ecol 22: 231–234. https://doi.org/10.1017/S026646740500297X.
Mokany K, Raison RJ, Prokushkin AS (2006) Critical analysis of root: shoot ratios in terrestrial biomes. Global Change Biol 12: 84–96. https://doi.org/10.1111/j.1365-2486.2005.001043.x.
Moncrieff GR, Chamaillé-Jammes S, Higgins SI, O’Hara RB, Bond WJ (2011) Tree allometries reflect a lifetime of herbivory in an African savanna. Ecology 92: 2310–2315. https://doi.org/10.1890/11-0230.1.
Moncrieff GR, Lehmann CER, Schnitzler J, Gambiza J, Hiernaux P, Ryan CM, Shackleton CM, Williams RJ, Higgins SI (2014) Contrasting architecture of key African and Australian savanna tree taxa drives intercontinental structural divergence. Global Ecol Biogeogr 23: 1235–1244. https://doi.org/10.1111/geb.12205.
Monnier Y (1968) Les effets des feux de brousse sur une savane préforestière de Côte d’Ivoire. [Effects of bushfires on a pre-forest savanna of Côte d’Ivoire]. Eburnian Studies 9th edition. Scientific Research Department of the National Education, Abidjan.
Murphy BP, Andersen AN, Parr CL (2016) The underestimated biodiversity of tropical grassy biomes. Phil Trans R Soc B 371, article id 20150319. https://doi.org/10.1098/rstb.2015.0319.
N’Dri AB, Gignoux J, Konaté S, Dembélé A, Aïdara D (2011) Origin of trunk damage in West African savanna trees: the interaction of fire and termites. J Trop Ecol 27: 269−278. https://doiorg/101017/S026646741000074X.
N’Dri AB, Gignoux J, Barot S, Konaté S, Dembélé A, Werner PA (2014) The dynamics of hollowing in annually burnt savanna trees and its effect on adult tree mortality. Plant Ecol 215: 27–37. https://doi.org/10.1007/s11258-013-0276-9.
N’Dri AB, Gignoux J, Konaté S (2018a) Food preferences and foraging strategies of wood-feeding termites in a West African savanna. Curr Sci 114: 186−192. https://doi.org/10.18520/cs/v114/i01/186-192.
N’Dri AB, Soro TD, Gignoux J, Dosso K, Koné M, N’Dri JK, Koné NA, Barot S (2018b) Season affects fire behavior in annually burned humid savanna of West Africa. Fire Ecol 14, article id 5. https://doi.org/10.1186/s42408-018-0005-9.
N’Dri AB, Kpangba KP, Werner PA, Koffi KF, Bakayoko A (2022) The response of sub-adult savanna trees to six successive annual fires: An experimental field study on the role of fire season. J Appl Ecol 59: 1347–1361. https://doi.org/10.1111/1365-2664.14149.
Olson DM, Dinerstein E, Wikramanayake ED, Burgess ND, Powell GVN, E C, Underwood J, D’amico A, Itoua I, Strand HE, Morrison JC, Loucks CJ, Allnutt TF, Ricketts TH, Kura Y, Lamoreux JF, Wettengel WW, Hedao P, Kassem K R (2001) Terrestrial ecoregions of the world: a new map of life on earth: a new global map of terrestrial ecoregions provides an innovative tool for conserving biodiversity. Bioscience 51: 933–938. https://doi.org/10.1641/0006-3568(2001)051[0933:TEOTWA]2.0.CO;2.
Osborne CP, Charles-Dominique T, Stevens N, Bond W J, Midgley G, Lehmann CER (2018) Human impacts in African savannas are mediated by plant functional traits. New Phytol 220: 10–24. https://doi.org/10.1111/nph.15236.
Ottaviani G, Molina-Venegas R, Charles-Dominique T, Campetella SG, Canullo R, Klimešová J (2020) The neglected belowground dimension of plant dominance. Trends Ecol Evol 35: 763–766. https://doi.org/10.1016/j.tree.2020.06.006.
Ouédraogo K, Dimobe K, Thiombiano A (2020) Allometric models for estimating aboveground biomass and carbon stock for Diospyros mespiliformis in West Africa. Silva Fenn 54, article id 10215. https://doi.org/10.14214/sf.10215.
Parr CL, Lehmann CER, Bond WJ, Hoffmann WA, Andersen AN (2014) Tropical grassy biomes: misunderstood, neglected, and under threat. Trends Ecol Evol 29: 205–213. https://doi.org/10.1016/j.tree.2014.02.004.
Paul KI, Larmour J, Specht A, Zerihun A, Ritson P, Roxburgh SH, Sochacki S, Lewis T, Barton CVM, England JR, Battaglia M, O’Grady A, Pinkard E, Applegate G, Jonson J, Brooksbank K, Sudmeyer R, Wildy D, Montagu KD, Bradford M, Butler D, Hobbs T (2019) Testing the generality of belowground biomass allometry across plant functional types. For Ecol Manage 432: 102–114. https://doi.org/10.1016/j.foreco.2018.08.043.
Pausas JG, Lamont BB, Paula S, Appezzato-da-Glória B, Fidelis A (2018) Unearthing belowground bud banks in fire-prone ecosystems. New Phytol 217: 1435–1448. https://doi.org/10.1111/nph.14982.
Picard N, Saint-André L, Henry M (2012) Manual for building tree volume and biomass allometric equations: from field measurement to prediction. FAO, Rome and CIRAD, Montpellier.
Qi Y, Wei W, Chen C, Chen L (2019) Plant root-shoot biomass allocation over diverse biomes: a global synthesis. Glob Ecol Conserv 18, article id e00606. https://doi.org/10.1016/j.gecco.2019.e00606.
R Core Team (2020) R: a language and environment for statistical computing, version 402 R. Foundation for Statistical Computing, Vienna.
Ribeiro SC, Fehrmann L, Soares CPB, Jacovine LAG, Kleinn C, de O Gaspar R (2011) Above- and belowground biomass in a Brazilian Cerrado. For Ecol Manage 262(3): 491–499. https://doi.org/10.1016/j.foreco.2011.04.017.
Sankaran M, Hanan NP, Scholes RJ, Ratnam J, Augustine DJ, Cade BS, Gignoux J, Higgins SI, Le Roux X, Ludwig F, Ardo J, Banyikwa F, Bronn A, Bucini G, Caylor KK, Coughenour MB, Diouf A, Ekaya W, Feral CJ, February EC, Frost PG, Hiernaux P, Hrabar H, Metzger KL, Prins HH, Ringrose S, Sea W, Tews J, Worden J, Zambatis N (2005) Determinants of woody cover in African savannas. Nature 438: 846−849. https://doi.org/10.1038/nature04070.
Sawadogo L, Savadogo P, Tiveau D, Dayamba SD, Zida D, Nouvellet Y, Oden PC, Guinko S (2010) Allometric prediction of aboveground biomass of eleven woody tree species in the Sudanian savanna-woodland of West Africa. J Forestry Res 21: 475–481. https://doi.org/10.1007/s11676-010-0101-4.
Schutz AEN, Bond WJ, Cramer MD (2009) Juggling carbon: allocation patterns of a dominant tree in a fire-prone savanna. Oecologia 160: 235–246. https://doi.org/10.1007/s00442-009-1293-1.
Scogings PF, Sankaran, M (2019) Woody plants and large herbivores in savannas: ancient past – uncertain future. In: Scogings PF, Sankaran M (eds) Savanna woody plants and large herbivores. John Wiley & Sons Ltd, pp 683–712. https://doi.org/10.1002/9781119081111.ch21.
Sheffer M, Vergnon R, Cornelissen JHC, Hantson S, Holmgren M, vanNes EH, Xu C (2014) Why trees and shrubs but rarely trubs? Trends Ecol Evol 29: 433–434. https://doi.org/10.1016/j.tree.2014.06.001.
Sprugel D (1983) Correcting for bias in log-transformed allometric equations. Ecology 64: 209–210. https://doi.org/10.2307/1937343.
Staver AC, Bond WJ, Stock WD, van Rensburg SJ, Waldram MS (2009) Browsing and fire interact to suppress tree density in an African savanna. Ecol Appl 19: 1909–1919. https://doi.org/10.1890/08-1907.1.
Staver AC, Archibald S, Levin S (2011) Tree cover in sub-Saharan Africa: rainfall and fire constrain forest and savanna as alternative stable states. Ecology 92: 1063–1072. https://doi.org/10.1890/10-1684.1.
Stevens N (2021) What shapes the range edge of a dominant African savanna tree, Colophospermum mopane? A demographic approach. Ecol Evol 11: 3726−3736. https://doi.org/10.1002/ece3.7377.
Swemmer A, Ward D (2019) Patterns and determinants of woody plant growth in savannas. In: Scogings PF, Sankaran M (eds) Savanna woody plants and large herbivores. John Wiley & Sons Ltd, pp 331–438. https://doi.org/10.1002/9781119081111.ch12.
Tiemoko DT, Yoroba F, Diawara A, Kouadio K, Kouassi BK, Yapo ALM (2020) Understanding the local carbon fluxes variations and their relationship to climate conditions in a sub-humid savannah ecosystem during 2008–2015: case of Lamto in Cote d’Ivoire. Atmos Clim Sci 10: 186–205. https://doi.org/10.4236/acs.2020.102010.
Tomlinson KW, Sterck FJ, Bongers F, da Silva DA, Barbosa ERM, Ward D, Bakker FT, van Kaauwen M, Prins HHT, de Bie S, van Langevelde F (2012) Biomass partitioning and root morphology of savanna trees across a water gradient. J Ecol 100: 1113–1121. https://doi.org/10.1111/j.1365-2745.2012.01975.x.
van Breugel M, Ransijn J, Craven D, Bongers F, Hall JS (2011) Estimating carbon stock in secondary forests: decisions and uncertainties associated with allometric biomass models. For Ecol Manage 262: 1648–1657. https://doi.org/10.1016/j.foreco.2011.07.018.
Vesk PA (2006) Plant size and resprouting ability: trading tolerance and avoidance of damage? J Ecol 94: 1027–1034. https://doi.org/10.1111/j.1365-2745.2006.01154.x.
Wigley BJ, Staver AC, Zytkowiak R, Jagodzinski AM, Wigley-Coetsee C (2019) Root trait variation in African savannas. Plant Soil 441: 555–565. https://doi.org/10.1007/s11104-019-04145-3.
World Bank (2009) Awakening Africa’s Sleeping Giant: Prospects for Commercial Agriculture in the Guinea savannah zone and beyond. World Bank, Washington DC. http://hdl.handle.net/10986/2640.
Yang J, Cooper DJ, Li Z, Song W, Zhang Y, Zhao B, Han S, Wang X (2020) Differences in tree and shrub growth responses to climate change in a boreal forest in China. Dendrochronologia 63, article id 125744. https://doi.org/10.1016/j.dendro.2020.125744.
Yuen JQ, Ziegler AD, Webb EL, Ryan CM (2013) Uncertainty in belowground carbon biomass for major land covers in Southeast Asia. For Ecol Manage 310: 915–926. https://doi.org/10.1016/j.foreco.2013.09.042.
Zanne AE, Lopez-Gonzalez G, Coomes DA, Ilic J, Jansen S, Lewis SL, Miller RB, Swenson NG, Wiemann MC, Chave J (2009) Dataset used in the paper ‘Towards a worldwide wood economics spectrum’. Dryad [Dataset]. https://doi.org/10.5061/dryad.234.
Zhang Z (2016) Variable selection with stepwise and best subset approaches. Ann Transl Med 4, article id 136. https://doi.org/10.21037/atm.2016.03.35.
Zhou Y, Wigley BJ, Case MF, Coetsee C, Staver AC (2020) Rooting depth as a key woody functional trait in savannas. New Phytol 227:1350–1361. https://doi.org/10.1111/nph.16613.
Zhu W-Z, Xiang J-S, Wang S-G, Li M-H (2012) Resprouting ability and mobile carbohydrate reserves in an oak shrubland decline with increasing elevation on the eastern edge of the Qinghai–Tibet Plateau. For Ecol Manage 278: 118–126. https://doi.org/10.1016/j.foreco.2012.04.032.
Zizka A, Govender N, Higgins SI (2014) How to tell a shrub from a tree: a life-history perspective from a South African savanna. Austral Ecol 39: 767–778. https://doi.org/10.1111/aec.12142.
Total of 111 references.
