Staffan Berg  ,
Erik Valinger,
Torgny Lind,
Tommi Suominen,
Diana Tuomasjukka
,
Erik Valinger,
Torgny Lind,
Tommi Suominen,
Diana Tuomasjukka
Comparison of co-existing forestry and reindeer husbandry value chains in northern Sweden
Berg S., Valinger E., Lind T., Suominen T., Tuomasjukka D. (2015). Comparison of co-existing forestry and reindeer husbandry value chains in northern Sweden. Silva Fennica vol. 50 no. 1 article id 1384. https://doi.org/10.14214/sf.1384
Highlights
- Forestry adapted to reindeer husbandry results in: potential economic improvement of reindeer husbandry, potential reduced cuttings in forestry and reduced wood flow to industry, reduced gross value added for forest industry and increased carbon storage in standing forest.
Abstract
Forestry in Malå, northern Sweden, coexists with other land uses. Reindeer husbandry is in the area for centuries and requires large areas of grazing land. Competing land uses may threaten the Malå Sami village. The aim of the study was to evaluate increased consideration in forest management towards 1) reindeer husbandry, 2) nature and 3) a combination of the two. These scenarios were compared with forest management as it was in 2009. Results indicate that all three scenarios lead to a decrease in annual harvesting volumes of 0.2 to 0.4 million m3. Forest industry dominated the economic viability in the area. Forest management adapted to the needs of reindeer husbandry resulted in less potential for yearly harvest, employment and profits from forest industry. On the other hand, it led to an increase in growing stock and consequently the potential for carbon sequestration over time. Indeed the increased sequestration would compensate for all fossil emissions of carbon from the Forest Wood Chain (FWC). The nature scenario had minor effects on economic result and on the emissions of fossil carbon. The combined scenario gave a reduced economic performance for the FWC. A scenario based on forest management accommodating the needs of reindeer husbandry gave the best economic result for the reindeer chain, due to high survival rate of the reindeer. However the economic importance of reindeer husbandry in the region was small compared to the FWC. Results from scenario analysis could serve as a platform for mutual understanding between stakeholders.
Keywords
carbon sequestration;
agroforestry;
global warming potential;
gross value added;
employment;
ToSIA
-
Berg,
Swedish University of Agricultural Sciences (SLU), Department of Forest Ecology and Management, Skogsmarksgränd, SE-90 183 Umeå, Sweden
E-mail
staffan.berg@efi.int
- Valinger, Swedish University of Agricultural Sciences (SLU), Department of Forest Ecology and Management, Skogsmarksgränd, SE-90 183 Umeå, Sweden E-mail erik.valinger@slu.se
- Lind, Swedish University of Agricultural Sciences (SLU), Department of Forest Resource Management, Skogsmarksgränd, SE-90 183 Umeå, Sweden E-mail torgny.lind@slu.se
- Suominen, European Forest Institute, Sustainability and Climate Change Research Programme, Yliopistokatu 6, FI-80100 Joensuu, Finland E-mail tommi.suominen@efi.int
- Tuomasjukka, European Forest Institute, Sustainability and Climate Change Research Programme, Yliopistokatu 6, FI-80100 Joensuu, Finland E-mail diana.tuomasjukka@efi.int
Received 29 April 2015 Accepted 25 September 2015 Published 30 October 2015
Views 117343
Available at https://doi.org/10.14214/sf.1384 | Download PDF

1 Introduction
Forestry in the northern periphery area of Sweden is currently performed alongside other industries and activities such as development of hydro energy, mining, automotive development, tourism, outdoor leisure and entrepreneurialism (Widmark 2009; Sandström et al. 2011). Reindeer (Rangifer tarandus tarandus L.) husbandry has been present in the area for centuries and has special user rights (Swedish Forest Agency 2012) concerning the free-ranging of reindeer herds on land belonging to other landowners (SFS1993:36).
Only native Sami are entitled to practice reindeer husbandry in Sweden, meaning they may have their own herd and use an earmark for identifying their reindeer. Reindeer husbandry needs large areas of grazing land that meet certain site characteristics during the seasons of the reindeer husbandry year (e.g. lichen-rich forests for winter grazing). As the pressure on land use for other purposes continuously increases and changes the character of the forest, there is an issue of how much encroachment from other interests a Sami village, which is dependent on reindeer husbandry, is able to withstand.
Due to disturbances caused by e.g. clear cutting and road building, increased importance is placed on consultation between forest owners and Sami (Sandström and Widmark 2007; Mustajoki et al. 2011).
This is safeguarded for grazing on estates larger than 500 ha according to the Swedish Forestry Act (Swedish Forest Agency 2001). The National Association of Swedish Sami issued a policy document with recommendations for forest management practices to be carried out in order to aid reindeer husbandry (SSR 2009). These recommendations include alternative scarification and road building routes, avoidance of non-native species, e.g. lodgepole pine (Pinus contorta Douglas ex Loudon), more intense pre-commercial and commercial thinning, restricted use of fertilisation, further prerequisites for tree lichens and an increase in continuous cover forestry practices. An earlier study (Bostedt et al. 2003) indicates that considerations in forest management practicies in line with the ones recommended (SSR 2009) can increase profits from reindeer production with relatively low cost for forestry.
However, the use of the newly developed Tool for Sustainability Impact Assessment (ToSIA) (Lindner et al. 2012) provides a framework which can be used to evaluate additional aspects of the influence of changes in forest management practices, on both forestry and reindeer husbandry.
The tool was initially developed within the European Community FP6 project EFORWOOD (Skogforsk 2010) to provide a flexible tool for sustainability impact assessments (Päivinen et al. 2012) which covers economic, environmental and social impacts of alternative value chains (Lindner et al. 2012). Furthermore, ToSIA is also useful when discussing and assessing different outcomes of management alternatives or scenarios, with and without stakeholder involvement.
This study focused on Sami reindeer husbandry and forest management and its stakeholders, i.e. indigenous Sami village representatives and non-indigenous forest-industry related stakeholders. The participatory involvement of both stakeholder groups was positively met. It confirmed the results presented by Reed (2008) that stakeholder participation for environmental management empowers, promotes equity, generates trust, and improves learning, which are the underpinning pillars for successful involvement. A main success factor is the building of a relationship between researcher and indigenous parties (Silver and Campbell 2005; Jones et al. 2008). Eversole (2003) argues that greater attention must be given to the “development of relations”, to avoid pitfalls in stakeholder involvement; while Mustajoki et al. (2011) argue that “mutual understanding” needs to be a main criteria in stakeholder conflict situations.
The aim of this study was to evaluate the effects of changes in forest management on the utilization of the forests and on the grazing land for reindeer. Results from the evaluation serve as a platform of communication between the involved stakeholder groups.
2 Materials and methods
The Malå Sami village, Sweden’s southernmost forest Sami village, has its centre for reindeer husbandry in the municipality of Malå with approximately 3500 inhabitants. A Sami village is an administrative term of a Reindeer Husbandry Community, which is different from a municipality.
In 2006 the Malå Sami village consisted of 11 reindeer husbandry companies. The total area with grazing rights by the Sami village was about 750 000 ha, of which 530 000 ha was productive forest, whereof non-industrial forest owners owned about 51% according to National Forest Inventory (NFI) data (Fridman et al. 2014) (Fig. 1).
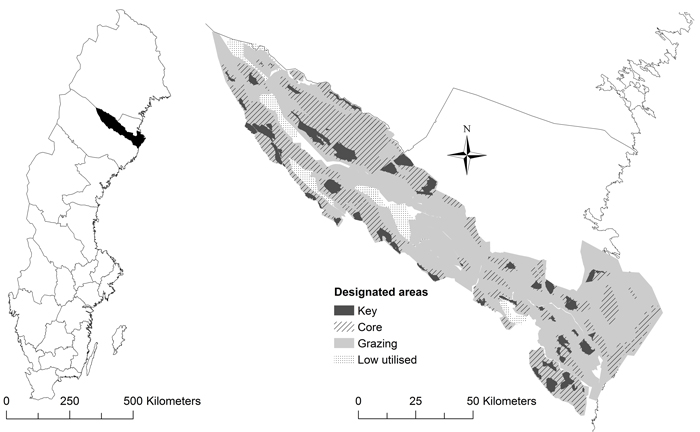
Fig. 1. The area used by Malå Sami village with designated areas of importance for reindeer husbandry. Location in Sweden (left) and designated areas (right).
2.1 ToSIA framework
The study examined impacts of changes in forest management practices on the forest-based sector and the Sami village’s livelihood in comparison to the situation in 2009 as a reference (the most recent available dataset when the study was conducted).
ToSIA was used in order to quantify and evaluate the impacts of changed management for the forest-based sector according to Lindner et al. (2012) and the method was also applied to reindeer husbandry. Value chains are described as a set of processes which are linked by products, and product shares. These chains can have many parallel branches, showing all possible material flows of products. Along these value chains material flows of products are calculated and followed up in tonnes of carbon (Suominen et al. 2012) as well as in the product specific units. For each process a set of economic, environmental and social indicator values is collected relative to the process unit (e.g. production costs in €/m3) and multiplied with the material flow passing through this process to give the absolute impact. The concept of ToSIA is explained by Lindner et al. (2012) and Päivinen et al. (2012).
2.2 ToSIA application for Forest Wood Chains (FWC) and Reindeer husbandry Chains (RC)
ToSIA is a completely data driven tool. Even though it has been originally developed for the forest-based sector, it is not limited to those value chains. Any value chain that can be described in a process-product topology with carbon as the main material flow can be calculated in ToSIA. Further ToSIA is open to accommodate new indicators if and when they become necessary. The format which new indicators’ need to follow is described in Pülzl et al. (2013). This possibility was used to define both the FWC and RC, with carbon in timber products and carbon in reindeer products being the material flow.
The FWC consisted of value-adding production processes by which forest resources (e.g. standing forest) were converted into products (e.g. spruce pulpwood) (Fig. 2). The studied FWC started with the forest resource (including planting or natural regeneration). Next step was projected forest growth and the different harvesting and hauling operations. The processing of different log assortments in the timber industry ended when the forest industry products were ready to be transported from saw- , pulp-, and paper mills, or when chipped material was ready to be distributed to district heating plants. Indicators reflected economic, environmental and social aspects (Table 1).
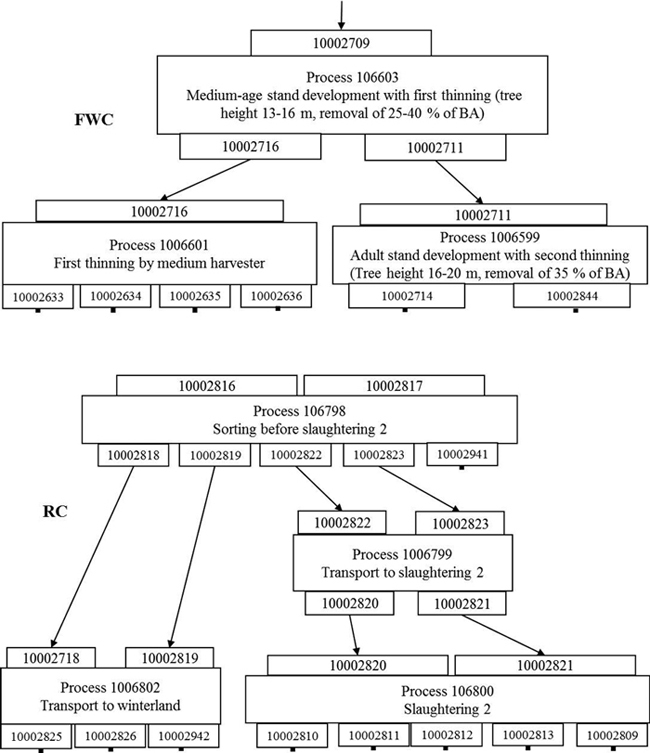
Fig. 2. Part of the Forest Wood Chain (above) with medium age stand development process followed by first thinning with a medium harvester and adult stand development and part of the Reindeer Husbandry Chain (below) with the processes of sorting, transport and slaughtering.
| Table 1. List of sustainability indicators. | ||
| Indicator (type) | Indicator Unit | Process unit |
| GVA1 (Economic) | € | m3ub or kg meat |
| Production costs (Economic) | € | m3ub or kg meat |
| FTE2 (Social) | Number of full time working persons | 1000 m3ub or kg meat |
| Fatal accidents (Social) | Number of accidents | 1000 m3ub or kg meat |
| GHG3 (Environmental) | kg CO2eq | m3ub or kg meat |
| 1 Gross Value Added 2 Full Time Employment 3 Green House Gas | ||
RC was described in a similar way (Fig. 2), based on reindeer-related processes during the eight seasons of the reindeer husbandry year, i.e. spring, early summer, summer, late summer, autumn, early winter, winter, and late winter. The chain started with the number of adult reindeers in late winter before the calves were born, continued to describe the growth of the calves, including events of importance such as collection, marking of the calves, slaughtering and migration to winter lands, and ended – similar to the FWC – with the commercialisation of products, when meat and other by-products were delivered to wholesale dealers for distribution to retail markets. Indicators reflected economic aspects like the herd balance (number of reindeer and losses), compensation for losses and income for meat, production cost; environmental aspects like energy use and greenhouse gas emission; and social aspects like employment and self-employment.
In the FWC the tracking was based on the organic carbon contained in wood, in the RC the tracking was based on organic carbon in the reindeer. The growth of the reindeer calves during grazing, and of trees in forest stand development, was modelled by reflecting the increasing mass of the reindeer (calves) or of the trees in the output shares of products leaving a process. Usually the shares of all output products sum up to maximum 100% of the incoming material (input products). Growth processes were an exception, as the output shares summed up to more than 100% of the input. This effectively achieved a higher amount of material leaving a process than entering it and reflected reality of growing processes, even though it is normally not acceptable in standard ToSIA processes (Lindner et al. 2012).
Indicator values were calculated for individual processes along the FWC and RC related to a reference unit. One important indicator was Gross Value Added (GVA, i.e. revenues and labour costs minus other production costs), the conversion factor was 10.62 SEK per € as average for 2009 (Riksbank 2015). Other indicators were production costs (excluding costs for raw material), yearly full-time employment (FTE), fatal accidents, and greenhouse gas (GHG) emissions from machinery were evaluated according to Berg et al. (2014) (Table 1). This unit is m3ub (under bark) or metric tonnes for the FWC and kg slaughtered meat for the RC. The impact of the overall chain was finally determined by aggregation of indicator values over all processes of the chain.
The selection and validation of the environmental, economic and social indicators was based on their relevance and availability of data. This was secured with the help of associated partners National Association of Swedish Sami, and large forest companies SCA, Sveaskog, and Norra Timber. Impacts of the processes on the selected indicators of both value chains were calculated. The sustainability impacts were measured by looking at scenario-driven changes in indicators that were linked to production processes and compared to the reference. These changes in indicator values were studied at process, process group or chain level.
2.3 Scenarios
The REFERENCE represented current forest management practices according to the latest regional forecasts of Sweden (Swedish Forest Agency 2008). The scenarios included adjustments of forest management practices compared to REFERENCE.
In order to evaluate the effects of changes in current forest management practices in 2009 on the utilization of forests and grazing land for the reindeer in the area, three scenarios were formed:
1) Forest management with increased consideration to reindeer husbandry (REINDEER),
2) Forest management with increased considerations to nature conservation (NATURE),
3) Forest management with increased consideration to reindeer and nature considerations combined (COMBINED).
The main alterations are described below for each scenario. The amendments for REINDEER were built upon suggestions of adjustments promoting reindeer husbandry described by SSR (2009). The changes were mainly applied to key and core areas, i.e. areas of highest importance for reindeer grazing according to Malå Sami village reindeer plan (Fig. 1). For NATURE, adjustments were made according to scenario “Miljö” (Swedish Forest Agency 2008). COMBINED was a combination of REINDEER and NATURE.
The following scenario adjustments were made in comparison to REFERENCE:
REINDEER: less soil scarification, no planting of lodgepole pine (Pinus contorta Douglas ex Loudon), higher proportion of natural regeneration, stronger cleaning and thinning, no fertilisation, longer rotation periods allowing for older trees, and 10 large trees left after clear-cut.
NATURE: of productive forest area 18% were converted to set-aside areas (in REFERENCE 5%), and 10 large trees per ha were left after clear-cut.
COMBINED: a combination of adjustments made in REINDEER and NATURE.
Using the software, RegWise, a forecast was made for each scenario of how the forest resource and output of goods and services would develop over time (Wikström et al. 2011). RegWise is designed for long-time (approximately 100 years) forest scenario analyses at a regional scale in Sweden. Input data for the forecasts was a combination of Swedish National Forest Inventory (NFI) data from 2003 to 2007 (Fridman et al. 2014) and the Malå Sami village reindeer husbandry plan (Sandström et al. 2003; Jan Rannerud, Chairman of Malå Sami village, pers. comm. in 2010). The annual potential harvesting level was defined as equal to total annual growth. The calculated harvest level depended on forest management practices and nature considerations. Results of the forecasts including average regeneration areas and harvesting distributions by tree species and by assortments for the period 2009 to 2034, were incorporated into ToSIA calculations in order to initialise the material flows in the FWC. The use of averages for a period of 25 years was selected in order to even out temporary fluctuations and that the differences in forest management for the scenarios would give effect on the material flow. The assessment of carbon sequestration and emission is made over a period of 50 years, since a longer period would not be deemed relevant for the present machine generation emissions.
The performance within FWC and RC naturally varies between years but this was not reflected in this study since data referred only to 2009.
2.4 Data collection FWC
Economic and social indicator data were previously collected within the EFORWOOD project (data from 2005) and updated for 2009. Harvesting costs per m3 and employment figures are examples of such data (Skogforsk 2010).
Forestry operations were organised into the following components, Forest Resource Management, which includes the establishment and monitoring of the growth and stand management, Forest Operations which contain logging (felling and hauling) to roadside and Transport to Industry. The final component was Industry which consisted of modelled sawmills and pulp- and paper mills and also included (Combined Heat and Power) CHP plants. The average transport distance by road to sawmill was 89 km and to pulp and paper mill 144 km. The carbon content in CO2 equivalents for standing forests was evaluated according to Backeus et al. (2009) and the journal Skogsvärden (2011) with 0.35 tonnes dry weight of wood biomass per m3ob (cubic meter stem wood over bark, the tops included) and with a biomass expansion factor of 1.25, i.e. total biomass in relation to that of standing trees and a carbon content of 50% per tonne. The conversion factor for m3ub to metric tonnes was 0.97 tonnes per cubic meter fresh timber (Berg et al. 2014).
2.5 Data collection RC
Data for reindeer husbandry concerning economic performance and resource use were collected from Jan Rannerud (Chairman of Malå Sami village, pers. comm. 2010) and scientist Per Sandström (SLU, Department of Forest Resource Management, pers. comm. 2010). Specific data concerning land use were provided by Jan Rannerud (pers. comm. 2010) and general economic and social information were acquired from published statistics (Statistics Sweden 1999; Statistik från sametinget 2010).
In REFERENCE, NATURE, and COMBINED the maximum number of reindeer permitted in the Malå Sami village area were 6200 adult reindeer in late winter (Rannerud pers. comm. 2010) (Table 2). The winter seasons were essentially regarded as a period of survival and it is assumed that no reindeer growth took place. The number of reindeer normally decreased from 6700 to 6200 during winter. Due to anticipated better grazing conditions in REINDEER, forests were assumed to feed 200 more reindeer, i.e. 6400 reindeer in winter. About 70% of the animals were adult females, and each was expected to carry a calf. The calves are born in spring after the adult reindeer have been moved to the calving/summer grazing areas. The calves are extremely vulnerable to predators and are dependent on suckling their mothers. During the course of the year, 2500 reindeer were slaughtered (1600 calves and 900 adults) and 1700 were subject to road kill and predators (1630 calves and 70 adults). At slaughter an adult reindeer had an average carcass weight of 40.3 kg and calves 21.8 kg. They were anticipated to grow from 5 kg at calving, to 10 kg before marking in summer and 15 kg after the grazing in autumn (Rannerud pers. comm. 2010). In addition to reindeer husbandry, the Sami village had hunting rights within its borders to shoot 16 moose (Alces alces L.), equivalent of approximately 4000 kg meat (carcass of 250 kg per moose), which were delivered to the slaughter house. In our assumptions REINDEER yielded over 300 additional reindeer for slaughtering and required no supplementary feeding during winter compared to other scenarios and REFERENCE due to the assumed larger areas being suitable for grazing (Table 2).
| Table 2. Absolute number of hunted moose, reindeer (winter herd), born calves, traffic losses and slaughtering for the scenarios. | ||||||
| Scenario | Hunted moose | Winter stem reindeer1 | Born calves | Traffic losses | Other losses2 | Slaughtered |
| REFERENCE NATURE COMBINED | 16 | 6200 | 4200 | 160 | 1540 | 25003 |
| REINDEER | 16 | 6400 | 4335 | 160 | 13404 | 28355 |
| 1 70% cows 2 Predators, starvation and natural causes 3 64% calves 4 200 less losses due to better and richer grazing 5 69% calves | ||||||
The revenue per kg reindeer slaughtered meat was 4.90 € (Statistik från Sametinget 2010; Rannerud pers. comm. 2010). Costs were according to the reports, depreciations and assessment of Malå Sami village, vehicles in operations 15.0 €/day (lorry for transports 2.0 €/km, helicopter 300 €/hour). During late winter there was a need for extra feeding in other scenarios than REINDEER. This feeding consisted of 2.0 kg hay and 1.7 kg ensilage per day and animal to a cost of 0.2 € per kg during a period of 15 days. The labour cost for the rented personnel was according to local market prices, the costs for the members was set to 30.0 € per workday. The carcasses also provided other products after slaughtering, e.g. hides and horns. These products were not accounted for as a revenue in this study.
3 Results
3.1 Forest Wood Chains (FWC)
The scenarios resulted in a substantial differences in potential wood flow to industries. The annual potential harvest was highest for REFERENCE, 1.47 million m3ob, followed by 1.30 million m3ob in NATURE. For REINDEER, the annual harvest was 1.23 million m3ob. The lowest harvest, 1.13 million m3ob, was estimated for the COMBINED scenario (Fig. 3). Similar results were found for volume under bark between the different scenarios (Table 3). REFERENCE provided a potential wood flow to industry that was about 0.2 or 0.3 million m3ub per year higher compared to REINDEER and COMBINED, respectively.
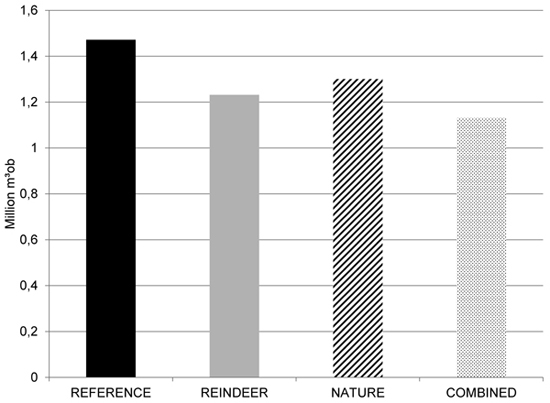
Fig. 3. Development of potential mean annual harvest (volume, million m3ob) from 2009 to 2034 due to prescribed management in REFERENCE and the scenarios.
| Table 3. Calculated potential wood flow from forests to industry in millions of cubic meters, m3ub (under bark, harvested volume) in studied area. | |||||||
| Scenario | Saw timber | Pulp wood | |||||
| Thinning | Final felling | All sawn timber | Thinning | Final felling | All pulpwood | Total | |
| REFERENCE | 0.11 | 0.32 | 0.43 | 0.25 | 0.53 | 0.78 | 1.21 |
| REINDEER | 0.12 | 0.25 | 0.37 | 0.25 | 0.39 | 0.64 | 1.01 |
| NATURE | 0.12 | 0.25 | 0.37 | 0.24 | 0.45 | 0.69 | 1.06 |
| COMBINED | 0.10 | 0.23 | 0.34 | 0.21 | 0.38 | 0.59 | 0.93 |
REFERENCE resulted in the highest potential GVA and production costs (54.2 and 92.8 million €, Table 4), NATURE (52.7 and 90.0 million €), and REINDEER generated less for GVA and production cost (41.1 and 67 million €). COMBINED had lowest GVA (38.6 million €) and production costs of 78.5 million €. Compared to REFERENCE, full time employment (FTE) decreased by 151 and 180 respectively for REINDEER and COMBINED, and less than 100 for NATURE. The calculated number of occupational fatal accidents per year was lower for both REINDEER and COMBINED (0.26 and 0.24) respectively in comparison to 0.33 for REFERENCE and NATURE.
| Table 4. Indicators and its values reflecting the accumulated performance of the FWC (Forest Wood Chain) and RC (Reindeer Husbandry Chain) in REFERENCE and scenarios. | |||||
| Scenario | GVA1 million € | Prod. costs, million € | FTE2, persons | GHG3, 1000 tonne CO2 equivalents | Risk for fatal accidents per year |
| FWC | |||||
| REFERENCE | 54.2 | 92.8 | 659 | 358 | 0.33 |
| REINDEER | 41.1 | 67.0 | 508 | 277 | 0.26 |
| NATURE | 52.7 | 90.0 | 585 | 350 | 0.33 |
| COMBINED | 38.6 | 78.5 | 479 | 262 | 0.24 |
| RC | |||||
| REFERENCE | 0.90 | 0.46 | 12 | 20.2 | 0.18 |
| REINDEER | 1.09 | 0.34 | 13 | 20.9 | 0.18 |
| NATURE and COMBINED | 1.05 | 0.33 | 12 | 20.2 | 0.18 |
| 1 Gross Value Added 2 Full Time Employment 3 Green House Gas | |||||
GHG emissions from machine and industrial processes were higher for REFERENCE (358 kilo tonnes CO2 equivalents), than for NATURE (350 kilo tonnes CO2 equivalents), REINDEER (277 kilo tonnes CO2 equivalents), and COMBINED (262 kilo tonnes CO2 equivalents). In all scenarios Industry contributed the largest proportion of the GHG emissions (Tables 5–8).
| Table 5. Indicator values reflecting the contribution of the chain components to the FWC (Forest Wood Chain) from forest to industry processes in REFERENCE. | |||||
| Components | GVA1 million € | Prod. costs, million € | FTE2, persons | GHG3, 1000 tonne CO2 equiv. | Risk for fatal accidents per year |
| TOTAL | 54.2 | 92.8 | 659 | 357.7 | 0.33 |
| Industry | 30.8 | 57.3 | 365 | 337.4 | 0.05 |
| Forest operations (Transports and Logging) | 27.4 | 32.9 | 253 | 20.0 | 0.29 |
| Transports | –9,0 | 13.1 | 70 | 14,1 | 0.03 |
| Logging | 36.4 | 19.8 | 183 | 5.9 | 0.26 |
| Forest Resource Management | –3.9 | 2.6 | 41 | 0.3 | 0.00 |
| 1 Gross Value Added 2 Full Time Employment 3 Green House Gas | |||||
| Table 6. Indicator values reflecting the contribution of the chain components to the FWC (Forest Wood Chain) from forest to industry processes in REINDEER. | |||||
| Components | GVA1 million € | Prod. costs, million € | FTE2, persons | GHG3, 1000 tonne CO2 equiv. | Risk for fatal accidents per year |
| TOTAL | 41.1 | 67.0 | 508 | 276.5 | 0.26 |
| Industry | 23.6 | 44.1 | 275 | 260.2 | 0.03 |
| Forest operations (Transports and Logging) | 20.6 | 21.2 | 202 | 15.9 | 0.23 |
| Transports | –7.6 | 11.2 | 52 | 11,5 | 0.03 |
| Logging | 28.6 | 10.0 | 150 | 4,4 | 0.20 |
| Forest Resource Management | –3.1 | 1.7 | 31 | 0.3 | 0.00 |
| 1 Gross Value Added 2 Full Time Employment 3 Green House Gas | |||||
| Table 7. Indicator values reflecting the contribution of the chain components to the FWC from forest to industry processes in NATURE. | |||||
| Components | GVA1 million € | Prod. costs, million € | FTE2, persons | GHG3, 1000 tonne CO2 equiv. | Risk for fatal accidents per year |
| TOTAL | 52.7 | 95.4 | 585 | 350 | 0.33 |
| Industry | 29.8 | 55.6 | 346 | 330 | 0.04 |
| Forest operations (Transports and Logging) | 26.2 | 37.6 | 239 | 20 | 0.29 |
| Transports | –9.7 | 14.1 | 64 | 11 | 0.05 |
| Logging | 35.9 | 23,5 | 174 | 9 | 0.24 |
| Forest Resource Management | –3.3 | 2.0 | 33 | 0 | 0.00 |
| 1 Gross Value Added 2 Full Time Employment 3 Green House Gas | |||||
| Table 8. Indicator values reflecting the contribution of the chain components to the FWC from forest to industry processes in COMBINED. | |||||
| Components | GVA1 million € | Prod. costs, million € | FTE2, persons | GHG3, 1000 tonne CO2 equiv. | Risk for fatal accidents per year |
| TOTAL | 38.6 | 78.5 | 479 | 262.3 | 0.24 |
| Industry | 22.5 | 42.0 | 263 | 247.2 | 0.03 |
| Forest operations (Transports and Logging) | 19.2 | 34.8 | 185 | 14.9 | 0.21 |
| Transports | –7.1 | 10.4 | 45 | 10.6 | 0.03 |
| Logging | 26.3 | 24.4 | 140 | 4,3 | 0.18 |
| Forest Resource Management | –3.05 | 3.0 | 31 | 0.3 | 0.00 |
| 1 Gross Value Added 2 Full Time Employment 3 Green House Gas | |||||
The GVA was marginally higher in Industry compared to Forest operations for all scenarios (Tables 5–8). Production costs were higher for Industry in all scenarios and its absolute level was related to the wood flow. FTE in Industry was always more than 50% of the total FTE in each scenario. It was 365 and 346 per year in REFERENCE and NATURE respectively, and lower in REINDEER (275) and COMBINED (263). In each scenario Industry component dominated the emissions of GHG, ranging from 337 to 247 kilo tonnes CO2 equivalents in REFERENCE and COMBINED respectively. Regardless of scenario the GHG emissions from other components of the chain, were less than 10% of the totals for each FWC. The risk for fatal accident in all scenarios was high in Logging, leaving Transports and Industry on a similar level. Forest Resource Management had virtually no risk for fatal accidents.
3.2 Reindeer husbandry Chains (RC)
For REINDEER the GVA was more than 20% higher than in the REFERENCE. It also had lower production costs (Table 4). The REINDEER scenario had 3% higher GHG emissions than other scenarios. Fatal accidents were equally high for all scenarios, i.e. 0.18. The highest production costs for the scenarios were in autumn (sorting and slaughtering of adult reindeer), early winter (collection, sorting and slaughtering of reindeer), and late winter (transport to calving land) (Fig. 4). The high production cost in late winter for REFERENCE depended on the need for supplementary feeding.
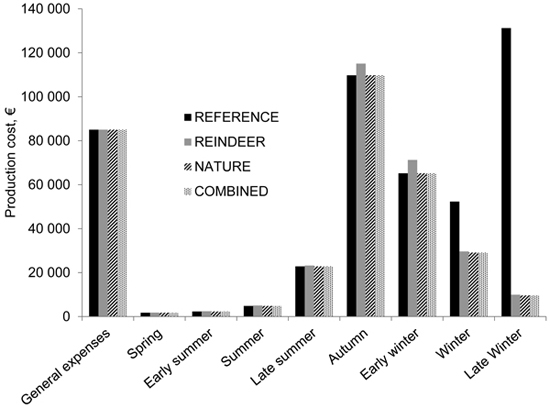
Fig. 4. Production costs (€) for the Sami village distributed on general expenses and reindeer husbandry seasons.
3.3 Carbon sequestration in FWC and RC
The development of the growing stock increased for all scenarios (Fig. 5). All scenarios saw about 30% higher growing stock compared to the REFERENCE after 100 years had elapsed. This resulted in an increased carbon sequestration in the forest for the first 50 years after 2009 for REINDEER and NATURE (Table 9).
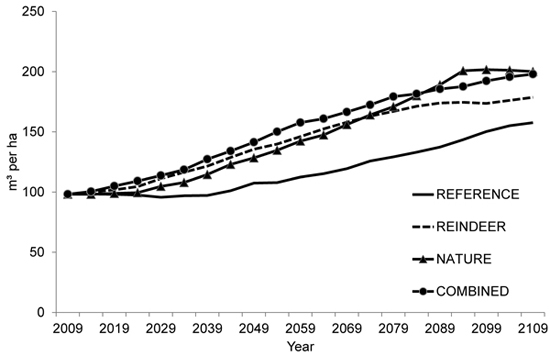
Fig. 5. Development of growing stock (volume, m3 per ha) from 2009 to 2108 for REFERENCE and each scenario.
| Table 9. Annual sequestration (trees above ground) and emissions from FWC1 2009–2059 in the study area, 1000 tonnes CO2 equivalents. | |||
| Scenario | Sequestration | Emissions | Quota (sequestration/ emission) |
| REFERENCE | 125 | 358 | 0.35 |
| RENDEER | 420 | 277 | 1.52 |
| NATURE | 522 | 351 | 1.49 |
| COMBINED | 387 | 262 | 1.47 |
| 1 Forest Wood Chain | |||
4 Discussion
4.1 Performance of FWC and RC
The participation of stakeholders was necessary to obtain data and relevant structures (processes and products) of the FWC and RC. The parties also confirmed the results, which were presented to the parties at four workshops during winter 2011–2012. This supported the experiences by Reed (2008) who states that participatory involvement by stakeholder groups is important for successful involvement.
The results showed that adjustments of forest management practices according to the National Association of Swedish Sami policy (SSR 2009) gave a reduced flow of raw timber material to industry due to lower potential annual wood harvests. This lead to a lower GVA and FTE for FWC, especially in the REINDEER scenario. GVA from the FWC ranged between 40–55 million € when compared to approximately 1 million € from the RC. The relative size of GHG emissions were of similar proportions. The performance of REFERENCE and the scenarios was evaluated as if the harvest potential cut was fully utilized. However, in the real world, the total annual forest growth may not be harvested due to practical or economic limitations which would result in smaller differences between individual indicator values depending on scenario.
The growing stock increased more in all scenarios than in REFERENCE over the coming fifty years. Compared to the annual GHG emissions, it revealed that sequestration in living trees above ground in the scenarios might add up to approximately 1.5 times the GHG emissions from the whole FWC (Table 9). The most important changes in forest management practices resulting in higher sequestration were longer rotation periods – up to 40% – in core and key areas and increased set aside areas with no cutting.
For RC, GVA and FTE increased for REINDEER but this did not compensate for the reductions for the same indicators in FWC between REINDEER and REFERENCE. In fact, the FTE of RC in REINDEER (i.e. 12–13) was insignificant compared to the whole FWC in REFERENCE (i.e. 659). Nevertheless, employment in FWC had local importance (employment of local people) within the studied area as 224 FTEs in REFERENCE (Table 5) were attributed to Logging and Forest Resource Management. In REINDEER, NATURE and COMBINED the FTE was 181, 207 and 171 respectively (Tables 6–8) indicating that a change in forest management practices could have a relatively large effect on FTE locally. The number of FTE in reindeer husbandry was probably underestimated as it is a traditional rural economy, which supports a family of 3–5 individuals through direct cash or products, and also raw material for leather works and other handicrafts. The latter was not included in this study. This was not likely the case among forest workers who represented a normal, industrial labour market. NATURE had a lower impact on harvest and economy due to the fact that the set-aside areas did represent only 13% larger set-aside areas than in REFERENCE. On land outside the set-aside areas the forest management practices were applied according to REFERENCE.
In a study by Bostedt et al. (2003) adjustments in forest management practices promoting reindeer husbandry lead to lower income from timber production. In this study it was also evident that the suggestions of adjustments promoting reindeer husbandry made by SSR (2009) used in REINDEER resulted in a much lower wood flow, but also much lower costs for additional feeding of reindeer during late winter (Fig. 4).
4.2 The impact of feeding and grazing on RC
It was evident from this study that the suggestions of adjustments promoting reindeer husbandry made by the National Association of Swedish Sami (SSR 2009) used in REINDEER resulted in a much lower wood flow, but also much lower costs for supplementary winter feeding due to unsatisfactory winter grazing conditions (Fig. 4). For instance, old-growth, lichen-covered forests are especially needed in the winter areas. In light of this, there may be more opportunities for interested stakeholders to find a locally adapted management that is satisfactory to all. Negative for reindeer husbandry are, e.g. fertilizing and scarification which both decrease the areas of ground lichens (SSR 2009). The impact of these operations could be reduced if they are carefully planned at a spatial level that also considers migration routes.
In the study the loss of reindeer was almost as large as the number of reindeer being slaughtered, which had a major impact on the economy of the Sami village. Annual variation in calf-losses can be significant, but were not reflected in this study. The GVA of the reindeer chain was highly dependent on the number of reindeer being slaughtered, the need for supplementary winter feeding due to unsatisfactory winter grazing, and the costs for vehicles and energy for monitoring the moving of the herd(s) between grazing lands. Thus, it is of extreme importance that losses of animals because of predators and events of unsatisfactory living conditions, e.g. harsh weather, are low. The absolute risk of fatal accidents on a yearly basis related to size of the workforce was high in RC (Statistics Sweden 1999), considerably higher than in FWC (Table 4).
4.3 Risks and uncertainties
As can be seen from results, no statistical assessment of risks and uncertainties has been made, since no relevant data was available from Malå Same village. Instead, scenarios were used in order to demonstrate the effect of variation. In general, based on national statistics from Sametinget (2010), there was a strong variation of survival of calves between years depending on weather conditions and threats from predators. This variation would have had an impact on the economic result. Forests are more stable and predictable, although, timber prices are volatile and forest damage occurs randomly. The authors have considered it as outside the scope of this study to assess inherent risks in the FWC and RC as the relevant issue was to evaluate the impacts of changes in management according to prescribed alternatives.
5 Conclusions
Reduced harvest as a result of forest management practices adapted to the needs of reindeer husbandry and nature generated less potential employment in forestry and forest industry.
Longer rotation periods for parts of the forest in consideration of reindeer husbandry would result in future potential harvested material equal to or slightly less than REFERENCE.
The applied considerations defined in this study would increase the amount of carbon stored in the landscape.
The performance of RC was highly dependent on the number of reindeer kept alive until slaughtering and the need for supplementary feeding. Costs for reindeer husbandry were high during periods in the year which included transport, slaughtering, and supplementary feeding.
The results of this study should not be considered as a final evaluation of RC in comparison with the FWC. The role of ToSIA is rather to be seen as a communication tool where stakeholders and other vested interests can quantify and visualize the impact of indigenous activities as a local industry, which can be only carried out by Sami. Unlike forestry and forest industry, the reporting on reindeer husbandry is not as extensive and regular as in other industries. The knowledge is with the Sami, and in order to get access to that, mutual trust needs to be built in long-term relationships.
Acknowledgements
We thank Jan Rannerud, Malå Sami village, Anders Blom, Helen Larsson and Ragnhild Svonni, the Association of Swedish Sami, Hans Winsa, Sveaskog, Per Sandström, Swedish University of Agricultural Sciences, and the associated partners in the project for valuable input to the scenario set-up. We also thank Joanne Fitzgerald for language checking. The authors also thank the reviewers for their comments, which improved our paper. The work was funded by the Northern Periphery Programme.
References
Backeus S., Lämås T., Wikström P. (2009). Carbon sequestration in Swedish forest stands under various management regimes. Forest Management strategies for CO2 mitigation. Doctorial Thesis No 2009:89. Faculty of Forest Sciences. Swedish University of Agricultural Science.
Berg S., Schweier J., Brüchert F., Lindner M., Valinger E. (2014). Economic, environmental and social impact of alternative forest management in Baden-Württemberg (Germany) and Västerbotten (Sweden). Scandinavian Journal of Forest Research 29(5): 485–498. http://dx.doi.org/10.1080/02827581.2014.927913.
Bostedt G., Parks P.J., Boman M. (2003). Integrated natural resource management in northern Sweden: an application to forestry and reindeer husbandry. Land Economics 79(2):149–159. http://dx.doi.org/10.2307/3146864.
Eversole R. (2003). Managing the pitfalls of participatory development: some insight from Australia. World Development 31(5): 781–795. http://dx.doi.org/10.1016/S0305-750X(03)00018-4.
Fridman J., Holm S., Nilsson M., Nilsson P., Ringvall A.H., Ståhl G. (2014). Adapting National Forest Inventories to changing requirements – the case of the Swedish National Forest Inventory at the turn of the 20th century. Silva Fennica 48(3) article 1095. http://dx.doi.org/10.14214/sf.1095.
Jones A., Barnett B., Williams A.J., Grayson J., Busilacchi S., Duckworth A., Evans-Illidge E., Begg G.A., Murchie C.D. (2008). Effective communication tools to engage Torres Strait Islanders in scientific research. Continental Shelf Research 28(16): 2350–2356. http://dx.doi.org/10.1016/j.csr.2008.03.027.
Lindner M., Werhahn-Mees W., Suominen T., Vötter D., Pekkanen M., Zudin S., Roubalova M., Kneblik P., Brüchert F., Valinger E., Guinard L., Pizzirani S., Päivinen R. (2012). Conducting sustainability impact assessments of forestry-wood chains - examples of ToSIA applications. European Journal of Forest Research 131(1): 21–34. http://dx.doi.org/10.1007/s10342-011-0483-7.
Mustajoki J., Saarikoski H., Marttunen M., Ahtikoski A., Hallikainen V., Helle T., Hyppönen M., Jokinen M., Naskali A., Tuulentie S., Varmola M., Vatanen E., Ylisirniö A.-L. (2011). Use of decision analysis interviews to support the sustainable use of the forests in Finnish Upper Lapland. Journal of Environmental Management 92(6): 1550–1563. http://dx.doi.org/10.1016/j.jenvman.2011.01.007.
Päivinen R., Lindner M., Rosén K., Lexer M.J. (2012). A concept for assessing sustainability impacts of forestry-wood chains. European Journal of Forest Research 131(1): 7–19. http://dx.doi.org/10.1007/s10342-010-0446-4.
Pülzl H., Prokofieva I., Berg S., Rametsteiner E., Agestam F., Wolfslehner B. (2013). Indicator development in sustainability impact assessment: balancing theory and practice. European Journal of Forest Research 131(1): 35–46. http://dx.doi.org/10.1007/s10342-011-0547-8.
Reed M.S. (2008). Stakeholder participation for environmental management: a literature review. Biological Conservation 141(10): 2417–2431. http://dx.doi.org/10.1016/j.biocon.2008.07.014.
Riksbank (2015). Annual average exchange rates (aggregate). http://www.riksbank.se/en/Interest-and-exchange-rates/Annual-aggregate-Exchange-rates/?y=2009&m=12&s=Comma. [Cited 10 September 2015].
Sandström C., Widmark C. (2007). Stakeholders’ perceptions of consultations as tools for co-management – a case study of the forestry and reindeer herding sectors in northern Sweden. Forest Policy and Economics 10(1–2): 25–35. http://dx.doi.org/10.1016/j.forpol.2007.02.001.
Sandström C., Lindqvist A., Öhman K., Nordström E.-M. (2011). Governing competing demand for forest resources in Sweden. Forests 2: 218–242. http://dx.doi.org/10.3390/f2010218.
Sandström P., Granqvist Pahlén T., Edenius L., Tømmervik H., Hagner O., Hemberg L., Olsson H., Baer K., Stenlund T., Brandt L.-G., Egberth M. (2003). Conflict resolution by participatory management: remote sensing and GIS as tools for communicating land use needs for reindeer herding in northern Sweden. Ambio 32(8): 557–567. http://dx.doi.org/10.1579/0044-7447-32.8.557.
SFS (1993). Rennäringslagen (1993:36). [The law regulating reindeer husbandry]. SFS 1971:437. [In Swedish].
Silver J.J., Campbell L.M. (2005). Fisher participation in research: dilemmas with the use of fisher knowledge. Ocean & Coastal Management 48(9–10): 721–741. http://dx.doi.org/10.1016/j.ocecoaman.2005.06.003.
Skogforsk (2010). Eforwood ToSIA a tool for sustainability impact assessment of the Forest Wood chain. Skogforsk. Sixth framework programme.
Swedish Forest Agency (2001). Skogsvårdslagen. Handbok. [The Forestry Act of Sweden]. Skogsstyrelsens Förlag, Jönköping. [In Swedish].
Swedish Forest Agency (2008). Skogliga konsekvensanalyser – SKA-VB 08. [Impact Assessment of Forest Management Alternatives]. Rapport 25/2008, Skogsstyrelsen, Jönköping. [In Swedish].
Swedish Forest Agency (2012). Skogsvårdslagstiftningen. Gällande regler 1 januari 2012. [Regulations based on the Forestry ACT]. Skogsstyrelsen, Jönköping. [In Swedish].
Skogsvärden (2011). http://www.skogssverige.se/skog/skogen/swe/lathund.cfm. [Cited 10 Sept 2011]. [In Swedish].
SSR (2009). Ett renskötselanpassat skogsbruk. [Forest management adapted to Reindeer husbandry]. Svenska Samernas Riksförbund. http://www.sapmi.se/skogspolicy.pdf. [Cited 9 Sept 2011]. [In Swedish].
Statistics Sweden (1999). Svensk rennäring. [Reindeer husbandry in Sweden]. Bulls tryckeriaktiebolag Halmstad 1999. [In Swedish].
Statistik från Sametinget (2010). [Statisics from the Swedish Sami Parliament]. Information Leaflet at http://www.sametinget.se/9238. [Cited 12 Sept 2011]. [In Swedish].
Wikström P., Edenius L., Elfving B., Eriksson L.O., Lämås T., Sonesson J., Öhman K., Wallerman J., Waller C., Klintebäck F. (2011). The Heureka forestry decision support system: an overview. Mathematical and Computational Forestry and Natural-Resource Sciences 3(2): 87–94.
Total of 26 references.
