Seppo Nevalainen  ,
Juho Matala,
Kari T. Korhonen,
Antti Ihalainen,
Ari Nikula
,
Juho Matala,
Kari T. Korhonen,
Antti Ihalainen,
Ari Nikula
Moose damage in National Forest Inventories (1986–2008) in Finland
Nevalainen S., Matala J., Korhonen K. T., Ihalainen A., Nikula A. (2016). Moose damage in National Forest Inventories (1986–2008) in Finland. Silva Fennica vol. 50 no. 2 article id 1410. https://doi.org/10.14214/sf.1410
Highlights
- Almost 100 000 stands were studied
- The proportion of damage doubled during the study period
- Tree species mixture had a clear effect on the damage frequency
- The damage was more common in mineral soils than in peatlands, in artificially than in naturally regenerated stands and in stands that needed thinning or clearing or in which soil preparation was used.
Abstract
The occurrence of moose damage was studied using data from three National Forest Inventories (NFIs) accomplished between 1986 and 2008 in Finland. The combined data included a total of 97 390 young stands. The proportion of moose damage increased from 3.6% to 8.6% between the 8th NFI (1986–1994) and the 10th NFI (2004–2008). The majority (75%) of the damage occurred in Scots pine-dominated stands. The proportion of damage was higher in aspen-dominated stands than in stands dominated by any other tree species. The tree species mixture also had a clear effect on the occurrence of damage. Pure Scots pine stands had less damage than mixed Scots pine stands, and moose damage decreased linearly with the increasing proportion of Scots pine. Stands on mineral soil had more frequent moose damage than stands on peatlands. The fertility class of the site had no straightforward effect on the damage frequency. Artificially regenerated stands had more damage than naturally regenerated stands. Accomplished soil preparation measures and the need for thinning or clearing operations increased moose damage. High proportions of moose damage in young stands were found around the country. In the 10th NFI, the largest concentration of damage was found in southwestern Finland. Our study shows the temporal and spatial changes in the occurrence of moose damage and pinpoints some important silvicultural factors affecting the relative risk of young stands over a large geographical area.
Keywords
Populus tremula;
Pinus sylvestris;
regeneration;
soil preparation;
thinning;
Betula spp.;
Keywords Alces alces;
seedling stands;
tree species mixture
-
Nevalainen,
Natural Resources Institute Finland (Luke), Management and Production of Renewable Resources, P.O. Box 68, FI-80101 Joensuu, Finland
E-mail
seppo.nevalainen@luke.fi
- Matala, Natural Resources Institute Finland (Luke), Management and Production of Renewable Resources, P.O. Box 68, FI-80101 Joensuu, Finland E-mail juho.matala@luke.fi
- Korhonen, Natural Resources Institute Finland (Luke), Economics and society, P.O. Box 68, FI-80101 Joensuu, Finland E-mail kari.t.korhonen@luke.fi
- Ihalainen, Natural Resources Institute Finland (Luke), Economics and society, P.O. Box 18, FI-01301 Vantaa, Finland E-mail antti.ihalainen@luke.fi
- Nikula, Natural Resources Institute Finland (Luke), Economics and society, P.O. Box 16, FI-96301 Rovaniemi, Finland E-mail ari.nikula@luke.fi
Received 22 June 2015 Accepted 25 January 2016 Published 5 February 2016
Views 193757
Available at https://doi.org/10.14214/sf.1410 | Download PDF

1 Introduction
Browsing by moose (Alces alces L.) can influence the entire ecosystem through changes of plant species diversity, vegetation structure, biomass production and nutrient cycling (McInnes et al. 1992; Niemelä et al. 2001). Moose cause damage to trees by browsing apical shoots, lateral twigs and foliage, breaking the main stem and peeling the bark. Severe damage may lead to a reduction of the technical quality of timber, growth losses and impaired development of the stand (e.g., Heikkilä and Härkönen 1993; Heikkilä and Löyttyniemi 1992; Härkönen et al. 2009; Bergqvist et al. 2001, 2003, 2014). The biggest economic losses to forestry by moose are due to winter time browsing in Scots pine (Pinus sylvestris L.) sapling stands in Fennoscandia (Helle et al. 1987; Lavsund 1987). In addition to being severe pests in forests, moose is a valuable game animal (e.g., Mattsson 1990).
Moose populations in Fennoscandian countries increased in the 1970s and 1980s due to controlled hunting, a low level of predators and the commencement of so-called plantation forestry since the 1950s (Markgren 1974; Lavsund 1987; Cederlund and Bergström 1996; Lavsund et al. 2003). Forestry has aimed at an economically optimal age-class distribution of the forests with a high proportion of young forest, which has also favoured the moose (Markgren 1974; Lavsund et al. 2003).
The following factors have been linked to moose damage: structural properties of the stand (e.g., Edenius 1993; Ball and Dahlgren 2002; Milligan and Koricheva 2013), tree carbon/nutrient balance (Bryant et al. 1983), site type (Heikkilä and Härkönen 1993; Jalkanen 2001) and soil properties (Löyttyniemi 1985; Löyttyniemi and Hiltunen 1978; Haukioja et al. 1983; Heikkilä 1990; Heikkilä and Mikkonen 1992; Heikkilä and Härkönen 1993, 1996; Jalkanen 2001; Vehviläinen and Koricheva 2006). The structural characteristics of landscapes adjacent to regeneration areas have also been found to affect moose damage (Heikkilä 1990; Heikkilä and Härkönen 1993; Månsson 2009). Some of these factors, like site productivity, have been found to increase browsing by moose and, thus, the risk of moose damage. However, studies of some other factors, like tree species composition (Heikkilä and Härkönen 1996; Ball and Dahlgren 2002) or the density of stands (Heikkilä and Mikkonen 1992) have produced contradictory results, regarding whether these factors increase or decrease the amount of browsing and, consequently, moose damage.
Most of the studies cited above have been local studies conducted in areas where moose damage is common. Representative large scale surveys on the damage frequency are rare.
Large scale studies of moose browsing (Hörnberg 2001; Bergqvist 2003) have suggested that the consumption of different food items by moose is proportional to the occurrence of forage. Thus, because the occurrence of forage species varies among regions, one could expect also differences in the effects of different factors that affect moose damage.
The National Forest Inventories (NFIs) produce information on forest resources for the whole area of Finland, which covers over 20 million hectares of forest land. The forest resource data collected in the inventories is based on diverse on-site surveys conducted on stands selected on the basis of a systematic statistical sample. The main purpose of NFI is to produce national and regional data on the volume, growth and quality of the forest resources, land use structure and forest ownership. In recent years, aspects like forest health, biodiversity of forests and forest carbon stocks have become more and more important.
The first data on moose damage was collected in Finland in the 3rd NFI (1951–1953) (Löyttyniemi 1982), and data on moose damage was also recorded in the 7th NFI (1977–1984). However, detailed stand and sample tree level observations of damaging agents were first included in the 8th NFI (1986–1994). In the 9th NFI (1996–2003), these aspects were further developed. In the 10th NFI (2004–2008), the inventory cycle was intensified to 5 years from the 8 to 10 years of the previous NFIs, and a portion of the field plots were measured throughout the country every year (= rolling NFI), while in the 8th and 9th NFI one region of the country was inventoried each year.
The aim of this study was to describe, based on a representative NFI sample plot networks, the occurrence and spatial and temporal changes of the moose damage in forest stands in Finland from 1986 to 2008. Furthermore, the aim was to describe the effect of silvicultural practices and stand characteristics on the relative damage risk.
2 Material and methods
In this study, we used the field measurements of the 8th (1986–1994), 9th (1996–2003) and 10th (2004–2008) National Forest Inventories. NFIs used plots that were arranged in detached L- or square-shaped clusters (also called tracts). Sampling design varied slightly between the NFI cycles and in different parts of the country. The distance between clusters increased from south to north, and was 6 × 6 km in southern and 10 × 10 km in northernmost Finland in the 10th NFI, for instance (Korhonen et al. 2013). The clusters were comprised of 12–14 relascope (Bitterlich) plots, with a 250 or 300 m distance between plots. Each year, the field work was normally carried out by 8–14 teams, each consisting of a team leader and one or two assistants. The 8th and the 9th NFIs were regional inventories, and the annual spatial coverages are shown in Fig. 1. In the 10th NFI, plots were measured each year throughout the country, except that the area of the three northernmost Forest Centers was not measured in 2004 and no measurements were carried out in the northernmost Lapland in the 10th NFI.
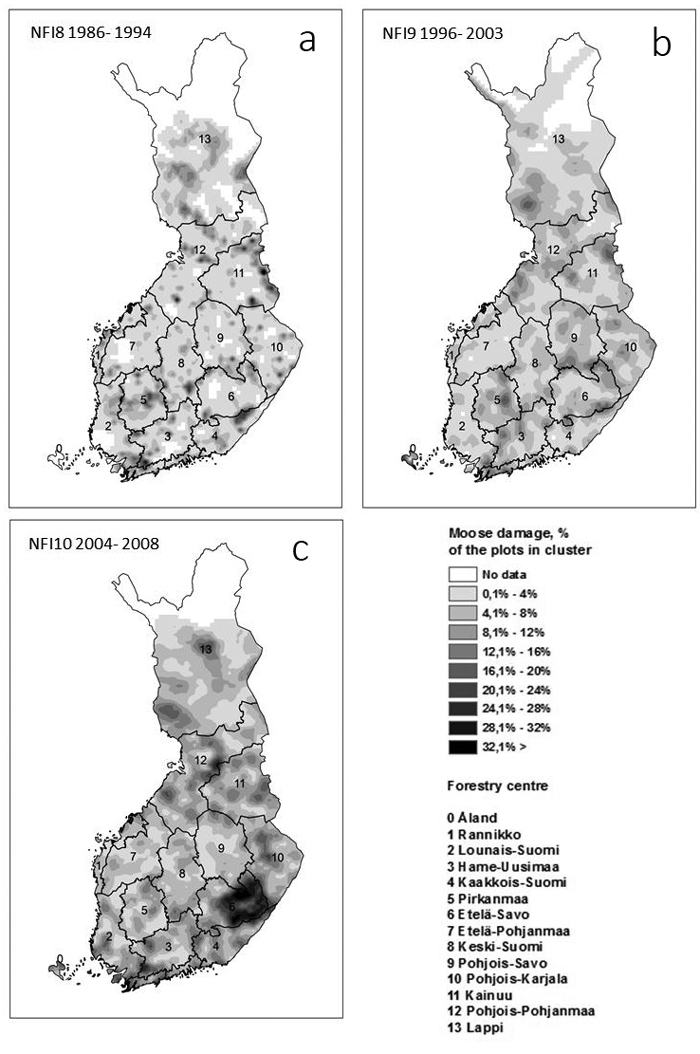
Fig. 1. The geographical distribution of moose damage in young stands (development classes 2–4) in the three National Forest inventories (NFIs). The approximate borders of the inventory areas as well inventory years of the 8th and 9th NFI are shown in a) and b). The borders of the former Forest Centers are shown in c). The map was produced from tractwise means of moose damaged plots by kriging (spherical model)in ArcGis. The output cell size was 10 km.
For the forest stand where a plot was located (hereafter referred to as a plot or a stand), more than 100 variables were measured or assessed to describe the site, growing stock, damage and accomplished or proposed stand management measures. A ‘stand’ is defined in NFI as a geographic unit that is homogeneous with respect to land use, ownership, site properties, and the structure of the growing stock (development class and tree species composition as well as with respect to the recently accomplished and needed silvicultural and cutting operations) (see Tomppo et al. 2011).
According to the instructions for field work, only the nearest 0.25 hectares (or 0.5 hectares in North Finland) around the plot was considered when assessing the stand level parameters. Only stand-wise data was used in this study. For the definitions and classifications of the stand variables used in this study, see Table 1. Only those stand variables which were common in all the three inventories were included in the analysis. Some variables were reclassified for the analyses, e.g., the least fertile site types (6–8) were combined, owing to the small size of classes 7 and 8, resulting in six classes. The tree species codes were reduced into four or seven classes, instead of the original species list. The birch species, e.g., Betula pendula Roth. and Betula pubescens Ehrh., were combined in the analysis, because of the small number of Betula pubescens-dominated stands.
| Table 1. Description of the most relevant stand variables and description of the variables used for assessing forest damage at the stand level in the 8th–10th National Forest Inventories (NFI) of Finland 1986–2004. The numbers (8,9,0) after the damage codes refer to the NFIs (10th NFI expressed as 0). For a more detailed description, see Tomppo et al. 2011. View in new window/tab. |
For this study, we compiled a database of the field observations made in the 8th–10th NFIs. We used only data from the stands, in which the centerpoint of the plot was located. To estimate the damage area, all data on forest land were used first. For further analyses we included only stands in development classes 2–4 (young seedling stands, advanced seedling stands and young thinning stands) in forestland (for definitions of the classes, see Table 1). These stands are hereafter referred to as ‘young stands’. The combined data included a total of 97 390 stands in development classes 2–4 (35 143, 27 837 and 34 410 from the 8th, 9th and 10th NFI respectively) and 120 variables.
Forest damage was assessed in stands situated on forest land, i.e. where the potential mean annual increment of growing stock is at least 1 m3 ha–1. In this study, we used only stand-wise damage assessments, made by the team leader. The damage was described using three different variables: the symptom, the cause and the degree of damage (i.e., the severity of the damage from the silvicultural point of view). At the stand level, this is the summed importance of all damage causes. In principle, a similar coding system was used in all three inventories, although the codes for symptoms and causal agents varied somewhat in different inventories and changed a little even between years. In the 8th and 9th NFI, only one (the most severe damage agent in the stand) was reported. Since the 10th NFI, the two most severe damage agents were described for each stand. In this study we used only one (the most severe) damage record per stand, also for the 10th NFI. For the purposes of this study, we used only damage cause code B2: moose, deer or reindeer. Since the 9th NFI, the time and duration of the damage event have also been recorded. Also, the symptom classification in the 8th NFI was somewhat different, and it was impossible to make a coherent classification that suited all three inventories. The damage variables are described in Table 1.
The presence/absence of moose damage in a stand was used as the response variable.
When analysing the occurrence of damage, sample plot observations were treated ignoring the slightly varying sampling intensity between regions and years. In the analysis of moose damage in relation to NFI-variables, a descriptive data analysis was done first. Calculations were mostly performed with IBM SPSS Statistics, version 20 (IBM Corp. 2011). Statistical analyses were done within the R environment (R core team 2015) using the base package. In individual testing of the predictors, Fisher’s exact test was used In 2 × 2 tables instead of Chi-square tests. One-way analysis of variance was performed using the Welch correction. The Dunnett-Tukey-Kramer test in the DTK package of R (Matthew 2013) was used for multiple comparisons after Welch’s anova.
GIS analyses were performed with ArcGIS, ver.10.0 (ESRI Inc. 2010). We also estimated the total area of moose damage using sample based estimator (Table 2), i.e. the sampling intensity in each region was taken into account. Areas were estimated by summing the number of plots in each category, dividing the sum by number of plots on land in each region and multiplying by the land area of each region. The standard errors of area estimates were estimated using the standard error estimate of a ratio estimator (Cochran 1977).
| Table 2. The occurrence of different standwise damage degree classes of moose damage in forest land in Finland in three National Forest Inventories, split by the main tree species and the development class of the stand. The numbers present the estimated area in km2. View in new window/tab. |
In addition to the individual testing of the predictors in the descriptive analyses, the contributions of explanatory variables for the relative moose damage risk was analyzed using a generalized linear mixed-effects model (GLMM). A model with a binomial response (logit-link function) was fitted with glmer-procedure, in the lme4-package of R (Bates et al. 2015). The presence/absence of moose damage in a stand was used as the binary response variable.
Potential explanatory variables were seeked through recursive partitioning and Random Forest methods in R (package rpart (Therneau et al. 2015) and package randomForest (Liaw and Wiener 2002)).
The multilevel hierarchy of the data (forest center area, municipality, cluster and sample plot levels) was taken into account by including random effects at different levels in the variance component model, and by allowing the intercept to vary randomly across the levels (e.g. Goldstein 2003). Overdispersion was tested with the dispersion_glmer-procedure in the blmeco-package (Korner-Nievergelt et al. 2015).
The form of the model was:

where log(p/(1−p)) describes the outcome binary variable (logit link); X´ijkl are the fxed predictor variables with corresponding coefficients vector β; u represent the random effects at different levels of hierarchy. The subscripts i, j, k and l refer to the forest center area, municipality, cluster and sample plot levels, respectively.
The fit of the model was estimated using the predict-function in lme4-package, which gives the predicted probabilities. The mean of the predicted values was used as a cutoff value to convert the predictions to 0or 1. A predicted-vs-observed table was then formed to compute the specificity-sensitivity values and other measures of the prediction success. In addition, the area under the curve (AUC) was computed with the pROC-package in R (Robin et al. 2011). Package lsmeans (Lenth 2015) was used in pairwise comparisons between classes of predictor variables.
3 Results
3.1 The occurrence of moose damage
The occurrence of moose damage was more than two times higher in the 10th NFI (2004–2008) as compared to the 8th NFI (1986–1994) in the whole country. The area of all forest land with moose damage was 443 000 hectares (8th NFI), 653 000 hectares (9th NFI) and 990 000 hectares (10th NFI). These areas represent 2.2%, 3.2% and 4.9% of the forest land area, respectively (Table 2). Between the 9th and 10th NFIs the area of moose damage had increased by 343 000 hectares. The standard error of the area estimate in the 10th NFI was 26 600 hectares. Thus, the increase in damage area was statistically significant.
The proportion of moose damage increased in all development classes, but especially in development class 3 (advanced seedling stand) of Scots pine- or broadleaved-dominated stands. For definitions, see Table 1.
The degree of damage was slight (did not decrease the silvicultural quality of the stand) in 43.8% of the cases in the combined data of the three inventories (Table 2). The share of at least moderate damage (i.e., damage that has decreased the quality of the stand by more than one class) was 10%. The proportion of stands classified as complete damaged was 1.1%. The proportion of moderate, severe, and total moose damage out of the all moose damage has increased by more than 10%-units, from 49.9% to 61.9% between the 8th and 10th inventory.
Although moose damage was slight in about half of the cases, damage by moose was generally more severe than damage by other agents. For the other causes of damage, the mean proportion of at least severe damage was 6% and the proportion of complete damage was 0.5%.
Moose damage was most common in development classes 2–4 (in ‘young stands’), and the analyses later on concentrate on these classes. As a grand mean, moose damage was recorded in 5835 (6.0%) of the studied 97 390 stands belonging to development classes 2–4 in the 8th–10th NFI’s. In the development classes 2–4 the proportion of moose damage was 3.9% in the 8th NFI, 5.5% in the 9th NFI and 8.6% in the 10th NFI. As the majority of the stands in this study were dominated by Scots pine (see Table 2), the largest number of the damage cases (4380 or 75.1%) was found in Scots pine-dominated stands and 780 (13.4%) in birch-dominated stands.
The increase in the proportion of moose damage (development classes 2–4) was evident around the country, in almost all Forest Centers, except in Forest Centers 5 (Pirkanmaa), 9 (Pohjois-Savo) and 0(the Åland Archipelago). Moose damage was especially common and had increased the most in Forest Center 6 (Etelä-Savo) (Fig. 2).
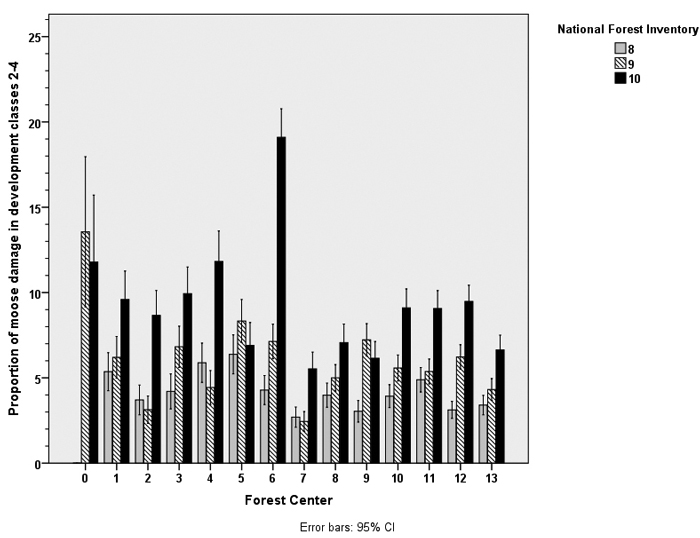
Fig. 2. The proportion of moose damage in young stands (development classes 2–4) in the area of Forest Centers in Finland. The borders of the Forest Centers are shown in Fig. 1.
As mentioned earlier, the 8th and 9th NFI were regional inventories, while the 10th NFI principally covered the whole country each year. The area of moose damage in the 10th NFI was 1.4–2.8 fold, as compared to the damage in the very same areas in the 8th NFI, and 1–2.1 fold as compared to the same areas in the 9th NFI. The geographical distribution of moose damage in the three NFIs is shown in Fig. 1. The most prominent change was the increase of damage in southeastern Finland in the 10th NFI, although areas with high moose damage densities were found throughout the country, e.g., in North-Bothnia and in the southwestern corner and, compared to the 9th NFI, in Lapland (Fig. 1).
Damage age was recorded in the 9th and 10th NFI. Only 10% of the observed moose damage in development classes 2–4 was recorded to be less than two years old. Almost 71% of the damage cases were recorded to be more than five years old. In 80% of the cases, the damage was reported to be continuing, e.g., clear signs of fresh and repeated effects of moose in the stand were observed. No significant difference in these proportions was found between the 9th and the 10th NFI (data not shown).
3.2 The symptoms caused by moose
In this chapter we focused on moose damage in the 9th and 10th. Moose damage was recorded in 4469 of the 62 980 stands studied in the abovementioned two inventories. The majority of the symptoms caused by moose were injuries in the tree crowns. 41% of these were classified as ‘change of leader shoot, multiple leader shoots or other crown malformations’ and 30% as ‘broken or dead tops’. For damage symptom classification, please see Table 1. Symptoms ‘fallen or broken stems’, ‘stem injuries’ and ‘technical malformations in the stem’ were the next three most common types of damage (the proportion of each 6.6%–6.8% of the cases with moose damage). The occurrence of the symptoms varied according to the dominant species; for instance, more stem damage was found in deciduous trees (75% for aspen (Populus tremula L. ) and 40% for alders (Alnus sp., mostly grey alder, Alnus incana (L.) Moench) as compared with coniferous trees (4.9% for Scots pine and 7.6% for Norway spruce, Picea abies L. Karst.).
3.3 Moose damage and the silvicultural quality of the stands
The silvicultural quality (see Table 1) was worse than ‘good’ in 66.1% of the young stands (in 64 381 stands) in development classes 2–4. Damage due to any cause reduced the quality of these stands in 17.2% of the cases (in 39 241 stands). Moose damage was present in 8.3% of the stands (3279 stands) in which the silvicultural quality had decreased. The importance of moose damage for the stand quality increased as the stand quality decreased. The proportion of moose damage was 3.5% in the stands classified as ‘good’, 6.5% in the stands classified as ‘satisfactory’ and 9.3% in the stands classified as at least ‘adequate’. The proportion of moose damage in other quality classes than ‘good’ has increased also between the NFIs, from 3.0% in 8th NFI to 4.3% in 9th NFI, and to 9.0% in the 10th NFI.
3.4 The occurrence of moose damage in relation to NFI variables, descriptive analysis
In stands dominated by Scots pine, Norway spruce or birches moose damage was most common when stands were about 10 years old. However, in stands dominated by other tree species, especially aspen and alder species, damage was common also in older stands (Fig. 3). In those stands, symptoms like ‘stem damage’ were common (see above), which explains the divergence.
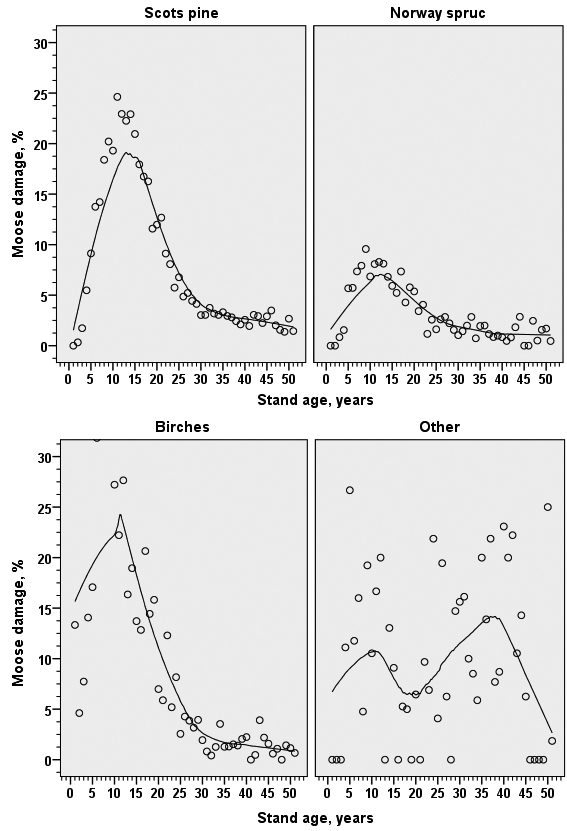
Fig. 3. The proportion of moose damage in young stands (development classes 2–4) related to stand age in stands dominated by different tree species. The line in produced with Loess-smoothing algorithm in IBM SPSS Statistics.
The proportion of stands with moose damage was different according to the main (dominating) tree species. In development classes 2–4, moose damage was most common in stands dominated by aspen (27%), yet the number of these stands was quite small (374 stands). A high proportion of stands with moose damage was observed in stands having admixtures of aspen – birches, aspen – Norway spruce and Scots pine – aspen, for instance (Table 3). The proportion of moose damage was 6.5% in Scots pine-dominated stands. The damage frequency was very low in the 607 stands dominated by alder species. According to Welch’s one-way anova, the means (proportions) of moose damage were statistically significantly different across categories of the main tree species (F = 112.418, df = 6, 649, p < 0.001). In pairwise comparisons, the proportion of damage was statistically significantly higher in aspen-dominated stands than in all the other categories, for instance. But the difference in the proportion of moose damage between, e.g., Scots pine- and birch-dominated stands was not statistically significant (adjusted significance = 0.2523). Pure Norway spruce stands had less damage (0.6%) than mixed stands dominated by spruce (4.2%) (Chi-Square = 171.939, p > 0.001). In birch-dominated stands, the difference between pure and mixed stands was not statistically significant (Chi-Square = 3.782, p = 0.052).
| Table 3. The proportion of moose damage in young stands (development classes 2–4) by main tree species and mixed species in the stand. Data: combined data of NFI8–NFI10 (1986–2008). N = number of plots, s.d. = standard deviation. | ||||
| Main tree species | Mixed species | Proportion of moose damage | N | s.d. |
| Scots pine | None | .0497 | 34795 | .217 |
| Norway spruce | .1054 | 10709 | .307 | |
| Birches | .0696 | 19926 | .254 | |
| Aspen | .1287 | 171 | .336 | |
| Alders | .0545 | 110 | .228 | |
| Rowan | .0769 | 13 | .277 | |
| Other | .0677 | 1581 | .251 | |
| Total | .0651 | 67305 | .247 | |
| Norway spruce | None | .0059 | 5726 | .077 |
| Scots pine | .0838 | 3698 | .277 | |
| Birches | .0238 | 7059 | .152 | |
| Aspen | .0645 | 248 | .246 | |
| Alders | .0071 | 421 | .084 | |
| Rowan | .0769 | 13 | .277 | |
| Other | .0198 | 605 | .140 | |
| Total | .0306 | 17770 | .172 | |
| Birches | None | .0893 | 3393 | .285 |
| Scots pine | .0618 | 3705 | .241 | |
| Norway spruce | .0640 | 2967 | .245 | |
| Aspen | .1240 | 242 | .330 | |
| Alders | .0261 | 230 | .160 | |
| Rowan | .1176 | 17 | .332 | |
| Other | .0407 | 491 | .198 | |
| Total | .0706 | 11045 | .256 | |
| Aspen | None | .1429 | 28 | .356 |
| Scots pine | .2963 | 54 | .461 | |
| Norway spruce | .2551 | 98 | .438 | |
| Birches | .3357 | 143 | .474 | |
| Alders | .1538 | 13 | .376 | |
| Rowan | .0000 | 2 | .000 | |
| Other | .1944 | 36 | .401 | |
| Total | .2727 | 374 | .446 | |
| Alders | None | .0082 | 122 | .091 |
| Scots pine | .0000 | 55 | .000 | |
| Norway spruce | .0000 | 107 | .000 | |
| Birches | .0222 | 180 | .148 | |
| Aspen | .0000 | 17 | .000 | |
| Rowan | .0000 | 15 | .000 | |
| Other | .0270 | 111 | .163 | |
| Total | .0132 | 607 | .114 | |
| Rowan | None | .0000 | 16 | .000 |
| Scots pine | .3333 | 3 | .577 | |
| Norway spruce | .0000 | 3 | .000 | |
| Birches | .2174 | 23 | .422 | |
| Aspen | .3333 | 3 | .577 | |
| Alders | .1667 | 6 | .408 | |
| Other | .1000 | 10 | .316 | |
| Total | .1406 | 64 | .350 | |
| Other | None | .0323 | 62 | .178 |
| Scots pine | .0909 | 44 | .291 | |
| Norway spruce | .0625 | 48 | .245 | |
| Birches | .0441 | 68 | .207 | |
| Alders | .0000 | 3 | .000 | |
| Total | .0533 | 225 | .225 | |
| All stands | None | .0469 | 44142 | .212 |
| Scots pine | .0741 | 7559 | .262 | |
| Norway spruce | .0967 | 13932 | .296 | |
| Birches | .0589 | 27399 | .236 | |
| Aspen | .1013 | 681 | .302 | |
| Alders | .0230 | 783 | .150 | |
| Rowan | .0667 | 60 | .252 | |
| Other | .0529 | 2834 | .224 | |
| Total | .0599 | 97390 | .237 | |
In Scots pine-dominated stands, the proportion of moose damage decreased linearly when the proportion of Scots pine increased (R2 linear = 0.956). In these stands, the damage also increased steeply linearly with the increase of the proportion of birches R2 linear = 0.898) or Norway spruce (R2 linear = 0.518) (Fig. 4). A high proportion of moose damage was observed in admixtures of aspen – birches, aspen – Norway spruce and Scots pine – aspen, for instance (Table 3).
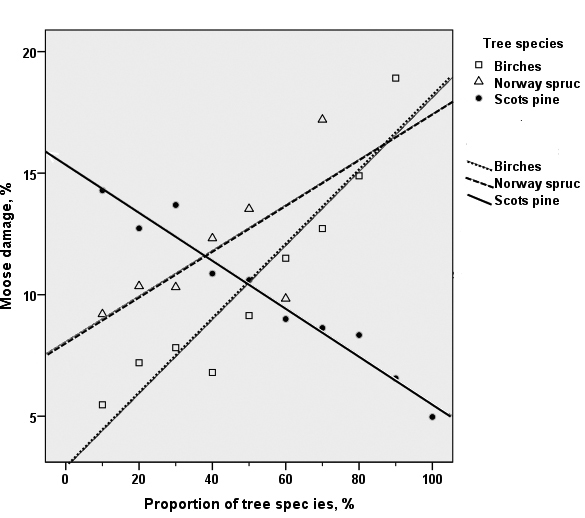
Fig. 4. The relationships between the proportion of moose damage and the proportion of tree species in young Scots pine dominated stands (development classes 2–4) in the combined data of the 8th–10th National Forest Inventories. The black dots and the solid line show the proportion of Scots pine. The open squares and the dashed line show the proportion of birch species, the open triangles and the dotted line show the proportion of Norway spruce (in Scots pine dominated stands).
Moose damage increased along with subsequent NFIs regardless of the dominant tree species (see Table 2). In pure pine, spruce and birch stands, the proportion of moose-damaged stands was about two times higher in the 10th than in the 8th NFI. However, for example, in the birch – spruce mixture stands the proportion of damage was 4 fold, and in the birch mixtures 3.5 fold in the 10th NFI as compared to the 8th NFI.
Less damage occurred in peatland stands (3.7%) than in stands on mineral soil (7.0%) (Table 4). The difference was most pronounced in stands dominated by aspen, rowan (Sorbus aucuparia L.) and other species and in birch-dominated stands. Moose damage also increased along with the time since drainage (F = 18.7557, df = 3, 5715, p < 0.001). In pairwise comparisons, the difference between undrained and recently drained peatland stands was not significant, but recently drained peatland stands had less damage (1.6%) than transforming or transformed drained peatland stands (4.1% and 3.6% respectively).
| Table 4. The occurrence of moose damage in relation to main site type (mineral soil/peatland, proposed thinning operation, accomplished soil preparation or artificial regeneration, according to the GLMM-model and raw data. Data: Stands in development classes 2–4. NFI8–NFI10, all tree species. The moose damage in the model columns were averaged over the levels of class variables, and the continuous variables were fixed in their mean values (for the variables, see Table 6). In the data columns, the p-value is based on the Fishers’s exact test. The odds ratios are also shown. The values in the data columns were computed from the actual plot numbers in a 2 × 2 table. | ||||||
| Variable | Value | Model | Data | |||
| Probalility of damage | p-value | Proportion of damage | p-value | Odds ratio | ||
| Peatland plot | No | 5.15 | <.0001 | 7.00 | <.0001 | 0.505 |
| Yes | 4.09 | 3.67 | ||||
| Thinning or clearing proposed | No | 3.77 | <.0001 | 4.04 | <.0001 | 3.386 |
| Yes | 5.58 | 12.47 | ||||
| Soil preparation accomblished | No | 4.17 | <.0001 | 4.69 | <.0001 | 3.273 |
| Yes | 5.07 | 13.87 | ||||
| Artificial regeration | No | 4.09 | <.0001 | 4.26 | <.0001 | 2.094 |
| Yes | 5.16 | 8,52 | ||||
In peatland stands, the means (proportions) of moose damage was almost the same (3.2%–3.9%) across site fertility classes (all tree species). In mineral soil plots the damage proportions were different (F = 42.6797, df = 5, 5049, p < 0.001), and the damage was most common in the least fertile, barren and poorer sites (all tree species). However, also mesic heath forest sites had much damage (Fig. 5). The results were almost the same, when the main tree species is in taken into account.
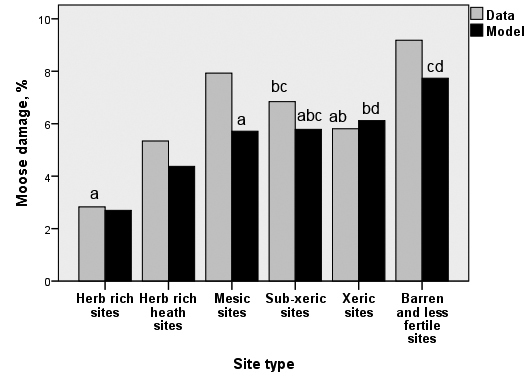
Fig. 5. The proportion of moose damage in raw data (column “Data”) and the predicted probability of damage by the GLMM model (column “Model”), by site types of the stand in mineral soils. Data: development classes 2–4 in the combined data of the 8th–10th National Forest Inventories. The moose damage in the model columns were averaged over the levels of class variables, and the continuous variables were fixed in their mean values (for the variables, see Table 6). The bars marked with the same letter (bar groups treated separately) do not differ in pairwise comparisons (95% confidence level).
Artificially regenerated stands had twice as much damage as naturally regenerated stands (Table 4). The difference was statistically significant in all stands, and in stands dominated by Scots pine, Norway spruce or birches, according to Fisher’s exact test. The difference was especially high in the stands dominated by birch species.
The proportion of moose-damaged stands was significantly higher in the stands in which soil preparation measures were accomplished, as compared to non-treated stands, according to Fisher’s exact test (Table 4). However, in stands dominated by tree species in the ‘other’ category (i.e. other than Scots pine, Norway spruce and birches) no significant differences were found. The difference in relative risks (expressed as column percentages) and in the odds ratio between treated and non-treated stands was especially high in stands dominated by birch species. In our data, 86% of the soil preparation operations comprised of harrowing, scarification, ploughing or mounding the site.
The proportion of moose damage was also higher in the stands in which clearing or thinning was proposed by the NFI team leader, as compared to the stands in which it was not proposed (Table 4).
3.5 The occurrence of moose damage in relation to NFI variables, analysis based on the GLMM-model
According to the GLMM, the residual variance was highest at the cluster level (1.171, standard deviation 1.082, n = 10882), next at the municipality (0,341, s.d. 0.584, n = 467) and Forest Center area level (0,149, s.d. 0.386, n = 14). Thus, the variation at the cluster level was 70% of the total variation. Because overdispersion was nonexistent (test value 0.566), the lowest (i.e., sample plot) level random effect was not included in the final model (Eq. 1).
The prediction by the GLMM model was very close to the observed proportion of moose damage in the whole data (5.9% model vs 6.0% data, see Tables 3 and 5). Despite the differences in the observed and predicted probabilities in categories of single predictors, the p-values computed from the data directly or with the GLMM-model showed similarly very significant differences between classes of the explanatory variables (Table 4).
| Table 5. Classification table (observed vs. predicted number of plots with or without moose damage). Model: generalized mixed linear (GLMM) model, estimated for the presence/absense of moose damage with the glmer function in lme4-package in R. Various measures for the success of the classification are also given. Data: NFI8–NFI10 (1986–2008), development classes 2–4. | |||
| Predicted | |||
| No | Yes | ||
| Observed | No | 70467 | 21087 |
| Yes | 543 | 5291 | |
| Sensitivity | 0.907 | ||
| Specificity | 0.770 | ||
| Correct classification rate | 0.778 | ||
| False positive | 0.230 | ||
| False negative | 0.093 | ||
| Positive predictive value | 0.200 | ||
| Negative predictive value | 0.992 | ||
| Area under the curve (AUC) | 0.920 | ||
Although the overall classification success was almost 78% and the AUC value was also quite good (0.920), it should be noted, that e.g. the proportion of false positive predictions was high (23%), and the positive predictive value rather poor (0.2) (Table 5).
The results of the fixed part of the model (Table 6) showed the effect of each explanatory variable to the relative risk, after taking the effect of other factors and the hierarchical structure of the data into account. The results supported the results of the descriptive analysis: The probability of moose damage increased when the site fertility decreased. The effect was not straightforward, however (Fig. 5). The probability of damage was higher in mineral soil than in peatland plots. The probability increased the most, when aspen was the main or the mixed tree species in a stand. For instance, the relative risk of moose damage in aspen-dominated stands was 17 times higher (e 2.848) than in pine-dominated stands (Table 6). Proposed thinning, artificial regeneration and soil preparation also increased the risk. The probability of moose damages decreased with increasing age and density (here the basal area) of the stand. The estimates of the fixed part of the model were significant (i.e. |>2|), except for alder, rowan and other species as main or mixed tree species of the stand.
| Table 6. Results of the generalized mixed linear model (GLMM), estimated for the presence/absense of moose damage with the glmer function in lme4-package in R. The fixed effects of the explanatory variables are shown. Data: NFI8– NFI10 (1986–2008), development classes 2–4, total N = 93390. | ||||
| Variable | Estimate | Std. Error | z-value | p-value |
| (Intercept) | –3.213e+00 | 1.979e–01 | –15.020 | < 0.001 |
| Stand mean age (years) | –1.832e–02 | 1.950e–03 | –9.394 | < 0.001 |
| Site type 2 1) | 5.017e–01 | 1.417e–01 | 3.539 | < 0.001 |
| Site type 3 1) | 7.831e–01 | 1.419e–01 | 5.519 | < 0.001 |
| Site type 4 1) | 7.960e–01 | 1.462e–01 | 5.443 | < 0.001 |
| Site type 5 1) | 8.556e–01 | 1.591e–01 | 5.378 | < 0.001 |
| Site type 6 1) | 1.108e+00 | 2.051e–01 | 5.401 | < 0.001 |
| Elevation of the plot (m) | 3.927e–04 | 2.954e–05 | 13.297 | < 0.001 |
| Stand basal area (m2/ha) | –9.158e–02 | 3.711e–03 | –24.680 | < 0.001 |
| Peatland (0/1) | –2.411e–01 | 6.045e–02 | –3.988 | < 0.001 |
| Thinning proposed (0/1) | 4.099e–01 | 3.620e–02 | 11.322 | < 0.001 |
| Artificial regeneration (0/1) | 2.427e–01 | 3.970e–02 | 6.114 | < 0.001 |
| Soil preparation accompished (0/1) | 2.053e–01 | 4.066e–02 | 5.048 | < 0.001 |
| Main tree species Norway spruce 2) | –1.224e+00 | 6.059e–02 | –20.203 | < 0.001 |
| Main tree species birches 2) | 1.597e–01 | 6.364e–02 | 2.510 | 0.012 |
| Main tree species aspen 2) | 2.848e+00 | 1.530e–01 | 18.613 | < 0.001 |
| Main tree species alder 2) | –8.108e–01 | 3.808e–01 | –2.129 | 0.033 |
| Main tree species rowan 2) | 3.891e–01 | 4.163e–01 | 0.935 | 0.349 |
| Main tree species other 2) | –8.537e–01 | 3.290e–01 | –2.594 | 0.009 |
| Mixed tree species Scots pine 3) | 3.881e–01 | 7.951e–02 | 4.881 | < 0.001 |
| Mixed tree species Norway spruce 3) | 4.332e–01 | 4.615e–02 | 9.387 | < 0.001 |
| Mixed tree species birches 3) | 2.648e–01 | 3.981e–02 | 6.651 | < 0.001 |
| Mixed tree species aspen 3) | 1.724e+00 | 1.533e–01 | 11.244 | < 0.001 |
| Mixed tree species alder 3) | –9.798e–02 | 2.624e–01 | –0.373 | 0.708 |
| Mixed tree species rowan 3) | –4.107e–01 | 5.885e–01 | –0.698 | 0.485 |
| Mixed tree species other 3) | 1.345e–01 | 1.034e–01 | 1.301 | 0.193 |
| 1) Compared with the most fertile site type 1 2) Compared with s stands with Scots pine as the main tree species 3) Compared with s stands without any mixed species | ||||
4 Discussion
This study qualifies as a comprehensive review of moose damage in Finland during the last decades. The general trend during our study period was the continuous increase in the amount and severity of damage. Tomppo and Joensuu (2003) found that the area of moose damage in young stands in southern Finland almost doubled between the 8th and 9th NFI. Also, Nevalainen and Korhonen (2007) reported the increase of moose damage during the first years of the 10th NFI.
The obvious reason for the increased moose damage seems to be the increase in moose population (Nygrén and Pesonen 1993; Lavsund et al. 2003). Hörnberg (2001) found a significant correlation between reported population changes and damage in young pine stands reported in NFI in Sweden. However, the moose population in Finland has varied considerably during the study period from the 1980s to the mid 2000 (Finnish Statistical Yearbook of Forestry 2014). The moose population started to decrease from the winter population of about 110 000 2–3 years before the launch of the 8th inventory and continued to decrease during the whole period of the 8th inventory. In 1994 the moose winter population was at the lowest level during the study period. The moose population started to grow again in the mid-1990s, i.e. a couple of years before the 9th inventory was launched, and reached the highest level ever recorded in Finland during the study period, about 140 000 moose in 2001 and 2002. During the 10th inventory (2004–2008), the moose population was decreasing again but the average population was at about the same level as in the 9th inventory, about 110 000 moose. Thus, at least at the level of the whole country, the connection between the moose population and the amount of damage is not straightforward.
There are several possible explanations for this. More than two thirds of the observed moose damage was more than five years old, and in most cases the damage was reported to be continuing (see Table 1). Thus, the high damage level during NFI10 (2004–2008) probably reflects the high population level during the previous years. Also, considerable uncertainties may exist in moose population estimates. A similar-sized population may cause different amounts of damage depending on the level of spatial clustering of the population. In winter, when most of the damage occurs, moose spend their winter in an area of about 2500 to 5000 ha. A more aggregated population causes more browsing pressure on local food items. On the other hand, the changes in the structure of forests may have an effect. The area of, e.g., Scots pine seedling stands decreased between the 8th and 10th NFI from 3.3 (Tomppo et al. 2001) to 2.4 million hectares (Korhonen et al. 2013).
NFIs as such are statistically representative samples of Finland’s forests. The weaknesses in the NFI data can be related to sampling error and detection error; in other words: i) spatial representativeness of field plots, ii) reliability of the field survey, including observers’ (in this case the team leader’s) abilities to identify the causes and iii) in some cases, the epidemic nature of the damage in question. As to the reliability of the field surveys, at least recent moose damage is easily recognizable in the field. It should be remembered, however, that a large proportion of all damage remains unidentified in the field survey (15% of all damage in our data). Therefore, it is obvious that the proportion of moose damage is underestimated in NFI. In older stands and older damage, the cause may remain unknown more often. Despite the large sample size, the NFI samples may be spatially too sparse, especially in northern Finland to detect aggregated local damage. Theoretically, one sample plot represented an area of less than 300 hectares in southernmost Finland, and more than 1000 hectares in northern Lapland. Furthermore, the NFIs before 2004 were regional inventories, i.e. the field work was carried out in different areas in each year, which makes the annual comparisons with, e.g., density of moose population more difficult. Despite the differences in the occurrence of moose damage, e.g., in the areas of Forest Centers (Fig. 2), the summed proportion of moose damage area was the same in South and North Finland (5.0% and 4.8% of the forest land area respectively) in the 10th NFI (Korhonen et al. 2013). ‘South Finland’ comprises, in this case, Forest Centers 0–10 and ’North Finland’ comprises centers 11–13 (see Fig. 1).
Our study was based on standwise damage assessments, and this poses some limitations to the interpretation of the results. For instance, the damaged tree species is not necessarily the dominant species of the stand. Furthermore, the moose damage may have changed the dominant species of the stand. If, e.g., pine seedlings have been seriously damaged, the stand may be registered as a birch-dominated stand or vice versa. This might partially explain our results about the increased damage in Scots pine stands with an increasing proportion of mixed tree species. However, the main conclusions are still valid, in our opinion. Our results are in line with some other studies that found a similar effect (Heikkilä 1990; Heikkilä and Härkönen 1993, 1996; Ball and Dahlgren 2002). Starting from the 11th NFI, damage is recorded for each species in the stand, which will help with the interpretation of NFI results in the future.
Many studies have indicated that more damage may occur on more fertile sites (Heikkilä 1990; Heikkilä and Härkönen 1993; Jalkanen 2001). The results of this study do not show a clear relationship between site fertility class and the risk of moose damage. Instead, the GLM-model showed a decrease in the damage probability with increasing site fertility. These discrepancies may be partially explained by the size and type of the data, by tree species considered and by different ways of recording the damage. In the stand-wise assessments of our study, only clearly recognizable damage was recorded. Also, the very large sample over the whole country can mean a large variation in the bedrock composition and, thus, the fertility of the soil within the very same site-fertility classes in different parts of the country. Moreover, the tree species composition changes according to site fertility class: on the most fertile sites, the proportion of less palatable tree species (Norway spruce and alders) is the highest, while the proportion of Scots pine-dominated stands increases with the decreasing site fertility class. The results concerning the main tree species are, as such, in good agreement with earlier palatability studies (Hörnberg 2001; Månsson et al. 2007).
Moose damage occurred less in pure pine stands. Admixture of broadleaved species, especially aspen, increased the proportion of damaged stands in this study. This is also in line with several earlier studies. Browsing of pine was common in the patches with high densities of aspen and rowan, the preferred and highly utilized deciduous tree species (Heikkilä and Härkönen 1996). High amounts of bush, especially aspen, increased damage to pine (Heikkilä 1990). Jalkanen et al. (2005) also found more moose damage in pine stands with more sprouts. Jalkanen (2001) found that moose preferred aspen stands and the occurrence of aspen was closely connected to the occurrence of moose damage in pine sapling stands. Pine stem breakage was higher when birch occurred as overgrowth above pine and with high birch densities (Heikkilä and Härkönen 1993). The number of planted pines and deciduous trees overtopping the pines were the most important predictors of an increase in browsing probability (Nikula et al. 2008). Also Härkönen et al. (2008) and Bergqvist et al. (2014) have found that the number of damaged pines increases with higher numbers of overtopping broadleaved trees and taller broadleaved trees.
Cleaning of birches has reduced damage to pine trees in several studies (Bergqvist et al. 2001; McLaren et al. 2000; Karlsson et al. 2002; Härkönen et al. 2008). Cleaned stands may be less attractive, but, on the other hand, cleaning may increase the browsing pressure and damage severity to conifer species (Heikkilä and Mikkonen 1992; Lyly and Saksa 1992; McLaren et al. 2000).
Accomplished soil preparation measures, as well the need for thinning or cleaning of the stand increased the proportion of damaged stands. Also, Nikula et al. (2008) found that heavy soil scarification, such as ploughing or mounding, increased the browsing probability. Soil preparation was done much more frequently (in 18–20% of the cases) in richer sites compared to barren and less fertile sites (2.4%) in mineral soils in this study, but this could not alter the prevalence of moose damage on the less fertile sites. However, the combined effect of site type and soil preparation measures could also explain the divergence between the results using raw data or the GLMM model (Table 4).
Artificially regenerated stands had more damage than naturally regenerated stands in our study. This result is supported by some studies, e.g., by Jalkanen et al. 2005 in northern Finland, although the results concerning this point are very scarce.
The effects of some relevant variables (e.g. tree size) were not included in the presented results. Partly this was because they were not common variables in all three inventories, or because, for example, the mean height of growing stock gave no further information when the stand age was included in the GLMM-model.
In field surveys, as compared to experimental studies, many factors affect simultaneously and are often intercorrelated. Although the effect of a factor can be tested, it is in no way an indicator of a cause-effect relationship, and one must be cautious when drawing conclusions. The p-values in these single-variable tests computed directly from the data (in the descriptive analysis in Table 4) were too optimistic, because the hierarchical structure of the data and the effect of other confounding variables was not taken into account. Despite of this, the p-values (Table 4) according the to raw data and the GLMM-model were similar. In GLMMs, the effect of a factor can be tested after taking the effect of other factors into account. In addition, the random effects in GLMM take into account the dependency of sample plots caused by different sampling levels. The GLMM produced a reasonable fit. The high proportion of false positive predictions reflect also the structure of the data (low number positive cases, i.e, diseased stands). The prediction success is dependent on the threshold (cutoff value), too. Here we used the mean of the predicted values as the cutoff value. As no cutoff is optimal according to all possible performance criteria, the cutoff choice involves a trade-off among different measures. Partly this problem was overcome by using receiver operating characteristic (ROC curves), i.e., by plotting the true positive rate against the false positive rate at various threshold settings. However, the predictions for the categories of a single explanatory variable may differ from the observed proportion, because of the unbalanced structure of the inventory data (very few cases with damage) or due to the poor explanatory power of the variable in question, for instance (Table 4). The model did work well as an explanatory model, i.e., it showed the magnitude and the direction of the effect of a variable (when the random factors and the impact of other variables were taken into account), but it was not suitable for accurate predictions.
In forest and wildlife management, browsing by moose in young stands should be taken into account. It is most important to identify the conditions in which damage, overconsumption and possible long-term effects on forest ecosystems take place (Heikkilä and Härkönen 1996).
Our study was able to show the temporal and spatial increase in the occurrence of moose damage and to pinpoint some important silvicultural factors that affect the relative risk of young stands to damage. However, an analysis between moose population density and damage is still needed. Most of the variation in GLMM results was at the cluster, i.e., at the landscape level. The properties of the landscape, i.e. areas surrounding the stands, may significantly affect the suitability of the area for moose. These include tree species distribution, tree age distribution, size of adjacent areas, proportion of agricultural land, proportion of peatland, topography, density of roads, amount of human influence, and snow depth, for instance. Many of these factors could be further studied utilizing the data from the multi-source inventory of Finland (e.g., Tomppo 1996).
Acknowledgements
The study would not have been possible without the devoted work of the NFI field teams. We are also grateful to Dr. Ville Hallikainen, Mr. Jaakko Heinonen, Dr. Jari Miina and Dr. Seija Sirkiä for statistical advice, and Scribendi Inc, Canada, for checking the language.
References
Ball J.P., Dahlgren J. (2002). Browsing damage on pine (P. sylvestris and P. contorta) by a migrating moose (Alces alces) population in winter: relation to habitat composition and road barriers. Scandinavian Journal of Forest Research 17: 427–435. http://dx.doi.org/10.1080/028275802320435441.
Ball J.P., Danell K., Sunesson P. (2000). Response of a herbivore community to increased food quality and quantity: an experiment with nitrogen fertilizer in a boreal forest. Journal of Applied Ecology 37: 247–255. http://dx.doi.org/10.1046/j.1365-2664.2000.00487.x.
Bates D, Maechler M, Bolker B and Walker S (2015). lme4: linear mixed-effects models using Eigen and S4. R package version 1.1–9. https://CRAN.R-project.org/package=lme4.
Bergqvist G., Bergström R., Edenius L. (2001). Patterns of stem damage by moose (Alces alces) in young stands of Pinus sylvestris. Scandinavian Journal of Forest Research 16: 363–370. http://dx.doi.org/10.1080/02827580119307.
Bergqvist G., Bergström R., Edenius L. (2003). Effects of moose (Alces alces) rebrowsing on damage development in young stands of Scots pine (Pinus sylvestris). Forest Ecology and Management 176(1–3): 397–403. http://dx.doi.org/10.1016/S0378-1127(02)00288-8.
Bergqvist G., Bergström R., Wallgren M. (2013). Summer browsing by moose on Scots pine. Scandinavian Journal of Forest Research 28(2): 110–116. http://dx.doi.org/10.1080/02827581.2012.725767.
Bergqvist G., Bergström R., Wallgren M. (2014). Recent browsing damage by moose on Scots pine, birch and aspen in young commercial forests – effects of forage availability, moose population density and site productivity. Silva Fennica 48(1) article 1077. http://dx.doi.org/10.14214/sf.1077.
Bryant J.P., Chapin F.S. III, Klein D.R. (1983). Carbon/nutrient balance of boreal plants in relation to vertebrate herbivory. Oikos 40: 357–368. http://dx.doi.org/10.2307/3544308.
Cederlund G., Bergström R. (1996). Trends in the moose-forest system in Fennoscandia with special reference to Sweden. In: DeGraaf R.M., Miller R.I. (eds.). Conservation of faunal diversity in forested landscapes. Chapman and Hall, New York. p. 265–281. http://dx.doi.org/10.1007/978-94-009-1521-3_10.
Cochran W.G. (1977). Sampling Techniques. Third ed. Wiley. 448 p.
Edenius L., Bergman M., Ericsson G., Danell K. (2002). The role of moose as a disturbance factor in managed boreal forests. Silva Fennica 36(1): 57–67. http://dx.doi.org/10.14214/sf.550.
Finnish Statistical Yearbook of Forestry (2014). [Metsätilastollinen vuosikirja 2014]. Finnish Forest Research Institute. [Metsäntutkimuslaitos]. 428 p. http://www.metla.fi/metinfo/tilasto/julkaisut/vsk/2014/index.html.
Goldstein H. (2003). Multilevel statistical models. Kendall’s Library of Statistics 3. 3rd edition. Arnold, London. 256 p.
Härkönen S., Miina J., Saksa T. (2008). Effect of cleaning methods in mixed pine-deciduous stands on moose damage to Scots pines in southern Finland. Scandinavian Journal of Forest Research 23: 491–500. http://dx.doi.org/10.1080/02827580802491371.
Haukioja E., Kapiainen K., Niemelä P., Tuomi J. (1983). Plant availability hypothesis and other explanations of herbivore cycles: complementary or exclusive alternatives? Oikos 40: 419–432. http://dx.doi.org/10.2307/3544314.
Heikkilä R. (1990). Effect of plantation characteristics on moose browsing on Scots pine. Silva Fennica 24(4): 341–351. http://dx.doi.org/10.14214/sf.a15588.
Heikkilä R., Härkönen S. (1993). Moose (Alces alces L.) browsing in young Scots pine stands in relation to the characteristics of their winter habitats. Silva Fennica 27(2): 127–143. http://dx.doi.org/10.14214/sf.a15667.
Heikkilä R., Härkönen S. (1996). Moose browsing in young Scots pine stands in relation to forest management. Forest Ecology and Management 88(1–2): 179–186. http://dx.doi.org/10.1016/S0378-1127(96)03823-6.
Heikkilä R., Löyttyniemi K. (1992). Growth response of young Scots pines to artificial stem breakage simulating moose damage. Silva Fennica 26(1): 19–26. http://dx.doi.org/10.14214/sf.a15627.
Heikkilä R., Mikkonen (1992). Effects of density of young Scots pine stand on moose (Alces alces) browsing. Acta Forestalia Fennica 231. 14 p.
Helle T., Pajuoja H., Nygrén K. (1987). Forest damage caused by moose and their economic value in Finland. Scandinavian Forest Economics 29: 7–26.
Hörnberg S. (2001). Changes in population density of moose (Alces alces) and damage to forests in Sweden. Forest Ecology and Management 149: 141–151. http://dx.doi.org/10.1016/S0378-1127(00)00551-X.
Jalkanen A. (2001). The probability of moose damage at the stand level in southern Finland. Silva Fennica 35(2): 159–168. http://dx.doi.org/10.14214/sf.593.
Jalkanen R., Aalto T., Hallikainen V., Hyppönen M., Mäkitalo K. (2005). Viljelytaimikoiden hirvituhot Lapissa ja Kuusamossa. Metsätieteen aikakauskirja 4/2005: 399–411. [In Finnish].
Karlsson A., Albrektson A., Elfving B., Fries C. (2002). Development of Pinus sylvestris main stems following three different precommercial thinning methods in a mixed stand. Scandinavian Journal of Forest Research 17: 256–262. http://dx.doi.org/10.1080/028275802753742927.
Korhonen K.T., Ihalainen A., Viiri H., Heikkinen J., Henttonen H.M., Hotanen J.-P., Mäkelä H., Nevalainen S., Pitkänen J. (2013). Suomen metsät 2004–2008 ja niiden kehitys 1921–2008. Metsätieteen aikakauskirja 3/2013: 269–608. [In Finnish].
Korner-Nievergelt F., Roth T., Felten Sv., Guelat J., Almasi. B., Korner-Nievergelt P. (2015). Bayesian data analysis in ecology using linear models with R, BUGS and Stan. Elsevier. 328 p.
Lavsund S. (1987). Moose relationships to forestry in Finland, Norway and Sweden. Swedish Wildlife Research, Supplement 1: 229–244.
Lavsund S., Nygrén T., Solberg E.J. (2003). Status of moose populations and challenges to moose management in Fennoscandia. Alces 39: 109–130.
Lenth R.V. (2015). lsmeans: Least-Squares Means. R package version 2.21. http://CRAN.R-project.org/package=lsmean.
Liaw A., Wiener M. (2002). Classification and regression by randomForest. R News 2(3): 18–22.
Löyttyniemi K. (1982). Männyntaimikoiden hirvivahingot 1950-luvun alussa. Summary: moose (Alces alces) damage in young pine stands in Finland at the beginning of the 1950s. Folia Forestalia 503: 1–8.
Löyttyniemi K., Hiltunen R. (1978). Monoterpenes in Scots pine in relation to browsing preference by moose (Alces alces L.). Silva Fennica 12(2): 85−87. http://dx.doi.org/10.14214/sf.a14846.
Lyly O., Saksa T. (1992). The effect of stand density on moose damage in young Pinus sylvestris stands. Scandinavian Journal of Forest Research 7(1–4): 393–403. http://dx.doi.org/10.1080/02827589209382732.
Markgren G. (1974). The moose in Fennoscandia. Le Naturaliste Canadien 101: 185–194.
Matthew K. Lau (2013). DTK: Dunnett-Tukey-Kramer pairwise multiple comparison test adjusted for unequal variances and unequal sample sizes. R package version 3.5. http://CRAN.R-project.org/package=DTK.
Mattsson L. (1990). Moose management and the economic value of hunting: towards bioeconomic analysis. Scandinavian Journal of Forest Research 5(1–4): 575–581. http://dx.doi.org/10.1080/02827589009382640.
McInnes P.F., Naiman R.J., Pastor J., Cohen Y. (1992). Effects of moose browsing on vegetation and litter of the boreal forest, Isle Royale, Michigan, USA. Ecology 73(6): 2059–2075. http://dx.doi.org/10.2307/1941455.
McLaren B.E., Mahoney S.P., Porter T.S., Oosenbrug S.M. (2000). Spatial and temporal patterns of use by moose of pre-commercially thinned, naturally-regenerating stands of balsam fir in central Newfoundland. Forest Ecology and Management 133(3): 179–196. http://dx.doi.org/10.1016/S0378-1127(99)00223-6.
Milligan H.T., Koricheva J. (2013). Effects of tree species richness and composition on moose winter browsing damage and foraging selectivity: an experimental study. Journal of Animal Ecology 82: 739–748. http://dx.doi.org/10.1111/1365-2656.12049.
Månsson J. (2009). Environmental variation and moose Alces alces density as determinants of spatio-temporal heterogeneity in browsing. Ecography 32: 601–612. http://dx.doi.org/10.1111/j.1600-0587.2009.05713.x.
Månsson J., Kalén C., Kjellander P., Andrén H., Smith H.(2007). Quantitative estimates of tree species selectivity by moose (Alces alces) in a forest landscape. Scandinavian Journal of Forest Research 22: 407–414. http://dx.doi.org/10.1080/02827580701515023.
Nevalainen S., Korhonen K.T. (2007). Forest damage observed in the 10th National Forest Inventory of Finland during 2004–2005. In: Merilä P., Kilponen T., Derome J. (eds.). Forest condition monitoring in Finland - National report 2002–2005. Working Papers of the Finnish Forest Research Institute 45. p. 136–146.
Niemelä P., Chapin F.S., III, Danell K., Bryant J.P. (2001). Herbivory-mediated responses of selected boreal forests to climatic change. Climatic Change 48(2–3): 427–440. http://dx.doi.org/10.1023/A:1010787714349.
Nikula A., Hallikainen V., Jalkanen R., Hyppönen M., Mäkitalo K. (2008). Modelling the factors predisposing Scots pine to moose damage in artificially regenerated sapling stands in Finnish Lapland. Silva Fennica 42(4): 587–603. http://dx.doi.org/10.14214/sf.235.
Nygrén T., Pesonen M. (1993). The moose population (Alces alces L.) and methods of moose management in Finland, 1975–89. Finnish Game Research 48: 46–53.
R Core Team (2015). R: a language and environment for statistical computing. R Foundation for Statistical Computing, Vienna, Austria. https://www.R-project.org/.
Robin X., Turck N., Hainard A., Tiberti N., Lisacek F., Sanchez J., Müller M. (2011). pROC: an open-source package for R and S+ to analyze and compare ROC curves. BMC Bioinformatics 2011(2): 77. http://dx.doi.org/10.1186/1471-2105-12-77.
Therneau T., Atkinson B., Ripley B. (2015). rpart: Recursive Partitioning and Regression Trees. R package version 4.1–10. http://CRAN.R-project.org/package=rpart.
Tomppo E. (1996). Multi-source National Forest Inventory of Finland. In: Päivinen R., Vanclay J., Miina S. (eds.). New thrusts in forest inventory. Proceedings of the Subject Group S4.02-00 ‘Forest resource inventory and monitoring’ and Subject Group S4.12-00 ‘Remote sensing technology’. Volume I. IUFRO XX World Congress, 6–12 August 1995, Tampere, Finland. EFI, EFI Proceedings 7: 27–41.
Tomppo E., Henttonen H.,Tuomainen T. (2001). Valtakunnan metsien 8. inventoinnin menetelmä ja tulokset metsäkeskuksittain Pohjois-Suomessa 1992–94 sekä tulokset Etelä-Suomessa 1986–92 ja koko maassa 1986–94. Metsätieteen Aikakausikrja 1B/2001: 99–248. [In Finnish].
Tomppo E., Joensuu J. (2003). Hirvieläinten aiheuttamat metsätuhot Etelä-Suomessa Valtakunnan metsien 8. ja 9. inventoinnin mukaan. Metsätieteen aikakauskirja 4: 507–535. [In Finnish].
Tomppo E., Heikkinen J., Henttonen H.M., Ihalainen A., Katila M., Mäkelä H., Tuomainen T., Vainikainen N. (2011). Designing and conducting a forest inventory - case: 9th National Forest Inventory of Finland. Springer Series Managing Forest Ecosystems Volume 21, Springer Verlag. 272 p. http://dx.doi.org/10.1007/978-94-007-1652-0.
Vehviläinen H., Koricheva J. (2006). Moose and vole browsing patterns in experimentally assembled pure and mixed forest stands. Ecography 29(4): 497–506. http://dx.doi.org/10.1111/j.0906-7590.2006.04457.x.
Total of 54 references.
