Francesco Chianucci 
A note on estimating canopy cover from digital cover and hemispherical photography
Chianucci F. (2015). A note on estimating canopy cover from digital cover and hemispherical photography. Silva Fennica vol. 50 no. 1 article id 1518. https://doi.org/10.14214/sf.1518
Highlights
- Comparison of fisheye (DHP) and cover (DCP) photography for estimating canopy cover
- Digital photographic estimates validated against artificial images with known cover
- Accuracy of cover estimates from DHP is influenced by mean gap size and actual cover
- Accuracy of cover estimates from DCP is not influenced by mean gap size and actual cover.
Abstract
Fast and accurate estimates of canopy cover are central for a wide range of forestry studies. As direct measurements are impractical, indirect optical methods have often been used in forestry to estimate canopy cover. In this paper the accuracy of canopy cover estimates from two widely used canopy photographic methods, hemispherical photography (DHP) and cover photography (DCP) was evaluated. Canopy cover was approximated in DHP as the complement of gap fraction data at narrow viewing zenith angle range (0°–15°), which was comparable with that of DCP. The methodology was tested using artificial images with known canopy cover; this allowed exploring the influence of actual canopy cover and mean gap size on canopy cover estimation from photography. DCP provided robust estimates of canopy cover, whose accuracy was not influenced by variation in actual canopy cover and mean gap size, based on comparison with artificial images; by contrast, the accuracy of cover estimates from DHP was influenced by both actual canopy cover and mean gap size, because of the lower ability of DHP to detect small gaps within crown. The results were replicated in both DHP and DCP images collected in real forest canopies. Finally, the influence of canopy cover on foliage clumping index and leaf area index was evaluated using a theoretical gap fraction model. The main findings indicate that DCP can overcome the limits of indirect techniques for obtaining unbiased and precise estimates of canopy cover, which are comparable to those obtainable from direct, more labour-intensive techniques, being therefore highly suitable for routine monitoring and inventory purposes.
Keywords
forest canopy;
foliage cover;
crown cover;
fisheye photography;
cover photography
-
Chianucci,
Consiglio per la Ricerca in Agricoltura e l’Analisi dell’Economia Agraria – Forestry Research Centre, viale Santa Margherita 80, 52100 Arezzo, Italy
 http://orcid.org/0000-0002-5688-2060
E-mail
fchianucci@gmail.com
http://orcid.org/0000-0002-5688-2060
E-mail
fchianucci@gmail.com
Received 4 November 2015 Accepted 7 December 2015 Published 15 December 2015
Views 102117
Available at https://doi.org/10.14214/sf.1518 | Download PDF

1 Introduction
Canopy cover is a commonly used variable in forestry (Jennings 1999; Rautiainen et al. 2005). This variable is strongly required for accurate modelling of leaf area index L using radiative transfer theory (Majasalmi et al. 2014; Nilson 1999; Nilson and Kuusk 2004). In addition, canopy cover is a major determinant of forest reflectance from optical remote sensing data (Dawson et al. 1999). It is also often included in national forest inventories (Angelini et al. 2015). Accordingly, accurate in situ estimates of canopy cover are central for a wide range of forestry studies.
As direct measurements are impractical and time-consuming, canopy cover was often estimated from optical instruments using a restricted zenith angle range (typically about 0°–15°). Although the approach is somewhat incorrect, in that measurements are not strictly vertical, use of narrow-angle of view is often considered due to its simplicity. For example, the widely used hemispherical sensors such as LAI-2000 Plant Canopy Analyzer (Li-COR, Lincoln, NE, USA) or digital hemispherical photography (also called fisheye photography; DHP) have been frequently employed to obtain an estimate of canopy cover from gap fraction data at narrow viewing zenith angle range (Korhonen et al. 2006; Kucharik et al. 1999; Rautiainen et al. 2005; Seed and King 2003). However, the gap fraction readings obtained at this view were typically noisy in hemispherical sensors, because of limited spatial sampling at this view. While some studies have proposed correction for insufficient sampling using these instruments (e.g., Nilson and Kuusk 2004), Macfarlane et al. (2007) recently proposed digital cover photography (DCP), a restricted-view angle method. The authors used a 70 mm equivalent-focal-length to obtain very fine spatial resolution at an approximately 30° field of view (FOV), which was comparable with the FOV of the uppermost ring of LAI-2000. The resulting combination of high resolution and mainly vertical sampling in DCP allowed to separate total gap fraction into large, between-crowns gaps and small, within-crown gaps, leading to distinct estimates of canopy cover (crown cover and foliage cover; Macfarlane et al. 2007, but see also section 2.1). However, although some studies speculated that DCP can yield more accurate estimate of canopy cover than DHP (Pekin and Macfarlane 2009; Ryu et al. 2010), owing mainly to its higher zenithal resolution, no previous studies have evaluated the accuracy of cover estimates from both these methods compared with known reference canopy cover data.
The objective of this study was testing the accuracy of digital canopy photography for estimating forest canopy cover. For the purpose, estimates obtained from cover and hemispherical photography were compared with those obtained from an artificial target with known canopy cover; this allowed exploring the influence of actual canopy cover and mean gap size on canopy cover estimation from digital photography. Results from both photographic methods were also compared in real forest canopies. Finally, the impact of canopy cover on modelling canopy attributes like clumping index and leaf area index was illustrated using a theoretical gap fraction model (Nilson 1999).
2 Material and methods
2.1 Definition of canopy cover
Canopy cover is frequently defined as the average proportion of ground surface covered by the vertical projection of tree crowns (Jennings et al. 1999). However, two distinct variables can be defined depending on whether gaps inside crown envelopes were considered or not. Traditional measures of canopy cover consider crowns as non-transparent envelopes, i.e. considering within-crowns gaps as part of the canopy; this is equivalent to the definition of crown cover by Macfarlane et al. (2007). Conversely, foliage cover is defined as the complement of total gap fraction, taking into account both within- and between-crowns gaps. For the remainder of the study, canopy cover and crown cover are used as synonym, while foliage cover is explicitly mentioned to distinguish from the traditional definition of cover.
2.2 Artificial canopy cover measurements
The idea of measuring an artificial target to validate optical methods has been recently proposed by Song et al. (2014) and Macfarlane et al. (2014). In this study reference canopy cover measurements were obtained by generating artificial canopy images with known canopy cover. An R routine (R Core Development Team, Vienna) was used to randomly filling blank 210 × 210mm images with black-circles (simulating a dark canopy) with a radius of 3 mm each. Twenty scenes were generated corresponding to an artificial (known) canopy cover ranging from 0.12 to 0.90, which represents a realistic range of canopy cover in natural forest stands. Images were then printed and placed in a levelled surface. Cover and hemispherical images were then acquired in overcast sky conditions by orienting the camera perpendicular to the surface. The widely used canopy digital camera Nikon Coolpix 4500, either with or without the fisheye lens, was placed at a distance to represent the standard at the centre of the image within a FOV of about 30°. Hemispherical images were acquired with the camera equipped with a FC-E8 fisheye lens converter set to F1 (equivalent focal length 38 mm), aperture-priority mode (A), minimum aperture (F 5.3), one-stop underexposure, as recommended by Macfarlane et al. (2014) to improve contrast in images, and center-weighted exposure metering. Cover images were acquired with the fixed lens set to F2 (equivalent focal length of 70 mm), aperture-priority mode (A), minimum aperture (F 9.6), one-stop underexposure and matrix exposure metering. Lens vignetting was assumed negligible in both camera setups (Lang et al. 2010). The images were cropped to fit the standard’s extent. The blue channel of each image was classified using a single binary thresholding (Ridler and Calvard 1978) from the ‘rtiff’ package in R (R Core Development Team, Vienna). Canopy cover was then estimated as the ratio of black pixels over total pixels.
To evaluate the influence of gap size on canopy cover measurements, eight images were further generated by applying a checkerboard pattern (canopy cover of 0.5) with arbitrarily varying checkerboard size (simulating gap size) from 0.02% to 0.2% of the image area (side width from 3 to 30 mm). The images were then printed and acquired using the same protocol above.
2.3 Actual canopy measurements
Fisheye and cover images were acquired under overcast sky conditions in ten 0.5–1 ha deciduous stands in Central Italy (main species Fagus sylvatica L., Quercus cerris L., Castanea sativa Mill.) that had a canopy cover ranging from medium to moderately dense. The data were collected from three forests sites which were sampled in 2011 and 2012 in a previous study (Chianucci et al. 2015).
Depending on plot size, 9–15 fisheye and cover images were acquired in each plot with the Nikon Coolpix 4500 along a grid of sample points. Camera settings and image classification were as described above, with the exception that the gamma function was set to 1.0 (Chianucci and Cutini 2013). Canopy cover in DHP was calculated at the complement of gap fraction estimated at 0°–15° zenith angle range.
Once classified, DCP images were analyzed using Winscanopy 2012a (Regent Instruments, Ste-Foy, Quebec, Canada). Two canopy cover estimates were obtained using a gap-size distribution approach; gaps larger than 0.3% of the image area were classified as between-crowns gaps; the gap area threshold was set based on a previous study (Chianucci et al. 2014). Consistently with the terminology of Macfarlane et al. (2007), crown cover was estimated as the fraction of pixels that do not lie in between-crowns gaps and foliage cover was estimated as the complement of total gap fraction.
2.4 Gap fraction model
The impact of canopy cover on leaf area index and clumping index retrieval was evaluated using the gap fraction model of Nilson (1999) and gap fraction data estimated from LAI-2000 Plant Canopy Analyzer. The model determines gap fraction as follows:
where

and

where N is tree density (trees m–2), S( θ ) is the area of projection of the average tree crown envelope at the zenith angle θ, c( θ ) is an auxiliary parameter which corrects the mean crown coverage, P1( θ ) the gap fraction within a single crown, G( θ ) is the foliage projection function, L is the leaf area index, BAI is the branch area index, GI is the Fisher’s grouping index of tree distribution pattern. The model estimates clumping index (Ω, Eq. 4) and leaf area (L, Eq. 5) as:

and

where κ is the shoot-level clumping index and α is the branch area to leaf area ratio. To apply the formulas, in addition to the estimated value of P( θ ), the model requires input parameters including stand density, tree height, crown depth, shoot-level clumping, foliage projection function and canopy cover. The model was run in the birch (Betula pendula Roth) stand in Järvselja, Estonia, belonging to the RAMI (Radiation transfer Model Intercomparison) test sites, which have been widely used to benchmarking radiative transfer modelling (e.g. Kuusk et al. 2009; Pisek et al. 2011). All the input parameters (including canopy cover) were obtained from the works by Kuusk et al. (2009) and Nilson et al. (2011); the input canopy cover was then varied to evaluate the influence of these attributes on L and Ω, the other input parameters held constant. As canopy cover directly influences the grouping index (GI), the input canopy cover was varied within a range suitable to allow the theoretical formulas to give reliable results, i.e., where GI(S(0)) < 1.
3 Results
Both photographic methods provided accurate estimates of canopy cover, which significantly agreed with those obtained from artificial images with known canopy cover (Pearson’s r-test, p < 0.01). Nonetheless, the two methods showed different performance depending on actual canopy cover (Fig. 1a) and mean gap size (Fig. 1b). DHP showed a larger tendency to underestimate canopy cover, in particular in medium-dense canopies (Fig. 1a); in addition, DHP showed an increasing tendency to underestimate canopy cover with decreasing gap size (Fig. 1b). Closer inspection of artificial chessboard-patterned images revealed that DHP possessed more mixed pixels (Fig. 2), being highly sensitive to gap fragmentation, because mixed pixels are located mainly on the canopy-sky edges. This effect, in turn, have a strong impact on pixel classification since fragmented canopy images are more prone to be misclassified into sky or canopy during thresholding (Fig. 1). Conversely, DCP possessed very few mixed pixels (Fig. 2), and showed lower variations in estimated cover associated with actual canopy cover (Fig. 1a) and mean gap size (Fig. 1b).
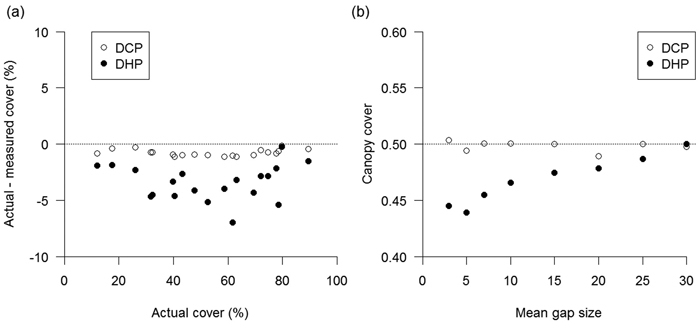
Fig. 1. a) Difference between the actual and measured canopy cover calculated from artificial canopy images with known canopy cover using digital hemispherical (DHP) and cover (DCP) photography; b) Variation of canopy cover with mean gap size calculated from artificial checkerboard-patterned canopy images using digital hemispherical (DHP) and cover (DCP) photography. Mean gap size ranges from 0.02% (3 mm) to 0.2% (30 mm) of the artificial canopy image area.
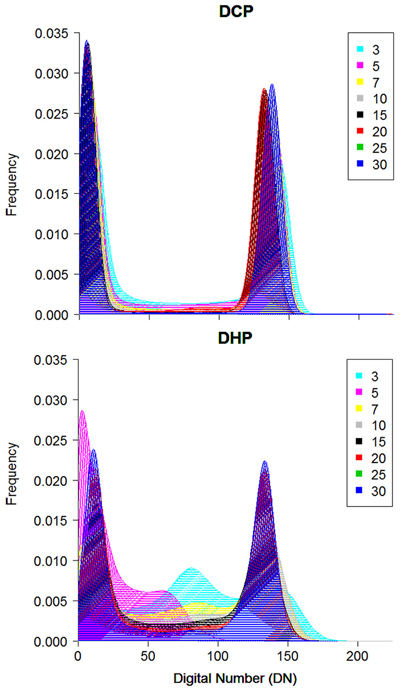
Fig. 2. Histograms of DCP (top) and DHP (bottom) images of artificial checkerboard-patterned canopy images with different mean gap size. The color classes in legend indicates different mean gap size ranging from 0.02% (3 mm, navy) to 0.2% (30 mm, blue) of the artificial canopy image area. View larger in new window/tab.
Comparisons of both photographic methods applied in real forest canopies were in agreement with results obtained from artificial images; DHP yielded larger canopy cover estimates compared with foliage cover estimated from DCP, indicating that many small gaps (i.e., within-crown gaps) were either classified as foliage during thresholding or were not detected at all in DHP, because of the lower zenithal resolution of fisheye images (Fig. 3). A better agreement was observed between canopy cover from DHP and crown cover in DCP (Fig. 3), because large between-crowns gap were more-easily identified in fisheye images.
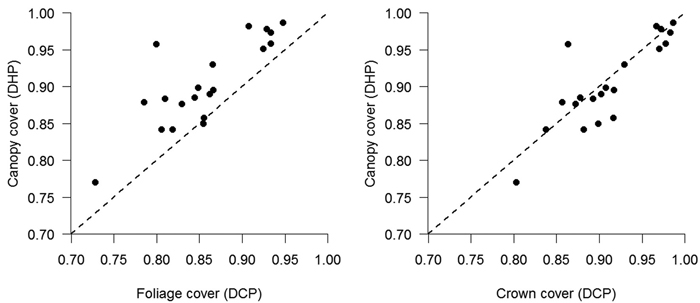
Fig. 3. Canopy cover from hemispherical photography (y-axis) vs either foliage cover (left) or crown cover (right) calculated from cover photography (x-axis) in studied stands in Italy. The dashed line indicates the 1:1 relationship.
A theoretical gap fraction model (Nilson, 1999) indicated that canopy cover was inversely correlated with the grouping index (Pearson’s r-test p < 0.05) and therefore with the foliage clumping index, the sparser canopies exhibiting more clumped distribution of foliage and the denser canopies exhibiting more randomly distributed foliage (Fig. 4). In addition, canopy cover was strongly correlated with leaf area index inverted from gap fraction data – the higher the canopy cover, the smaller the respective inverted leaf area index value. In our simulation increasing canopy cover from 0.65 to 0.95 decreased the estimated leaf area index by values ranging from 24% to 51%.
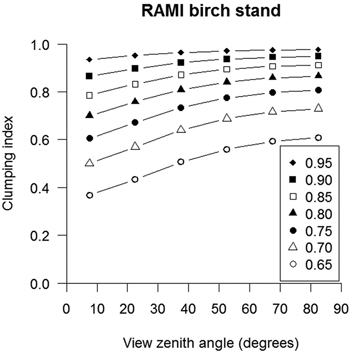
Fig. 4. Variation in foliage clumping index estimates with view zenith angle at different assumed canopy cover values for the Radiative Transfer Model Intercomparison (RAMI) birch stand in Järvselja, Estonia.
4 Discussion
The study demonstrated that DCP provides robust estimates of canopy cover, whose accuracy is largely unaffected by variation in actual canopy cover and mean gap size. By contrast, the accuracy of DHP was affected by both actual canopy cover and mean gap size, mainly because its lower nearly vertical resolution, which results in a lower ability in detecting small gaps near the zenith and a measurement of a quantity that is analogous to something between crown and foliage cover (Pekin and Macfarlane 2009). It has generally been noted that low resolution images have more mixed pixels (Blennow 1995; Leblanc et al. 2005; Macfarlane, 2011), which could obscure small gaps within canopies. This effect, in turn may prevent the accuracy of gap size distribution estimates, particularly in highly fragmented canopies (Song et al. 2014). This implies that use of DHP is particularly critical in dense canopies, which are mainly characterized by small within-crown gaps; DHP may be unable to detect gaps in such canopies, leading to an increasingly probability to achieve saturated canopy cover values. This effect, in turn, may prevent the inversion of canopy attributes from transmittance data, since the logarithm of zero gap fraction is undefined. Therefore, DCP appears particularly suited in dense forest canopies, because its higher ability to detect small gaps allows more accurate canopy cover retrieval in these stands. In addition, the higher vertical resolution of DCP allows separating total gap fraction into large, between-crowns gaps and small, within-crown gaps, leading to effective estimates of canopy transmittance (Rautiainen et al. 2005). Further, previous studies demonstrated that DCP was less sensitive to camera exposure, lens vignetting and sky luminance than DHP (Macfarlane et al. 2007; Macfarlane, 2011).
Canopy cover has certainly an effect on average gap fraction and its angular distribution – the higher the canopy cover, the smaller the total gap fraction (Nilson 2011). In addition, the theoretical gap fraction model indicated that canopy cover influences gap size and its variance; sparser canopies exhibited more clumped distribution of foliage, which can be attributed to a larger frequency in large gaps (Chen and Cihlar 1995) and a larger variation in gap size occurring at increasing canopy space availability. Conversely, denser canopies showed more randomly distributed foliage, probably because the lower number of small gaps occurring at saturating canopy density (Macfarlane 2011). As the variation in foliage clumping corresponds to different proportion in sunlight and shaded leaves, it implies that accurate canopy cover estimates are critical for reliable modelling fluxes of carbon, water and energy, and their distribution within the canopy (Chen et al. 2012).
To sum up, the study has compared two photographic methods for estimating canopy cover in forest stands. The main findings indicate that DCP is an effective tool for estimating forest canopy cover. As the method is simple, rapid and cost-effective, it can be used for routine measures and monitoring of canopy cover in a wide range of forestry applications.
Acknowledgments
The author is indebted with Tiit Nilson and Jan Pisek for their fruitful discussions and suggestions that improved the original draft of the paper. The author also wish to thank the anonymous reviewers for their helpful suggestions. The study was supported by the research project “ALForLab” (PON03PE_00024_1) co-funded by the (Italian) National Operational Programme for Research and Competitiveness (PON R&C) 2007–2013, through the European Regional Development Fund (ERDF) and national resource (Revolving Fund - Cohesion Action Plan (CAP) MIUR).
References
Angelini A., Corona P., Chianucci F., Portoghesi L. (2015). Structural attributes of stand overstory and light under the canopy. Annals of Silvicultural Research 39(1): 23–31. http://dx.doi.org/10.12899/asr-993.
Blennow K. (1995). Sky view factors from high-resolution scanned fish-eye lens photographic negatives. Journal of Atmospheric and Oceanic Technology 12(6): 1357–1362. http://dx.doi.org/10.1175/1520-0426(1995)012<1357:SVFFHR>2.0.CO;2.
Chen J.M., Cihlar J. (1995). Plant canopy gap-size analysis theory for improving optical measurements of leaf area index. Applied Optics 34(27): 6211–6222. http://dx.doi.org/10.1364/AO.34.006211.
Chen J.M., Mo G., Pisek J., Liu J., Deng F., Ishizawa M., Chan D. (2012). Effects of foliage clumping on the estimation of global terrestrial gross primary productivity. Global Biogeochemical Cycles 26, GB1019. http://dx.doi.org/10.1029/2010GB003996.
Chianucci F., Cutini A. (2013). Estimation of canopy properties in deciduous forests with digital hemispherical and cover photography. Agricultural and Forest Meteorology 168: 130–139. http://dx.doi.org/10.1016/j.agrformet.2012.09.002.
Chianucci F., Puletti N., Venturi E., Cutini A., Chiavetta U. (2014). Photographic assessment of overstory and understory leaf area index in beech forests under different management regimes in Central Italy. Forestry Studies 61(1): 27–34. http://dx.doi.org/10.2478/fsmu-2014-0008.
Chianucci F., Macfarlane C., Pisek J., Cutini A., Casa R. (2015). Estimation of foliage clumping from the LAI-2000 Plant Canopy Analyzer: effect of view caps. Trees 29(2): 355–366. http://dx.doi.org/10.1007/s00468-014-1115-x.
Dawson T.P., Curran P.J., North P.R.J., Plummer S.E. (1999). The propagation of foliar biochemical absorption features in forest canopy reflectance: a theoretical analysis. Remote Sensing of Environment 67(2): 147–159. http://dx.doi.org/10.1016/S0034-4257(98)00081-9.
Jennings S.B., Brown N.D., Sheil D. (1999). Assessing forest canopies and understorey illumination: canopy closure, canopy cover and other measures. Forestry 72(1): 59–74. http://dx.doi.org/10.1093/forestry/72.1.59.
Korhonen L., Korhonen K.T., Rautiainen M., Stenberg P. (2006). Estimation of forest canopy cover: a comparison of field measurement techniques. Silva Fennica 40(4): 577–587. http://dx.doi.org/10.14214/sf.315.
Kucharik C.J., Norman J.M., Gower S.T. (1999). Characterization of radiation regimes in non-random forest canopies: theory, measurements, and a simplified modelling approach. Tree Physiology 19(11): 695–706. http://dx.doi.org/10.1093/treephys/19.11.695.
Kuusk A., Kuusk J., Lang M. (2009). A dataset for the validation of reflectance models. Remote Sensing of Environment 113(5): 889–892. http://dx.doi.org/10.1016/j.rse.2009.01.005.
Lang M., Kuusk A., Mottus M., Rautianen M., Nilson T. (2010). Canopy gap fraction estimation from digital hemispherical images using sky radiance models and alinear conversion method. Agricultural and Forest Meteorology 150(1): 20–29. http://dx.doi.org/10.1016/j.agrformet.2009.08.001.
Leblanc S.G., Chen J.M., Fernandes R., Deering D.W., Conley A. (2005). Methodology comparison for canopy structure parameters extraction from digital hemispherical photography in boreal forests. Agricultural and Forest Meteorology 129(3–4): 187–207. http://dx.doi.org/10.1016/j.agrformet.2004.09.006.
Macfarlane C. (2011). Classification method of mixed pixels does not affect canopy metrics from digital images of forest overstorey. Agricultural and Forest Meteorology 151(7): 833–840. http://dx.doi.org/10.1016/j.agrformet.2011.01.019.
Macfarlane C., Hoffman M., Eamus D., Kerp N., Higginson S., McMurtrie R., Adams M.A. (2007). Estimation of leaf area index in eucalypt forest using digital photography. Agricultural and Forest Meteorology 143(3–4): 176–188. http://dx.doi.org/10.1016/j.agrformet.2006.10.013.
Macfarlane C., Ryu Y., Ogden G.N., Sonnentag O. (2014). Digital canopy photography: exposed and in the raw. Agricultural and Forest Meteorology 197: 244–253. http://dx.doi.org/10.1016/j.agrformet.2014.05.014.
Majasalmi T., Rautiainen M., Stenberg P. (2014). Modeled and measured fPAR in a boreal forest: validation and application of a new model. Agricultural and Forest Meteorology 189: 118–124. http://dx.doi.org/10.1016/j.agrformet.2014.01.015.
Nilson T. (1999). Inversion of gap frequency data in forest stands. Agricultural and Forest Meteorology 98–99: 437–448. http://dx.doi.org/10.1016/S0168-1923(99)00114-8.
Nilson T., Kuusk A. (2004). Improved algorithm for estimating canopy indices from gap fraction data in forest canopies. Agricultural and Forest Meteorology 124(3–4): 157–169. http://dx.doi.org/10.1016/j.agrformet.2004.01.008.
Nilson T., Kuusk A., Lang M., Pisek J., Kodar A. (2011). Simulation of statistical characteristics of gap distribution in forest stands. Agricultural and Forest Meteorology 151(7): 895–905. http://dx.doi.org/10.1016/j.agrformet.2011.02.009.
Pekin B., Macfarlane C. (2009). Measurement of crown cover and leaf area index using digital cover photography and its application to remote sensing. Remote Sensing 1(4): 1298–1320. http://dx.doi.org/10.3390/rs1041298.
Pisek J., Lang M., Nilson T., Korhonen L., Karu H. (2011). Comparison of methods for measuring gap size distribution and canopy nonrandomness at Järvselja RAMI (RAdiation transfer Model Intercomparison) test sites. Agricultural and Forest Meteorology 151(3): 365–377. http://dx.doi.org/10.1016/j.agrformet.2010.11.009.
Rautiainen M., Stenberg P., Nilson T. (2005). Estimating canopy cover in Scots pine stands. Silva Fennica 39(1): 137–142. http://dx.doi.org/10.14214/sf.402.
Ridler W., Calvard S. (1978). Picture thresholding using an iterative selection method. IEEE Transactions on Systems Man and Cybernetics 8(8): 630–632. http://dx.doi.org/10.1109/TSMC.1978.4310039.
Ryu Y., Sonnentag O., Nilson T., Vargas R., Kobayashi H., Wenk R., Baldocchi D.D. (2010). How to quantify tree leaf area index in an open savanna ecosystem: a multi-instrument and multi-model approach. Agricultural and Forest Meteorology 150(1): 63–76. http://dx.doi.org/10.1016/j.agrformet.2009.08.007.
Seed E.D., King D.J. (2003). Shadow brightness and shadow fraction relations with effective leaf area index: importance of canopy closure and view angle in mixedwood boreal forest. Canadian Journal of Remote Sensing 29(3): 324–335. http://dx.doi.org/10.5589/m03-003.
Song G.Z.M., Doley D., Yates D., Chao K.J. Hsieh C.F. (2014). Improving accuracy of canopy hemispherical photography by a constant threshold valued derived from an unobscured overcast sky. Canadian Journal of Forest Research 44(1): 17–27. http://dx.doi.org/10.1139/cjfr-2013-0082.
Total of 28 references.
