Minna Blomqvist  ,
Päivi Lyytikäinen-Saarenmaa,
Tuula Kantola,
Maiju Kosunen,
Mervi Talvitie,
Markus Holopainen
,
Päivi Lyytikäinen-Saarenmaa,
Tuula Kantola,
Maiju Kosunen,
Mervi Talvitie,
Markus Holopainen
Impacts of natural enemies and stand characteristics on cocoon mortality of the pine sawfly Diprion pini in a Fennoscandian boreal forest
Blomqvist M., Lyytikäinen-Saarenmaa P., Kantola T., Kosunen M., Talvitie M., Holopainen M. (2016). Impacts of natural enemies and stand characteristics on cocoon mortality of the pine sawfly Diprion pini in a Fennoscandian boreal forest. Silva Fennica vol. 50 no. 5 article id 1615. https://doi.org/10.14214/sf.1615
Highlights
- Annual cocoon mortality caused by natural enemies varied between 66% and 80% during the six-year study period, most of it caused by the family Ichneumonidae
- Basal area, and coverage of lichen (Lichenes) and lingonberry (Vaccinium vitis-idaea L.) best explained cocoon parasitism and predation
- Combination of suitable stand characteristics, abiotic environmental factors, and incomplete control by natural enemies enabled pest species to extend its gradation phase.
Abstract
We investigated the impact of natural enemies on the cocoon mortality of the common pine sawfly (Diprion pini L.) during a six-year period in eastern Finland. The enemies were classified into parasitoids (insect families Chalcidoidea, Ichneumonidae, and Tachinidae), and predators (birds, small mammals, and insect families Elateridae and Carabidae). The appearance of D. pini was estimated as the intensity of annual defoliation. The impact of stand characteristics on the performance of parasitoids and predators was also investigated. Influence of the natural enemy complex on cocoon mortality of D. pini was nearly stable, but defoliation intensity slowly declined towards the end of the study period. Annual cocoon mortality by natural enemies varied between 66% and 80%. Our results verified that the most significant mortality factors were ichneumonid parasitoids and small mammals. Random Forest classification indicated that stand characteristics, such as basal area, and coverage of lichen (Lichenes) and lingonberry (Vaccinium vitis-idaea L.) affected the performance of parasites and predators. We suggest that a combination of optimal stand characteristics, abiotic environmental factors and mild to moderate control by natural enemies acted as drivers, which drove the pine sawfly population to extended gradation. For future forest health management, detailed information on abiotic and biotic regulating factors, along with long-term monitoring campaigns for conifer sawflies are needed to adapt Fennoscandian forests to altered climatic and silvicultural conditions.
Keywords
needle loss;
Diprionidae;
population dynamics;
forest floor vegetation;
parasitism;
predation
-
Blomqvist,
University of Helsinki, Department of Forest Sciences, P.O. Box 27 (Latokartanonkaari 7), FI-00014 University of Helsinki, Finland
 http://orcid.org/0000-0003-2328-8839
E-mail
minna.blomqvist@helsinki.fi
http://orcid.org/0000-0003-2328-8839
E-mail
minna.blomqvist@helsinki.fi
- Lyytikäinen-Saarenmaa, University of Helsinki, Department of Forest Sciences, P.O. Box 27 (Latokartanonkaari 7), FI-00014 University of Helsinki, Finland E-mail paivi.lyytikainen-saarenmaa@helsinki.fi
- Kantola, Knowledge Engineering Laboratory, Department of Entomology, Texas A&M University, College Station, TX 77843-2475, USA E-mail tuula.kantola@helsinki.fi
- Kosunen, University of Helsinki, Department of Forest Sciences, P.O. Box 27 (Latokartanonkaari 7), FI-00014 University of Helsinki, Finland E-mail maiju.kosunen@helsinki.fi
- Talvitie, University of Helsinki, Department of Forest Sciences, P.O. Box 27 (Latokartanonkaari 7), FI-00014 University of Helsinki, Finland E-mail mervi.talvitie@dnainternet.net
- Holopainen, University of Helsinki, Department of Forest Sciences, P.O. Box 27 (Latokartanonkaari 7), FI-00014 University of Helsinki, Finland E-mail markus.holopainen@helsinki.fi
Received 13 April 2016 Accepted 25 November 2016 Published 2 December 2016
Views 224405
Available at https://doi.org/10.14214/sf.1615 | Download PDF

1 Introduction
Natural enemies are considered effective regulators of insect herbivore populations (Hanski and Parviainen 1985; Sharov 1993; Herz and Heitland 2003). Density-dependent interactions between a host or prey and its natural enemies are generally complex, and difficult to predict and explain (Turchin et al. 2003; Speight et al. 2008). The effect of natural enemies on a host or prey species population depends on a multitude of various factors, including life cycle and population density of the host species, forest type, habitat, and season of year (Hanski and Parviainen 1985; Kouki et al. 1998; Herz and Heitland 2003; Kollberg et al. 2014). Altering climatic conditions can also influence these interactions (Netherer and Schopf 2010). Response of the natural enemy complex is usually delayed compared to the phase in population density of the host organism (Berryman 1986; Pschorn-Walcher 1987).
Parasitoids are regarded an effective mortality factor of the common pine sawfly (Diprion pini L.) (Hymenoptera: Dipriniodae) cocoons (e.g. De Somviele et al. 2007). Parasitism is usually most effective at high and intermediate host population densities, and parasitoids are in some cases able to locally adapt their life cycle to that of the host population (Berryman 1986; Kaltz and Shykoff 2002). Parasitoids may also affect low host population densities (Berryman et al. 1987). Major D. pini cocoon parasitoids include wasps from the families of Ichneumonidae (Hymenoptera) and Chalcidoidea (Hymenoptera), and flies from the family of Tachinidae (Diptera) (Viitasaari 1982; Geri 1988). Ichneumonids have been observed to represent the majority of D. pini parasitism (Hertz 1933; Viitasaari 1982; Viitasaari and Varama 1987; Herz and Heitland 2005; De Somviele et al. 2007).
Predators form another group of enemies that can have a substantial potential in reducing sawfly outbreak intensities (Hanski and Parviainen 1985; Hanski 1990; De Somviele et al. 2007). Small mammals (e.g. shrews and voles) and birds (e.g. tits) can have great impact on prey insects at endemic population densities due to their dispersal abilities and learning skills (Holling 1959; Berryman 1986; Berryman et al. 1987; Crawford and Jennings 1989; Barbaro and Battisti 2011). The impact at epidemic level is usually milder due to their lower reproductive rate (Berryman et al. 1987). Beetles, such as elaterids (Elateridae) and carabids (Carabidae), also destroy cocoons (Hanski and Parviainen 1985).
Stand characteristics can have direct or indirect effects on pest insect populations. Stand characteristics, such as basal area, tree age, number of trees per hectare, or fragmentation, may affect parasitism or predation by providing a variety of habitats and microclimatic conditions (Roland 1993; Seehausen et al. 2015). Sawfly parasitism has been observed to be more effective in pure pine forests than in mixed-species forests (Herz and Heitland 2003). In more fertile forests, predators may be more effective and parasitoids can suffer from increased predation pressure on cocoons (Herz and Heitland 2003). Forest floor vegetation may affect predation rate remarkably. Predation is observed to be more effective in forests growing on fertile soils that provide denser forest floor vegetation (Hanski and Parviainen 1985; Hanski 1987; Herz and Heitland 2003). Small mammals prefer a denser understory, providing shelter (Schehying 1995 as cited by Herz and Heitland 2003; Kollberg et al. 2014). On the other hand, high lichen coverage indicates poor soil nutrient status (Salemaa et al. 2008). Such habitat may not provide enough sprigs for shelter. However, Kouki et al. (1998) provide no evidence of this connection between soil fertility and predation rate. Other soil characteristics, such as humus layer depth, may also affect the performance of natural enemies. For example, some parasitoids infest cocoons that are on the surface of the soil more than buried ones (Kolomiets et al. 1972; Herz and Heitland 2003).
The population density of D. pini has an eruptive gradation pattern (Speight et al. 2008; Geri 1988). In eruptive population dynamics, the population is in latency phase for several years and then erupts rapidly (Berryman 1986). Normally, a peak outbreak density subsides after 2–4 years, and is followed with endemic population levels for several years (Geri 1988). Currently, D. pini is considered a severe pest of pine forests in Fennoscandia (De Somviele et al. 2007; Kantola et al. 2010). D. pini is a native species in Finnish forests, mainly occurring in mature, even-aged Scots pine (Pinus sylvestris L.) (Pinaceae) stands growing on dry soils (Geri 1988; De Somviele et al. 2004, 2007; Nevalainen et al. 2015). However, during outbreak densities the species can also spread into sapling stands (De Somviele et al. 2004). Only small-scale outbreaks of D. pini have been recorded in Finland until the last two decades. A massive D. pini outbreak occurred in Finnish forests during 1997–2001, and the damage covered an area of over 500 000 ha (Lyytikäinen-Saarenmaa and Tomppo 2002; De Somviele et al. 2007). Contradiction to the normal gradation pattern of the species with a population collapse in other parts of the damaged area, the population remained at outbreak level in the very eastern part of the country, showing a chronic nature with a slow trend towards a postgradation phase (Kantola et al. 2013).
The life cycle of D. pini is univoltine in Finland (Geri 1988). Adults hatch from cocoons between mid-May and late July in several waves (Viitasaari and Varama 1987). Larvae consume needles of all age classes during late summer (Geri 1988). Feeding results in a severe decline in tree health and remarkable growth losses (Långström et al. 2001; Lyytikäinen-Saarenmaa et al. 2006). Severe needle consumption for two or more consecutive years may cause tree mortality (Berryman 1986; Geri 1988). Individuals spin a cocoon in the litter or humus layer in the end of the summer or the early fall, and the pupae overwinter in the cocoons (Viitasaari and Varama 1987). In northern latitudes, diapause can be prolonged up to several years (Viitasaari and Varama 1987; Geri 1988). The cocoon stage is immobile and cannot defend itself. Cocoon mortality factors are thus in a key position in regulating D. pini populations (e.g. Herz and Heitland 2003).
A large number of studies exist on the population regulation of insect herbivores by natural enemies. However, the study periods have typically only been one (e.g. Herz and Heitland 2005; Kollberg et al. 2014) to three years in length (e.g. Crawford and Jennings 1989; Kouki et al. 1998). A longer study period is needed to reveal the temporal pattern of the relationship between natural enemies and host populations. Our current study focuses on the cocoon mortality of D. pini. Natural enemies also regulate other life stages of D. pini. However, we excluded relationships between the mortality of other life cycle stages and the mortality agents connected with them. Our goal was to investigate long-term population regulation by natural enemies, focusing on the cocoon mortality of D. pini with a gradation and postgradation phase in its population dynamics. Our specific objectives were: i) to unravel the impact that the main predator and parasitoid groups and families exert on the cocoon mortality of D. pini and ii) to investigate connections between stand characteristics and mortality caused by natural enemies.
2 Materials and methods
2.1 Study design and field sampling
Our study site is located in the Palokangas area (62°52´N, 30°56´E), Ilomantsi district (Fig. 1), where a D. pini outbreak has occurred since 1999. The annual mean precipitation was 650–700 mm and the annual mean temperature was 2–3 °C in the Ilomantsi region for the period of 1981–2010 (Pirinen et al. 2012). During the 2000s, the mean temperature of the hottest month was 17.6 °C and of the coldest month –10.7 °C (Mekrijärvi Research Station, Ilomantsi). The mean sum of degree-days was 1216 d.d. (SE ± 40) during 2002–2010 (Finnish Meteorological Institute 2015). The study area is mostly covered by managed Scots pine stands, growing on dry or dryish soils, i.e. Calluna and Vaccinium types (Cajander 1926), with a thin humus layer. The study area is rather fragmented and heterogeneous in terms of stand age and size, and forest management practices (Solberg et al. 2011; Olsson et al. 2016) (Fig. 1). Eleven circular sampling plots, with radii varying from 8.5 m to 13 m, were established in May 2002 (Table 1) inside a study area covering 34.5 square kilometers. The plots were delineated so that ca. 20 mature pine trees were growing on each plot. The center of each sample plot was located with a Trimble Pro XH GPS device (Trimble Navigation Ltd., Sunnyvale, CA, USA). All individual trees were located by measuring distances and azimuths to the plot centers. Tree-wise measurements were conducted during the springs of 2002 and 2010. Diameter-at-breast-height (dbh) of all tally trees was measured. A sample of eight trees per plot covering various diameter classes was taken to estimate mean height and age.
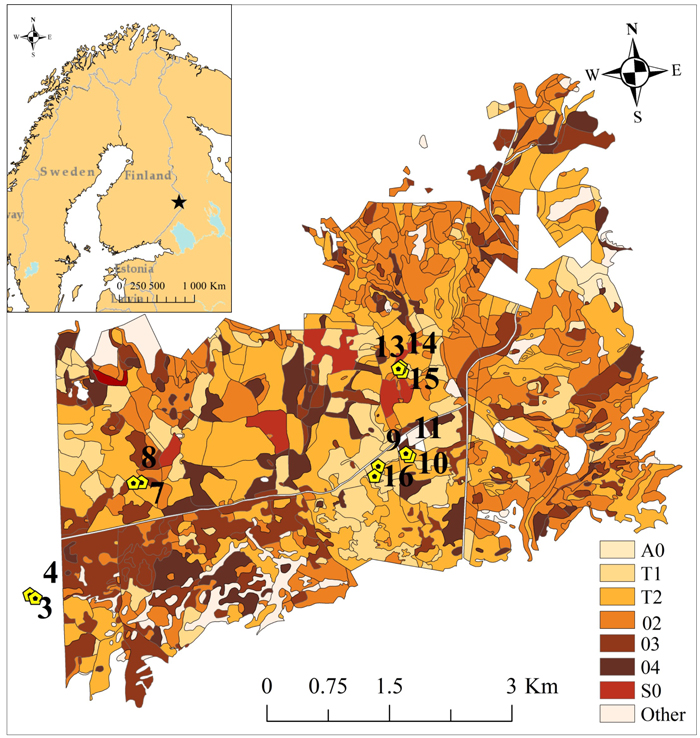
Fig. 1. The study area with 11 sampling plots is located in easternmost Finland. Sampling plots were established in 2002 in a wider study area covering approximately 34.5 square kilometers. (A0 = Open regeneration area, T1 = Small-seedling stand, T2 = Advanced seedling stand, 02 = Young thinning stand, 03 = Advanced thinning stand, 04 = Mature stand, S0 = Seed-tree stand, and Other = other types of forest stands). Basemap© Esri; DeLorme Publishing company Inc.; OpenStreetMap contributors and the GIS user community.
| Table 1. Inventoried stand characteristics of the sampling plots in 2010, mean height (H02 & H10), and diameter-at-breast-height (DBH02 & DBH10) in 2002 and 2010. (r = radius of plot, n/plot = number of trees per plot, n/ha = number of trees per hectare, BA = basal area (m2/ha), Age = plot-wise age (±SD), H = mean height (±SD), DBH = mean diameter-at-breast-height (±SD), DEF = plot-wise defoliation intensity, proportion of M = Moss, L = Lichen, VM = Vaccinium myrthillus, VV = Vaccinium vitis-idaea, CV = Calluna vulgaris, Other = other plant species and Humus = depth of humus layer). | |||||||||
| Plot ID | r (m) | n/plot | n/ha | BA | Age | H02 (m) | DBH02 (cm) | H10 (m) | DBH10 (cm) |
| 3 | 12 | 21 | 464 | 21 | 75 (9.4) | 19.4 (2.0) | 22.6 (4.0) | 20.9 (1.8) | 24.0 (4.1) |
| 4 | 12 | 20 | 442 | 20 | 72 (12.0) | 17.6 (1.2) | 21.9 (3.0) | 19.1 (1.4) | 24.0 (3.1) |
| 7 | 9 | 22 | 865 | 31 | 86 (9.3) | 17.6 (2.0) | 18.9 (4.5) | 20.0 (1.7) | 20.0 (4.7) |
| 8 | 9 | 21 | 826 | 24 | 85(4.4) | 16.3 (1.6) | 17.4 (2.6) | 17.8 (0.9) | 19.1 (2.7) |
| 9 | 12 | 21 | 464 | 10 | 59 (3.6) | 15.4 (1.4) | 17.7 (3.1) | 15.4 (1.4) | 18.4 (2.3) |
| 10 | 11 | 18 | 474 | 18 | 75 (14.3) | 16.5 (2.7) | 19.5 (4.6) | 17.7 (3.9) | 20.3 (4.6) |
| 11 | 12 | 26 | 575 | 22 | 71 (8.4) | 16.9 (2.4) | 20.5 (3.8) | 18.3 (1.6) | 21.4 (4.0) |
| 13 | 11 | 20 | 526 | 22 | 80 (7.6) | 17.8 (2.6) | 19.6 (4.5) | 20.1 (1.1) | 20.7 (4.9) |
| 14 | 10 | 24 | 764 | 29 | 84 (17.9) | 18.0 (2.7) | 18.9 (4.8) | 18.5 (2.8) | 21.1 (5.7) |
| 15 | 8.5 | 24 | 1057 | 24 | 80 (11.6) | 15.2 (2.3) | 15.1 (3.6) | 17.6 (1.0) | 16.5 (4.1) |
| 16 | 12 | 20 | 442 | 16 | 73 (4.8) | 17.6 (1.6) | 21.1 (3.5) | 17.8 (1.7) | 21.3 (3.9) |
| Plot ID | DEF(%) | M (%) | L (%) | VM (%) | VV (%) | CV (%) | Other (%) | Humus (cm) | |
| 3 | 8.86 | 58.8 | 13.8 | 6.3 | 18.8 | 0 | 2.5 | 2.5 | |
| 4 | 6.51 | 48.3 | 31.7 | 0 | 8.3 | 11.7 | 0 | 2.5 | |
| 7 | 4.34 | 53 | 7 | 9 | 6 | 20 | 4 | 2.5 | |
| 8 | 3.88 | 60 | 16 | 2 | 10 | 12 | 0 | 4.5 | |
| 9 | 76 | 51 | 13 | 5 | 26 | 5 | 0 | 4 | |
| 10 | 26.48 | 58 | 6 | 10 | 22 | 3 | 1 | 5.2 | |
| 11 | 38.24 | 63 | 11 | 11 | 13 | 2 | 0 | 4.2 | |
| 13 | 5.58 | 63 | 22 | 4 | 11 | 0 | 0 | 3 | |
| 14 | 2.31 | 54 | 19.7 | 11.7 | 14.7 | 0 | 0 | 4.5 | |
| 15 | 0.69 | 54 | 13 | 14 | 15 | 4 | 0 | 3 | |
| 16 | 77.22 | 61.3 | 6.3 | 6.3 | 20 | 6.3 | 0 | 4.5 | |
Cocoon sampling was carried out annually before the hatching of D. pini in May 2005–2010, thus the samples represented the situation of the previous year. Cocoon samples were collected at each plot from the litter and humus layer of every fifth tree (using consecutive numbering) and using a 0.5 m × 0.5 m frame. These four frame positions combined to annually form a 1 m2 area per plot. The frame was placed 0.5 m from a tree stem, facing towards the plot center. During the following study years, each frame was moved clockwise to the tally tree next in consecutive order, to obtain inclusive samples and avoid overlapping sampling squares. We assumed that predators took an even number of cocoons to and from our study plots, and the effect of transferred cocoons was evened out in our study plots. Samples were kept at room temperature to count the number of hatched individuals.
Cocoons were classified into groups of different mortality factors by identifying the signs made by parasitoids and predators according to Hertz (1933), and Viitasaari and Varama (1987). The applied mortality factors were the insect families Ichneumonidae, Tachinidae, and Chalcidoidea (parasitism) and birds, small mammals, and the insect families Elateridae and Carabidae (predation) (Fig. 2). We also defined a number of diapausing individuals, old hatched, and current hatched cocoons. Potential dead individuals could not be separated from diapausing ones. We combined the current hatched and diapausing individuals, and from now on refer to the group as ‘potential pests’ due to their ability to affect defoliation intensity via their offspring. The families Elateridae and Carabidae were combined due to the small number of cocoons destroyed by them. The number of cocoons in each class was transformed into relative proportions (percentage of the total number of cocoons sampled annually, from now on called ‘proportion’), because the timing of cocoon formation is difficult to determine due to extended durability of cocoon structure. Some cumulative effect may occur during outbreak years. For this reason, it is justifiable to use relative proportions.
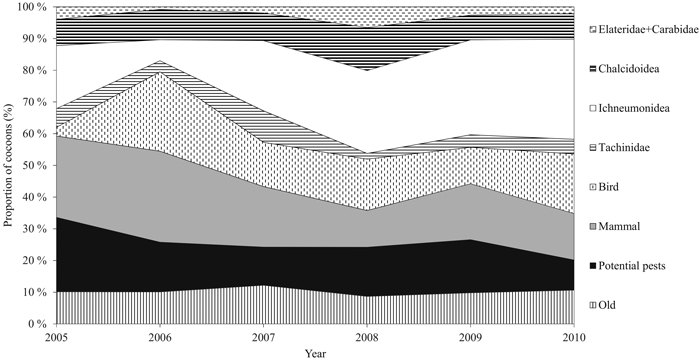
Fig. 2. Annual relative proportion (%) of the cocoon groups during the study period. The group of potential pests includes new hatched and diapausing cocoons. Families Carabidae and Elateridae are combined. Predation includes groups of small mammals, birds, and Carabidae and Elateridae. Parasitism consists of families Tachinidae, Ichneumonidae, and Chalcidoidea. View larger in new window/tab.
Tree-wise defoliation assessment was visually carried out annually in 2002–2010 (excluding 2003, with no data) during May and early June, before the elongation of current needles. Each assessment represented the defoliation status of the previous fall. The defoliation status of each tree was compared to an imaginary healthy tree with full foliage growing on a similar site type, according to Eichhorn (1998), with a precision of 10%. Defoliation intensity was assessed from the upper two thirds of each crown. Trees from the suppressed canopy layer were excluded from the analyses due to other stress factors.
Forest floor vegetation coverage was visually estimated on each plot in 2010 (Table 1). The assessment was done within a 1 m × 1 m frame with a precision of 5% at the center of each sampling plot, and 5.3 m from the center towards each cardinal direction. The coverages (%) of moss (Bryobionta), lichen (Lichenes), blueberry (Vaccinium myrthillus L.), lingonberry (Vaccinium vitis-idaea L.) heather (Calluna vulgaris L.), and other minor plant species were estimated. Depth of the humus layer was measured with a precision of 0.1 cm simultaneously within each frame.
2.2 Statistical testing and nearest neighbor estimation
We employed a non-parametric Friedman test (Friedman 1937) for repeated measurements to find differences between years for each of the cocoon groups separately. The same test was applied to define differences in the mean defoliation intensity between the years and between the sampling plots. Friedman test can be applied when data are small (< 30 sample) and meet neither the normality nor the homogeneity of variances. The significant differences were pinpointed with the Nemenyi post hoc test (Nemenyi 1963 as cited by Demšar 2006).
We applied Wilcoxon Signed-Rank test to find differences between the groups of parasitoids and predators (plot-wise mean proportions). Wilcoxon Signed-Rank test is a non-parametric test for repeated measurements to observe whether two data populations are identical or not. The test can be used when the assumption of normality cannot be met (Sokal and Rohlf 1995). For the aforementioned tests, p-values less than 0.05 were considered statistically significant. We used Bonferroni correction in the post hoc tests. Bonferroni correction is valid when testing multiple comparisons. Finally, we computed correlations between different variables applying Spearman’s correlation coefficient.
Due to the small sample size, common modeling approaches do not produce reliable estimates for estimating the effect of parasitism or predation. However, we aimed to investigate the relationships between parasitism or predation, stand characteristics, and defoliation intensity. We employed a non-parametric Random Forest (RF) algorithm (Breiman 2001), which applies a nearest neighbor (NN) search, in investigating the importance of various variables for explaining plot-wise parasitism and predation levels in 2010. RF is therefore also suitable for variable selection in addition to classification (Cutler et al. 2007). For more details of the method see, e.g. Falkowski et al. (2010) and Crookston and Finley (2012). We classified the plots using 10% intervals as a threshold of parasitism and predation, with three and five classes, respectively. Environmental characteristics from 2010 were used as predictors. The number of regression trees was set as 2000, meaning that the estimation was repeated 2000 times to obtain a more robust result. Parameter k was set (numbers of NNs) as three. Bias is smallest with a k value of one, but good results have been obtained with k values between two and seven (e.g. Kantola et al. 2013). We employed R statistical computing environment (The R Project 2014) in all the analyses. The R yaImpute library (Crookston and Finley 2012) was applied in the RF search and PMCMR library in the Nemenyi post hoc test.
3 Results
3.1 Effect of the natural enemy complex on cocoon mortality
During the six-year study period, a total of 5843 D. pini cocoons were sampled. The proportion of potential pests varied significantly between the years (P = 0.05) (Table 2). Years 2005 and 2010 significantly differed from the other years (P = 0.005). The peak proportion of potential pests during the study period occurred in 2005 (23.5%, ±SE 2.11) (Fig. 2). The combined proportion of the natural enemy complex varied between years (P = 0.003), and the maximum was met in 2010 (79.9%, ±SE 1.76) (Fig. 3). Years 2005 and 2010 were significantly different (P = 0.014). Both the mean proportion of cocoon parasitism and predation varied between years (P = 0.000 and P = 0.000, respectively). Cocoon parasitism in 2006 was significantly different from 2009 and 2010 (P = 0.035 and P = 0.005, respectively). Cocoon predation in 2006 was significantly different from 2008 (P = 0.005) and 2009 (P = 0.014). We could not find a statistical difference between the mean proportion of cocoon mortality by parasitoids and predators for the study period.
| Table 2. Results of the non-parametric Friedman test for the different cocoon mortality groups between years (2005–2010) (threshold of significance p < 0.05, df = 5), and the number of pairs of years (N of years) that showed statistically significant difference for a certain cocoon group after Bonferroni correction (Nemenyi post hoc test, p < 0.05). | |||
| Group | Friedman chi-squared | p-value | N of years |
| Old hatched | 4.14 | 0.529 | 0 |
| Potential pests | 21.03 | 0.001 | 1 |
| Small mammals | 20.19 | 0.001 | 0 |
| Birds | 35.65 | 0.000 | 2 |
| Tachinidae | 10.09 | 0.073 | 0 |
| Ichneumonidae | 33.49 | 0.000 | 2 |
| Chalcidoidea | 4.84 | 0.435 | 0 |
| Elateridae + Carabidae | 13.03 | 0.023 | 0 |
| Parasitism | 24.35 | 0.000 | 2 |
| Predation | 23.94 | 0.000 | 3 |
| Natural enemy complex | 17.70 | 0.003 | 1 |
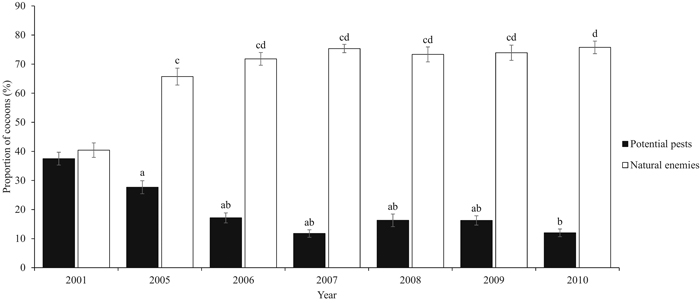
Fig. 3. Proportion (%, ±SE) of the potential pests (2001 hatched and intact cocoons and 2005–2010 new hatched and diapausing cocoons) and natural enemies (parasitoids and predators). Natural enemies cover birds and small mammals, and the Ichneumonidae, Chalcidoidea, Tachinidae, Elateridae, and Carabidae families. Our study period covers years 2005–2010. Data from year 2001 are from De Somviele et al. (2007), and are not included into the statistical tests because of the different sampling method and larger variation in site types. Letters indicate statistical differences (p < 0.05) separately for both series. View larger in new window/tab.
The Ichneumonidae family was the major parasitoid group nearly every year, and showing an annually increasing proportion (19.9%, (±SE 1.6) in 2005 and 31.6%, (±SE 1.95) in 2010, mean of 22.7%, (±SE 3.7)). The proportion of Ichneumonidae was statistically significantly different between the years (P = 0.000); 2006 differed from 2008 (P = 0.001) and 2010 (P = 0.000). The mean proportion of the parasitoid family Tachinidae was lowest in five out of six years in terms of cocoon mortality (mean of 5.0%, ±SE 1.1). No statistically significant differences were observed between the years for the proportion of Tachinidae. The mean proportion of the Chalcidoidea family remained stable during the study period (mean 9.3, ±SE 0.89), and did not vary significantly between the years (Table 2, Fig. 2).
The mean number of small mammals was 19.6 (±SE 2.7) during the study period. Maximum and minimum numbers were met in 2006 (28.7%) and 2008 (11.6%), respectively (Fig. 2). After Bonferroni correction, statistically significant differences could not be found between the years. The mean predation rate by birds was 14.7% (±SE 3.0) (minimum of 2.8% in 2005 and maximum of 25.0% in 2006). The proportion of bird-induced cocoon mortality varied between 2005 and 2006 (P = 0.000), and 2005 and 2010 (P = 0.003). The mean proportions of cocoon mortality caused by the families Elateridae and Carabidae were low (mean of 2% ±SE 0.7), and alterations in the proportions between the years cannot be specified after Bonferroni correction (Table 2).
The proportion of potential pests and the mean defoliation intensity of the sampling plots correlated significantly in 2005 (0.87, P = 0.000) and 2010 (0.8, P = 0.003). No significant correlations were found in 2006–2009.
3.2 Relationship of natural enemies and stand characteristics
The mean annual defoliation intensity of all the sampling plots decreased along the study period from 37% (±SE 4.6) (2002) to 23% (±SE 7.2) (2010). The differences between the years in plot-wise defoliation intensities were statistically significant (P = 0.000). Years 2002 and 2005 were both statistically different from 2009 (P = 0.031 and P = 0.036, respectively) and 2010 (P = 0.031 and P = 0.036, respectively) (Fig. 4). The sampling plots were chosen so as to include plots that exhibited varying mean defoliation intensities already in 2002. Accordingly, the differences in plot-wise defoliation were statistically significant (P = 0.000) (Fig. 4). Within the four sampling plots in an initial outbreak area, the most severe plot-wise defoliation was assessed in 2005 (66–99%). Within the remaining seven sampling plots, the highest defoliation level was assessed at the beginning of the study period, in 2002 (14–47%). Defoliation intensity was less than 10% on most of the plots (n = 7) in 2010.
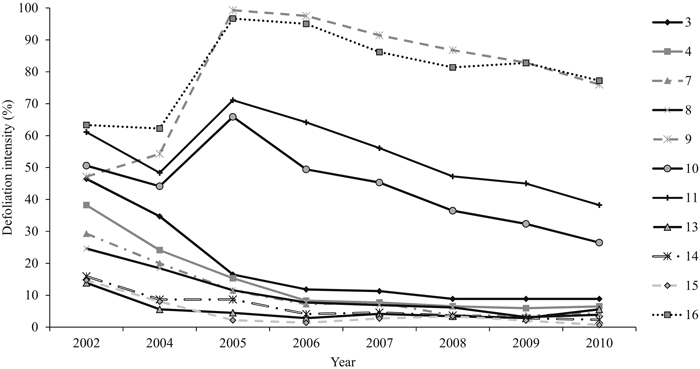
Fig. 4. The mean defoliation intensity (%) of each sampling plot between 2002 and 2010. On four sampling plots (9, 10, 11, and 16), the peak defoliation was met in 2005 and in other plots in 2002. View larger in new window/tab.
Various Random Forest searches were run to find the best predictors for cocoon mortality (Fig. 5). The best variables explaining cocoon parasitism were basal area (m2 ha–1), and lichen and lingonberry coverages in 2010. With these predictors we gained an accuracy of 82% with a Kappa value of 0.694 (P = 0.002). The most important features in the RF classification for the proportion of cocoon predators were basal area (m2 ha–1), plot-wise defoliation, and lichen coverage in 2010. The accuracy of this classification was 82% with a Kappa value of 0.741 (P = 0.000). The proportion of predated cocoons correlated negatively with mean defoliation intensity (–0.730, P = 0.011) and lingonberry coverage (–0.740, P = 0.010) (Table 3).
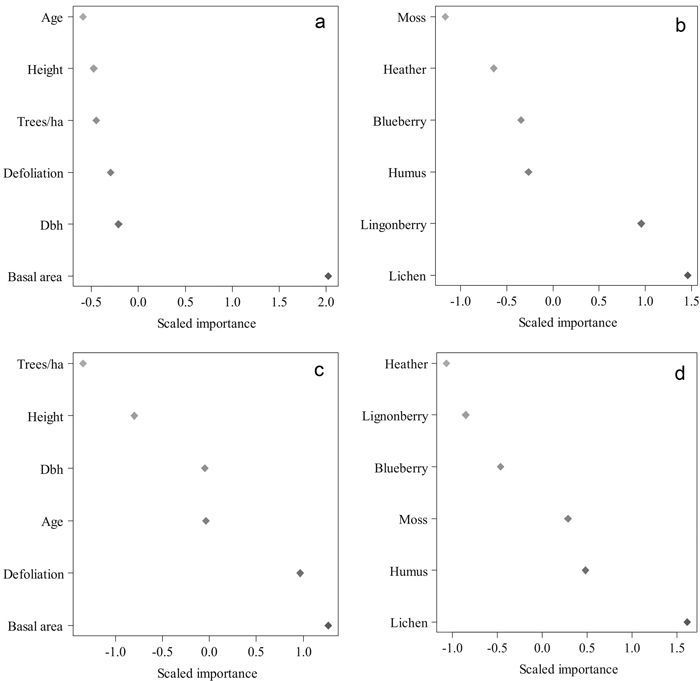
Fig. 5. The importance of various tree and environmental features in classifying the mean parasitism and predation level in 2010 using Random Forests. Results of the run, in which tree features were used to predict parasitism (a) and predation (c). Results of the run conducted with the environmental features to predict parasitism (b) and predation (d). Higher values indicate a higher importance of a feature. (Height = mean height in 2010 (m), Dbh = diameter-at-breast-height in 2010 (cm), Trees/ha = number of trees per hectare, Basal area = basal area in m2 per hectare, Defoliation = plot-wise mean defoliation in 2010, forest floor vegetation characteristics in proportions in 2010). View larger in new window/tab.
| Table 3. Spearman’s correlation coefficient was used to calculate the correlation coefficient (threshold of significance p < 0.05) between environmental characteristics and cocoon parasitism and predation in 2010. (DBH = mean diameter-at-breast-height, BA = plot-wise basal area, DEF = plot-wise defoliation intensity, VM = Vaccinium myrthillus, VV = Vaccinium vitis-idaea, CV = Calluna vulgaris). | ||||
| Parasitism | Predation | |||
| Variabel | Correlation | p-value | Correlation | p-value |
| Mean DBH (cm) | –0.450 | 0.136 | 0.530 | 0.095 |
| Trees/ha | –0.100 | 0.769 | 0.350 | 0.289 |
| Mean height (m) | –0.340 | 0.031 | 0.190 | 0.573 |
| Mean age | –0.350 | 0.289 | 0.566 | 0.070 |
| BA (m2/ha) | –0.470 | 0.140 | 0.289 | 0.021 |
| Mean DEF (%) | 0.270 | 0.417 | –0.730 | 0.011 |
| Moss (%) | 0.250 | 0.465 | –0.450 | 0.168 |
| Lichen (%) | –0.080 | 0.811 | 0.510 | 0.113 |
| CV (%) | –0.220 | 0.515 | 0.160 | 0.647 |
| VM (%) | –0.190 | 0.573 | 0.030 | 0.926 |
| VV (%) | 0.450 | 0.170 | –0.740 | 0.010 |
| Humus (cm) | 0.360 | 0.281 | –0.570 | 0.067 |
4 Discussion
4.1 Evaluating the impact of the natural enemy complex
We found that cocoon mortality remained at a high level during the entire study period. The effect of the natural enemy complex was nearly stable during the six-year study period. Overall cocoon mortality increased approximately 20% during our six study years, but only 2005 and 2010 were significantly different.
Kolomiets et al. (1972) concluded that the natural enemy complex destroyed 21.6% of the cocoons of the European pine sawfly (Neodiprion sertifer Geoffr.) during the first year of outbreak. De Somviele et al. (2007) found an overall cocoon mortality of 40.4% by the natural enemy complex in maturing and mature stands in the same Palokangas area in 2001, two years after the launch of the initial outbreak. After four years, we observed approximately 63% higher overall cocoon mortality (65.7%) (Fig. 3). The impact of natural enemies may intensify more rapidly at the beginning of the gradation phase. In this functional response, the rate of natural enemies first accelerates and then slows down gradually, and natural enemies become satiated (Berryman 1986). The rate of natural enemies in Palokangas may currently be satiated. Our results are not completely comparable with the study by De Somviele et al. (2007), as they measured more variation in forest structure and forest site types due to a wider study area.
The outbreak was initiated in 1999 and the population densities of D. pini were already high for several years before our first cocoon sampling in 2005 (see De Somviele et al. 2004, 2007). According to Viitasaari and Varama (1987), an outbreak of D. pini typically continues for two to four years in Finland. In 2010, the population density of D. pini within our study area had remained high for over a decade, which is a very untypical pattern for an eruptive forest pest.
The natural enemy complex is regarded as an effective regulating factor of pest insect populations (Cornell et al. 1998; Alalouni et al. 2013). Several studies have been conducted to underline the impact of cocoon parasitism and predation on pine sawfly populations (e.g. Olofsson 1986; Herz and Heitland 2003). However, according to our knowledge, neither the long-term impacts of cocoon parasitism and predation on eruptive D. pini populations have been studied, nor the connection between stand characteristics and performance of natural enemies. Our study quantifies the performance of parasitoids and predators as mortality agents of cocoons during a six-year period documenting the prolonged gradation and postgradation phase of a D. pini population.
4.2 Impact of parasitism
We observed a relatively high rate of cocoon parasitism. Herz and Heitland (2003) found D. pini parasitism to remain under 24% at endemic population densities in a Central European pure pine forest. Observations by De Somviele et al. (2007) on parasitism at the initial phase of the D. pini outbreak were in line with those of Herz and Heitland (2003). We observed slightly increasing rates of cocoon parasitism. The different outbreak stage may explain the variation in these results. Parasitoid populations can grow and reach their peak population density in the case of an extended outbreak period (Berryman 1986; Pschorn-Walcher 1987). The rate of cocoon parasitism appears to depend on the parasitoid complex and its ability to synchronize population dynamics with the host, along with environmental factors such as stand characteristics (Kidd and Jervis 1997; Turchin et al. 2003). According to Geri (1988), the population density of D. pini should decrease after three generations of outbreak densities due to the delayed density-dependent suppressing effect of parasitism. Our results seem to support this finding with a delayed pattern.
The rate of cocoon parasitism by Ichneumonidae fluctuated slightly, but the family was one of the most effective mortality factors. A similar phenomenon has been observed in other studies as well (Viitasaari and Varama 1987; Herz and Heitland 2005; De Somviele et al. 2007). In 2005, Ichneumonidae species represented over half of the cocoon parasitism, and the rate increased after 2006. The families of Chalcidoidea and Tachinidae had a milder and more stable effect on cocoon mortality compared to Ichneumonidae. This is in accordance with the results by De Somviele et al. (2007). Cocoon mortality by Tachinid flies represented the lowest proportions among parasitoids. Dahlsten (1967) observed a similar pattern in the cocoon parasitism of a sawfly Neodiprion fulviceps (Cresson). Tachinids are more abundant parasitoids of other life cycle stages of conifer sawflies (Knerer 1993). The composition of the parasitoid complex can alter during the gradation phases (Eveleigh et al. 2007; Alalouni et al. 2013), but it was not possible to confirm this in Palokangas due to prolonged gradation of the host species.
4.3 Impact of predation
Cocoon mortality of D. pini by predators does not normally reach the rate of parasitism in a pure pine forest according to Herz and Heitland (2003), due to a shortage in alternative food resources and shelter. In our study, cocoon predation and parasitism reached approximately similar levels. This may be due to the prolonged gradation phase. Hanski and Parviainen (1985) observed a much higher predation rate in forests with varying dominant tree species in a cocoon planting study of N. sertifer. This difference may result from a variation in understory vegetation composition and forest site types. D. pini has been observed to suffer from higher cocoon predation than N. sertifer because of their over-wintering cocoons and the absence of alternative food resources available for small mammals during fall and winter (Kouki et al. 1998).
Small mammals and birds were the most effective predators in our study. The impact of small mammals can vary, e.g. due to the phase of a vole population cycle. In addition to voles, mice and shrews typically feed on D. pini cocoons. In other studies, sawfly cocoon predation by small mammals in pure pine forests have exceeded 12.6% at the beginning of the gradation phase (De Somviele et al. 2007), 48.9% at gradation peak (Obrtel et al. 1978), and 30.0% at postgradation phase (Hanski and Parviainen 1985). In the Palokangas area, the peak in cocoon predation during our study period was observed in 2006. Based on our defoliation assessments and field observations, the host population’s peak density occurred in 2005, leading to the cocoon predation peak due to increased food resources for the offspring of predators.
De Somviele et al. (2007) observed a mean bird predation of 2.9% at the beginning of the gradation phase in their entire study area. Predation by birds did not increase until 2005, but in 2006, it was highest during the entire study. In our study, the pattern of cocoon predation by birds fluctuated significantly over time, and was higher than in study by De Somviele et al. (2007) nearly every year. Birds are accustomed to returning to the same breeding habitats with available food resources (Morris et al. 1958). Birds present in the area may have experienced increased reproductive rates due to the high sawfly density (see Buckner and Turnock 1965). Thus, the notable change between 2005 and 2006 may be due to the high population density of D. pini in 2005. At the same time, the proportion of parasitized cocoons was low. This may indicate that predators feed on parasitized cocoons as well, and thus the influence of cocoon predation or parasitism is not explicit. For example, Kolomiets et al. (1972) indicated that mice did not choose healthy or infested cocoons over the other alternative.
Small mammals remove cocoons from litter and cache them elsewhere (Kouki et al. 1998; Kollberg et al. 2014). However, we assumed that the same amount of cocoons was transferred from and to the study plots. The number of transferred cocoons can be substantial (Hanski and Parviainen 1985; Kouki et al. 1998; Herz and Heitland 2003), but this feeding habit cannot be estimated with our study design. In addition, in the studies of Hanski and Parviainen (1985) and Kouki et al. (1998), cocoons were placed artificially above the litter, without a protection from predators. According to Kolomiets et al. (1979), larvae spin cocoons normally in the ground between the litter and mineral soil. Our personal observation was the same, and only few cocoons were found above the litter.
We investigated the impact of natural enemies in the most natural circumstances for D. pini to pupate into the litter and soil. Therefore, all experimental planting and marking of cocoons (cf. Kouki et al. 1998), as well as some plastic underlays or gauze were avoided. Cocoons may remain in diapause, or stay in ground as empty cocoons after parasitism or predation for many years. This may have caused some cumulative effect of the cocoons in our study plots. We minimized this effect by using relative proportions, not densities or absolute number of cocoons. Moreover, assumed balanced input and output of predated cocoons in the study plots may have led some uncertainties to the results. To our knowledge, this problem has not been solved, nor how long time cocoons stay in detritus till decomposition. These methodological sampling problems and uncertainties should be avoided in the future studies.
4.4 Effect on defoliation intensity
The mean defoliation intensity of the sampling plots decreased during the study period, indicating that the plots were experiencing the postgradation phase during most of the study period. On four plots, at the focal point of the initial outbreak, the mean defoliation level remained high, with a slightly decreasing trend throughout the entire period. Most of the trees on these plots still suffered from considerable defoliation during spring 2016 (MSc. (For) Minna Blomqvist, University of Helsinki, pers. comm. in 2016). This may be due to a weaker controlling effect by the natural enemies within the subarea. The trees on these stands may initially have suffered from too severe defoliation to complete their recovery process. After an outbreak, the recovery of Scots pine until healthy status may take more than a decade (Lyytikäinen-Saarenmaa et al. 2006), adding to growth and economic losses. Major annual clear-cutting and thinning operations have also been conducted within the study area, due to the D. pini calamity. Forest cutting operations and site preparation may increase the risk of adjacent Scots pine stands being infested by D. pini (Berryman 1986; De Somviele et al. 2007), thus prolonging the gradation.
4.5 The relationships between stand characteristics and natural enemies
Tree and stand characteristics can affect host insect populations and their natural enemies via habitat suitability. The abundance of natural enemies is associated with vegetation complexity at the habitat (Langellotto and Denno 2004). We gained a high overall classification accuracy using plot-wise basal area, and lichen and lingonberry coverages as predictors for cocoon parasitism with the RF search. Basal area and stem density affect microclimatic conditions. Parasitoids’ sensitivity to temperature and humidity (Hance et al. 2007) could be a key issue affecting their occurrence. Seehausen et al. (2015) observed that heavy thinning operations significantly reduced larval parasitism of the hemlock looper (Lambdina fiscellaria (Guenée)).
Stands with higher vegetation diversity may offer a more suitable habitat for parasitoid species. The lack of nectar or pollen at lower fertility stands, which can be used to complete the diet, may diminish the number of parasitoids (Langellotto and Denno 2004). Various plant species growing on the forest floor indicate the nutrient status and hydrology of a site (Salemaa et al. 2008). For example, high lichen and lingonberry coverages indicate lower soil fertility and decreased diversity of forest floor vegetation.
The best predictors of cocoon predation, i.e. basal area, defoliation intensity, and lichen coverage, have an influence on microhabitats that are considered to contribute to predators’ living requirements and behavior (Kollberg et al. 2014). Schehying (1995, as cited by Herz and Heitland 2003) found that tree density correlated with the cocoon predation of D. pini. In contrast, Grushecky et al. (1998) did not find a connection between pupal predation of the gypsy moth (Lymantria dispar L.) and basal area. A strong negative correlation between cocoon predation rate and the mean defoliation intensity indicates a more powerful impact of predation on stands experiencing milder defoliation intensity. According to Schehying (1995, as cited by Herz and Heitland 2003), cocoon predation is related to understory vegetation. The population density of small mammals has been observed to be generally higher in forests growing on nutrient-rich soils with dense understory vegetation, providing shelter (Hanski and Parviainen 1985; Herz and Heitland 2003). For example, the impact of predation may weaken, and the density of predators decreases with increasing lingonberry coverage. Forest site types dominated by lingonberry, such as the Palokangas area, may not be optimal environments for small mammals. However, Kouki et al. (1998) assumed that the effect of predation depends more on the life cycle of prey species and season than on forest fertility or stand characteristics.
4.6 Effects of natural enemies – synthesis
Despite natural enemy complexes potentially having strong impacts, populations of D. pini are never entirely controlled by them. At an epidemic level of a pest population, natural enemies alone cannot intercept the outbreak, because abiotic factors and habitat-induced variation in the feeding preference and behavior of natural enemies may play a crucial role (Kollberg et al. 2014). Populations of eruptive forest pests may remain at endemic densities over longer periods, but explode into epidemic densities if environmental density-independent factors, such as weather anomalies, favor a high population growth rate (Berryman et al. 1987). According to De Somviele et al. (2007), this appeared to be the case with D. pini in Finland during the 2000s.
Climate change –driven extreme weather events and increased annual temperatures may improve the prevailing conditions for a variety of forest pests (Dale et al. 2001; Cornelissen 2011). Distributions of forest pests have shifted towards the north during the last decades (Dale et al. 2001; Klapwijk et al. 2012). Until recent years, N. sertifer has been considered the only pine sawfly to cause large-scale outbreaks in Fennoscandia (Christiansen 1970; Larsson and Tenow 1984; De Somviele et al. 2004). Now, D. pini has become a similar threat.
The annual mean temperature has risen by approximately 2 °C since the mid-1800s in Finland (Mikkonen et al. 2013). Haynes et al. (2014) proposed that an increase of 1 °C in the mean temperature of the summer months increases the outbreak probability of D. pini by over 40%. This is mainly due to the probability of increasing bivoltinism with longer and warmer summers (Sharov 1993; Haynes 2014). This is not yet the case in Finland. In addition, the influence of natural enemies of pine sawfly cocoons can be lower at extreme temperatures due to changes in their metabolism (Gray 2008; Kollberg et al. 2014). Kollberg et al. (2014) indicated that predators eat less N. sertifer pupae at 20 °C than at 15 °C. Thus, in warmer temperatures, pine sawfly population may experience higher survival (Kollberg et al. 2014). However, the activity of natural enemies can also be increased due to elevated temperature (Klapwijk et al. 2012). These prey-predator and host-parasitoid systems are complex and not easily revealed (Turchin et al. 2003; Klapwijk et al. 2012). Thus, the impact of climatic anomalies on metabolism and performance of natural enemies and pine sawflies may differ, and the mechanisms of how weather affects the outbreak, are not easy to comprehend (Kollberg et al. 2014).
We assume that higher annual mean temperatures in the early 2000s (see Kersalo and Pirinen 2009), annual forest management operations leading to decreased stand size (Solberg et al. 2011; Olsson et al. 2016) and shifts in microclimate in the Palokangas area, may have had a substantial impact on the D. pini population density. Population eruption launched at the focal point of the local outbreak, and then spread according to a patchy pattern over wide areas in the Ilomantsi district. As Berryman et al. (1987) proposed, peak sawfly densities remained to oscillate around a high-density equilibrium for years, due to harsh and fragmented forest sites and mild to moderate control by their natural enemies in the Palokangas area. We assume that at some subareas, stand characteristics, such as forest floor vegetation, promoted population regulation by the natural enemies even more directly. We suggest that the effect of forest management and anomalies in the climate may have had an altering impact on conditions, predisposing the population growth rate of D. pini to an extended gradation phase in the Palokangas area. Fluctuation of population densities of hosts and natural enemies is dynamic and may vary over time. Thus, even longer study periods in unaffected forest stands are needed to draw clear conclusions.
5 Conclusions
We found that during six years of high D. pini population density, the influence of natural enemies on the cocoon stage was nearly stable. Stand characteristics, especially basal area and lichen coverage, had an impact on the performance of natural enemies, thus affecting cocoon mortality. In addition, the combined effect of forest managements and susceptible climatic conditions may have affected the prolonged outbreak.
More detailed information on different biotic and abiotic regulating factors and well-planned, long-term monitoring campaigns for conifer sawflies within controlled environmental conditions are needed for efficient forest health management. Modeled climatic conditions on pine sawfly distribution and likelihood of forest damage, impact of environmental drivers, and fulfillment of tri-trophic interactions under altered conditions must be taken into account when planning adaptation to future forest risks and forest health management practices in Fennoscandian boreal forests.
Acknowledgments
We wish to thank Antero Pasanen and Jari Tahvanainen from Tornator Ltd., who enabled this study in Palokangas area in Ilomantsi. Bert De Somviele and Anna-Maija Kokkonen kindly assisted with establishing the sampling plots in 2002 with us. We also want to thank the two anonymous reviewers for comments and the language revisor for improving the language of this paper. Thanks to Societas Entomologica Fennica, Societas Entomologica Helsingforsiensis, Societas Pro Fauna et Flora Fennica, Jouko Tuovola Foundation, Niemi Foundation, Maj and Tor Nessling Foundation and Ministry of Agriculture and Forestry project “Management of the natural resources with GEO-IT solutions” (LuHaGeoIT), decision number 922, for financial support.
References
Alalouni U., Schädler M., Brandl R. (2013). Natural enemies and environmental factors affecting the population dynamics of the gypsy moth. Journal of Applied Entomology 137(10): 721–738. http://dx.doi.org/10.1111/jen.12072.
Barbaro L., Battisti A. (2011). Birds as predators of the processionary moth (Lepidoptera: Notodontidae). Biological Control 56(2): 107–114. http://dx.doi.org/10.1016/j.biocontrol.2010.10.009.
Berryman A. (1986). Forest insects: principles and practice of population management. Plenum Press, New York. 279 p. ISBN: 0-306-42196-8.
Berryman A., Stenseth N., Isaev A. (1987). Natural regulation of herbivorous forest insect populations. Oecologia 71(2): 175–184. http://dx.doi.org/10.1007/BF00377282.
Breiman L. (2001). Random forests. Machine learning 45(1): 5–32. http://dx.doi.org/10.1023/A:1010933404324.
Bucker C.H., Turnock W.J. (1965). Avian predation on the larch sawfly, Pristiphora erichsonii (Htg.), (Hymenoptera: Tenthredinidae). Ecology 46(3): 223–236. http://dx.doi.org/10.2307/1936326.
Cajander A.K. (1926). The theory of forest types. Acta Forestalia Fennica 29. 108 p. https://helda.helsinki.fi/handle/10138/17701.
Christiansen E. (1970). Insect pests in forests of the Nordic countries 1961–1966. Norsk Entomologisk Tidsskrift 17: 153–158.
Cornell H., Bradford V., Hawkins A., Hochberg M.E. (1998). Towards an empirically-based theory of herbivore demography. Ecological Entomology 23(3): 340–349. http://dx.doi.org/10.1046/j.1365-2311.1998.00140.x.
Crawford H., Jennings D. (1989). Predation by birds on Spruce budworm Choristoneura fumiferana: functional, numerical, and total responses. Ecology 70(1): 152–163. http://www.jstor.org/stable/1938422.
Crookston N., Finley A. (2012). yaImpute: a R package for e_cient nearest neighbor imputation routines, variance estimation, and mapping. http://cran.r-project.org. [Cited 6 Apr 2016].
Cutler D.R., Edwards Jr T.C., Beard K.H., Cutler A., Hess K.T., Gibson J., Lawler J.J. (2007). Random forests for classification in ecology. Ecology 88(11): 2783–2792. http://dx.doi.org/10.1890/07-0539.1.
Dahlsten D. (1967). Preliminary life tables for pine sawflies in the Neodiprion fulvicerps complex (Hymenoptera: Diprionidae). Ecology 48(2): 275–289. http://dx.doi.org/10.2307/1933111.
Dale V., Joyce L., McNulty S., Neilson R., Ayres M., Flanningan M., Hanson P., Irland L., Lugo A., Peterson C., Simberloff D., Swanson F., Stocks B., Wotton M. (2001). Climate change and forest disturbances. BioScience 51(9): 723–734. http://dx.doi.org/10.1641/0006-3568(2001)051[0723:CCAFD]2.0.CO;2.
Demšar J. (2006). Statistical comparisons of classifiers over multiple data sets. Journal of Machine Learning Research 7: 1–30.
De Somviele B., Lyytikäinen-Saarenmaa P., Niemelä P. (2004). Sawfly (Hym., Diprionidae) outbreaks on Scots pine: effect of stand structure, site quality and relative tree position on defoliation intensity. Forest Ecology and Management 194(1–3): 305–317. http://dx.doi.org/10.1016/j.foreco.2004.02.023.
De Somviele B., Lyytikäinen-Saarenmaa P., Niemelä P. (2007). Stand edge effects on distribution and condition of diprionid sawflies. Agricultural and Forest Entomology 9(1): 17–30. http://dx.doi.org/10.1111/j.1461-9563.2006.00313.x.
Eichhorn J. (1998). Manual on methods and criteria for harmonized sampling, assessment, monitoring and analysis of the effects of air pollution on forests. Part II. Visual assessment of crown condition and submanual on visual assessment of crown condition on intensive monitoring plots. United Nations Economic Commission for Europe Convention on Long-range Transboundary Air Pollution, Hamburg, Germany.
Eveleigh E., McCann K., McCarthy P., Pollock S., Lucarotti C., Morin B., McDougall G., Strongman D., Huber J., Umbanhowar J., Faria L. (2007). Fluctuations in density of an outbreak species drive diversity cascades in food webs. Proceedings of the National Academy of Sciences 104(43): 16976–16981. http://dx.doi.org/10.1073/pnas.0704301104.
Falkowski M., Hudak A., Crookston N., Gessler P., Smith A. (2010). Landscape-scale parameterization of a tree-level forest growth model: a k-NN imputation approach incorporating LiDAR data. Canadian Journal of Forest Research 40: 184–199. http://dx.doi.org/10.1139/X09-183.
Finnish Meteorological Institute, open data service (2015). http://en.ilmatieteenlaitos.fi/open-data-sets-available. [Cited 18 Dec 2015].
Friedman M. (1937). The use of ranks to avoid the assumption of normality implicit in the analysis of variance. Journal of the American Statistical Association 32(200): 675–701. http://dx.doi.org/10.1080/01621459.1937.10503522.
Geri C. (1988). The pine sawfly in central France. In: Berryman A. (ed.). Dynamics of forest insect populations: patterns, causes and implications. Plenum Press, New York. p. 377–405. ISBN: 978-1-4899-0789-9.
Gray D. (2008). The relationship between climate and outbreak characteristics of the spruce budworm in eastern Canada. Climate Change 87(3): 361–383. http://dx.doi.org/10.1007/s10584-007-9317-5.
Grushecky S., Liebhold A., Green R., Smith R. (1998). Does forest thinning affect predatiaon on gypsy moth (Lepidoptera: Lymantriidae) larvae and pupae? Environmental Entomology 27(2): 268–276. http://dx.doi.org/10.1093/ee/27.2.268.
Hance T., Van Baaren J., Vernon P., Boivin G. (2007). Impact of extreme temperatures on parasitoids in a climate change perspective. Annual Review of Entomology 52: 107–126. http://dx.doi.org/10.1146/annurev.ento.52.110405.091333.
Hanski I. (1987). Pine sawfly population dynamics: pattern, processes, problems. Oikos 50(3): 327–335. http://dx.doi.org/10.2307/3565493.
Hanski I. (1990). Small mammal predation and the population dynamics of Neodiprion sertifer. In: Watt A., Leather S., Hunter M., Kidd N. (eds.). Population dynamics of forest insects. Intercept, Andover. p. 253–263. ISBN: 9-946707-28-6.
Hanski I., Parviainen P. (1985). Cocoon predation by small mammals, and pine sawfly population dynamics. Oikos 45(1): 125–136. http://dx.doi.org/10.2307/3565230.
Haynes K., Allstadt A., Klimetzek D. (2014). Forest defoliator outbreaks under climate change: effects on the frequency and severity of outbreaks of five pine insect pests. Global Change Biology 20(6): 2004–2018. http://dx.doi.org/10.1111/gcb.12506.
Hertz M. (1933). Tutkimuksia tavallisesta mäntypistiäisestä (Lophyrus pini L.) ja sen metsätaloudellisesta merkityksestä. [Studies of common pine sawfly (Lophyrus pini L.) and its significance in forestry]. Metsätieteellisen tutkimuslaitoksen julkaisuja 18: 1–53.
Herz A., Heitland W. (2003). Impact of cocoon predation and parasitism on endemic populations of the common pine sawfly, Diprion pini (L.) (Hymenoptera, Diprionidae) in different forest types. Agricultural and Forest Entomology 5(1): 35–41. http://dx.doi.org/10.1046/j.1461-9563.2003.00160.x.
Herz A., Heitland W. (2005). Species diversity and niche separation of cocoon parasitoids in different forest types with endemic population of their host, the common pine sawfly Diprion pini (Hymenoptera: Diprionidae). European Journal of Entomology 102(2): 217–224. http://dx.doi.org/10.14411/eje.2005.034.
Holling C.S. (1959). Some characteristics of simple types of predation and parasitism. The Canadian Entomologist 91: 385–398.
Kantola T., Vastaranta M., Yu X., Lyytikäinen-Saarenmaa P., Holopainen M., Talvitie M., Kaasalainen S., Solberg S., Hyyppä J. (2010). Classification of defoliated trees using tree-level airborne laser scanning data combined with aerial images. Remote Sensing 2(12): 2665–2679. http://dx.doi.org/10.3390/rs2122665.
Kantola T., Vastaranta M., Lyytikäinen-Saarenmaa P., Holopainen M., Kankare V., Talvitie M., and Hyyppä J. (2013). Classification of needle loss of individual Scots pine trees by means of airborne laser scanning. Forests 4(2): 386–403. http://dx.doi.org/10.3390/f4020386.
Kaltz O., Shykoff J. (2002). Within- and among-population variation in infectivity, latency and spore production in a host-pathogen system. Journal of Evolutionary Biology 15(5): 850–860. http://dx.doi.org/10.1046/j.1420-9101.2002.00433.x.
Kersalo J., Pirinen P. (2009). Suomen maakuntien ilmasto. [The climate of Finnish regions]. Ilmatieteen laitos. Raportteja: 8. Yliopistopaino, Helsinki. 196 p. ISBN–978–951–697–712–9.
Kidd N.A.C., Jervis M.A. (1997). The Impact of Parasitoids and Predators on Forest Insect Populations. In: Watt A.D., Stork E.E., Hunter M.D. (eds.). Forests and insects. Chapman and Hall, London. p. 49–68. ISBN: 0-412-79110-2.
Klapwijk M., Ayres M., Battisti A., Larsson S. (2012). Assessing the impact of climate change on outbreak potential. In: Barbosa P., Letourneau D., Agrawal A. (eds.). Insect outbreak revisited. Wiley-Blackwell, West Sussex. p. 429–450. ISBN: 978-1-4443-3759-4.
Kollberg I., Bylund H., Huitu O., Björkman C. (2014). Regulation of forest defoliating insects through small mammal predation: reconsidering the mechanisms. Oecologia 176(4): 975–983. http://dx.doi.org/10.1007/s00442-014-3080-x.
Kolomiets N.G., Stadnitskii G.V., Vorontsov A.I. (1972). The European pine sawfly: distribution, biology, economic importance, natural enemies and control. Nauka publishers, Siberian branch, Novosibirsk. [Translated from Russian]. New Delhi: Amerind Publishing Co. Springfield, Virginia. 138 p.
Kouki J., Lyytikäinen-Saarenmaa P., Henttonen H., Niemelä P. (1998). Cocoon predation on diprionid sawflies: the effect of forest fertility. Oecologia 116(4): 482–488. http://dx.doi.org/10.1007/s004420050613.
Langellotto G., Denno R. (2004). Responses of invertebrate natural enemies to complex-structured habitats: a meta-analytical synthesis. Oecologia 139(1): 1–10. http://dx.doi.org/10.1007/s00442-004-1497-3.
Larsson S., Tenow O. (1984). Areal distribution of a Neodiprion sertifer (Hym., Diprionidae) outbreak on Scots pine as related to stand condition. Ecography 7(2): 81–90. http://dx.doi.org/10.1111/j.1600-0587.1984.tb01108.x.
Lyytikäinen-Saarenmaa P., Tomppo E. (2002). Impact of sawfly defoliation of Scots pine Pinus sylvestris (Pinaceae) and associated economic losses. Bulletin of Entomological Research 92(2): 137–140. http://dx.doi.org/10.1079/BER2002154.
Lyytikäinen-Saarenmaa P., Niemelä P., Annila E. (2006). Growth responses and mortality of Scots pine (Pinus sylvestris L.) after a pine sawfly outbreak. IUFRO Kanawanza 2003 “Forest Insect Population Dynamics and Host Influences”: p. 81–85.
Långström B., Annila E., Hellqvist C., Varama M., Niemelä P. (2001). Tree mortality, needle biomass recovery and growth losses in Scots pine following defoliation by Diprion pini (L.) and subsequent attack by Tomicus piniperda (L.). Scandinavian Journal of Forest Research 16(4): 342–353. http://dx.doi.org/10.1080/02827580118325.
Mekrijärvi Research Station, Ilomantsi (2016). http://mekri.uef.fi/saa/. [Cited 8 June 2016].
Mikkonen S., Laine M., Mäkelä H.M., Gregow H., Tuomenvirta H., Lahtinen M., Laaksonen A. (2013). Trends in the average temperature in Finland, 1847–2013. Stochastic Environmental Research and Risk Assessment 29(6): 1521–1529. http://dx.doi.org/10.1007/s00477-014-0992-2.
Morris R., Cheshire W., Miller C., Mott D. (1958). The numerical response of avian and mammalian predators during gradation of the spruce budworm. Ecology 39(3): 487–494. http://dx.doi.org/10.2307/1931758.
Nemenyi P.B. (1963). Distribution-free multiple comparisons. PhD thesis, Princeton University.
Netherer S., Schopf A. (2010). Potential effects of climate change on insect herbivores in European forests – general aspects and the pine processionary moth as specific example. Forest Ecology and Management 259(4): 831–838. http://dx.doi.org/10.1016/j.foreco.2009.07.034.
Nevalainen S., Sirkiä S., Peltoniemi M., Neuvonen S. (2015). Vulnerability to pine sawfly damage decreases with site fertility but the opposite is true with Scleroderris cancer damage; results from Finnish ICP Forest and NFI data. Annals of Forest Sciences 72(7): 909–917. http://dx.doi.org/10.1007/s13595-014-0435-8.
Obrtel R., Zejda J., Holisova V. (1978). Impact of small rodent predation on an overcrowded population of Diprion pini during winter. Folia Zoologica 27: 97–110.
Olofsson E. (1986). Mortality factors in a population of Neodiprion sertifer (Hymenoptera: Diprionidae). Oikos 48(3): 297–303. http://dx.doi.org/10.2307/3565517.
Olsson P.-O., Kantola T., Lyytikäinen-Saarenmaa P., Jönsson A.M., Eklundh L. (2016). Development of a method for monitoring of insect induced forest defoliation – limitations of MODIS data in Fennoscandian forest landscapes. Silva Fennica 50(2) article 1495. http://dx.doi.org/10.14214/sf.1495.
Pirinen P., Simola H., Aalto J., Kaukoranta J.-P., Karlsson P., Ruuhela R. (2012). Climatological statistics of Finland 1981–2010. Finnish Meteorological Institute reports 2012:1. [In Finnish]. http://hdl.handle.net/10138/35880. [Cited 8 June 2016].
Pschorn-Walcher H. (1987). Interspecific competition between the principal larval parasitoids of the pine sawfly, Neodiprion sertifer (Geoff.) (Hym.: Diprionidae). Oecologia 73(4): 621–625. http://dx.doi.org/10.1007/BF00379426.
Roland J. (1993). Large-scale forest fragmentation increases the duration of tent caterpillar outbreak. Oecologia 93(1): 25–30. http://dx.doi.org/10.1007/BF00321186.
Salemaa M., Derome J., Nöjd P. (2008). Response of boreal forest vegetation to the fertility status of the organic layer along a climatic gradient. Boreal Environmental Research 13: 48–66. http://urn.fi/URN:NBN:fi-fe2016083123306.
Seehausen M.L., Bayce E., Régnière J., Berthiaume R. (2015). Short-term influence of partial cutting on hemlock looper (Lepidoptera: Geometridae) parasitism. Agricultural and Forest Entomology 17(4): 347–354. http://dx.doi.org/10.1111/afe.12113.
Sharov A. (1993). Biology and population dynamics of the Common Pine Sawfly, Diprion pini L., in Russia. In: Wagner M., Raffa K. (eds.). Sawfly life history adaptations to woody plants. Academic Press, San Diego. p. 409–429. ISBN: 0-12-730030-9.
Schehying F.R. (1995). Kleinsäuger als Prädatoren der Kiefernbuschhornblattwespe (Diprion pini (L.)). Diploma Thesis, Ludwig-Maximilians-Universität, München.
Sokal R., Rohlf F. (1995). Biometry: the principles and practice of statistics in biological research. W.H. Freeman and Company, New York. 859 p.
Solberg S., Astrup R., Lyytikäinen-Saarenmaa P., Kantola T., Holopainen M., Weydahl D., Kaartinen H. (2011). Testing TerraSAR-X for forest disturbance mapping. In: Proceedings of 4th TerraSAR-X Science Team Meeting, Oberpfaffenhofen, Germany. 8 p.
Speight M., Hunter M., Watt A. (2008). Ecology of insects: concepts and applications. 2nd edition. Wiley-Blackwell U.K. 628 p. ISBN: 978-1-4051-3114-8.
Turchin P., Wood S., Ellner S., Kendall B., Murdoch W., Fischlin A., Casas J., McCauley E., Briggs C. (2003). Dynamical effects of plant quality and parasitism on population cycles of larch budmoth Ecology 84(5): 1207–1214. http://dx.doi.org/10.1890/0012-9658(2003)084[1207:DEOPQA]2.0.CO;2.
Viitasaari M. (1982). Sahapistiäiset 1, yleinen osa. [Sawflies 1, general part]. Maatalous- ja metsäeläintieteen laitos, Julkaisuja 3. Helsingin yliopisto. 81 p. ISBN: 951-45-2513-2.
Viitasaari M., Varama M. (1987). Sahapistiäiset 4 - Havupistiäiset (Diprionidae). [Sawflies 4 – Pine Sawflies (Diprionidae)]. Maatalous- ja metsäeläintieteen laitos, Julkaisuja 10. Helsingin yliopisto. 79 p. ISBN: 951-45-4179-0.
Total of 70 references.
