Mareike Wieczorek,
Alexei Kolmogorov,
Stefan Kruse,
Inga Jacobsen,
Ingmar Nitze,
Anatoly N. Nikolaev,
Ingo Heinrich,
Luidmila A. Pestryakova,
Ulrike Herzschuh 
Disturbance-effects on treeline larch-stands in the lower Kolyma River area (NE Siberia)
Wieczorek M., Kolmogorov A., Kruse S., Jacobsen I., Nitze I., Nikolaev A. N., Heinrich I., Pestryakova L. A., Herzschuh U. (2017). Disturbance-effects on treeline larch-stands in the lower Kolyma River area (NE Siberia). Silva Fennica vol. 51 no. 3 article id 1666. https://doi.org/10.14214/sf.1666
Highlights
- Disturbances are an important shaping factor of larch stands at lower Kolyma
- Youngest larch stands have the highest population densities and highest growth rates
- Saplings grow clustered, irrespective of the underlying disturbance regime
- Mixed climate-disturbance signals make it difficult to infer future treeline processes.
Abstract
Tree stands in the boreal treeline ecotone are, in addition to climate change, impacted by disturbances such as fire, water-related disturbances and logging. We aim to understand how these disturbances affect growth, age structure, and spatial patterns of larch stands in the north-eastern Siberian treeline ecotone (lower Kolyma River region), an insufficiently researched region. Stand structure of Larix cajanderi Mayr was studied at seven sites impacted by disturbances. Maximum tree age ranged from 44 to 300 years. Young to medium-aged stands had, independent of disturbance type, the highest stand densities with over 4000 larch trees per ha. These sites also had the highest growth rates for tree height and stem diameter. Overall lowest stand densities were found in a polygonal field at the northern end of the study area, with larches growing in distinct “tree islands”. At all sites, saplings are significantly clustered. Differences in fire severity led to contrasting stand structures with respect to tree, recruit, and overall stand densities. While a low severity fire resulted in low-density stands with high proportions of small and young larches, high severity fires resulted in high-density stands with high proportions of big trees. At water-disturbed sites, stand structure varied between waterlogged and drained sites and latitude. These mixed effects of climate and disturbance make it difficult to predict future stand characteristics and the treeline position.
Keywords
stand structure;
fire;
treeline;
Larix cajanderi;
Siberia
- Wieczorek, Periglacial Research Section, Alfred Wegener Institute Helmholtz Centre for Polar and Marine Research, 14473 Potsdam, Germany; Institute of Earth and Environmental Science, University of Potsdam, 14476 Potsdam, Germany E-mail mareike.wieczorek@awi.de
- Kolmogorov, Institute of Natural Sciences, North-Eastern Federal University of Yakutsk, 677000 Yakutsk, Russia E-mail kilatroooon@gmail.com
- Kruse, Periglacial Research Section, Alfred Wegener Institute Helmholtz Centre for Polar and Marine Research, 14473 Potsdam, Germany; Institute of Earth and Environmental Science, University of Potsdam, 14476 Potsdam, Germany E-mail Stefan.Kruse@awi.de
- Jacobsen, Periglacial Research Section, Alfred Wegener Institute Helmholtz Centre for Polar and Marine Research, 14473 Potsdam, Germany; Institute of Earth and Environmental Science, University of Potsdam, 14476 Potsdam, Germany E-mail Inga.Jacobsen@awi.de
- Nitze, Periglacial Research Section, Alfred Wegener Institute Helmholtz Centre for Polar and Marine Research, 14473 Potsdam, Germany; Institute of Geography, University of Potsdam, 14476 Potsdam, Germany E-mail Ingmar.Nitze@awi.de
- Nikolaev, Institute of Natural Sciences, North-Eastern Federal University of Yakutsk, 677000 Yakutsk, Russia; Melnikov Permafrost Institute of the Siberian Branch of RAS, 677000 Yakutsk, Russia E-mail yktnan@rambler.ru
- Heinrich, GFZ German Research Centre for Geosciences, Telegrafenberg, 14473 Potsdam, Germany E-mail heinrich@gfz-potsdam.de
- Pestryakova, Institute of Natural Sciences, North-Eastern Federal University of Yakutsk, 677000 Yakutsk, Russia E-mail lapest@mail.ru
-
Herzschuh,
Periglacial Research Section, Alfred Wegener Institute Helmholtz Centre for Polar and Marine Research, 14473 Potsdam, Germany; Institute of Earth and Environmental Science, University of Potsdam, 14476 Potsdam, Germany
E-mail
Ulrike.Herzschuh@awi.de
Received 20 June 2016 Accepted 18 May 2017 Published 20 June 2017
Views 226333
Available at https://doi.org/10.14214/sf.1666 | Download PDF

Supplementary Files
1 Introduction
Temperatures in the Northern Hemisphere have increased over the last decades, especially at high northern latitudes (IPCC 2014). While treelines are known to react to climate change by advancing in warmer or retreating in colder times (e.g. Payette and Lavoie 1994; Barnekow 1999; MacDonald et al. 2000), worldwide treelines show varying responses to recent climate warming, with half of them advancing, while two are retreating (Harsch et al. 2009). Treeline advance or densification of the treeline ecotone depends on successful recruitment within or above the treeline ecotone, which on the local scale, is influenced by spatial patterns. These include inter- and intraspecific competition and facilitation (Šrůtek et al. 2002; Lingua et al. 2008) or seed dispersal patterns (Nathan and Muller-Landau 2000), but also microsite conditions after fire (Bonnet et al. 2005) or created by water-logging (Holtmeier and Broll 2012). Various biotic and abiotic influences or past climatic changes may even amplify or mask the response of treelines to climate change (Holtmeier and Broll 2005, 2007). In particular, natural disturbances such as fire or flooding, but also human impact, can completely change the forest stand patterns at a local to regional scale (Bergeron and Archambault 1993; Dale et al. 2000). However, most research is conducted on undisturbed treelines (Cullen et al. 2001).
Fires are a common phenomenon in boreal forests and fire frequency is predicted to increase under climate warming (Kasischke and Turetsky 2006; Kharuk et al. 2008; Balzter et al. 2010); (but see Bergeron and Archambault 1993). Generally, fires have the ability to suppress treeline advance (Payette and Gagnon 1985; Shankman and Daly 1988), although the strength of this effect might depend on the taxa forming the treeline (Landhäusser and Wein 1993) and the actual rate of climate warming (Arseneault and Payette 1997). For example, post-fire recruitment after high-intensity fires depends on taxa-specific traits such as the ability to survive fires as trees and/or seeds or the potential for long-distance seed dispersal (Galipeau et al. 1997; Brown and Vellend 2014). It has been suggested that fire can even promote establishment beyond the current treeline by creating new seedbeds (Landhäusser and Wein 1993). Furthermore, highest recruitment rates in mixed forests of spruce and pine have been found within a few years after a fire (Charron and Greene 2002). Stand patterns initiated in that early phase may continue for many decades (Johnstone et al. (2004). In north-eastern Siberia, fires led to variable tree densities and biomass accumulations in mid-successional stands, ranging from 0to 4 trees m–2 (Alexander et al. 2012). A simulation study of treelines in the Swiss Alps further suggests that the influence of fires as a shaping factor may almost be equal to that of climate (Schumacher and Bugmann 2006).
A peculiarity of the Siberian treeline eastwards of the Yamal Peninsula is that it lies over continuous permafrost (Abaimov 2010). Thus, besides fire, changing hydrological regimes such as those originating from permafrost degradation (Jorgenson and Osterkamp 2005; Ye et al. 2009) are of relevance for local tree stand development. While studies of North American and north-western Russian treelines suggest that permafrost degradation and subsequent drainage might favour tree establishment (e.g. Lloyd et al. 2003; Bhiry et al. 2007; Wilmking et al. 2012), comparable studies from Siberian treelines are lacking. Permafrost degradation and wetter soils, however, may lead to decreasing tree performance (Iijima et al. 2014). Furthermore, Walter et al. (2006) found a 14.7% increase in lake area around Chersky between 1974 and 2000 due to thermokarst processes, and therefore flooding from the draining of lakes or river changes might be of relevance for treeline transitions even at a broad scale. Crawford et al. (2003) concluded that in northern oceanic environments, ongoing climate warming is likely to result in paludification and consequently forest retreat, instead of advance.
Few studies have dealt with treeline dynamics in north-eastern Siberia (Harsch et al. 2009; compare Berner et al. 2013) and those available mainly focussed on growth trends or biomass accumulation patterns (e.g. Alexander et al. 2012; Berner et al. 2012, 2013). Our analyses were conducted along a latitudinal gradient in the lower Kolyma river area, where Larix cajanderi Mayr is the only tree taxon. All studied sites were subjected to disturbances by fire or water at different intensities. We aim to investigate whether latitude (as a proxy for climate) or disturbances shape larch-stand patterns in this northern treeline ecotone. In this context we (i) applied uni- and bivariate point pattern techniques, to identify spatial patterns within and between the life stages of larches, (ii) identified changes in the age and size structure of larches and tested whether variances in stand structure values are best explained by latitude or by disturbance type and intensity and (iii) discuss how climate change might influence the disturbance regimes themselves.
2 Material and methods
2.1 Study area and field data collection
The study area is located in the lower Kolyma River area (68°23´N–69°08´N and 161°01´E–161°28´E, Fig. 1) and extends over an area of 1430 km². The climate is continental, with long, cold winters (mean January temperature –32.6 °C), and short, warm summers (mean July temperature 12.7 °C). Annual mean temperature is –10.6 °C and annual precipitation is low at 205 mm, half of it falling between May and September (Chersky meteorological station 1961–2015, station number 251230, http://www.ncdc.noaa.gov). As the meteorological record is relatively incomplete, only years with less than 10 missing days per month were used to calculate mean values. Mean annual temperatures are exceptionally warm since the new millennium, reaching –11.4 °C prior to 2000, and –9.4 °C from 2000–2015. The whole region is underlain by continuous permafrost, up to 300 m thick (Brown 1960).
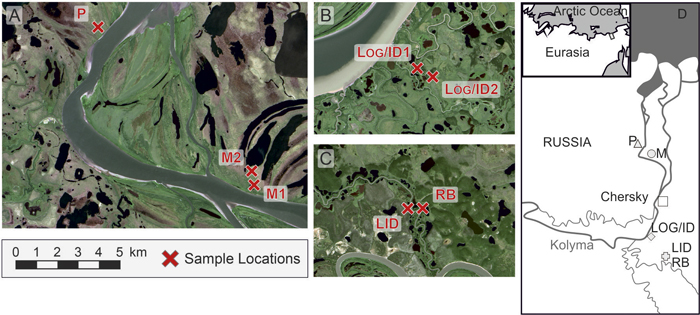
Fig. 1. Locations of the study sites. A) Water disturbed sites in the northern study area, B) Sites influenced by logging and fire, C) Old, low disturbed site LID and water disturbed site in close proximity, D) Regional setting. Site codes: LID = Low Intensity Disturbance, RB = River Bank, Log/ID = Logging/Intense Disturbance 1&2, M = Meander 1&2, P = Polygon.
Data on L. cajanderi stand structures were collected during three weeks in summer 2012. Sites were chosen to represent different disturbance regimes according to satellite images, correspondence with local inhabitants and site investigations. Altogether, seven sites (plots) of varying size were investigated in four areas. We recorded at least 30 trees (size-class definitions: seedling < 40 cm, sapling 40–200 cm, tree ≥ 200 cm) from a minimum area of 250 m². At all sites, height, basal diameter (right above the root collar), vitality (alive, dead), and, for individuals larger than 130 cm, diameter at breast height (DBH) were recorded for all individuals. Tree crown cover was estimated by measuring the longest crown axis, the length of its perpendicular axis and calculating the resultant area. Exact positions within each site of trees and saplings were mapped in the field. Seedlings were recorded in at least half of each site, but the positions were only recorded at a 4 m² subplot level. Upright dead trees and tree stumps were recorded including their exact positions and dead trees lying on the ground were recorded as dead wood ground cover. We collected tree discs at ground level or complete specimens of 126 individuals representatively across all sites and size classes (see definition above). Understorey vegetation was recorded and active layer depth, i.e. the depth of unfrozen ground above the permafrost table, measured at a 4 m² subplot level.
2.2 Site description
The Low Intensity Disturbance (LID) site (68°23´N, 161°27´E) was positioned on a dry hilltop, with a mean elevation of 30 m a.s.l. and active layer depth ranging from 16 to 80 cm. The soil was mainly covered by lichen (90%) and understorey vegetation consisted of e.g. mosses, Betula nana L., Ledum palustre L. and Poaceae. Larch trees and saplings were recorded in a 14 m × 20 m plot. Half of the trees on the plot were dead, and discs of two dead trees were dated to have died in the late 1950s. Although no fire scars were detected, the small crowns of the trees (see Supplementary file: Figure S2) hint to a low intensity crown fire at this site.
The Logging/Intense Disturbance 1 (Log/ID1, 68°31´N, 161°11´E) and Logging/Intense Disturbance 2 (Log/ID2, 68°31´N, 161°12´E) sites were situated between two small channels of the Kolyma River, at an elevation of 22 m a.s.l. At Log/ID1, the active layer depth ranged from 30 to 73 cm; at Log/ID2 from 41 to 89 cm. The soil at both sites was densely covered by needles (>95%). Large Salix shrubs were growing in patches within the forest, dominating larch-free patches at Log/ID 2. The understorey vegetation included mosses and Pyrola spp. Larch trees and saplings were recorded from a 16 m × 20 m plot (Log/ID1) and a 16 m x 16 m plot (Log/ID2), but no age data were retrieved from the second site. Both sites lie in a region that was completely logged in the 1950s (local knowledge). Fire scars on cut edges of the tree stumps indicate a post-logging fire. No signs of fire were found on living trees or dead wood other than stumps.
The River Bank (RB) site (68°23´N, 161°28´E) was situated on a cut bank ~4 m above river level and in close proximity to a drained lake. Field and satellite image inspections led to the conclusion that water discharge into the river might have led to conditions which were dry enough to sustain tree growth, while the area surrounding the lake is too wet for larch. No signs of fire were discovered. The mean elevation is 17 m a.s.l. and the active layer depth ranged from 27 to 49 cm. The soil was almost completely covered by needles (>98%) and dead wood. Large Alnus shrubs were growing within the forest. Understorey vegetation included Pyrola spp., Poaceae and Ribes triste Pall. Larch trees and saplings were recorded from a 20 m × 20 m plot, but dendrochronological samples were only retrieved from adult trees.
The Meander1 (M1, 69°03´N, 161°13´E) and Meander2 (M2, 69°03´N, 161°12´E) sites are part of a wet, old river loop with polygonal structures. We found a few stumps, indicating moderate anthropogenic influence. At M1, the active layer depth ranged from 15 to 60 cm; mean elevation is 19 m a.s.l. At M2, active layer depth and mean elevation were not measured. The soil at both sites was mainly covered by mosses (>70%), and the understorey vegetation consisted of e.g. Cyperaceae, Alnus spp., Ledum palustre L. and Empetrum spp. Larch trees and saplings at M1 and M2 were recorded from 20 m × 20 m and 20 m × 24 m plots, respectively. Fire signs were detected on stumps only.
The Polygon (P) site (69°07´N, 161°01´E) was situated in a polygonal field with larches growing on polygon rims. As the tree density was sparse, no plot was demarcated, but we walked from tree to tree and searched for seedlings nearby, covering an area of 0.8 km². Twenty randomly placed 4 m² tree-free subplots were placed around the trees, to search extensively for seedlings. The active layer depth ranged from 13 to 57 cm and the soil was mainly covered by mosses (>76%). The understorey vegetation included Empetrum spp., Poaceae, Cyperaceae, Betula nana L. and Vaccinium vitis-idaea L. Increment cores were taken at breast height, but no basal rings were analysed. As no correction for missing piths has been made, only minimum ages can be inferred.
2.3 Dendrochronological approach
Discs were polished and ring width measured with a mechanical measuring table (Lintab, F. Rinn SA, Heidelberg, Germany) and WinDendro software. Samples were first cross-dated visually to detect missing rings and then checked with the help of Cofecha (Holmes 1983). Thin-sections of small individuals were dyed with astra blue and safranin, and rings were counted under a Zeiss light microscope and with WinDendro software. The ages of all trees were estimated with the help of age models, based on site-specific regressions (Suppl. file: Figure S1).
2.4 Statistical analyses
All analyses were conducted on larch only. Unless noted otherwise, only living individuals were used for statistical analyses.
Spatial point patterns, like the positions of trees within a forest patch, can be investigated using second-order statistics (Diggle 2003; Wiegand and Moloney 2013), for example Ripley’s K-function (Ripley 1977) or the pair-correlation function (Stoyan and Stoyan 1994). We used univariate and bivariate point-pattern techniques to characterise spatial patterns within and between different life stages. The univariate Besag’s L-function L11(r) (Besag 1977), a transformation of Ripley’s K-function K11(r) (Ripley 1977), calculates the cumulative number of points within a distance r from a given point, divided by the overall intensity of the pattern and corrected for edge effects with isotropic edge corrections (Ripley 1977). Additionally, we used the pair-correlation function g11(r) (Stoyan and Stoyan 1994). This calculates the probability of finding trees at a given distance to another tree, using all inter-point distances, and is corrected for edge effects.
To determine spatial patterns of trees, saplings and dead trees/stumps and their relationship at different successional stages, we applied the bivariate L-function [L12(r)] and g-function [g12(r)] with isotropic edge correction and independence approach (Lotwick and Silverman 1982). At the LID site with 50% dead trees we used the random labelling approach (Besag and Diggle 1977), which does not shuffle tree positions, but tree labels (e.g. “dead” and “alive”) to gain information on the influence of the growing-position on a tree being dead or alive.
All spatial analyses were carried out up to ¼ of the shortest plot side, up to a maximum of 5 m. In the univariate analyses we tested against the null hypothesis of complete spatial randomness (CSR), which would result in L11(r) = r and g11(r) = 1, respectively. Values > r (or >1) indicate more inter-point distances at r than expected under CSR and thus clustering, values < r (or <1) indicate less inter-point distances at r than expected under CSR and thus segregation. For the bivariate cases, values > r (or >1) indicate positive spatial associations (attraction) of the two size classes, while values < r (or <1) indicate negative spatial associations (repulsion).
To create Monte Carlo simulation envelopes, we conducted 199 simulations (nsim) and used the fifth-highest and fifth-lowest simulated value for the confidence envelope (nrank), resulting in p = 0.05 (alpha = 2 × nrank/(1 + nsim); (Baddeley et al. 2015). The same number of points as found in the data was used for the simulated patterns. The spatial patterns were further assessed with a global goodness-of-fit test for maximum absolute deviation (Ripley 1977); mad.test in spatstat-package (Baddeley and Turner 2005). At the RB site we found only 13 saplings 11 of which were dead, thus the sapling pattern at this site was excluded from spatial analyses. At site LID the positions of 1 sapling and 2 trees were not noted, nor, at site LOG/ID1, the positions of 6 trees and these individuals are not considered in the spatial analyses.
The biomass of living trees and saplings was calculated according to Alexander et al. (2012) with the function:
total_biomass = 39.46 × basal_diameter2.26.
Linear mixed-effect modelling was used to investigate the influence of disturbing factor and disturbance intensity or transect position on stand, describing values such as tree size or density with site as random factor. For this purpose, the two areas where we have two replicated sites (Log/ID and M) were pooled into one site each to allow the analysis of individual tree data such as height and also stand data such as total biomass. As disturbance type and transect are highly correlated, we made two separate analyses and chose the better model with the help of Akaike’s Information Criterion (AIC). The model with the smallest AIC and the lowest number of degrees of freedom was chosen as the best fitting model.
All statistical analyses were conducted in R (R Core Team 2015). For better comparability between different plot sizes, stand values were normalised to 1 ha. Growth rates of trees at the different sites were compared by age~diameter relationships. For spatial analyses we used the spatstat package (Baddeley et al. 2015); linear mixed-effect modelling was conducted with lme4 (Bates et al. 2015).
3 Results
3.1 General stand characteristics and age structure
The highest mean tree height was found at the RB site, while the smallest trees were found in M1&2 and P (Table 1). In contrast, the mean DBH was large at LID, RB and P and small at M1. Large DBH values and small tree heights at P are probably a result of dead apical meristems found in many trees.
| Table 1. Larch stand parameters of the different sites. Stand values except for age, height, and diameter at breast height (DBH) have been scaled up to one hectare. Disturbing factor, intensity and transect position indicate the fixed effects used for mixed effect modelling (see Table 2). Site codes: LID = Low Intensity Disturbance, RB = River Bank, Log/ID = Logging/Intense Disturbance 1&2, M = Meander 1&2, P = Polygon. | |||||||
| Site | LID | Log/ID1 | Log/ID2 | RB | P | M1 | M2 |
| disturbing factor | fire | new land | water | ||||
| intensity | low | strong | medium | ||||
| transect position | south | middle1 | south | north | middle2 | ||
| Mean tree height [cm] | 554.8 | 607.9 | 638.1 | 819.7 | 354.3 | 333.2 | 385.6 |
| Mean tree DBH [cm] | 7.6 | 5.0 | 5.4 | 7.2 | 7.2 | 3.8 | 4.8 |
| Mean age (regression) | 213.1 | 37.3 | 37.9 | 59.3 | 57.4 | 67.3 | 44.0 |
| Max. age (measured) | 302 | 44 | na | 70 | 162 | 125 | 161 |
| Max. age (regression) | 386.3 | 44.9 | 45.3 | 69.0 | 162.0 | 124.0 | 160.0 |
| Basal area [m² ha–1] | 6.0 | 20.5 | 19.7 | 25.7 | 0.0 | 1.7 | 1.6 |
| Crown cover [% ] | 20.9 | 142.4 | 136.8 | 164.5 | 0.0 | 17.4 | 17.8 |
| Total biomass [kgC ha–1] | 9613.2 | 29292.0 | 30071.1 | 38368.9 | 4.7 | 3778.2 | 4593.8 |
| No. alive ha–1 | |||||||
| Trees | 1035.7 | 7343.8 | 6093.8 | 4575.0 | 0.4 | 1125.0 | 615.4 |
| Saplings | 2035.7 | 625.0 | 468.8 | 50.0 | 0.1 | 1625.0 | 519.2 |
| Seedlings | 5500.0 | 4150.0 | 4218.8 | 3800.0 | 0.1 | 825.0 | 153.8 |
| No. dead ha–1 | |||||||
| Trees | 1071.4 | 0.0 | 156.3 | 600.0 | 0.0 | 50.0 | 19.2 |
| Saplings | 35.7 | 281.3 | 117.2 | 275.0 | 0.0 | 50.0 | 19.2 |
| Stumps | 0.0 | 1000.0 | 2695.3 | 0.0 | 0.0 | 175.0 | 38.5 |
At all sites except P, seedlings occurred at high frequencies (Table 1). Highest densities of saplings and seedlings were found at the LID site where small individuals comprised 88% of all larch individuals. At the RB site, no recruits between 4 cm and ~150 cm height were found. Highest tree densities were found at the two Log/ID sites. In general, tree-to-recruit ratios were less than 1 on the older sites (LID, M1&2) and greater than 1 on younger sites (Log/ID1&2, RB), where the highest amount of total biomass was also found (Table 1). The lowest larch density and biomass amount were found at P.
While most stand variables can best be described by including disturbing factor and intensity as fixed factors, tree height is best explained by disturbing factor alone, with the smallest trees growing on water-affected sites. DBH and the number of stumps per ha are best explained by transect position (Table 2), with highest values at the southern and the northern sites.
| Table 2. Linear mixed models for the different variables. Stand values except for age, height, and diameter at breast height (DBH) have been scaled up to one hectare. Disturbing factor, intensity and transect position indicate the fixed effects. All analyses were conducted on larches only. Site codes: LID = Low Intensity Disturbance, RB = River Bank, Log/ID = Logging/Intense Disturbance 1&2, M = Meander 1&2, P = Polygon. View in new window/tab. |
Growth rates generally decrease with increasing stand age (Figs 2, 3) as trees at the younger sites (Log/ID1&2, RB) reached high diameter values much earlier than those at the older LID site. Comparing size and age distributions of the different sites suggests coherence for site history, with the four older sites (LID, M1&2, P) being similar, as well as the three younger sites (Fig. 3). Age, height and DBH distributions at LID have reversed J-shaped curves, as a result of much larger numbers of smaller and younger larch trees. In contrast, at M1&2, DBH and age distributions are skewed (Fig. 3), indicating increasing recruitment success until ~1980 with a sharp drop afterwards. Height distributions likewise progressively resemble a reverse-J shaped curve with low but increasing numbers of small individuals. Age and DBH distributions at the P site indicate sporadic recruitment before ~1900 but better reproductive success and recruitment afterwards. Bimodal age distributions at the two Log/ID sites give rise to even-aged stands, where most trees established 30–50 years ago, but with a second peak of very young individuals (<10 years). While DBH distributions are fairly linear, height curves are bimodal with a pronounced peak of larches <50 cm tall and a broad, shallow peak of 5–10 m tall trees. Similar distribution patterns are seen in the RB data.
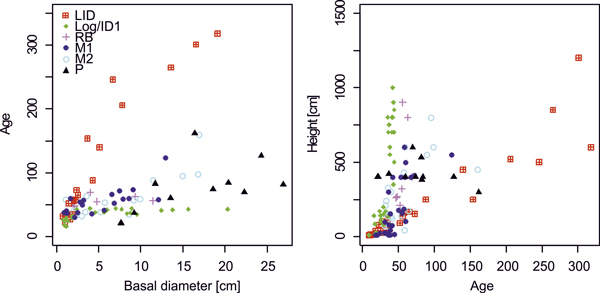
Fig. 2. Age-basal diameter and height-age relationships of larches at differently disturbed sites. Note that age values for the P site (black triangles) are taken from breast height. Site codes: LID = Low Intensity Disturbance, RB = River Bank, Log/ID = Logging/Intense Disturbance 1&2, M = Meander 1&2, P = Polygon.
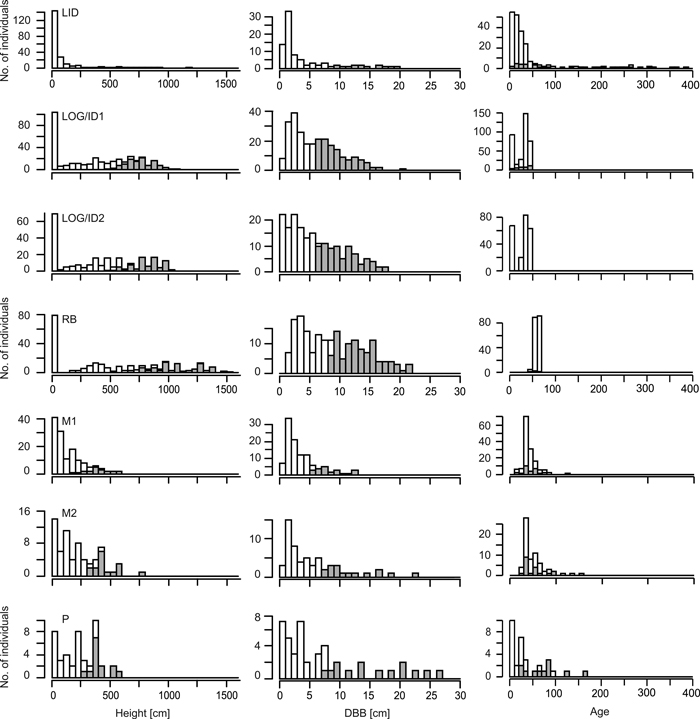
Fig. 3. Stand values of living larches at the seven sites. Height values are given in 50 cm, basal diameter (DBB) in 1 cm and age values in 10 year bins. Grey bars for height and DBB indicate trees with height/DBB > site-specific median of trees. Grey bars for age data indicate measured individuals, while values for white bars are gained by regression analysis (see Suppl. file: Figure S1). Note that age values for the P site are taken from breast height. Note the different y-axes between sites. Site codes: LID = Low Intensity Disturbance, RB = River Bank, Log/ID = Logging/Intense Disturbance 1&2, M = Meander 1&2, P = Polygon
3.2 Spatial patterns
3.2.1 Univariate spatial patterns
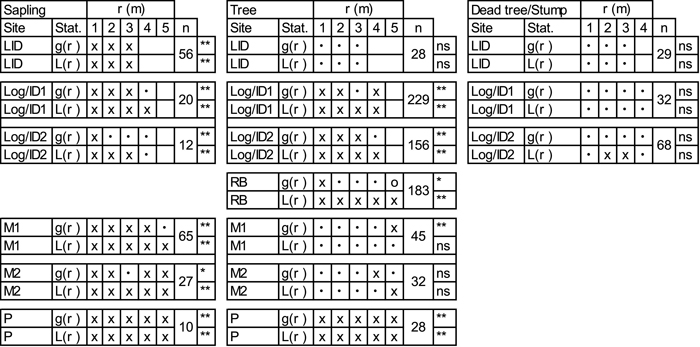
According to the univariate pair-correlation function (g11(r)) and the L-function (L11(r)) (Table 3; Suppl. file: Figure S3), saplings at all sites show clumped patterns. Goodness-of-fit tests further indicate significant departures from random patterns. Inferred spatial patterns of trees vary between sites (Table 3; Suppl. file: Figure S4). Univariate g11(r) and L11(r) indicate clustering of trees at the young RB and Log/ID1&2 sites. No pattern is seen at the LID site and trees are randomly distributed at sites M1&2 at most scales analysed. Trees at the P site are significantly clumped. Dead trees and tree stumps show no deviations from CSR according to the goodness-of-fit (Table 3; Suppl. file: Figure S5).
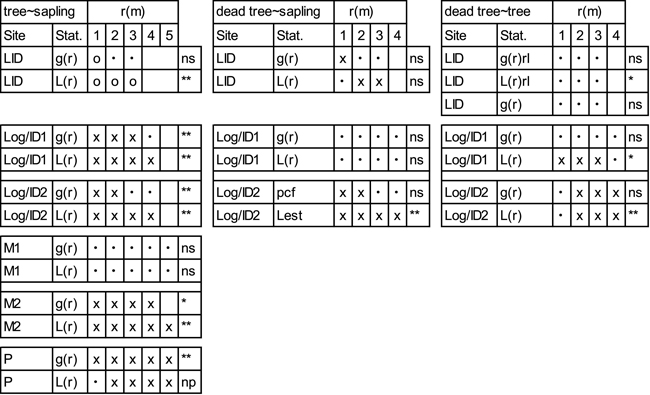
| Table 3. Univariate analyses of living larch saplings (40–200 cm tall), trees (≥200 cm) and dead trees (LID) or stumps (Log/ID) with pair-correlation function (g(r)) and L-transformed Ripley’s K-function (L(r)). Values are given for the pattern at each full metre. For more spatial details, please see Suppl. file: Figures S3–S5. x = clustering at the given scale (1–5m), o = segregation and • = random pattern. Stars indicate goodness-of-fit significance levels: *<0.05, **<0.01; n = number of tested individuals. Site codes: LID = Low Intensity Disturbance, RB = River Bank, Log/ID = Logging/Intense Disturbance 1&2, M = Meander 1&2, P = Polygon. |
 |
3.2.2 Bivariate spatial patterns
While the g12(r) and L12(r) functions both indicate negative spatial associations between trees and saplings at the LID site, the overall pattern is only significant for L12(r) (Table 4; Suppl. file: Figure S6). Positive spatial associations between saplings and trees prevail at Log/ID1&2. While tree-sapling associations at M1 are random, positive associations are prevalent at M2. At site P, a positive association between saplings and trees is demonstrated at all scales. In contrast, overall patterns between saplings and dead trees/stumps (Table 4; Suppl. file: Figure S7), show no pattern according to the goodness-of-fit, despite L12(r) at Log/ID2 showing positive associations from one metre outwards. Positive associations are also indicated by g12(r) and L12(r) at LID. Associations of dead trees/stumps and trees are variable (Table 4; Suppl. file: Figure S8) and – despite a positive goodness-of-fit – random at site LID. At the Log/ID1&2 sites, they are clumped at/after ~1.5 and 2 m, respectively according to g12(r) and L12(r) (Suppl. file: Figure S8).
| Table 4. Bivariate analyses of trees and saplings, dead trees (LID) or stumps (Log/ID) and saplings and of dead trees (LID) or stumps (Log/ID) and trees with pair-correlation function (g(r)) and L-transformed Ripley’s K-function (L(r)). At site LID, a random labelling approach (rl) was additionally used. Values are given for the pattern at each full metre. For more spatial details, please see Suppl. file: Figures S6–S8. x = clustering at the given scale (1–5m), o = segregation and • = random pattern. Stars indicate goodness-of-fit significance levels: *<0.05, **<0.01. Site codes: LID = Low Intensity Disturbance, RB = River Bank, Log/ID = Logging/Intense Disturbance 1&2, M = Meander 1&2, P = Polygon. |
 |
4 Discussion
4.1 Spatial patterns vary between life stages and disturbance regimes
With our analyses, we identified uni- and bivariate spatial patterns of three larch life stages (saplings, trees and dead trees/stumps) under different types of disturbance regime. We were able to show that univariate patterns of trees differ between disturbance intensity, while sapling recruitment is clustered at small spatial scales across all sites and disturbance regimes. A similar result was noted in the Pyrenees, where recruitment patterns were similar between disturbed and undisturbed regions (Batllori et al. 2010). Furthermore, it has been shown that regeneration at alpine treelines often occurs in clusters (e.g. Mast and Veblen 1999; Zhang et al. 2009), while spatial patterns can be further influenced by disturbance type (e.g. fire intensity) and time since last disturbance (Kuuluvainen and Rouvinen 2000). All northern sites were located in wetlands, where larch growth is constrained by wet soil conditions. At P, the most extreme site, all size classes grow clumped at all scales. Clustering at this site can most probably be attributed to terrain, with larch recruitment limited to dry polygon rims (Zibulski et al. 2013; Frost and Epstein 2014). At such sites, seedlings are also in competition with a dense herbaceous layer (Bell et al. 2000). However, P is a special case, as underlying site conditions and the few larches at the larger spatial scales make it difficult to infer any second-order spatial patterns, and thus the results might be biased by random noise. At site M, the slightly clumped structure of saplings is most probably related to environmental heterogeneities in the wet environment. It is known that in unfavourable environments, competition may switch to facilitation, leading to tree islands – a pattern found at climatic and hydrologic treelines (Resler and Stine 2009 and references therein). Furthermore, once a tree has established, it usually improves its local environment, further enhancing tree recruitment (Bekker 2005). This might especially apply to saplings at sites M2 and P, which grow aggregated around trees.
The spatial analysis of the intensively disturbed sites Log/ID and RB show clumped patterns of trees. While saplings were virtually lacking at RB, they were positively associated with trees at Log/ID sites. In previous studies it was found that dead wood may serve as a seed bed (Johnson and Yeakley 2013). While we found a tendency of tree-clustering around stumps 10–20% of the seedlings growing at these two sites further germinated in dead wood remains (data not shown here). Bonnet et al. (2005), for example, showed that success of regeneration after fire was not only dependent on seed availability, which decreased with distance from unburned patches, but also on environmental conditions, including scorched litter on burned mineral soil and a high cryptogam cover, while exposed burned mineral soil and a dense understorey decreased recruitment success. While we found no fire marks at the RB site, large Alnus shrubs grew in treeless spots. Alnus is known to hamper larch recruitment (Goldammer and Furyaev 1996) and might be the underlying reason for tree clumping here.
At the comparably low disturbed site LID, recent recruits (saplings) grow clustered from 0–3 m and show a significant negative association to living trees. Although L. cajanderi is light-demanding, seedlings can persist under closed forest canopies (Osawa et al. 2010) and can even grow to full tree height when a gap with sufficient light and growing space is available (Ban et al. 1998). However, the studied LID site did not have a dense tree cover, even when combining living and dead trees, so the light-gap theory does not satisfactorily explain our pattern. On the other hand, this result is in agreement with findings of (Kuuluvainen and Rouvinen 2000), who attributed this separation effect to interference zones around large trees. The LID site was positioned on a rather dry hilltop with dense understorey vegetation, so competition for water might have been the driving factor behind the development of this spatial pattern.
4.2 Stand structure is influenced by disturbance regime and intensity
Regional temperature is the most important factor in determining the natural treeline (MacDonald et al. 2008) and tree density decreases along the treeline ecotone (Šrůtek et al. 2002; Devi et al. 2008; Batllori et al. 2009). By analysing larch stand structure along a latitudinal transect, which could serve as proxy for temperature, with sites impacted by various disturbances, we found that these fire and water-related disturbances and their different intensities affect local stand characteristics to a greater degree than transect position. Furthermore, even at the northernmost site P, larches had ages over 160 years (at breast height), indicating that the position of the treeline is not currently shifting northwards.
All studied sites were impacted by disturbances and most stand variables best described by disturbance type and intensity. From local knowledge it is known that intensive logging in the 1950s led to large tree-free areas at Log/ID sites. Scorch marks on remaining logged stumps indicate that the sites must have been burnt after this logging event, but no other burned wood was found, thus we cannot make assumptions on the pre-fire stand structure or fire frequency. Berner et al. (2012), however, showed evidence for fires in the 1970s in the larger area. At the RB site, new land became available for forest colonisation ~60 years ago. Although the main processes behind this site development remain unknown, it seems likely that high water discharge from the cut bank into the river led to drier sites on the river bank, while areas around the lake remained too wet for larch growth. The strong disturbances and influences at Log/ID and RB, which resulted in new land becoming available for colonisation, led to the highest tree densities of all studied sites. The capability of reaching high stand densities within a few decades after a disturbance is in agreement with observations by Alexander et al. (2012) and might be attributed to a lack of competition in the early stand-development phase (Goldammer and Furyaev 1996). Large establishment pulses are further known to follow stand-replacing fires under good conditions (Johnstone et al. 2004). At the Log/ID and RB sites, age curves show a sudden and high amount of recruitment, with a sharp drop afterwards. Diameter curves at these sites, however, rather resemble those of relatively uneven-aged stands (Shorohova et al. 2009; Drössler et al. 2016), caused by highly variable growth rates of the single trees. The few recorded saplings at these sites might be attributed to the pronounced crown cover and resultant shading (Osawa et al. 2010).
Lowest densities were found at the water-disturbed sites M and P, which might be attributed water-logging and thus less favourable habitats for recruitment (Ohta et al. 2014) or to a lack of available seeds, as these sites had considerably fewer larch trees in the surrounding area than the more southerly stands (Hansen et al. 2013 and own observation). This finding is in concordance with (Kirdyanov et al. 2013), who found low growth rates in a wet riparian zone, in contrast to high tree growth rates on a river bank and terrace, within a short 100 m long transect. But while recruitment has been increasing in recent years at the polygonal site P, sites M1&2 experienced a drop in the last 20 years. Not only recruitment, but also growth was partly restricted, resulting in larches with an age of 38 years, but only 11 cm tall. Consequently, neither height nor diameter distributions can give any insight into the recruitment history of the different plots. The finding of decreasing recruitment success at sites M1&2 might be in concordance with satellite data, which indicate decreasing tree density in the region around Chersky, while shrub cover increases (Frost and Epstein 2014). Hansen et al. (2013) also estimated high losses of tree cover in our study area, as can be seen in their global map of forest cover change. From our observations in the field, however, it seems that forest cover from these satellite data is over-estimated for our study area, possibly being confounded by, for example, tall shrubs. Thus a loss of forest cover as determined from satellite images could be depicting places with intensive wildfires, as observed on the river bank opposite Chersky (own observation), but does not necessarily mean a loss of larch in general.
With respect to the intensity of disturbances, the LID site was probably the least disturbed. Here a fire event probably occurred in the late 1950s (which we infer from small tree crowns and two dated dead trees) that killed all recruits and half the adult trees. While 50% of the trees were dead, age and size distributions match well, resembling that of a natural, uneven-aged forest stand (Shorohova et al. 2009). Growth rates were much less variable than at the other sites, indicating common growing conditions for all individuals.
4.3 Climate change might influence disturbance regimes
Disturbances are the main driving factor in the landscape of the lower Kolyma in north-eastern Siberia, while the direct influence of climate seems to be of minor importance. However, climate change can impact the prevailing disturbance regimes. Wildfires in boreal forests, for example, have been found to increase over recent decades (Gillett et al. 2004) and were predicted to increase further in the future in parts of the circumboreal forest (Flannigan et al. 2009); this will have various consequences for forests at the treeline. Changing fire return intervals, for example, can lead to decreased seed availability (Brown and Johnstone 2012). While some studies found that fires led to decreasing recruitment success (Sirois and Payette 1991) or to a change in competition with increasing invasion of broad-leaved vegetation (Johnstone et al. 2010), others found that tree density after a fire led to high accumulations of biomass (Pare and Bergeron 1995). Ground fires following a stand-replacing fire, after which only the tallest trees survive, might even enhance the growth of larch trees (Schulze et al. 2012). A dense forest will then lead to a lower albedo and thus even higher temperatures (Otto et al. 2011). Although increasing tree density as a result of climate warming can lead to more intense fires, this seems not to apply to Russian wildfires, which might be because of the high incidence of ground fires (Wooster and Zhang 2004). As we found highest tree densities on those sites where new land was available for colonisation, it seems possible that increasing fire frequencies might be buffered by the strong recovery potential of these sites. If, however, only ground fires occur, tree density might strongly decrease, as can be inferred from low densities and slow regeneration processes at the LID site.
Higher temperatures might also lead to diverse reactions in periglacial wetlands: either to an increase in wet area due to permafrost thawing (Baltzer et al. 2014) or to a reduction of wetlands (Erwin 2008). A reduction in wetland can be manifest either as drained areas becoming too dry to sustain larch growth (Kharuk et al. 2015) or as an increase in favourable habitats for tree growth, which were previously too wet (e.g. site RB). Additionally, fires may lead to further permafrost degradation (Myers-Smith et al. 2008). We already saw a recruitment decline at the wet sites M1 and M2. As a result, the outcome of future stand patterns in the lower Kolyma area is highly speculative, due to the impact of climate change on the prevailing disturbance regimes. We have not seen a recent northward advance, and if recruitment and growth patterns stay as unfavourable as in recent years at site M, tree dieback and even treeline retreat are possible.
5 Conclusions
Our analyses of stand structure and spatial patterns highlight the complexity of the processes and factors influencing the formation of the treeline. We observed that tree regeneration is clustered at all sites, but not necessarily around living or dead trees. While high-intensity fires and drainage led to extremely high population densities and a subsequent decrease in recruitment intensity – probably due to competition – fires of lower intensity led to increasing but comparably lower recruitment success. Reproductive success at the northernmost sites in wetland areas might be influenced by climate change, changes in water disturbance regimes or a combination of both. These interactions of climate and the various disturbances make it difficult to predict future stand characteristics and the treeline position.
Acknowlegements
The study was supported by Helmholtz Gemeinschaft, Deutsche Forschungsgemeinschaft, the Russian Ministry of Education and Science (Task No 5.2711.2017/PCh) and the Project financing of North-Eastern Federal University (Regulation SMK-P-1/2-242-17 Ver. 2.0, Order No 494-OD, 2.05.2017). I. Nitze was supported by the European Research Council ERC#338335 and the European Space Agency (ESA GlobPermafrost). We thank the people of Pokhodsk for their hospitality and our local rangers for supporting us in the field. Many thanks go to the two anonymous reviewers, who gave us valuable critique during the writing process and to C. Jenks for English proofreading.
References
Abaimov A.P. (2010). Geographical distribution and genetics of siberian larch species. In: Osawa A., Zyryanova O.A., Matsuura Y., Kajimoto T., Wein R.W. (eds.). Permafrost ecosystems: Siberian larch forests. Ecological Studies, Springer Netherlands. p. 41–58.
Alexander H.D., Mack M.C., Goetz S., Loranty M.M., Beck P.S.A., Earl K., Zimov S., Davydov S., Thompson C.C. (2012). Carbon accumulation patterns during post-fire succession in cajander larch (Larix cajanderi) forests of Siberia. Ecosystems 15(7): 1065–1082. https://doi.org/10.1007/s10021-012-9567-6.
Arseneault D., Payette S. (1997). Reconstruction of millennial forest dynamics from tree remains in a subarctic tree line peatland. Ecology 78(6): 1873–1883. https://doi.org/10.1890/0012-9658(1997)078[1873:ROMFDF]2.0.CO;2.
Baddeley A., Turner R. (2005). spatstat: an R package for analyzing spatial point patterns. Journal of Statistical Software 12(6). 42 p. https://doi.org/10.18637/jss.v012.i06.
Baddeley A., Rubak E., Turner R. (2015). Spatial point patterns: methodology and applications with R. CRC Pres.
Balzter H., Tansey K., Kaduk J., George C., Gerard F., Gonzalez M.C., Sukhinin A., Ponomarev E. (2010). Fire/climate interactions in Siberia. In: Balzter H. (ed.). Environmental change in Siberia, advances in global change research. Springer Netherlands. p. 21–36.
Baltzer J.L., Veness T., Chasmer L.E., Sniderhan A.E., Quinton W.L. (2014). Forests on thawing permafrost: fragmentation, edge effects, and net forest loss. Global Change Biology 20(3): 824–834. https://doi.org/10.1111/gcb.12349.
Ban Y., Xu H., Bergeron Y., Kneeshaw D.D. (1998). Gap regeneration of shade-intolerant Larix gmelini in old-growth boreal forests of northeastern China. Journal of Vegetation Science 9(4): 529–536. https://doi.org/10.2307/3237268.
Barnekow L. (1999). Holocene tree-line dynamics and inferred climatic changes in the Abisko area, northern Sweden, based on macrofossil and pollen records. The Holocene 9(3): 253–265. https://doi.org/10.1191/095968399676322637.
Bates D., Machler M., Bolker B., Walker S. (2015). Fitting linear mixed-effects models using {lme4}. Journal of Statistical Software 67(1). 48 p. https://doi.org/10.18637/jss.v067.i01.
Batllori E., Blanco-Moreno J.M., Ninot J.M., Gutiérrez E., Carrillo E. (2009). Vegetation patterns at the alpine treeline ecotone: the influence of tree cover on abrupt change in species composition of alpine communities. Journal of Vegetation Science 20(5): 814–825. https://doi.org/10.1111/j.1654-1103.2009.01085.x.
Batllori E., Camarero J.J., Gutiérrez E. (2010). Current regeneration patterns at the tree line in the Pyrenees indicate similar recruitment processes irrespective of the past disturbance regime. Journal of Biogeography 37(10): 1938–1950. https://doi.org/10.1111/j.1365-2699.2010.02348.x.
Bekker M.F. (2005). Positive feedback between tree establishment and patterns of subalpine forest advancement, Glacier National Park, Montana U.S.A. Arctic, Antarctic, and Alpine Research 37(1): 97–107. https://doi.org/10.1657/1523-0430(2005)037[0097:PFBTEA]2.0.CO;2.
Bell F.W., Ter-Mikaelian M.T., Wagner R.G. (2000). Relative competitiveness of nine early-successional boreal forest species associated with planted jack pine and black spruce seedlings. Canadian Journal of Forest Research 30(5): 790–800. https://doi.org/10.1139/x00-004.
Bergeron Y., Archambault S. (1993). Decreasing frequency of forest fires in the southern boreal zone of Québec and its relation to global warming since the end of the “Little Ice Age”. The Holocene 3(3): 255–259. https://doi.org/10.1177/095968369300300307.
Berner L.T., Beck P.S.A., Loranty M.M., Alexander H.D., Mack M.C., Goetz S.J. (2012). Cajander larch (Larix cajanderi) biomass distribution, fire regime and post-fire recovery in northeastern Siberia. Biogeosciences 9: 3943–3959. https://doi.org/10.5194/bg-9-3943-2012.
Berner L.T., Beck P.S.A., Bunn A.G., Goetz S.J. (2013). Plant response to climate change along the forest-tundra ecotone in northeastern Siberia. Global Change Biology 19(11): 3449–3462. https://doi.org/10.1111/gcb.12304.
Besag J. (1977). Contribution to the discussion of Dr Ripley’s paper. Journal of the Royal Statistical Society 39: 193–195.
Besag J., Diggle P.J. (1977). Simple Monte Carlo tests for spatial pattern. Journal of the Royal Statistical Society: Series C (Applied Statistics) 26(3): 327–333. https://doi.org/10.2307/2346974.
Bhiry N., Payette S., Robert É.C. (2007). Peatland development at the arctic tree line (Québec, Canada) influenced by flooding and permafrost. Quaternary Research 67(3): 426–437. https://doi.org/10.1016/j.yqres.2006.11.009.
Bonnet V.H., Schoettle A.W., Shepperd W.D. (2005). Postfire environmental conditions influence the spatial pattern of regeneration for Pinus ponderosa. Canadian Journal of Forest Research 35(1): 37–47. https://doi.org/10.1139/x04-157.
Brown C.D., Johnstone J.F. (2012). Once burned, twice shy: repeat fires reduce seed availability and alter substrate constraints on Picea mariana regeneration. Forest Ecology and Management 266: 34–41. https://doi.org/10.1016/j.foreco.2011.11.006.
Brown C.D., Vellend M. (2014). Non-climatic constraints on upper elevational plant range expansion under climate change. Proceedings of the Royal Society of London B: Biological Sciences 281(1794): 20141779. https://doi.org/10.1098/rspb.2014.1779.
Brown R.J.E. (1960). The distribution of permafrost and its relation to air temperature in Canada and the U.S.S.R.. ARCTIC 13(3): 163–177. https://doi.org/10.14430/arctic3697.
Charron I., Greene D.F. (2002). Post-wildfire seedbeds and tree establishment in the southern mixedwood boreal forest. Canadian Journal of Forest Research 32(9): 1607–1615. https://doi.org/10.1139/x02-085.
Crawford R.M.M., Jeffree C.E., Rees W.G. (2003). Paludification and forest retreat in northern oceanic environments. Annals of Botany 91(2): 213–226. https://doi.org/10.1093/aob/mcf185.
Cullen L.E., Stewart G.H., Duncan R.P., Palmer J.G. (2001). Disturbance and climate warming influences on New Zealand Nothofagus tree-line population dynamics. Journal of Ecology 89(6): 1061–1071. https://doi.org/10.1111/j.1365-2745.2001.00628.x.
Dale V.H., Joyce L.A., McNulty S., Neilson R.P. (2000). The interplay between climate change, forests, and disturbances. Science of The Total Environment 262(3): 201–204. https://doi.org/10.1016/S0048-9697(00)00522-2.
Devi N.M., Hagedorn F., Moiseev P.A., Bugman H., Shiyatov S.G., Mazepa V.S., Rigling A. (2008). Expanding forests and changing growth forms of Siberian larch at the Polar Urals treeline during the 20th century. Global Change Biology 14(7): 1581–1591. https://doi.org/10.1111/j.1365-2486.2008.01583.x.
Diggle P.J. (2003). Statistical analysis of spatial point patterns. Edward Arnold, London.
Drössler L., Feldmann E., Glatthorn J., Annighöfer P., Kucbel S., Tabaku V. (2016). What happens after the gap? – Size distributions of patches with homogeneously sized trees in natural and managed beech forests in Europe. Open Journal of Forestry 6: 177–190. https://doi.org/10.4236/ojf.2016.63015.
Erwin K.L. (2008). Wetlands and global climate change: the role of wetland restoration in a changing world. Wetlands Ecology and Management 17: 71–84. https://doi.org/10.1007/s11273-008-9119-1.
Flannigan M., Stocks B., Turetsky M., Wotton M. (2009). Impacts of climate change on fire activity and fire management in the circumboreal forest. Global Change Biology 15(3): 549–560. https://doi.org/10.1111/j.1365-2486.2008.01660.x.
Frost G.V., Epstein H.E. (2014). Tall shrub and tree expansion in Siberian tundra ecotones since the 1960s. Global Change Biology 20(4): 1264–1277. https://doi.org/10.1111/gcb.12406.
Galipeau C., Kneeshaw D.D., Bergeron Y. (1997). White spruce and balsam fir colonization of a site in the southeastern boreal forest as observed 68 years after fire. Canadian Journal of Forest Research 27(2): 139–147. https://doi.org/10.1139/x96-148.
Gillett N.P., Weaver A.J., Zwiers F.W., Flannigan M.D. (2004). Detecting the effect of climate change on Canadian forest fires. Geophysical Research Letters 31(18): L18211. https://doi.org/10.1029/2004GL020876.
Goldammer J.G., Furyaev V.V. (1996). Fire in ecosystems of boreal Eurasia. Forestry Sciences, Springer Netherlands, Dordrecht.
Hansen M.C., Potapov P.V., Moore R., Hancher M., Turubanova S.A., Tyukavina A., Thau D., Stehman S.V., Goetz S.J., Loveland T.R., Kommareddy A., Egorov A., Chini L., Justice C.O., Townshend J.R.G. (2013). High-resolution global maps of 21st-century forest cover change. Science 342(6160): 850–853. https://doi.org/10.1126/science.1244693.
Harsch M.A., Hulme P.E., McGlone M.S., Duncan R.P. (2009). Are treelines advancing? A global meta-analysis of treeline response to climate warming. Ecology Letters 12(10): 1040–1049. https://doi.org/10.1111/j.1461-0248.2009.01355.x.
Holmes R.L. (1983). Computer-assisted quality control in tree-ring dating and measurement. Tree-ring bulletin 43: 69–78.
Holtmeier F.-K., Broll G. (2005). Sensitivity and response of northern hemisphere altitudinal and polar treelines to environmental change at landscape and local scales. Global Ecology and Biogeography 14(5): 395–410. https://doi.org/10.1111/j.1466-822X.2005.00168.x.
Holtmeier F.-K., Broll G. (2007). Treeline advance – driving processes and adverse factors. Landscape Online 1: 1–32. https://doi.org/10.3097/LO.200701.
Holtmeier F.-K., Broll G. (2012). Landform influences on treeline patchiness and dynamics in a changing climate. Physical Geography 33: 403–437.
Iijima Y., Ohta T., Kotani A., Fedorov A.N., Kodama Y., Maximov T.C. (2014). Sap flow changes in relation to permafrost degradation under increasing precipitation in an eastern Siberian larch forest. Ecohydrology 7(2): 177–187. https://doi.org/10.1002/eco.1366.
IPCC (2014). Climate Change 2014: impacts, adaptation, and vulnerability. Part A: global and sectoral aspects. Contribution of Working Group II to the Fifth Assessment Report of the Intergovernmental Panel on Climate Change. Cambridge University Press, Cambridge, Cambridge.
Johnson A.C., Yeakley J.A. (2013). Wood microsites at timberline-alpine meadow borders: implications for conifer seedling regeneration and alpine meadow conifer invasion. Northwest Science 87(2): 140–160. https://doi.org/10.3955/046.087.0206.
Johnstone J.F., Chapin III F.S., Foote J., Kemmett S., Price K., Viereck L. (2004). Decadal observations of tree regeneration following fire in boreal forests. Canadian Journal of Forest Research 34(2): 267–273. https://doi.org/10.1139/x03-183.
Johnstone J.F., Hollingsworth T.N., Chapin F.S., Mack M.C. (2010). Changes in fire regime break the legacy lock on successional trajectories in Alaskan boreal forest. Global Change Biology 16(4): 1281–1295. https://doi.org/10.1111/j.1365-2486.2009.02051.x.
Jorgenson M.T., Osterkamp T.E. (2005). Response of boreal ecosystems to varying modes of permafrost degradation. Canadian Journal of Forest Research 35(9): 2100–2111. https://doi.org/10.1139/x05-153.
Kasischke E.S., Turetsky M.R. (2006). Recent changes in the fire regime across the North American boreal region – Spatial and temporal patterns of burning across Canada and Alaska. Geophysical Research Letters 33(9): L09703. https://doi.org/10.1029/2006GL025677.
Kharuk V.I., Ranson K.J., Dvinskaya M.L. (2008). Wildfires dynamic in the larch dominance zone. Geophysical Research Letters 35(1): L01402. https://doi.org/10.1029/2007GL032291.
Kharuk V.I., Ranson K.J., Im S.T., Petrov I.A. (2015). Climate-induced larch growth response within the central Siberian permafrost zone. Environmental Research Letters 10(12): 125009. https://doi.org/10.1088/1748-9326/10/12/125009.
Kirdyanov A.V., Prokushkin A.S., Tabakova M.A. (2013). Tree-ring growth of Gmelin larch under contrasting local conditions in the north of Central Siberia. Dendrochronologia 31(2): 114–119. https://doi.org/10.1016/j.dendro.2012.10.003.
Kuuluvainen T., Rouvinen S. (2000). Post-fire understorey regeneration in boreal Pinus sylvestris forest sites with different fire histories. Journal of Vegetation Science 11(6): 801–812. https://doi.org/10.2307/3236550.
Landhäusser S.M., Wein R.W. (1993). Postfire vegetation recovery and tree establishment at the arctic treeline: climate-change-vegetation-response hypotheses. Journal of Ecology 81(4): 665–672. https://doi.org/10.2307/2261664.
Lingua E., Cherubini P., Motta R., Nola P. (2008). Spatial structure along an altitudinal gradient in the Italian central Alps suggests competition and facilitation among coniferous species. Journal of Vegetation Science 19(3): 425–436. https://doi.org/10.3170/2008-8-18391.
Lloyd A.H., Yoshikawa K., Fastie C.L., Hinzman L., Fraver M. (2003). Effects of permafrost degradation on woody vegetation at arctic treeline on the Seward Peninsula, Alaska. Permafrost and Periglacial Processes 14(2): 93–101. https://doi.org/10.1002/ppp.446.
Lotwick H.W., Silverman B.W. (1982). Methods for analysing spatial processes of several types of points. Journal of the Royal Statistical Society: Series B (Methodological) 44: 406–413.
MacDonald G.M., Velichko A.A., Kremenetski C.V., Borisova O.K., Goleva A.A., Andreev A.A., Cwynar L.C., Riding R.T., Forman S.L., Edwards T.W.D., Aravena R., Hammarlund D., Szeicz J.M., Gattaulin V.N. (2000). Holocene treeline history and climate change across northern Eurasia. Quaternary Research 53(3): 302–311. https://doi.org/ 10.1006/qres.1999.2123.
MacDonald G.M., Kremenetski K.V., Beilman D.W. (2008). Climate change and the northern Russian treeline zone. Philosophical Transactions of the Royal Society B: Biological Sciences 363(1501): 2283–2299. https://doi.org/10.1098/rstb.2007.2200.
Mast J.N., Veblen T.T. (1999). Tree spatial patterns and stand development along the pine-grassland ecotone in the Colorado Front Range. Canadian Journal of Forest Research 29(5): 575–584. https://doi.org/10.1139/x99-025.
Myers-Smith I.H., Harden J.W., Wilmking M., Fuller C.C., McGuire A.D., Chapin III F.S. (2008). Wetland succession in a permafrost collapse: interactions between fire and thermokarst. Biogeosciences 5: 1273–1286. https://doi.org/10.5194/bg-5-1273-2008.
Nathan R., Muller-Landau H.C. (2000). Spatial patterns of seed dispersal, their determinants and consequences for recruitment. Trends in Ecology & Evolution 15(7): 278–285. https://doi.org/10.1016/S0169-5347(00)01874-7.
Ohta T., Kotani A., Iijima Y., Maximov T.C., Ito S., Hanamura M., Kononov A.V., Maximov A.P. (2014). Effects of waterlogging on water and carbon dioxide fluxes and environmental variables in a Siberian larch forest, 1998–2011. Agricultural and Forest Meteorology 188: 64–75. https://doi.org/10.1016/j.agrformet.2013.12.012.
Osawa A., Zyryanova O.A., Matsuura Y., Kajimoto T., Wein R.W. (eds.). (2010). Permafrost ecosystems: Siberian larch forests. Ecological Studies, Springer Science & Business Media, Dordrecht. https://doi.org/10.1007/978-1-4020-9693-8.
Otto J., Raddatz T., Claussen M. (2011). Strength of forest-albedo feedback in mid-Holocene climate simulations. Climate of the Past 7: 1027–1039. https://doi.org/10.5194/cp-7-1027-2011.
Pare D., Bergeron Y. (1995). Above-ground biomass accumulation along a 230-year chronosequence in the southern portion of the Canadian boreal forest. Journal of Ecology 83(6): 1001–1007. https://doi.org/10.2307/2261181.
Payette S., Gagnon R. (1985). Late Holocene deforestation and tree regeneration in the forest–tundra of Québec. Nature 313: 570–572. https://doi.org/10.1038/313570a0.
Payette S., Lavoie C. (1994). The arctic tree line as a record of past and recent climatic changes. Environmental Reviews 2(1): 78–90. https://doi.org/10.1139/a94-004.
R Core Team. (2015). R: a language and environment for statistical computing. R Foundation for Statistical Computing, Vienna, Austria.
Resler L.M., Stine M.B. (2009). Patterns and processes of tree islands in two transitional environments: alpine treeline and bog forest-meadow ecotones. Geography Compass 3(4): 1305–1330. https://doi.org/10.1111/j.1749-8198.2009.00242.x.
Ripley B.D. (1977). Modelling spatial patterns. Journal of the Royal Statistical Society: Series B (Methodological) 39: 172–212.
Schulze E.-D., Wirth C., Mollicone D., von Lüpke N., Ziegler W., Achard F., Mund M., Prokushkin A., Scherbina S. (2012). Factors promoting larch dominance in central Siberia: fire versus growth performance and implications for carbon dynamics at the boundary of evergreen and deciduous conifers. Biogeosciences 9: 1405–1421. https://doi.org/10.5194/bg-9-1405-2012.
Schumacher S., Bugmann H. (2006). The relative importance of climatic effects, wildfires and management for future forest landscape dynamics in the Swiss Alps. Global Change Biology 12(8): 1435–1450. https://doi.org/10.1111/j.1365-2486.2006.01188.x.
Shankman D., Daly C. (1988). Forest regeneration above tree limit depressed by fire in the Colorado Front Range. Bulletin of the Torrey Botanical Club 115(4): 272–279. https://doi.org/10.2307/2996159.
Shorohova E., Kuuluvainen T., Kangur A., Jõgiste K. (2009). Natural stand structures, disturbance regimes and successional dynamics in the Eurasian boreal forests: a review with special reference to Russian studies. Annals of Forest Science 66(2): 201–201. https://doi.org/10.1051/forest/2008083.
Sirois L., Payette S. (1991). Reduced postfire tree regeneration along a boreal forest-forest-tundra transect in Northern Québec. Ecology 72(2): 619–627. https://doi.org/10.2307/2937202.
Šrůtek M., Doležal J., Hara T. (2002). Spatial structure and associations in a Pinus canariensis population at the treeline, Pico del Teide, Tenerife, Canary Islands. Arctic, Antarctic, and Alpine Research 34(2): 201–210. https://doi.org/10.2307/1552472.
Stoyan D., Stoyan H. (1994). Fractals, random shapes, and point fields: methods of geometrical statistics. Wiley.
Walter K.M., Zimov S.A., Chanton J.P., Verbyla D., Chapin F.S. (2006). Methane bubbling from Siberian thaw lakes as a positive feedback to climate warming. Nature 443: 71–75. https://doi.org/10.1038/nature05040.
Wiegand T., Moloney K.A. (2013). Handbook of spatial point-pattern analysis in ecology. CRC Pres.
Wilmking M., Sanders T., Zhang Y., Kenter S., Holzkämper S., Crittenden P. (2012). Effects of climate, site conditions, and seed quality on recent treeline dynamics in NW Russia: permafrost and lack of reproductive success hamper treeline advance? Ecosystems 15(7): 1053–1064. https://doi.org/10.1007/s10021-012-9565-8.
Wooster M.J., Zhang Y.H. (2004). Boreal forest fires burn less intensely in Russia than in North America. Geophysical Research Letters 31(20): L20505. https://doi.org/10.1029/2004GL020805.
Ye B., Yang D., Zhang Z., Kane D.L. (2009). Variation of hydrological regime with permafrost coverage over Lena Basin in Siberia. Journal of Geophysical Research: Atmospheres 114(D7): D07102. https://doi.org/10.1029/2008JD010537.
Zhang Q., Zhang Y., Peng S., Yirdaw E., Wu N. (2009). Spatial structure of alpine trees in Mountain Baima Xueshan on the southeast Tibetan Plateau. Silva Fennica 43(2): 197–208. https://doi.org/10.14214/sf.206.
Zibulski R., Herzschuh U., Pestryakova L.A., Wolter J., Müller S., Schilling N., Wetterich S., Schirrmeister L., Tian F. (2013). River flooding as a driver of polygon dynamics: modern vegetation data and a millennial peat record from the Anabar River lowlands (Arctic Siberia). Biogeosciences 10: 5703–5728. https://doi.org/10.5194/bg-10-5703-2013.
Total of 85 references.
