Katri Luostarinen  ,
Katja Hakkarainen,
Henri Kaksonen
,
Katja Hakkarainen,
Henri Kaksonen
Wood anatomy of seed and basal bud originated downy birches (Betula pubescens Ehrh.) grown at four different sites
Luostarinen K., Hakkarainen K., Kaksonen H. (2017). Wood anatomy of seed and basal bud originated downy birches (Betula pubescens Ehrh.) grown at four different sites. Silva Fennica vol. 51 no. 1 article id 1694. https://doi.org/10.14214/sf.1694
Highlights
- Young xylem of sprouts did not clearly show more mature characteristics than that of seedlings
- Marked differences in xylem structure could be observed between growing sites.
Abstract
In trees, xylem must fulfil three important tasks: conducting water to leaves, storing nutrients and water, and supporting the trunk. The origin of the trunk, i.e., seed or basal bud that forms sprouts, and the growth site may affect xylem anatomy, differences of which can affect successful growth of trees. Both seedlings and sprouts of downy birch (Betula pubescens Ehrh.) from four different growth sites with two different soil media, peat and mineral soil, were studied. The diameter of fibres and vessels and the thickness of the double fibre wall were measured, and the number of vessels, rays and axial parenchyma cells was counted. The fibre wall:lumen ratio, vessel percentage area and vessel size:number ratio were calculated. Xylem from sprouts showed only occasionally more mature characteristics than that of seedlings. The number of rays was similar at all four sites, but differences were observed in all other studied characteristics between sites, particularly if soil type was different. The vessel size and number correlated with the number of axial parenchyma cells in juvenile wood, which emphasises the importance of their connections with storage cells particularly at this stage of growth. Good water conductivity was connected with weaker wood, particularly in maturing wood.
Keywords
fibre;
xylem;
parenchyma;
ray;
vessel;
sprout;
wood structure
-
Luostarinen,
School of Forest Sciences, University of Eastern Finland, P.O. Box 111, FI-80101 Joensuu, Finland
E-mail
katri.luostarinen@uef.fi
- Hakkarainen, Natural Resources Institute of Finland (Luke), Yliopistokatu 6, FI-80100 Joensuu, Finland E-mail katjahak@gmail.com
- Kaksonen, School of Forest Sciences, University of Eastern Finland, P.O. Box 111, FI-80101 Joensuu, Finland E-mail hkaksone@gmail.com
Received 6 September 2016 Accepted 20 January 2017 Published 27 January 2017
Views 32832
Available at https://doi.org/10.14214/sf.1694 | Download PDF

1 Introduction
Xylem anatomy affects the success of a tree species and different provenances of it in different growing sites (Eilmann et al. 2014). Water conducting capacity, which is associated with xylem vessels in hardwoods such as birch, is a key factor that affects the growth of trees (Eilmann et al. 2014). Different species have different strategies associated with vessels: larger vessels provide a better hydraulic conductivity, but the potential for an embolism to occur increases (Sperry et al. 2006; Poorter et al. 2009; Zanne et al. 2010). If vessels are small, they are usually numerous, to form sufficient conducting area in the wood (Zanne et al. 2010). In addition to diffusely located vessels vascular tracheids that contribute to water transport exist in Betula pubescens Ehrh., but their number is very low. The strength of the structure must also be maintained in trees, and at least small amount of storage cells for water and nutrients are required. The main supporting cell type in hardwoods is fibres, and concerning them, wall:lumen ratio is connected to the strength of the wood, higher values representing a greater proportion of fibre walls in a cell (Martinez-Cabrera at al. 2009). An insignificantly low number of fibre tracheids that support the trunk exist in downy birch in addition to libriform fibres. Axial parenchyma and rays store water and nutrients and transport them between the phloem, cambium and xylem. In addition to rays and diffuse apotracheal axial parenchyma, marked starch storage in birch wood is the one cell layer wide terminal parenchyma: it’s significance is emphasised in spring when cambium activates.
The proportions of different cell types largely depend on the ecology of the species or type of the environment where the species generally grows (e.g., Zheng and Martinez-Cabrera 2013), but the specific growth conditions of a stand, e.g., soil type, can also have some impact. The effect of soil on cell structure of B. pubescens is not known, but differences may exist. In addition to differences in nutrients and pH, availability of water differs between particularly peat and mineral soils. Peatlands are usually so wet that B. pubescens is the only species that can grow on them, and no real competition of other tree species occurs. In some cases B. pubescens changes the water and other growing conditions at peat creating possibilities to other tree species, as well. Instead, in mineral soils B. pubescens can grow as a pioneer species, but it does not success in competition with some other tree species (Viherä-Aarnio 2008). The other important environmental factors include temperature, which affect growth per se but also evaporation and plant transpiration, and wind and snow load, which emphasise the need for xylem strength.
The need for different functions may change from pith to bark during tree growth, and in juvenile wood these functions might be particularly variable. Several annual rings around the pith, formed by young cambium, compose the juvenile wood. The number of juvenile rings depends on species and individual, but commonly the number of them is 15–20. In juvenile wood, the characteristics of xylem change rapidly for the first few years, after which the change gradually levels off and thus a range of rings, rather than one specific ring, during which the maturation occurs can be determined. Different characteristics mature at slightly different times. The most common characteristics indicating maturation in all trees, including both softwoods and hardwoods, is length of tracheids and fibres, respectively, and the microfibril angle in them (Zobel and van Buijtenen 1989; Zobel and Sprague 1998; Bonham and Barnett 2001). In addition, the density of rays decreases (Bhat and Kärkkäinen 1981), and in hardwoods also vessel characteristics change clearly during maturation (Zobel and van Buijtenen 1989; Zobel and Sprague 1998).
Juvenile wood structure might differ between stems deriving from seeds or basal buds. This is due to the growth habit of the basal buds: they initiate from the axes of cotyledons and grow with annual rings to remain on the stem surface, commonly branching vigorously like in downy birch (B. pubescens) (Kauppi et al. 1987), but they do not usually burst and grow to sprouts before the apical control of the main stem disappears. When a bud grows this way, maintaining its apical meristem on the stem surface, it may lead to maturation of apical meristem and at the same time, the cambium might acquire mature features. Thus, the wood of young sprouts might possess more mature wood characteristics than seedlings of the same age.
The aim of this study was to investigate the differences in wood structure and maturation between seedlings and sprouts of downy birch. The differences were compared between trees grown on different growing sites with two different soil media. This information contributes to evaluate the effect of origin and growth site on the juvenility and structure of wood. In addition, gathered knowledge helps to determine connections between ecologically important anatomical characteristics particularly at juvenile stage.
2 Materials and methods
Downy birch (B. pubescens) trees were sampled from four different growth sites: Hattuvaara in Ilomantsi, two sites in Jakokoski in Kontiolahti, and Vaara in Punkaharju. The samplings were performed in September and October, after the growth of preceeding growing season had ceased. Each of the four sites was located in eastern Finland. The stands were naturally regenerated. Information concerning the stands is presented in Table 1. The stand of Vaara was fertilized three years before harvesting the trunks for this study.
| Table 1. Descriptions of the sites from where the studied B. pubescens trees were sampled. The age of stand is approximate, as the stands were naturally regenerated. | |||||
| Location | Coordinates | Soil | Stand density, stems/ha | Fertilizing | Age of stand, years |
| Jakokoski I | 62°44´N, 30°01’E | Mineral | Birch: 6000 Pine: 1100 | No | 35 |
| Hattuvaara | 62°59´N, 31°18´E | Mineral | Birch: 800 Pine: 1300 | No | 25 |
| Jakokoski II | 62°45´N, 30°04’E | Peat | Birch: 2000 Pine: 1600 | No | 40 |
| Punkaharju | 61°53´N, 29°38´E | Peat | Birch: 2500 | Yes: 3 years before harvesting Fe-PK: 400 kg ha–1 | 40 |
Fifteen seed and basal bud originated trunks were sampled from each studied stand, totalling 120 trunks. However, from seed originated trunks of Jakokoski mineral site only fourteen samples could be used for this study. The chosen seed originated trunks belonged to predominant trees of the stands, as well as the sprouts, as the largest and most vigorous and healthy one of each stump was chosen. The basal bud originated trees, i.e. sprouts, were distinguished visually from those originating from seeds, i.e. seedlings, by the remnants of original stumps surrounded by a cluster of trunks with a crooked butt, which is typical for trees deriving from basal buds. A disc was taken at a height of 1.3 m for anatomical measurements from each trunk. The north side of the trunk was marked on the discs.
A strip was sawn from the north side of each disc from the pith to the bark. It was ca. 1 cm lengthwise and tangentially. The strips were cut into shorter pieces for microtomy, because a whole strip was too long to be cut with a microtome and to be mounted on a slide. Before sectioning, the wood was softened by boiling it for 30–45 min in water after which it was let to cool down. Boiling was necessary, because original wood discs had to be dried before anatomical studies. Cross-sections 20-µm thick were cut using a rotary microtome (Microm). The cross-sections were stained with safranin-alcian blue (Fagerstedt et al. 1996) and mounted with DePex.
Anatomical measurements were made using a Leitz Laborlux 12 microscope with a Micropublisher 5.0 camera and Image Pro 7.0 software. All abundant cell types (libriform fibres, vessels, rays and axial parenchyma) were considered as in all of them changes occur during maturation. Fibre tracheids and vascular tracheids were not taken into account, because they can not be separated from libriform fibres and vessels, respectively, in crosscut, and their amount is extremely low (the amount was checked from macerations). The characteristics measured were the double thickness of the tangential walls of libriform fibres, and the radial diameter of both fibre and vessel lumens so that the general measuring direction was radial, in which the clearest differences can be found (Fig. 1). Later libriform fibres are called fibres in this text. These measurements were made from two points of each annual ring: about 20–30 cell layers from the beginning and end of the ring, twice from both points. For narrow annual rings, it was not possible to use the 20–30 cell layer approach, and thus, measurements were performed closer to the borders. For very narrow rings, all four measurements for each ring characteristic had to be taken approximately from the centre of the ring, avoiding the three first and three last cell layers of the ring, as these cell layers possibly are not developed as average ones.
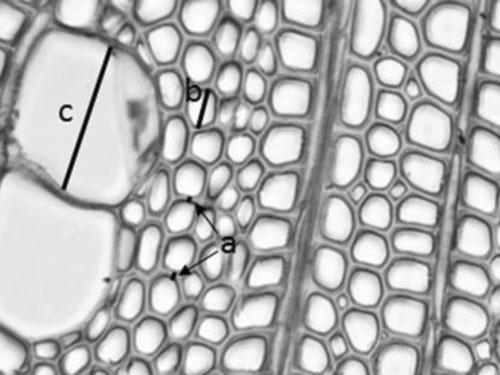
Fig. 1. Schema showing the anatomical measurements: a represents two examples of how double cell wall of libriform fibres were measured from tangential walls, b represents measuring radial diameter of fibre lumen and c radial diameter of vessel lumen. The figure represents 18th annual ring from the pith of a seed originated trunk from Punkaharju site.
The means of the measured characteristics were first calculated for each individual ring and then for five annual ring groups to compare the trends in order to find out if the results could be presented in five annual ring groups without losing information. As the trend of the curves and differences between origins as well as between stands were similar in both ways, the grouping of the material into five annual ring groups was decided to use. Thus the means of the measured characteristics were counted for groups of five annual rings, starting from the pith, up to 25 years of cambial age. After this point, a cambial age group (CAG) of 26–35 years was used. If there were one or two additional growth rings after the last whole CAG, these rings were combined with the preceding group for statistical calculations. If three or more rings were present, these formed a separate group, but the name of the group followed the nomenclature of the groups of five rings up to 25 years of age; subsequently, the group starting from cambial age 26 years was named to contain ten rings (26–35) but it could contain 3–10 rings, depending on the total amount of the rings in a given sample. As there were different numbers of rings at breast height between trunks, in addition to number of rings in a CAG also number of CAGs could differ between trunks (Table 2).
| Table 2. Numbers of cambial age groups (CAG) found in sampled trees by growth site and origin. | ||||||||
| Jakokoski mineral | Hattuvaara mineral | Jakokoski peat | Punkaharju peat | |||||
| CAG | seedling | sprout | seedling | sprout | seedling | sprout | seedling | sprout |
| 1–5 | 14 | 15 | 15 | 15 | 15 | 15 | 15 | 15 |
| 6–10 | 14 | 15 | 15 | 15 | 15 | 15 | 15 | 15 |
| 11–15 | 14 | 15 | 15 | 15 | 15 | 15 | 15 | 15 |
| 16–20 | 10 | 12 | 13 | 13 | 15 | 15 | 15 | 15 |
| 21–25 | 3 | - | 2 | 6 | 14 | 14 | 15 | 15 |
| 26–35 | 2 | - | - | - | 4 | 9 | 10 | 2 |
The numbers of rays, vessels and axial parenchyma cells were counted once for each CAG and they are presented per mm2. Terminal parenchyma was not taken into account, as annual rings were of different width and due to the fact that different number of terminal parenchyma bands occurred in the observed areas. The total area of the vessel lumens was calculated by multiplying the mean area of a vessel lumen (A = πr2, mm2; r = radial diameter/2) by the vessel number per mm2 (N). The result was presented as a percentage of the observed area. The vessel size:number ratio (S) was calculated using the formula S = A/N (mm4) from Zanne et al. (2010). If S is high, the vessels are large in the given sample. Furthermore, the fibre wall:lumen ratio was calculated using the thickness of the double cell wall and the radial diameter of the lumen.
The results were analysed using the General Linear Model (GLM) multivariate procedure of the SPSS 21 statistical software. The GLM compares the means of different groups, assuming that the values for groups are normally distributed and that the variances of the groups do not differ significantly from each other. Comparisons were made by the GLM approach for each anatomical characteristic by CAG firstly between origins (seed or basal bud) within a growth site, and then between growth sites using Tukey’s HSD post hoc test if assumptions for the parametric tests were valid, and the Tamhane test if they were not, for pairwise comparisons. If GLM could not be used at all, pairwise comparisons were made using the non-parametric Mann-Whitney U -test. Pearson correlations were calculated by CAGs between the studied parameters with a combined origin and growth site data after grouping the data according to the classifying factors. A significance level of p < 0.05 was used.
3 Results
3.1 Origin
In the combined material, only the wall:lumen ratio differed between seedlings and sprouts, that being higher in the seedlings (Table 3). The few statistical difference observed by CAGs in the thickness of the double cell wall of fibres (Table 4), the radial diameter of fibre lumens (Table 5), and the fibre double wall thickness:lumen ratio (Table 6) emphasized the result of the combined material.
| Table 3. Means standard errors of the mean and statistical differences of studied characteristics by origin, as well as total average of the characteristics calculated for all samples together. Means of seedlings and sprouts marked with different lowercase letters differ significantly from each other. No letters – no difference. | |||
| Characteristics | Seedling | Sprout | Total |
| Thickness of double wall of fibres, µm | 4.1 ± 0.1 | 4.0 ± 0.1 | 4.0 ± 0.0 |
| Fibre lumen diameter, µm | 14.4 ± 0.1 | 14.8 ± 0.1 | 14.6 ± 0.1 |
| Double wall:lumen ratio of fibres | 0.29 ± 0.00a | 0.27 ± 0.00b | 0.28 ± 0.00 |
| Vessel lumen diameter, µm | 68.8 ± 1.0 | 70.4 ± 0.9 | 69.6 ± 0.7 |
| Vessels, no/mm2 | 63.1 ± 1.7 | 58.9 ± 1.4 | 60.9 ± 1.1 |
| Vessel area, % | 15.2 ± 0.0 | 15.3 ± 0.0 | 15.3 ± 0.0 |
| Vessel size:number ratio mm4 | 84.5 ± 4.4 | 87.4 ± 3.8 | 86.0 ± 2.9 |
| Rays, no/mm2 | 12.7 ± 0.2 | 12.4 ± 0.3 | 12.5 ± 0.2 |
| Axial parenchyma, no/mm2 | 80.4 ± 4.7 | 73.4 ± 4.6 | 76.8 ± 3.3 |
| Table 4. Means standard errors of the mean and statistical differences in the thickness of libriform fibre double cell wall (µm) between seedlings and sprouts, and between growth sites and all together. | ||||||||
| Jakokoski mineral | Hattuvaara mineral | Jakokoski peat | Punkaharju peat | |||||
| CAG | Seedling | Sprout | Seedling | Sprout | Seedling | Sprout | Seedling | Sprout |
| 1–5 | 3.5 ± 0.2 | 3.7 ± 0.2 | 3.0 ± 0.1 | 2.8 ± 0.1 | 3.6 ± 0.3 | 3.2 ± 0.2 | 2.8 ± 0.1 | 2.8 ± 0.1 |
| 3.6 ± 0.16aA | 2.9 ± 0.1bA | 3.4 ± 0.2aA | 2.8 ± 0.1bA | |||||
| 6–10 | 4.1 ± 0.2 | 4.2 ± 0.1 | 3.5 ± 0.1 | 3.3 ± 0.1 | 3.9 ± 0.3 | 3.8 ± 0.2 | 3.7 ± 0.1 | 3.9 ± 0.2 |
| 4.2 ± 0.1aAB | 3.4 ± 0.8bB | 3.9 ± 0.2abAB | 3.8 ± 0.1abB | |||||
| 11–15 | 4.4 ± 0.2 | 4.8 ± 0.2 | 4.1 ± 0.1 | 3.8 ± 0.1 | 4.4 ± 0.3 | 4.4 ± 0.1 | 4.0 ± 0.1 | 3.9 ± 0.2 |
| 4.6 ± 0.1aBC | 3.9 ± 0.1bC | 4.4 ± 0.2abBC | 3.9 ± 0.1bBC | |||||
| 16–20 | 4.8 ± 0.3 | 4.9 ± 0.2 | 4.5 ± 0.2a | 4.0 ± 0.2b | 4.4 ± 0.2 | 4.5 ± 0.3 | 4.2 ± 0.1 | 4.0 ± 0.1 |
| 4.9 ± 0.2aC | 4.3 ± 0.1bC | 4.5 ± 0.2abBCD | 4.1 ± 0.1bBC | |||||
| 21–25 | 5.3 ± 0.6 | - | 4.6 ± 0.5 | 4.4 ± 0.3 | 5.2 ± 0.3 | 4.9 ± 0.2 | 4.3 ± 0.2 | 4.2 ± 0.1 |
| 5.4 ± 0.6abBC | 4.5 ± 0.3abC | 5.1 ± 0.2aD | 4.2 ± 0.1bBC | |||||
| 26–35 | 5.6 ± 0.2 | - | - | - | 4.9 ± 0.2 | 5.0 ± 0.2 | 4.3 ± 0.3 | 4.4 ± 0.2 |
| 5.6 ± 0.2aBC | - | 5.0 ± 0.2aCD | 4.4 ± 0.2aC | |||||
| Total | 4,3 ± 0.1 | 4.4 ± 0.1 | 3.8 ± 0.1 | 3.5 ± 0.1 | 4.3 ± 0.1 | 4.2 ± 0.1 | 3.9 ± 0.1 | 3.9 ± 0.1 |
| 4.3 ± 0.1a | 3.6 ± 0.1b | 4.3 ± 0.1a | 3.9 ± 0.1b | |||||
| Note: The upper row of a cambial age group (CAG) shows the figures for seedlings and sprouts. Two different lowercase letters within a growth site represents a significant difference between the origins within the growth site. The absence of letters means that no difference between origins were observed within the growth site. The lower row of a CAG represents the mean of the characteristics, including sprouts and seedlings, of the growth site. Means marked with different lowercase letters represent significant differences between those growth sites. The same lowercase letter for two growth sites means that no significant difference exists between these growth sites. Capital letters represent the radial difference within a growth site: same letters – no difference, different letters – significant difference | ||||||||
| Table 5. Means ± standard errors of the mean and statistical differences in the diameter of fibre lumen (µm) between seedlings and sprouts, and between growth sites. | ||||||||
| Jakokoski mineral | Hattuvaara mineral | Jakokoski peat | Punkaharju peat | |||||
| CAG | Seedling | Sprout | Seedling | Sprout | Seedling | Sprout | Seedling | Sprout |
| 1–5 | 13.7 ± 0.5 | 14.2 ± 0.5 | 12.6 ± 0.4 | 12.9 ± 0.2 | 13.3 ± 0.4 | 12.9 ± 0.4 | 11.2 ± 0.5 | 11.5 ± 0.4 |
| 14.0 ± 0.3aA | 12.7 ± 0.2bA | 13.1 ± 0.3abA | 11.4 ± 0.3cA | |||||
| 6–10 | 15.8 ± 0.4 | 16.1 ± 0.4 | 14.2 ± 0.4 | 15.0 ± 0.5 | 15.4 ± 0.5 | 15.2 ± 0.5 | 12.5 ± 0.5 | 13.1 ± 0.4 |
| 15.9 ± 0.3aB | 14.6 ± 0.3bB | 15.3 ± 0.4abBC | 12.8 ± 0.3cB | |||||
| 11–15 | 16.7 ± 0.5 | 16.8 ± 0.4 | 14.3 ± 0.5 | 14.8 ± 0.6 | 15.5 ± 0.6 | 15.9 ± 0.5 | 12.8 ± 0.6 | 13.8 ± 0.5 |
| 16.7 ± 0.3adB | 14.5 ± 0.4beB | 15.7 ± 0.4bdCD | 13.3 ± 0.4ceB | |||||
| 16–20 | 17.3 ± 0.9 | 16.6 ± 0.5 | 15.3 ± 0.5 | 14.8 ± 0.6 | 16.2 ± 0.4 | 16.8 ± 0.4 | 13.0 ± 0.4a | 14.2 ± 0.5b |
| 17.0 ± 0.5aB | 15.0 ± 0.4bB | 16.5 ± 0.3aBCE | 13.6 ± 0.3cB | |||||
| 21–25 | 17.8 ± 0.5 | - | 12.6 ± 1.4a | 17.9 ± 1.0b | 17.0 ± 0.5 | 16.6 ± 0.6 | 13.4 ± 0.4 | 14.0 ± 0.4 |
| 17.8 ± 0.5aB | 13.7 ± 0.3abAB | 16.8 ± 0.4aDE | 13.9 ± 0.3bB | |||||
| 26–35 | 16.7 ± 0.8 | - | - | - | 17.3 ± 1.5 | 17.5 ± 0.6 | 13.7 ± 0.5 | 13.9 ± 0.4 |
| 16.7 ± 0.8abAB | - | 17.5 ± 0.6aE | 13.9 ± 0.3bB | |||||
| Total | 15.9 ± 0.3 | 15.9 ± 0.3 | 14.0 ± 0.2 | 14.7 ± 0.3 | 15.6 ± 0.2 | 15.7 ± 0.3 | 12.7 ± 0.2a | 13.5 ± 0.2b |
| 15.9 ± 0.2a | 14.3 ± 0.2b | 15.6 ± 0.2a | 13.1 ± 0.1c | |||||
| Note: The upper row of a cambial age group (CAG) shows the figures for seedlings and sprouts. Two different lowercase letters within a growth site represents a significant difference between the origins within the growth site. The absence of letters means that no difference between origins were observed within the growth site. The lower row of a CAG represents the mean of the characteristics, including sprouts and seedlings, of the growth site. Means marked with different lowercase letters represent significant differences between those growth sites. The same lowercase letter for two growth sites means that no significant difference exists between these growth sites. Capital letters represent the radial difference within a growth site: same letters – no difference, different letters – significant difference | ||||||||
| Table 6. Means ± standard errors of the mean and statistical differences in the fibre wall:lumen ratio between seedlings and sprouts, and between growth sites. | ||||||||
| Jakokoski mineral | Hattuvaara mineral | Jakokoski peat | Punkaharju peat | |||||
| CAG | Seedling | Sprout | Seedling | Sprout | Seedling | Sprout | Seedling | Sprout |
| 1–5 | 0.25 ± 0.01 | 0.26 ± 0.01 | 0.24 ± 0.01a | 0.22 ± 0.01b | 0.27 ± 0.02 | 0.25 ± 0.02 | 0.26 ± 0.02 | 0.25 ± 0.01 |
| 0.26 ± 0.01a | 0.23 ± 0.01bA | 0.26 ± 0.01ab | 0.25 ± 0.01abA | |||||
| 6–10 | 0.26 ± 0.02 | 0.27 ± 0.01 | 0.25 ± 0.01 | 0.22 ± 0.01 | 0.26 ± 0.02 | 0.26 ± 0.02 | 0.30 ± 0.02 | 0.30 ± 0.01 |
| 0.26 ± 0.01ab | 0.24 ± 0.01aAB | 0.26 ± 0.01a | 0.30 ± 0.01bAB | |||||
| 11–15 | 0.27 ± 0.01 | 0.29 ± 0.01 | 0.29 ± 0.01 | 0.26 ± 0.02 | 0.29 ± 0.02 | 0.28 ± 0.01 | 0.33 ± 0.03 | 0.29 ± 0.02 |
| 0.28 ± 0.01 | 0.28 ± 0.01BC | 0.28 ± 0.01 | 0.31 ± 0.02B | |||||
| 16–20 | 0.28 ± 0.01 | 0.30 ± 0.02 | 0.30 ± 0.02 | 0.27 ± 0.02 | 0.27 ± 0.01 | 0.27 ± 0.02 | 0.33 ± 0.02a | 0.28 ± 0.01b |
| 0.29 ± 0.01 | 0.29 ± 0.01C | 0.27 ± 0.01 | 0.31 ± 0.01B | |||||
| 21–25 | 0.30 ± 0.03 | - | 0.38 ± 0.08 | 0.25 ± 0.03 | 0.31 ± 0.02 | 0.31 ± 0.02 | 0.33 ± 0.02 | 0.30 ± 0.01 |
| 0.30 ± 0.03 | 0.28 ± 0.03ABC | 0.31 ± 0.01 | 0.31 ± 0.01B | |||||
| 26–35 | 0.34 ± 0.03 | - | - | - | 0.29 ± 0.03 | 0.28 ± 0.01 | 0.32 ± 0.03 | 0.32 ± 0.01 |
| 0.34 ± 0.03 | - | 0.29 ± 0.01 | 0.32 ± 0.01B | |||||
| Total | 0.27 ± 0.01 | 0.28 ± 0.01 | 0.27 ± 0.01a | 0.24 ± 0.01b | 0.28 ± 0.01 | 0.27 ± 0.01 | 0.31 ± 0.01 | 0.29 ± 0.01 |
| 0.27 ± 0.01a | 0.26 ± 0.01a | 0.28 ± 0.01a | 0.30 ± 0.01b | |||||
| Note: The upper row of a cambial age group (CAG) shows the figures for seedlings and sprouts. Two different lowercase letters within a growth site represents a significant difference between the origins within the growth site. The absence of letters means that no difference between origins were observed within the growth site. The lower row of a CAG represents the mean of the characteristics, including sprouts and seedlings, of the growth site. Means marked with different lowercase letters represent significant differences between those growth sites. The same lowercase letter for two growth sites means that no significant difference exists between these growth sites. Capital letters represent the radial difference within a growth site: same letters – no difference, different letters – significant difference | ||||||||
In the case of the vessels no differences in the combined material were observed between seedlings and sprouts (Table 3). By CAGs, differences were observed in the trees of the peat sites in the number of vessels (Table 7), the vessel lumen diameter (Table 8), and the size:number ratio (Table 9), but they were not always larger or smaller in the trees of the same origin. The percentage area of vessels (Table 10) was always similar between seedlings and sprouts.
| Table 7. Means ± standard errors of the mean and statistical differences in the number of vessels (per mm2) between seedlings and sprouts, and between growth sites. | ||||||||
| Jakokoski mineral | Hattuvaara mineral | Jakokoski peat | Punkaharju peat | |||||
| CAG | Seedling | Sprout | Seedling | Sprout | Seedling | Sprout | Seedling | Sprout |
| 1–5 | 77.4 ± 7.4 | 64.1 ± 3.8 | 89.6 ± 6.8 | 86.2 ± 6.2 | 94.5 ± 7.8 | 89.8 ± 7.6 | 110.3 ± 8.7 | 115.3 ± 6.7 |
| 70.6 ± 4.2aA | 87.9 ± 4.6abA | 92.2 ± 5.4bA | 112.8 ± 5.4cA | |||||
| 6–10 | 48.2 ± 3.6 | 46.3 ± 3.1 | 57.5 ± 2.7 | 56.6 ± 2.5 | 68.7 ± 5.2 | 66.4 ± 3.5 | 89.7 ± 7.3a | 68.9 ± 3.8b |
| 47.2 ± 2.3aB | 57.1 ± 1.8bB | 67.5 ± 3.1cB | 79.3 ± 4.5cB | |||||
| 11–15 | 41.3 ± 3.0 | 36.2 ± 1.9 | 50.8 ± 1.9 | 52.2 ± 2.5 | 55.6 ± 3.6 | 54.9 ± 2.6 | 82.2 ± 7.2 | 66.4 ± 3.8 |
| 38.6 ± 1.8aBC | 51.5 ± 1.5bBC | 55.2 ± 2.2bC | 74.3 ± 4.3cBC | |||||
| 16–20 | 33.8 ± 3.1 | 30.3 ± 1.9 | 42.4 ± 3.1 | 47.6 ± 2.7 | 48.1 ± 3.0 | 48.2 ± 2.7 | 64.1 ± 3.8 | 62.0 ± 3.7 |
| 31.9 ± 1.8aC | 45.0 ± 2.1bC | 48.1 ± 2.0bCD | 63.0 ± 2.6cC | |||||
| 21–25 | 33.8 ± 3.7 | - | 52.9 ± 2.9 | 41.7 ± 2.7 | 42.1 ± 2.4a | 51.3 ± 2.7b | 51.8 ± 3.7 | 52.8 ± 2.4 |
| 33.8 ± 3.7aBC | 44.5 ± 2.7abC | 46.7 ± 2.0abCD | 52.3 ± 2.2bD | |||||
| 26–35 | 29.5 ± 2.0 | - | - | - | 41.3 ± 6.8 | 41.3 ± 2.8 | 47.8 ± 3.6 | 42.0 ± 1.6 |
| 29.5 ± 2.0aC | - | 41.3 ± 2.7aD | 43.8 ± 1.6aE | |||||
| Total | 49.7 ± 3.1 | 45.0 ± 2.2 | 60.4 ± 3.0 | 59.3 ± 2.6 | 61.0 ± 2.9 | 60.0 ± 2.4 | 75.6 ± 3.4a | 66.0 ± 2.8b |
| 47.3 ± 1.9a | 59.8 ± 2.0bc | 60.5 ± 1.9c | 70.5 ± 2.2d | |||||
| The upper row of a cambial age group (CAG) shows the figures for seedlings and sprouts. Two different lowercase letters within a growth site represents a significant difference between the origins within the growth site. The absence of letters means that no difference between origins were observed within the growth site. The lower row of a CAG represents the mean of the characteristics, including sprouts and seedlings, of the growth site. Means marked with different lowercase letters represent significant differences between those growth sites. The same lowercase letter for two growth sites means that no significant difference exists between these growth sites. Capital letters represent the radial difference within a growth site: same letters – no difference, different letters – significant difference | ||||||||
| Table 8. Means ± standard errors of the mean and statistical differences in the diameter of vessel lumens (µm) between seedlings and sprouts, and between growth sites. | ||||||||||||||||||||||||||||||||||||||
| Jakokoski mineral | Hattuvaara mineral | Jakokoski peat | Punkaharju peat | |||||||||||||||||||||||||||||||||||
| CAG | Seedling | Sprout | Seedling | Sprout | Seedling | Sprout | Seedling | Sprout | ||||||||||||||||||||||||||||||
| 1–5 | 58.3 ± 2.5 | 57.4 ± 2.7 | 49.2 ± 2.0 | 51.4 ± 1.9 | 44.7 ± 1.5 | 44.0 ± 1.5 | 43.9 ± 1.6 | 45.4 ± 2.0 | ||||||||||||||||||||||||||||||
| 57.8 ± 1.8aA | 50.3 ± 1.4cA | 44.4 ± 1.1bA | 44.6 ± 1.3bA | |||||||||||||||||||||||||||||||||||
| 6–10 | 79.4 ± 3.3 | 85.2 ± 4.0 | 70.0 ± 2.0 | 69.8 ± 1.7 | 62.1 ± 2.0 | 61.3 ± 1.1 | 56.8 ± 2.0 | 65.1 ± 2.3 | ||||||||||||||||||||||||||||||
| 82.4 ± 2.6aB | 69.9 ± 1.3bB | 61.7 ± 1.1cB | 60.9 ± 1.7cB | |||||||||||||||||||||||||||||||||||
| 11–15 | 85.9 ± 2.5 | 87.9 ± 3.1 | 77.3 ± 1.9 | 78.2 ± 2.1 | 66.5 ± 1.5 | 67.3 ± 1.9 | 62.0 ± 2.3a | 69.6 ± 1.5b | ||||||||||||||||||||||||||||||
| 87.0 ± 2.0aBC | 77.8 ± 1.4bC | 66.9 ± 1.2cB | 65.8 ± 1.5cB | |||||||||||||||||||||||||||||||||||
| 16–20 | 95.1 ± 6.1 | 92.4 ± 3.5 | 85.3 ± 3.9 | 81.8 ± 2.1 | 74.7 ± 1.3 | 75.2 ± 1.7 | 65.8 ± 2.2 | 67.8 ± 1.7 | ||||||||||||||||||||||||||||||
| 93.7 ± 3.3aC | 83.5 ± 2.2aC | 75.0 ± 1.1bC | 66.8 ± 1.4cBC | |||||||||||||||||||||||||||||||||||
| 21–25 | 90.3 ± 4.0 | - | 77.1 ± 7.0 | 90.1 ± 3.9 | 82.5 ± 3.3a | 74.7 ± 1.6b | 74.4 ± 2.4 | 71.4 ± 2.3 | ||||||||||||||||||||||||||||||
| 90.3 ± 4.1aBC | 86.6 ± 3.8aC | 78.6 ± 1.9abC | 72.9 ± 1.6bCD | |||||||||||||||||||||||||||||||||||
| 26–35 | 86.2 ± 0.7 | - | - | - | 75.4 ± 4.7 | 82.9 ± 2.6 | 79.4 ± 3.1 | 78.3 ± 2.0 | ||||||||||||||||||||||||||||||
| 86.2 ± 0.7aBC | - | 80.6 ± 2.4aC | 78.6 ± 1.7aD | |||||||||||||||||||||||||||||||||||
| Total | 79.4 ± 2.3 | 80.1 ± 2.5 | 70.2 ± 2.1 | 71.8 ± 1.8 | 66.4 ± 1.7 | 66.4 ± 1.5 | 63.0 ± 1.5a | 67.1 ± 1.3b | ||||||||||||||||||||||||||||||
| 79.8 ± 1.7a | 71.0 ± 1.4b | 71.0 ± 1.4b | 65.2 ± 1.0c | |||||||||||||||||||||||||||||||||||
| Note: The upper row of a cambial age group (CAG) shows the figures for seedlings and sprouts. Two different lowercase letters within a growth site represents a significant difference between the origins within the growth site. The absence of letters means that no difference between origins were observed within the growth site. The lower row of a CAG represents the mean of the characteristics, including sprouts and seedlings, of the growth site. Means marked with different lowercase letters represent significant differences between those growth sites. The same lowercase letter for two growth sites means that no significant difference exists between these growth sites. Capital letters represent the radial difference within a growth site: same letters – no difference, different letters – significant difference | ||||||||||||||||||||||||||||||||||||||
| Table 9. Means ± standard errors of the mean and statistical differences in the vessel size:number ratio (mm4) between seedlings and sprouts, and between growth sites. | ||||||||
| Jakokoski mineral | Hattuvaara mineral | Jakokoski peat | Punkaharju peat | |||||
| CAG | Seedling | Sprout | Seedling | Sprout | Seedling | Sprout | Seedling | Sprout |
| 1–5 | 40.6 ± 5.8 | 45.2 ± 5.9 | 32.3 ± 10.8 | 26.6 ± 2.7 | 18.4 ± 1.7 | 19.2 ± 2.2 | 15.6 ± 1.8 | 15.2 ± 1.5 |
| 43.0 ± 4.1aAB | 29.5 ± 5.5abA | 18.8 ± 1.4bA | 15.4 ± 1.2bA | |||||
| 6–10 | 114.2 ± 14.6 | 145.1 ± 26.3 | 71.6 ± 7.7 | 69.6 ± 3.9 | 49.2 ± 4.9 | 45.8 ± 2.2 | 33.5 ± 5.2a | 50.6 ± 3.9b |
| 130.2 ± 15.3aA | 70.6 ± 4.2bB | 47.5 ± 2.7cB | 42.0 ± 3.5cBC | |||||
| 11–15 | 152.5 ± 13.5 | 177.2 ± 15.5 | 96.7 ± 8.3 | 96.8 ± 7.3 | 67.0 ± 5.6 | 66.8 ± 3.9 | 43.0 ± 5.4a | 59.7 ± 3.5b |
| 165.2 ± 10.4aAB | 96.8 ± 5.4bC | 66.9 ± 3.4cC | 51.3 ± 3.5dCD | |||||
| 16–20 | 244.7 ± 49.6 | 239.8 ± 27.0 | 158.8 ± 27.2 | 116.9 ± 10.3 | 96.3 ± 6.7 | 94.9 ± 4.3 | 57.2 ± 5.1 | 62.0 ± 4.7 |
| 242.0 ± 26.2aB | 137.8 ± 14.8bC | 95.6 ± 3.9bD | 59.6 ± 3.4cD | |||||
| 21–25 | 199.0 ± 41.1 | - | 90.3 ± 20.9 | 160.1 ± 20.8 | 140.0 ± 22.2a | 89.6 ± 6.4b | 95.0 ± 12.9 | 78.9 ± 5.7 |
| 199.0 ± 41.1aAB | 142.6 ± 19.4abBC | 114.8 ± 12.3abD | 87.0 ± 7.1bE | |||||
| 26–35 | 198.7 ± 10.0 | - | - | - | 124.6 ± 33.4 | 134.6 ± 9.8 | 108.0 ± 7.9 | 121.9 ± 10.1 |
| 198.7 ± 10.0aAB | - | 131.6 ± 11.5abD | 117.6 ± 7.4bE | |||||
| Total | 135.9 ± 13.6 | 147.2 ± 13.4 | 87.6 ± 9.0 | 84.0 ± 6.1 | 75.9 ± 6.6 | 70.7 ± 4.3 | 55.8 ± 4.5a | 68.9 ± 4.4b |
| 141.5 ± 9.5a | 85.7 ± 5.3b | 73.2 ± 3.9bc | 62.8 ± 3.2c | |||||
| Note: The upper row of a cambial age group (CAG) shows the figures for seedlings and sprouts. Two different lowercase letters within a growth site represents a significant difference between the origins within the growth site. The absence of letters means that no difference between origins were observed within the growth site. The lower row of a CAG represents the mean of the characteristics, including sprouts and seedlings, of the growth site. Means marked with different lowercase letters represent significant differences between those growth sites. The same lowercase letter for two growth sites means that no significant difference exists between these growth sites. Capital letters represent the radial difference within a growth site: same letters – no difference, different letters – significant difference. | ||||||||
| Table 10. Means ± standard errors of the mean and statistical differences in the area of vessels (%) between seedlings and sprouts, and between growth sites. | ||||||||
| Jakokoski mineral | Hattuvaara mineral | Jakokoski peat | Punkaharju peat | |||||
| CAG | Seedling | Sprout | Seedling | Sprout | Seedling | Sprout | Seedling | Sprout |
| 1–5 | 14.7 ± 1.6 | 11.8 ± 1.1 | 12.3 ± 1.2 | 12.7 ± 0.9 | 10.5 ± 0.9 | 9.7 ± 0.8 | 11.8 ± 0.9 | 13.5 ± 1.3 |
| 13.2 ± 1.0aA | 12.5 ± 0.7abA | 10.1 ± 0.6bA | 12.7 ± 1.0abA | |||||
| 6–10 | 17.3 ± 1.6 | 18.6 ± 1.5 | 15.7 ± 0.9 | 15.7 ± 1.1 | 14.7 ± 1.2 | 14.2 ± 1.0 | 15.8 ± 1.1 | 16.9 ± 1.8 |
| 17.9 ± 1.1aB | 15.7 ± 0.7abB | 14.5 ± 1.0bB | 16.4 ± 1.0abB | |||||
| 11–15 | 17.1 ± 1.4 | 16.0 ± 1.4 | 16.9 ± 0.7 | 17.9 ± 1.1 | 13.8 ± 1.0 | 14.2 ± 1.2 | 17.5 ± 1.5 | 18.2 ± 1.2 |
| 16.5 ± 1.0abAB | 17.4 ± 0.7bB | 14.0 ± 1.0aB | 17.8 ± 1.0bB | |||||
| 16–20 | 16.9 ± 1.8 | 14.4 ± 1.1 | 16.6 ± 1.0 | 17.9 ± 1.2 | 15.2 ± 1.1 | 15.7 ± 1.6 | 15.5 ± 1.1 | 15.9 ± 1.0 |
| 15.5 ± 1.0aAB | 17.2 ± 0.8aB | 15.5 ± 1.0aB | 15.7 ± 0.7aAB | |||||
| 21–25 | 15.3 ± 1.0 | - | 17.6 ± 2.2 | 18.8 ± 1.3 | 16.0 ± 1.1 | 16.2 ± 1.1 | 15.9 ± 1.1 | 15.3 ± 1.2 |
| 15.3 ± 1.0aAB | 18.5 ± 1.0aB | 16.1 ± 1.0aB | 15.6 ± 1.0aAB | |||||
| 26–35 | 12.3 ± 1.0 | - | - | - | 12.6 ± 1.0 | 16.3 ± 1.9 | 17.6 ± 2.1 | 14.4 ± 0.7 |
| 12.3 ± 1.0aAB | - | 15.2 ± 1.4aB | 15.4 ± 1.0aAB | |||||
| Total | 16.2 ± 0.0 | 15.2 ± 0.0 | 15.4 ± 0.0 | 16.2 ± 0.01 | 14.0 ± 0.0 | 14.2 ± 0.0 | 15.6 ± 0.0 | 15.6 ± 0.0 |
| 15.7 ± 0.0ab | 15.8 ± 0.0a | 14.1 ± 0.0b | 15.6 ± 0.0a | |||||
| Note: The upper row of a cambial age group (CAG) shows the figures for seedlings and sprouts. Two different lowercase letters within a growth site represents a significant difference between the origins within the growth site. The absence of letters means that no difference between origins were observed within the growth site. The lower row of a CAG represents the mean of the characteristics, including sprouts and seedlings, of the growth site. Means marked with different lowercase letters represent significant differences between those growth sites. The same lowercase letter for two growth sites means that no significant difference exists between these growth sites. Capital letters represent the radial difference within a growth site: same letters – no difference, different letters – significant difference | ||||||||
The number of rays (Table 11) and axial parenchyma cells (Table 12) did not differ between seedlings and sprouts in the combined material (Table 3). Neither any systemic difference between seedlings and sprouts was found by CAGs (Tables 11, 12). However, both the differences in the numbers of axial parenchyma cells found by CAGs (in Jakokoski mineral and Punkaharju sites) showed that the number was lower in sprouts than in seedlings.
| Table 11. Means ± standard errors of the mean and statistical differences in the number of rays (per mm2) between seedlings and sprouts, and between growth sites. | ||||||||
| Jakokoski mineral | Hattuvaara mineral | Jakokoski peat | Punkaharju peat | |||||
| CAG | Seedling | Sprout | Seedling | Sprout | Seedling | Sprout | Seedling | Sprout |
| 1–5 | 18.0 ± 1.1 | 15.8 ± 0.7 | 17.0 ± 1.3 | 16.9 ± 0.7 | 18.3 ± 1.4 | 18.3 ± 0.8 | 16.9 ± 1.4 | 15.9 ± 0.6 |
| 16.8 ± 0.7aA | 16.9 ± 0.7aA | 18.3 ± 0.8aA | 16.4 ± 0.7aA | |||||
| 6–10 | 12.8 ± 0.6 | 13.3 ± 0.9 | 13.1 ± 0.6 | 17.6 ± 4.7 | 13.6 ± 0.8 | 14.8 ± 0.7 | 13.1 ± 0.7a | 11.2 ± 0.4b |
| 13.0 ± 0.5aB | 15.3 ± 2.3aAB | 14.2 ± 0.6aB | 12.2 ± 0.4aB | |||||
| 11–15 | 11.7 ± 0.5 | 10.5 ± 0.5 | 11.0 ± 0.7 | 10.6 ± 0.5 | 12.0 ± 0.7 | 12.8 ± 1.0 | 11.0 ± 0.8 | 11.0 ± 0.4 |
| 11.0 ± 0.4aC | 10.8 ± 0.4aBC | 12.4 ± 0.6aBC | 11.0 ± 0.4aB | |||||
| 16–20 | 10.0 ± 0.5 | 9.8 ± 0.5 | 10.3 ± 0.5 | 10.7 ± 0.5 | 10.3 ± 0.5 | 11.1 ± 0.6 | 11.0 ± 0.4 | 10.5 ± 0.5 |
| 9.9 ± 0.3aC | 10.5 ± 0.4aBC | 10.7 ± 0.4aCD | 10.8 ± 0.3aB | |||||
| 21–25 | 10.1 ± 1.4 | - | 11.4 ± 0.0 | 10.1 ± 1.2 | 9.3 ± 0.3 | 10.1 ± 0.5 | 10.9 ± 0.6a | 9.1 ± 0.4b |
| 10.1 ± 1.4aABC | 10.4 ± 0.9aAB | 9.7 ± 0.3aD | 10.0 ± 0.4aC | |||||
| 26–35 | 9.1 ± 1.6 | - | - | - | 9.5 ± 0.6 | 8.8 ± 0.7 | 11.0 ± 1.2 | 9.4 ± 0.5 |
| 9.1 ± 1.6aABC | - | 9.0 ± 0.5aD | 9.9 ± 0.5aC | |||||
| Total | 13.0 ± 0.5 | 12.5 ± 0.5 | 12.9 ± 0.5 | 13.7 ± 1.2 | 12.6 ± 0.5 | 13.0 ± 0.5 | 12.3 ± 0.4a | 11.0 ± 0.3b |
| 12.7 ± 0.3ab | 13.3 ± 0.7a | 12.8 ± 0.3ab | 11.7 ± 0.3b | |||||
| Note: The upper row of a cambial age group (CAG) shows the figures for seedlings and sprouts. Two different lowercase letters within a growth site represents a significant difference between the origins within the growth site. The absence of letters means that no difference between origins were observed within the growth site. The lower row of a CAG represents the mean of the characteristics, including sprouts and seedlings, of the growth site. Means marked with different lowercase letters represent significant differences between those growth sites. The same lowercase letter for two growth sites means that no significant difference exists between these growth sites. Capital letters represent the radial difference within a growth site: same letters – no difference, different letters – significant difference | ||||||||
| Table 12. Means ± standard errors of the mean and statistical differences in the number of axial parenchyma cells (per mm2) between seedlings and sprouts, and between growth sites. | ||||||||
| Jakokoski mineral | Hattuvaara mineral | Jakokoski peat | Punkaharju peat | |||||
| CAG | Seedling | Sprout | Seedling | Sprout | Seedling | Sprout | Seedling | Sprout |
| 1–5 | 93.1 ± 14.6 | 69.8 ± 14.0 | 140.5 ± 23.3 | 121.0 ± 26.9 | 236.4 ± 28.4 | 223.7 ± 31.5 | 181.9 ± 22.4 | 176.3 ± 23.4 |
| 81.0 ± 10.2aA | 130.8 ± 17.6acA | 230.1 ± 20.9bA | 179.1 ± 15.9bcA | |||||
| 6–10 | 64.5 ± 9.7 | 43.4 ± 4.0 | 69.7 ± 9.8 | 59.5 ± 10.6 | 120.2 ± 14.6 | 152.9 ± 21.4 | 100.8 ± 15.6 | 76.6 ± 16.6 |
| 53.5 ± 5.4aAB | 64.6 ± 7.2acB | 136.5 ± 13.1bB | 88.7 ± 11.4cB | |||||
| 11–15 | 43.4 ± 5.4 | 30.0 ± 6.2 | 31.5 ± 7.9 | 52.6 ± 13.1 | 87.9 ± 10.0 | 112.3 ± 17.2 | 94.8 ± 20.4a | 42.7 ± 9.7b |
| 36.5 ± 4.3aBC | 42.0 ± 7.8aBC | 100.1 ± 10.0bBC | 68.7 ± 12.1abBC | |||||
| 16–20 | 31.6 ± 5.4a | 17.9 ± 2.9b | 20.0 ± 7.6 | 41.1 ± 9.2 | 62.0 ± 16.4 | 81.4 ± 12.1 | 44.0 ± 9.6 | 36.1 ± 12.7 |
| 24.1 ± 3.2aC | 30.5 ± 6.2aC | 71.7 ± 10.2bCD | 40.1 ± 7.9abCD | |||||
| 21–25 | 27.3 ± 5.8 | - | 10.0 ± 10.0 | 18.7 ± 9.7 | 44.9 ± 11.63 | 61.4 ± 13.1 | 30.1 ± 7.2 | 19.5 ± 5.1 |
| 27.3 ± 5.8abBC | 16.5 ± 7.5aC | 53.4 ± 8.7bDE | 24.8 ± 4.5aD | |||||
| 26–35 | 31.4 ± 0.7 | - | - | - | 46.8 ± 36.3 | 53.7 ± 12.8 | 15.2 ± 4.9 | 19.1 ± 9.3 |
| 31.4 ± 0.7abC | - | 51.6 ± 13.3aCE | 17.9 ± 6.5bD | |||||
| Total | 57.4 ± 5.5a | 41.5 ± 4.8b | 65.1 ± 9.1 | 64.7 ± 8.6 | 108.7 ± 10.8 | 119.2 ± 10.3 | 81.1 ± 8.6a | 58.6 ± 7.7b |
| 49.4 ± 3.7a | 64.9 ± 6.2ac | 114.2 ± 7.5b | 69.2 ± 5.8c | |||||
| Note: The upper row of a cambial age group (CAG) shows the figures for seedlings and sprouts. Two different lowercase letters within a growth site represents a significant difference between the origins within the growth site. The absence of letters means that no difference between origins were observed within the growth site. The lower row of a CAG represents the mean of the characteristics, including sprouts and seedlings, of the growth site. Means marked with different lowercase letters represent significant differences between those growth sites. The same lowercase letter for two growth sites means that no significant difference exists between these growth sites. Capital letters represent the radial difference within a growth site: same letters – no difference, different letters – significant difference | ||||||||
3.2 Growth site
Fertilization performed at Punkaharju site three years before the trees were harvested did not cause change in any of the measured or counted anatomical characteristics. Thus the results of three last years are combined with other results of Punkaharju and they are not shown separately.
The thickness of the double cell wall of fibres (Fig. 2a, Table 4), the radial diameter of the fibre lumens (Fig. 2b, Table 5) and the fibre double cell wall:lumen ratio (Fig. 2c, Table 6) increased with increasing cambial age. The increase in the double cell wall thickness was significant by the CAG 11–15 years in trees of other sites except those in the Punkaharju site, in which the increase was significant already by the CAG 6–10 years. The fibre walls as well as their lumens were largest in the trees from the mineral soil of Jakokoski. The increase in the radial diameter of the fibre lumen was slower in mineral than peat sites, because the significant difference with CAG 1–5 years was observed at the CAG 21–25 years and CAG 16–20 years in Jakokoski mineral and Hattuvaara site, respectively, while at both peat sites, a statistically significant difference was observed by the CAG 6–10 years. In addition, the fibre lumens of trees in the Punkaharju peatland were the smallest: the maximum lumen diameter was ca. 14 µm. The smallest lumens of Punkaharju trees caused that the trend of the fibre double cell wall:lumen ratio was highest in the trees of the Punkaharju stand, difference being significant only in the CAG 6–10 years, by which the ratio increased up to 0.30; otherwise, the ratio varied between 0.23 and 0.34.
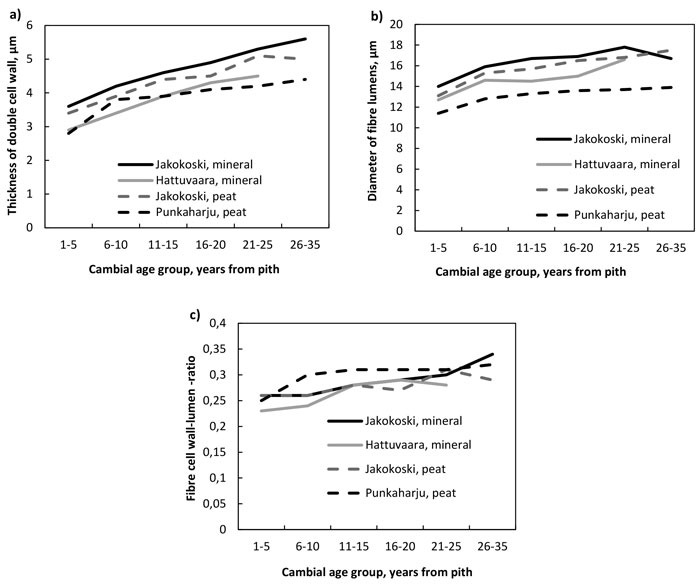
Fig. 2. a) The thickness of the double cell wall of fibres, b) the diameter of fibre lumens and c) the fibre wall:lumen ratio by growth site and cambial age group.
The number of vessels decreased (Fig. 3a , Table 7) while the radial diameter of vessel lumens (Fig. 3b, Table 8), the vessel size:number ratio (Fig. 3c, Table 9) and the percentage area of vessels (Fig. 3d, Table 10) increased from the pith outwards in trees at all four sites. The decrease in the number was significant by the CAG 6–10 years in trees at all sites, after which the number started to stabilise. The number differed between trees of different sites in most comparisons from the pith up to the CAG 21–25 years; more vessels were present in the trees of peat sites than in those of mineral sites (Table 7). The radial diameter of lumens increased significantly by the CAG 6–10 years, as well, at each site. The lumens of the trees at the Jakokoski mineral site were the widest starting from the pith, with a maximum diameter of 93 µm in the CAG 16–20 years, whereas the lumens of trees grown on peatland sites were the smallest, with a diameter of 78–80 µm in the CAG 26–35 years. The significant increase in the vessel lumen diameter caused that the percentage area of vessels increased significantly from ca. 10–13% to ca. 14.5–18% by the CAG 6–10 years, after which no radial differences were observed at any site. However, no differences in the percentage area of vessels were observed between sites within CAGs. The vessel size:number ratio increased from the pith up to the CAG 16–20 and CAG 21–25 years in the trees at the mineral and peat sites, respectively, and the most significant differences between the sites existed between the mineral and peat sites, values being higher in the trees of the mineral sites.
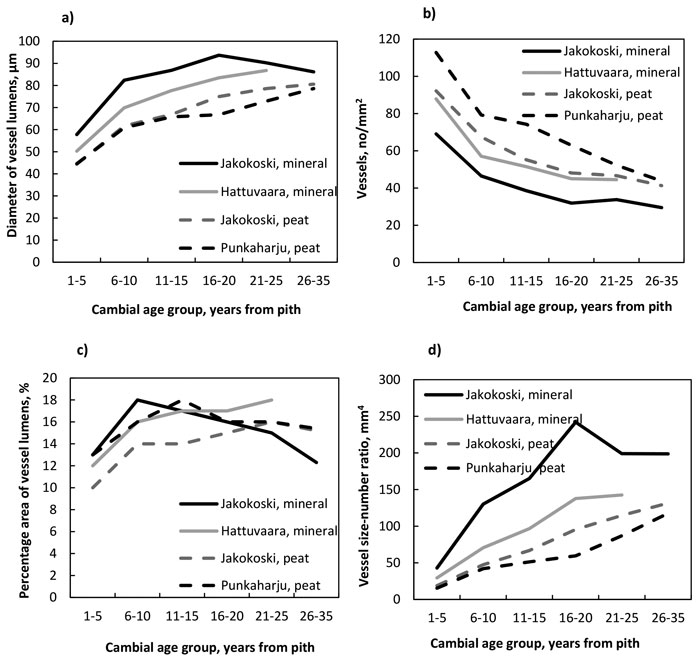
Fig. 3. a) The number of vessels, b) the diameter of vessel lumens, c) the vessel size:number ratio, and d) the percentage area of vessels by growth site and cambial age group.
The number of rays (Fig. 4a, Table 11) as well as that of axial parenchyma cells (Fig. 4b, Table 12) decreased from the pith to the bark in trees of all four growth sites, and the decrease of rays was significant by the CAG 11–15 years, after which the decrease levelled off; the number of rays did not differ between growth sites. In the trees of the Jakokoski mineral site the decrease of axial parenchyma cells was not significant before the CAG 11–15 years when compared to the youngest CAG, while in the trees at other sites, the decrease was significant by the CAG 6–10 years. Differences in the number of axial parenchyma cells between the sites were obvious. The trees from the two peat sites had more parenchyma cells than those from the mineral sites, and among the peat sites, the trees from the Jakokoski site had clearly more parenchyma cells from the pith to the bark.
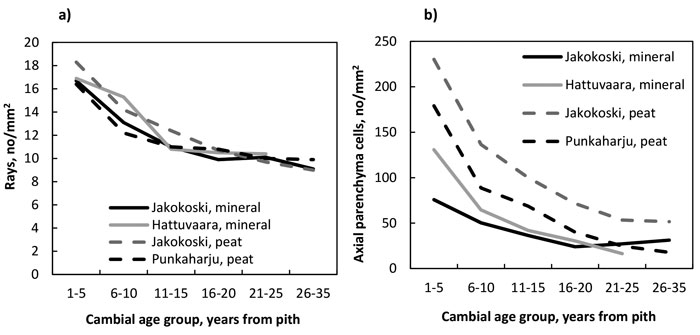
Fig. 4. a) The number of rays, and b) the number of axial parenchyma cells by growth site and cambial age group.
3.3 The Interdependence of anatomical characteristics
Several stable correlations between anatomical characteristics were found. These were basically similar when calculated by growth site or origin, as well as when the whole material was combined. The results calculated using the whole material are shown (Table 13a, b). In addition, the four vessel characteristics considered in this study are commonly known to correlate with each other (see e.g., Zanne & Falster 2010). This was also observed in this study, but as they were obvious, these correlations are not shown. Neither correlations between fibre wall:lumen ratio and the two other fibre characteristics were shown, being obvious, as well.
| Table 13. Statistically significant correlations observed between studied vessel characteristics and a) densities of rays and axial parenchyma cells, and b) thickness of double cell wall of fibres, diameter of fibre lumen, and fibre wall:lumen ratio. Numbers are correlation coefficients. ** significant at 0.01 level, * significant at 0.05 level. CAG – cambial age group, N – number of observations. View in new window/tab. |
Between the vessel characteristics and the number of rays only few correlations were observed (Table 13a). If correlation existed, diameter of vessel lumens was the smaller the more there were rays. In addition, vessel size:number ratio correlated in the youngest CAG and vessel area in the oldest studied CAG, both negatively, with ray number. A positive correlation between numbers of rays and axial parenchyma cells were observed in CAG 11–15 years (r = 0.317**; ** - significant at 0.01 level). Number of axial parenchyma cells correlated in several CAGs with vessel characteristics (Table 13a). Diameter of vessel lumens were the smaller the more there were axial parenchyma cells or the bigger was size:number ratio, while number of vessels and number of axial parenchyma cells correlated positively. These correlations existed from the pith to CAG 16–20 years, except regarding number of vessels, up to CAG 11–15 years. In addition, in CAG 1–5 years, the more there were axial parenchyma cells, the thinner were the fibre walls (r = –0.263**).
The diameter of the fibe lumen correlated commonly from the pith up to at least CAG 21–25 years with the vessel characteristics. The larger were the fibre lumens, the larger were also the vessel lumens and the bigger the size:number ratio, while the smaller was the vessel number. The correlations of the thickness of the double cell wall and the vessel characteristics were similar but existed only up to CAG 16–20 years regarding the number of vessels and size:number ratio, while the correlation was significant only in CAG 1–5 years regarding the diameter of vessel lumens. The correlations were opposite between the fibre wall:lumen ratio and the vessel characteristics and existed in the CAGs 11–15, 16–20 and 21–25 years. Vessel area did not correlate with any of the fibre characteristics. In addition, the thickness of the double cell wall occasionally correlated positively with the fibre lumen diameter (in CAGs 1–5, 16–20 and 26–35, r = 0.401**, r = 0.209*, r = 0.334*, respectively; * - significant at 0.05 level)
4 Discussion
4.1 Origin
Several small differences in wood anatomy were observed between sprouts and seedlings. Where a statistical difference was observed, the property turned out slightly more often more mature in sprouts than in seedlings: the measured characteristics, i.e., the diameter of the fibre and vessel lumen, were usually larger and the counted variables, i.e., the densitites of vessels, rays and axial parenchyma cells were smaller in sprouts. Some other results suggesting that the cambium of cloned trees or sprouts may be slightly older than that of seedlings exist. In Eucalyptus camaldulensis Dehnh. the vessels density was slightly higher in seedlings than in clone trees propagated from tissue culture (Veenin et al. 2005), and fibres were slightly longer in sprouts than seed originated trees of the same species (Sesbou and Nepveu 1991). Thus, the cambium of sprouts may have slightly more developed features than that of seed originated trees of the same age at least in some growing sites but the difference is not clear.
4.2 Growth site
The maturation age of wood in downy birch appeared to differ slightly at different growth sites and according to different anatomical characteristics. Also in hybrid poplar (Populus x euramericana (Dode) Guinier) maturation age differed between growth sites, even though the order of characteristics to mature was similar (Pezlen 1994). In this study in downy birch, the two first CAGs consisted of wholly juvenile wood, the one or two next ones maturing wood, and the wood could be kept as wholly mature starting from CAG 16–20 or CAG 21–25 years according to most of the studied characteristics.
Changes in dimensions of fibres were always small from the pith outwards. The trees at the Jakokoski peat site were the only ones that showed maturation according to fibre wall thickness. In Jakokoski mineral site trees, instead, the diameter of the fibre lumens stabilised during CAG 21–25 years, whereas in trees of the Punkaharju site it was the smallest and stabilised very gradually, the difference in it between the cambially youngest and oldest studied wood being very small. Although both the fibre wall thickness and the lumen diameter increased during maturation, the increase in wall thickness was greater, causing the wall:lumen ratio to increase from the pith to the bark. This trend is logical, because as a tree grows, it requires greater mechanical strength (Poorter et al. 2009). One characteristic that showed maturation in downy birch wood was the vessel lumen diameter, particularly in trees at the Jakokoski mineral site. Vessel size indicates maturation in diffuse-porous hybrid poplar (Peszlen 1994), and in ring-porous tree species (Heliñska-Raczkowska 1994; Heliñska-Raczkowska and Fabisiak 1999; Tsuchiya and Furukawa 2009), as well. The decrease in the counted anatomical characteristics from the pith to the bark was clearer than the increase in the measured characteristics. The stabilisation in the decrease in the densities of vessels and axial parenchyma cells occurred slightly earlier in birches of mineral sites than in those of peat sites in this study, which agrees with the observation of Pezlen (1994) that maturation occurs earlier at better sites.
Even though the studied anatomical characteristics, except ray density, differed between birches grown at different sites, the relationship for a given characteristic between sites usually remained similar from the pith to the bark. In black alder (Alnus glutinosa (L.) Gaertner), as well, the vessel density and the fibre lumen diameter has been shown to differ between sites (Usta et al. 2014). The values of the vessel lumen diameter, the vessel density and the fibre lumen diameter for trees particularly from the Jakokoski mineral site corresponded with those measured previously for downy birch (Bhat 1980; Bhat and Kärkkäinen 1980). However, the thickness of the double cell wall of fibres was clearly lower in this study at all four studied growth sites than according to Bhat (1980), who measured values of 8–11 µm, the clearest increase starting at ca. 25 years of cambial age. In this study, the thickest walls were observed in the trees at both Jakokoski sites, which were located geographically near to each other, but possessed different soil types. In addition to genetic factors, available nutrients, e.g. potassium and sodium, can affect cell wall thickness and vessel lumen diameter (Sette et al. 2014), even though the primary reasons for cell enlargement are water availability and hormones (Kozlowski and Pallardy 1997). As common environmental and physiological reasons for cell expansion exist, the positive correlation between lumen diameters of vessels and fibres was expected. The high vessel density linked with thin walls of fibres in juvenile stage supports, as well, the above-mentioned common causes for cell enlargement.
The vessel size:number ratio, indicating hydraulic conductivity (Sperry et al. 2006; Zanne and Falster 2010), varied significantly in trees growing at different sites. The ratio was highest, i.e. the vessels widest, in the trees of the mineral sites, particularly in those of the Jakokoski site, in which the high stand density may have affected the ratio. High stand density increases the allocation of growth into stem instead of branches in small trunks (Perala 1973); thus stand density may also affect stem anatomy, e.g. vessel size. The alternative resourcing for conductivity and strength is emphasised by the correlations observed between fibre wall:lumen ratio and vessel characteristics at maturing stage. These correlations suggest that high hydraulic conductivity may weaken the wood and thus expose it to damage. Wide hydraulically efficient vessels increase the risk for both freeze-induced and drought-induced embolism (Tyree and Zimmerman 2002). Small vessels are better adapted to slow, fast and repeated freezing and thawing (Sevanto et al. 2012), which freezing habits all are common in the climate of Finland. Even though there is not commonly a lack of water during growth season for either of the soil types included in this study (see Hotanen et al. 2008), it is more probable at mineral than peat soils and thus smaller vessels could be expected to exist in the birches growing at mineral soils. On the other hand, peat soils may suffer even lack of oxygen (Viherä-Aarnio 2008), which, as well, may have an impact on wood anatomy. The percentage area of vessels, indicating conductive capacity (Zanne et al. 2010), was quite similar between sites and corresponded relatively well with the values found previously for downy birch (Kujala 1946).
The abundance of axial parenchyma cells was different between trees of different growth sites, particularly near the pith. The cells were more abundant at peat than mineral sites, which was also the case for vessels. The high amount of axial parenchyma cells has been suggested to be connected to large water storage capacity and high conductive capacity (Zheng and Martinez-Cabrera 2013) which was not the case in this study, as no difference in conductive capacity, i.e. vessel area, was observed. Instead, Martinez-Cabrera et al. (2009) observed that the amount of axial parenchyma correlates negatively with precipitation, meaning that good availability of water decreases the need to store it. The observed negative correlation between the abundance of axial parenchyma cells and vessel composition suggests that hydraulic conductivity and the need for water storage oppose each other in downy birch in juvenile wood, at least at this type of growth sites, where the lack of water is uncommon.
The ray density found in this study was similar at all the studied sites, and corresponded well the results of Bhat and Kärkkäinen (1980). In this study the ray density correlated only seldom with vessel characteristics, indicating that the role of rays is not so clear in water storage than that of axial parenchyma. The roles of axial parenchyma and rays might be at least partly opposing, rays being important in supporting the tissue, in addition to storage (Zheng and Martinez-Cabrera 2013). The flexible function of rays may show as stable amount of them, as the need of a tree to ‘decide’ into which cell type it should invest diminishes. However, no trade-off between storage and strength was observed in this study. Storage and strength has indeed been observed to be an alternative to investing in some species (Poorter et al. 2010; Martinez-Cabrera et al. 2009). As strength of fibres increases from the pith to the bark, and the proportion of fibres increases, the amount of fibres and their connections with each other may compensate the possible loss of strength caused by decreasing ray density.
5 Conclusions
According to the results of this study, no clear difference in wood maturity was observed between seedlings and sprouts of the same age. However, in few cases, sprouts exhibited more mature features than seedlings.
Anatomical differences in xylem were evident between growth sites. Some characteristics, such as the vessel size:number ratio, were greater in trees at mineral than at peat sites, whereas the vessel density and abundance of axial parenchyma cells were higher in trees at peat than at mineral sites. Differences were also observed in all other characteristics except ray density, but they were not as clearly polarised according to soil type. As well, soil affected the age of maturation in downy birch; maturation occurred during the previous CAG in the trees grown in the mineral sites when compared with the trees grown in the peat sites according to vessel characteristics and density of axial parenchyma cells. The fact that rays have two different functions, storage and conducting water and nutrients between xylem, cambium and phloem on the one hand, and radial support of tissue on the other hand, may cause that there is no need to change its amount in xylem tissue between sites.
Some of the found correlations definitely exist, if wood from the pith to bark is included in the same calculations. Even if the wood is divided into CAGs of five years like in this study, the effect of maturation on results is possible. Different correlations might have existed, if studied trees would have been older and proportion of wholly matured wood had been marked. Anyway, the number of samples in wholly mature wood was enough to make conservative estimates based on correlation calculations: clearly less correlations existed in mature than in younger wood which indicates stabilization of the studied anatomical characteristics. The correlations between the studied anatomical characteristics suggest that some ecological adaptations may exist in downy birch wood. If the wood possesses many vessels, it also requires many axial parenchyma cells for storage. As the vessel percentage area stayed quite similar from the pith to the bark and between growth sites, the needed hydraulic capacity was stable. However, the efficiency of hydraulic conductivity is clearly higher in the trees grown at mineral than peat sites according to the vessel size:number ratio. Mineral sites can commonly be kept as better growing sites for trees.
Soil type may affect anatomy, as particularly vessel characteristics but axial parenchyma, as well, seemed to be polarized between soils. This may affect the growth of the trees.
Acknowledgements
The authors wish to thank Mr Heimo Tynkkynen for help in tree harvesting, Mr Simo Heiskanen, Ms Fardowsa Ali and Ms Maini Mononen for help in preparing the microscopic sections, and Mr Jarmo Pennala for helping in anatomical measurements. Trees were donated by Finnish Forest and Park Service (Jakokoski and Hattuvaara) and Mr. Olli Laukkanen (Punkaharju), which is acknowledged.
References
Bhat K.M. (1980). Variation in structure and selected properties of Finnish birch wood. I. Interrelationships of some structural features, basic density and shrinkage. Silva Fennica 14(4): 384–396. https://doi.org/10.14214/sf.a15032.
Bhat K.M., Kärkkäinen M. (1980). Distinguishing between Betula pendula Roth. and Betula pubescens Ehrh. on the basis of wood anatomy. Silva Fennica 14(3): 294–304. https://doi.org/10.14214/sf.a15025.
Bhat K.M., Kärkkäinen M. (1981). Variation in structure and selected properties of Finnish birch woods. III. Proportion of wood elements in stems and branches in Betula pendula Roth. Silva Fennica 15(1): 1–9. https://doi.org/10.14214/sf.a15036.
Bonham V.A., Barnett J.R. (2001). Fibre length and microfibril angle in Silver birch (Betula pendula Roth). Holzforschung 55(2): 159–162. https://doi.org/10.1515/HF.2001.026.
Eilmann B., Sterck F., Wegner L., De Vries S.M.G., von Arx G., Mohren G.M.J., den Ouden J., Sass-Klaassen U. (2014). Wood structural differences between northern and southern beech provenances growing at a moderate site. Tree Physiology 34(8): 882–893. https://doi.org/10.1093/treephys/tpu069.
Fagerstedt K., Pellinen K., Saranpää P., Timonen T. (2005). Mikä puu – mistä puusta. [Which tree – which wood]. Yliopistopaino, Helsinki. 180 p.
Heliñska-Raczkowska L. (1994). Variation of vessel lumen diameter in radial direction as an indication of the juvenile wood growth in oak (Quercus petraea Liebl.). Annales des Sciences Forestières 51(3): 283–290. https://doi.org/10.1051/forest:19940307.
Heliñska-Raczkowska L., Fabisiak E. (1999). Radial variation of earlywood vessel lumen diameter as an indicator of the juvenile growth period in ash (Fraxinus excelsior L.). Holz Roh. Werkst. 57(4): 283–286. https://doi.org/10.1007/s001070050059.
Hotanen J.-P., Nousiainen,H., Mäkipää R., Reinikainen A., Tonteri T. (2008). Metsätyypit – opas kasvupaikkojen luokitteluun. [Forest types – a guide to classify the growth sites]. Metsäkustannus. 192 p.
Kauppi A., Rinne P., Ferm A. (1987). Initiation, structure and sprouting of dormant basal buds in Betula pubescens. Flora 179: 55–83.
Kozlowski T.T., Pallardy S.G. (1997). Growth control in woody plants. Academic Press, London. 641 p.
Kujala V. (1946). Koivutukimuksia. Summary: some recent research data on birches. Communicationes Instituti Forestalis Fenniae 34(1). 34 p. ISBN 951-570-296-8.
Martinez-Cabrera H.I., Jones C.S., Espino S., Schenk H.J. (2009). Wood anatomy and wood density in shrubs: responses to varying aridity along transcontinental transects. American Journal of Botany 96(8): 1388–1398. https://doi.org/10.3732/ajb.0800237.
Perala D.A. (1973). Stand equations for estimating aerial biomass, net productivity and stem survival of young aspen suckers on good sites. Canadian Journal of Forest Research 3: 288–292.
Peszlen I. (1994). Influence of age on selected anatomical properties of Populus clones. IAWA Journal 15(3): 311–321. https://doi.org/10.1163/22941932-90000613.
Poorter L., McDonald I., Alarcón A., Fichtler E., Licona J.-C., Pena-Claros M., Sterck F., Villegas Z., Sass-Klaassen U. (2009). The importance of wood traits and hydraulic conductance for the performance and life history strategies of 42 rainforest species. New Phytologist 185(2): 481–492. https://doi.org/10.1111/j.1469-8137.2009.03092.x.
Sesbou A., Nepveu G. (1991). Infraspecific variability in Eucalyptus camaldulensis coppice and effect of the 1st cutting on wood density, pulp yield and fiber length. Silvae Genetica 40: 173–179.
Sette C.R. Jr, de Deus J.C. Jr, Tomazello Filho M., Padua F.A. de, Calil F.N., Laclau J.P. (2014). Wood quality changes caused by mineral fertilization. Cerne 20: 251–258.
Sevanto S., Holbrook N.M., Ball M.C. (2012). Freeze/thaw-induced embolism: probability of critical bubble formation depends on speed of ice formation. Frontiers of Plant Sciences 3(107): 1–12. https://doi.org/10.3389/fpls.2012.00107.
Sperry J.S., Hacke U.G., Pittermann J. (2006). Size and function in conifer tracheids and angiosperm vessels. American Journal of Botany 93(10): 1490–1500. https://doi.org/10.3732/ajb.93.10.1490.
Tsuchiya R., Furukawa I. (2009). Radial variation in the size of axial elements in relation to stem increment in Quercus serrata. IAWA Journal 30(1): 15–26. https://doi.org/10.1163/22941932-90000199.
Tyree M.T., Zimmermann M.H. (2002). Xylem structure and the ascent of sap. Springer, Berlin, Germany. https://doi.org/10.1007/978-3-662-04931-0.
Usta A., Yilmaz M., Malkocoglu S., Serdar B., Yilmaz S., Bozlar T. (2014). Effects of environmental factors on wood anatomy of black alder (Alnus glutinosa (L.) Gaertner subsp. barbata (C.A. Meyer) Yalt) from two different origins of eastern black sea region in Turkey. Fresenius Environmental Bulletin 23: 1778–1784.
Veenin T., Fujita M., Nobuchi T., Siripatanadilok S. (2005). Radial variations of anatomical characteristics and specific gravity in Eucalyptus camaldulensis clones. IAWA Journal 26: -361.
Viherä-Aarnio A. (2008). Levinneisyys ja kasvupaikat. [Distribution and growth sites]. In: Niemistö P., Viherä-Aarnio A., Velling P., Heräjärvi H., Verkasalo E. (eds.). Koivun kasvatus ja käyttö. [Cultivation and usage of birch]. Metsäkustannus. p. 29–30.
Zanne A.E., Falster D.S. (2010). Plant functional traits – linkages among stem anatomy, plant performance and life history. New Phytologist 185(2): 348–351. https://doi.org/10.1111/j.1469-8137.2009.03135.x.
Zanne A.E., Westoby M., Falster D.S., Ackerly D.D., Loarie S.R., Arnold S.E.J., Coomes D.A. (2010). Angiosperm wood structure: global patterns in vessel anatomy and their relation to wood density and potential conductivity. American Journal of Botany 97(2): 207–215. https://doi.org/10.3732/ajb.0900178.
Zheng J., Martinez-Cabrera H.I. (2013). Wood anatomical correlates with theoretical conductivity and wood density across China: evolutionary evidence of the functional differentiation of axial and radial parenchyma. Annals of Botany 112(5): 927–935. https://doi.org/10.1093/aob/mct153.
Zobel B.J., van Buijtenen J.P. (1989). Wood variation. Its causes and control. Springer Series in Wood Science. 363 p. https://doi.org/10.1007/978-3-642-74069-5.
Zobel B.J., Sprague J.R. (1998). Juvenile wood in forest trees. Springer Series in Wood Science. 300 p. https://doi.org/10.1007/978-3-642-72126-7.
Total of 30 references.
