Gundega Done  ,
Jānis Ozoliņš,
Guna Bagrade,
Jurģis Jansons,
Jānis Baumanis,
Alekss Vecvanags,
Dainis Jakovels
,
Jānis Ozoliņš,
Guna Bagrade,
Jurģis Jansons,
Jānis Baumanis,
Alekss Vecvanags,
Dainis Jakovels
A case study for best suitable methods of monitoring demographic structure in cervid populations to predict increasing forest damages
Done G., Ozoliņš J., Bagrade G., Jansons J., Baumanis J., Vecvanags A., Jakovels D. (2024). A case study for best suitable methods of monitoring demographic structure in cervid populations to predict increasing forest damages. Silva Fennica vol. 58 no. 2 article id 23025. https://doi.org/10.14214/sf.23025
Highlights
- The study examines the interaction between sex-age structure of deer populations and forest damage throughout the country (Latvia)
- In pine stands, a higher female biased pellet group density index correlates with larger damage to pine trees through the browsing or debarking
- Counting pellet groups and setting trail cameras both provide useful data on sex and age structure in moose and red deer populations that can be used for population monitoring.
Abstract
The overall increase of ungulate populations in modern Europe has contributed to conflicts in national economies, particularly between game management and the forestry sector. This study assessed damage risks to young pine (Pinus sylvestris L.), spruce (Picea abies (L.) H. Karst.) and aspen (Populus tremula L.) stands at two spatial scales. One level assessed the interaction between sex-age structure of cervid populations, measured by pellet group density, and forest damages, measured as the percentage of heavily browsed trees in 2040 stand surveys distributed proportionally throughout the country. The second level compared pellet counts and trail-camera-based records of moose (Alces alces L.) and red deer (Cervus elaphus L.) presence in a pilot study area. We examined whether 1) there is a correlation between damage amount and ungulate population structure and 2) are the data from trail cameras suitable for wider use in monitoring ungulate population structure. The study confirmed significantly higher moose pellet group densities in pine than in spruce and aspen stands. Pine damages were greater in stands with higher moose pellet group density, especially with female moose prevailing over male moose density index. The red deer pellet group densities were significantly higher in heavily damaged pine and spruce stands, regardless of sex-age structure. In most cases, there were no statistically significant differences between the two survey methods of ungulate population structure by using pellet count transects and trail camera fixations. Both methods provide comparable data on sex-age structure in moose and red deer populations if seasonal and habitat-predicted biases are considered. However, trail cameras are more widely applicable and easier to use by hunters than pellet counts.
Keywords
age structure;
Alces alces;
Cervus elaphus;
camera trapping;
damage to trees;
pellet group counts;
sex structure
-
Done,
Latvian State Forest Research Institute ‘Silava’, Riga street 111, Salaspils, LV-2169, Latvia
 https://orcid.org/0000-0002-2122-7154
E-mail
gundega.done@silava.lv
https://orcid.org/0000-0002-2122-7154
E-mail
gundega.done@silava.lv
-
Ozoliņš,
Latvian State Forest Research Institute ‘Silava’, Riga street 111, Salaspils, LV-2169, Latvia
https://orcid.org/0000-0002-6647-9128
E-mail
janis.ozolins@silava.lv
-
Bagrade,
Latvian State Forest Research Institute ‘Silava’, Riga street 111, Salaspils, LV-2169, Latvia
https://orcid.org/0000-0002-1031-0665
E-mail
guna.bagrade@gmail.com
- Jansons, Latvian State Forest Research Institute ‘Silava’, Riga street 111, Salaspils, LV-2169, Latvia E-mail jurgis.jansons@silava.lv
- Baumanis, Latvian State Forest Research Institute ‘Silava’, Riga street 111, Salaspils, LV-2169, Latvia E-mail jbaumanis@inbox.lv
-
Vecvanags,
Institute for Environmental Solutions ‘Lidlauks’, Cēsis, LV-4126, Latvia
https://orcid.org/0000-0003-1233-764X
E-mail
alekss.vecvanags@vri.lv
-
Jakovels,
Institute for Environmental Solutions ‘Lidlauks’, Cēsis, LV-4126, Latvia
https://orcid.org/0000-0002-2969-5972
E-mail
dainis.jakovels@vri.lv
Received 30 May 2023 Accepted 22 February 2024 Published 13 March 2024
Views 80735
Available at https://doi.org/10.14214/sf.23025 | Download PDF

1 Introduction
Nearly all recent studies addressing game and forest management interactions in Europe and North America are motivated by the same general statement – deer (Cervidae) populations are increasing in many parts of their distribution range (Pascual-Rico et al. 2020; Spitzer et al. 2020; Loosen et al. 2021). There are many factors (abiotic and biotic) affecting deer populations – starting with climate that affect both food resource availability (Heinze et al. 2010; Spitzer et al. 2020) and animal survival and wellbeing (Shively et al. 2019), road barriers (Ball and Dahlgren 2002) and road density (Putman et al. 2011; Mathisen et al. 2018), the presence of natural predators (Christianson and Creel 2008; Gicquel et al. 2020; Tallian et al. 2021) and human activities via game management (Wam and Hofstad 2007; Felton et al. 2017) and forest management (Brousseau et al. 2017).
Conflicts between forest owners and hunters are increasingly escalating also in Latvia, particularly in winter and spring, when Norway spruce (Picea abies (L.) H. Karst.) and young Scots pine (Pinus sylvestris L.) stands are damaged (Candaele et al. 2020; Franklin et al. 2020; Gicquel et al. 2020), mainly by moose (Alces alces L.) and red deer (Cervus elaphus L.). Forests in Latvia take up 3.441 million hectares of land, or 53% of the country’s territory while forestry, wood processing and furniture manufacturing represents 6.5% of GDP in 2021 and exports amounted to 3.6 billion EUR. Forest stands with Scots pine covering 33% from all forestland and 47% from state owned forestland dominate among all other forest stands. In the Baltic Sea region, Scots pine is characterized by straight trunks, slender branches and consequently high-quality wood (Baumanis et al. 2014), and therefore Scots pine economically is a very important tree species. Damage such as broken main stem, heavily stripped bark and heavily browsed twigs reduces the growth rate of trees (Herfindal et al. 2015; Mathisen et al. 2017), reduces future timber quality, may change the composition of stands (Wallgren et al. 2013) and affect potential future income (Lavsund 1987; Reimoser and Putman 2011; Herfindal et al. 2015). In young pine stands on fertile soils, in particular, the need to remove shrubs and deciduous trees during early thinning makes pine even more vulnerable to moose and red deer damage. Therefore, minimizing browsing pressure on pine is one of the main challenges for forest management. Nearly 100 thousand hectares of pine stands in Latvia are below 20 years of age. In 2021, 95 thousand hectares of total forest area were reported as been damaged by wild animals (Latvian forest sector in facts and figures 2022). The financial resources that the Joint Stock Company ‘Latvia’s State Forests’ allocates for young pine stand protection are increasing annually (Done et al. 2021).
Nowadays, the populations of wild ungulates in Latvia are very high – over the period from year 2000 to 2021, the estimated number of red deer alone has grown threefold – from 21 000 to 66 000. The total harvest amount of red deer has increased even more – from nearly 5000 animals to more than 25 000 animals in the last hunting season (State Forest Service 2023). Thus, game management also contributes to recent national economy, furthermore, providing various benefits such as rental fees for hunting rights to landowners and indirect incomes from recreation services in rural communities (Baumanis et al. 2011). Studies indicate that joint forest and game management can be economically beneficial (Beljan et al. 2022), and this type of management can provide a better understanding of the ecological and social importance of managing native deer species in forest ecosystems (Apollonio et al. 2017). The level at which knowledge-based decisions are made and implemented is significant. Local knowledge about ungulate population species composition, size and structure provides information for improved game management (Hoffman and Flø 2016; Martinez and Martin 2019), and simultaneously gives an opportunity for better collaboration between stakeholders (Dressel et al. 2020), and the possibility to avoid conflicts with other sectors such as forest management and agriculture (Bugmann and Weisberg 2003; Gerhardt et al. 2013; Linnel et al. 2020).
Various methods are used to assess game animal population dynamics for ecological studies or management planning. However, the number of individuals should not be the only index to determine population dynamics and impact on the environment, especially considering long-term sustainable management requirements (Putman et al. 2011). A wildlife triangle scheme (Helle et al. 2016) to monitor several species has been developed in Finland and is applied in snow conditions. Ungulate pellet group counts are suitable for estimating species composition and activity (Ball and Dahlgren 2002; Härkönen et al. 2008; Rönnegård et al. 2008) and is still the most widely used census technique in Latvia and provides the best hard evidence of moose and red deer presence, location specific population densities and sex-age structure. Hence, this method indicates not just the numbers of individuals but to some extent also highlights the use of habitats by a certain species (Månsson et al. 2011), as well as the sex and age of the individuals. Due to rapidly developing technologies, various new electronic devices and equipment are emerging in animal research and these improve data collection efficiency and offer new research opportunities. For example, Global positioning system (GPS) telemetry provides information about home range size and changes according to season, average movement speed, time of rest, etc. (Katzner and Arlettaz 2020). Camera traps have been in wide use for more than 20 years (Wearn and Glover-Kapfer 2019; Green et al. 2020) and allow efficient estimation of species abundance, saving time and human resources (Trolliet et al. 2014; Palencia et al. 2020). Furthermore, camera traps or trail cameras are available not only to researchers but also to other interested parties, such as hunters, and these devices allow the collection of population information without disturbing the animals.
The goal of the study was to characterize the current impact of moose and red deer on forest rejuvenation, depending on ungulate population abundance and structure, and to suggest appropriate animal monitoring methods for conflict mitigation between forestry and game management. The study was organized in Latvia at two spatial scales – one for assessing the interaction between the sex-age structure of deer populations and forest damage throughout the country, and for a smaller scale comparison between traditionally obtained (pellet group density) and trail-camera-based deer presence indices in a reference study area. In a limited area, we measured the effectiveness of a traditionally applied and a new method for revealing population sex-age structure by comparison of data from five trail cameras for 11 months (2020) and field data of pellet group counts along transects across the same territory in the period 2019–2021. Combining results from both studies, we hypothesized that 1) there is a strong correlation between damage amount and ungulate population structure and 2) data from trail cameras are suitable for wider use in assessing local ungulate population structure.
2 Materials and methods
2.1 Study area
Part of the study was conducted over the entire territory of Latvia. The climate is influenced by the location of the country in the northwest of the Eurasian continent (continental climate) and by its proximity to the Atlantic Ocean (maritime climate) (Avotniece et al. 2012). According to the Latvian Environment, Geology and Meteorology Centre, summers are sunny and warm (mean temperature +16.5 – +17 °C), while winters are rather cold (mean temperature –3 – –7 °C). The prevailing winds are from the south, south-west and south-east. Latvia receives approximately 550–850 mm precipitation per year. The vegetation period (when average daily temperature is above +5 °C) lasts for 185–195 days (from middle April until middle October). Snow cover in winter lasts for 75–115 days per year, usually from the beginning of December until the end of March. Forest area is about 53% of the territory of Latvia; the dominant species (according to occupied forest area) are Scots pine (33%), birch (Betula pendula Roth and Betula pubescens Ehrh.) (30%), Norway spruce (19%) and aspen (Populus tremula L.) (7%) (Latvian forest sector in facts and figures 2022). 13% of all pine stands and 80% of all aspen stands are less than 20 years old, and 80% of all spruce stands are less than 40 years old.
Populations of three wild deer species – moose, red deer and roe deer (Capreolus capreolus L.) are present in the territory of Latvia. Moose are more abundant in the eastern part of the country, whereas red deer densities are higher in the western part (Andersone-Lilley et al. 2010). Roe deer are distributed more evenly throughout the whole territory. Only moose can be considered as purely autochthonous since they were never extirpated (Baleishis et al. 1998) while red and roe deer were extirpated in the 17th and 18th centuries and their return was facilitated by releases and supplementary winter forage (Tauriņš 1982; Skriba 2011), hence the hunters continue to some extent provide for them supplementary forage during winter until nowadays, and the red deer is one of the target species of supplementary feeding (Andersone-Lilley et al. 2010). In the last three decades, the number estimates and annual hunting quotas for moose and red deer have been increasing, with some fluctuations (Andersone-Lilley et al. 2010) and in season 2021 the average moose and red deer population densities were 7.0 and 20.7 animals per 1000 ha of forest land, respectively (State Forest Service 2023).
The reference study area is located in central part of Latvia in Cesis county (Fig. 1) and is widely used for testing and advertising new methods of animal census before implementing in management praxis, e.g. aerial counts, trail cameras or acoustic sensors (Avots et al. 2022; Vecvanags et al. 2022). The size of the territory is 1400 ha, dominant tree species are Norway spruce, birch and pine, occupying 41%, 26% and 12% of forested area in territory, respectively. Climate conditions are similar to average conditions in whole country. The area has minor hills and the average height of the area is 170 m above sea level. According to State Forest Service data, the average moose and red deer densities in pilot area in year 2021 were 8.0 and 34.8 animals per 1000 ha of forestland.
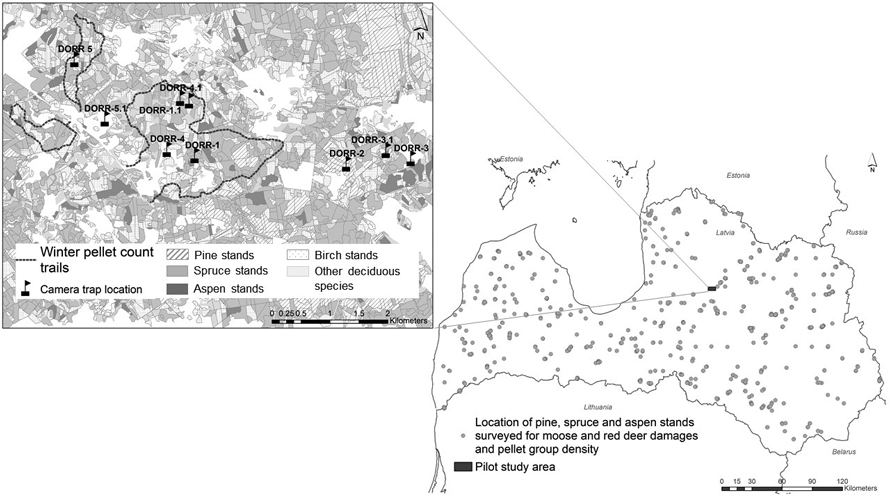
Fig. 1. Location of pine, spruce and aspen stands for ungulate damage surveys and pellet counts during 2017–2021 (picture on the right side). On the left side – the map of pilot territory located in central part of Latvia: transects of winter pellet group counts and location of trail camera. During the study, one camera (Dorr2) was permanently installed for detecting the passing animals while the location of four was changed to different positions to monitor animal activity in different parts of the study area. View larger in new window/tab.
2.2 Study design
2.2.1 Moose and red deer population structure vs. damage to pine, spruce and aspen stands at country level
Since 2014, within the framework of Latvia’s National Forest Monitoring, a special research program ‘Ungulate damage to young pine, spruce and aspen stands’ has been implemented. During the first four years, methodologies were developed and starting from 2017, 200 stands of each tree species (pine, spruce, aspen) are surveyed each year (a total of 600 stands). Stand selection is done following a regular grid of the National forest monitoring system and is based on Forest inventory data in the years 2017–2021 (LSFRI “Silava” 2022). Initially, pine, spruce and aspen forest stands, which occur in utilized grid cells were included in our study if 1) pine and aspen stands were up to 20 years old and spruce stands were up to 40 years old; 2) the proportion of the dominant tree species was at least 70% in terms of growing tree trunks. Field surveys of the forest stands were performed after complete disappearance of snow cover that usually took place in April. Within the period 2017–2021, the same stands were surveyed each year as long as they fitted the two above-mentioned conditions. Only if the characteristics of the initially selected stand changed during the study period, e.g. due to growth, preventing deer from reaching the edible branches or bark, it was substituted with the closest appropriate stand.
In order to get a site related relative density index for deer species that visited particular forest stands during winter period, 100 m2 circular plots were regularly distributed within each selected stand to represent 5% of the total forest stand area. In these plots the number of pellet groups left by moose and red deer was counted and divided according to sex (male, female) and age group (adult, juvenile) based on the different shape and size of the majority of pellets in each assessed pellet pile. Male (moose bull and deer stag) pellets are assumed to be relatively bigger and rounded or pyramid-shaped while female pellets are more stretched and thinner. Calves leave visibly smaller pellets most frequently located next to the adult pellet groups (Maccracken and Ballenberghe 1987; Jedrzejewski and Sidorovich 2010). We did not consider the possible small differences in daily defecation rates between sex or age groups.
Within the same circular sample plots, according to fresh damage level, all aspen, pine and spruce trees were classified as totally damaged (broken main stem and/or bark stripped from more than 80% of stem circumference), heavily damaged (50–80% of stem circumference with stripped bark and/or more than 50% of side branches browsed), lightly damaged (less than 50% of side branches browsed) and undamaged trees.
2.2.2 Moose and red deer population structure in the pilot study area by using pellet counts and trail camera data
Given that winter pellet group counts are widely used for ungulate census (Härkönen and Heikkilä 1999; Alves et al. 2013), the number of pellet groups per 100 m2 was assumed as a sufficiently sensitive index for abundance (Engeman 2005) of moose and red deer as well as their main sex and age groups, i.e. males – females and adults – calves. Pellet counts were performed and repeated over 3 years (2019, 2020 and 2021) in spring soon after snow melting in three transects with a total length of 16 km roughly crossing an area of 16 km2. Transects for pellet counting were chosen and drawn on the map before performing field survey with consideration of landscape and forest structure in order to cross as many stands of various forest age and tree species as possible (Fig. 1). The task of the surveyor was to start counting pellet groups from the forest edge and to keep moving along a previously designated transect using a GPS device with track lock function. Pellet groups within a 2 m wide corridor in every 50 m long stretch of the transect were recorded, thus sectioning all selected routes across the study area into 100 m2 sample plots. Pellet groups were sorted according to species/sex and age using the same method as described in previous paragraph.
The five camera traps were located in places with high animal activity (Fig. 1). We used Passive InfraRed (PIR) Dörr SnapShot MultiMobil3G cameras with data transmission capabilities, 0.6 s trigger time, 940 nm LED 20 m flash, connected to 6V external batteries. Both video and photo regimes were used during the study period in all cameras. Video and picture resolution were set to the highest settings and PIR sensor sensitivity was set to high. The cameras captured 16-megapixel (MP) colored images and videos during daylight and 3 MP black and white images at night. The sensor interval between photos was set to 30 seconds and video length was set to 30 seconds.
The cameras were operational between 04.02.2020 and 31.12.2020. Since the study task was to capture as much pictures as possible for gaining sex and age structure of populations, the cameras were located at spots preliminary best known for frequent crossing by the animals and less biased by a certain sex or age group. At the beginning of the research, all cameras were located near salt licking points or feeding places (attractants). During the study, one camera (Dorr2) was permanently installed for detecting the passing animals while the location of four was changed to different positions to monitor animal activity in different parts of the study area.
Five experienced mammal researchers reviewed all captured video and picture files and the animals were categorized according to species, sex and age if possible. We only used the files containing well-defined moose and red deer presence detections (altogether 10 793 files of video and picture series).
2.3 Data analysis
2.3.1 Pine, spruce and aspen stand damage vs. deer demographic structure
All stands assessed within the 5-year study period (2017–2021) were analyzed together getting a data pool of 2040 stand surveys including 756 pine, 664 spruce and 620 aspen stand surveys of repeated and original stand selection. Following the statement that not every twig or leaf browsed is damage to a tree and not every tree damaged is damage to a stand, and that the concept of “damage” and “benefit” depends on resource targets set by different interest groups (Reimoser and Putman 2011), we divided all stands in two groups according to damage severity: 0– undamaged (less than 10% heavily browsed and totally damaged trees for pine and aspen stands (n = 497 and n = 400, respectively) or less than 5% of trees for spruce stands (n = 531)); and 1 – damaged (10% or more heavily browsed and totally damaged trees for pine and aspen stands (n = 259 and n = 220) and 5% or more for spruce stands (n = 133)). The size of these critical thresholds are based on the knowledge that in pine and aspen stands a complete recovery of individual trees from heavy browsing wounds will not be possible at all or only partially while for spruce this damage can lead to infection with root and stem rot caused by fungi (Burņeviča et al. 2016).
Moose and red deer pellet group numbers per 100m2 were calculated for each stand survey and results structured considering division in pine, spruce and aspen stands as well as in sex groups of animals – male (M), female (F) and female with juvenile (F + J) pellet groups. Division F + J includes all F counted within surveyed forest stand.
As normality test for the pellet group densities failed, we used non-parametric pairwise Mann-Whitney U test to compare the overall ungulate pellet group densities and different sex and age group densities in damaged and undamaged pine, spruce and aspen stands (test output: Z-score, P value and effect size r). We also used Generalized linear model (GLM) to predict the changes of damaged tree proportion in pine, spruce and aspen stands by using the information of deer M and F densities in these stands. In this case we used linear model with maximum likelihood estimate, where dependent variable was damage level in stands and predictors – all deer density indices in these stands (damaged tree proportion in stand = moose M density, moose F density, red deer M density, red deer F density), (test output: model coefficient B, P value). We tested the main effects of all predictors.
2.3.2 Trail camera data and pellet count analysis in pilot study area
The files from trail cameras containing moose or red deer pictures were divided into events with equal duration. Time taken by shooting empty pictures or some other species that triggered cameras was included in these events. All video and photo files contained information about the date and exact time when the camera was triggered. Each 30-min event consisted of all files recorded within 30 minutes from the first file. For example, on September 1, the camera is triggered at 06:05:00 by a moose calf appearing in its field of operation, 20 consecutive 30-second videos are taken, during which a moose cow with two calves are visible on the camera. The next time the camera is triggered is at 06:26:30 by a red deer but with no clear sex and age. Summary of this 30-minute event is 1 moose cow, 2 moose calves and 1 undetermined red deer. Season and camera placement were noted (spring – data from February–May, summer – June–August and autumn – September–December). As there were few data points from autumn, summer and autumn files were pooled.
The pellet group numbers along transect lines were summarized and categorized according to the same sex and age categories. By comparing the fixed track in the GPS device with the number of sample plots, the actual average length of the transect stretches in 2019 and 2020 was determined to be 52 m with a 104 m2 area accordingly. A technical failure of the GPS device in 2021 did not allow differentiation of the recorded pellet groups into sample plots, therefore we calculated the average pellet group density per 100 m2 by dividing the total number by total transect area.
We compared M and F occurrence of moose and red deer from trail camera data with pellet group count results from transect lines in the reference territory by using a Chi square test (χ2). Trail camera data from spring were compared with pellet group count results from spring 2020, whereas data from summer + autumn were compared with pellet group counts from spring 2021. To avoid pellet group count data loss from year 2021, we used total numbers of pellet groups counted in transects both before and after camera trapping trial, and sum of maximal numbers of animal per 30-minute events from trail cameras. We assumed statistically insignificant differences between M and F proportions for moose and red deer between camera data in different seasons/placements and pellet group count results as evidence that both survey methods provided similar occurrence of animals.
We used a probability of 95% as a threshold for statistical significance in all statistical analyses, and calculations were performed with MS Excel and SPSS22 software.
3 Results
3.1 Demographic structure of cervid populations as obtained by counting pellet groups
Population density index according to mean pellet group numbers per 100 m2 in all surveyed stands was 0.56 ± 0.02 for moose and 0.59 ± 0.02 for red deer. The average moose pellet group density was higher in pine and aspen stands than in spruce stands, reaching 0.74 ± 0.04 in pine, 0.60 ± 0.03 in aspen and 0.33 ± 0.02 in spruce stands. Red deer, on the other hand, had higher densities in pine and spruce stands compared to aspen stands: 0.69 ± 0.04 in pine, 0.64 ± 0.04 in spruce and 0.43 ± 0.03 in aspen stands. In all stands, there were an insignificant predominance of moose and red deer F over M, but only in spruce stands there was significantly higher pellet group density of moose cows than that of the bulls (Mann-Whitney U test, Z mooseF vs. mooseM = 2.101; P = 0.036, r = 0.10). In all stands, the groups of moose and red deer females with juveniles (F + J) prevailed – 0.44 ± 0.03 and 0.43 ± 0.33 accordingly (see Table 1 and Fig. 2 for details).
| Table 1. Values (mean ± standard error (±SE), median and maximal (Max) values) of moose and red deer pellet group densities per 100 m2 sample plots in pine (n = 756), spruce (n = 664) and aspen (n = 620) stands in Latvia during 5-year period (2017–2021) of survey. (M – males; F – females; J – juveniles) | ||||||||||
| Pine stands | Spruce stands | Aspen stands | ||||||||
| Mean ± SE | Med | Max | Mean ± SE | Med | Max | Mean ± SE | Med | Max | ||
| Moose Total | 0.74 ± 0.04 | 0.33 | 10.06 | 0.33 ± 0.02 | 0.11 | 5.25 | 0.60 ± 0.03 | 0.28 | 10.75 | |
| Moose M | 0.26 ± 0.02 | 0 | 5.41 | 0.11 ± 0.0 | 0 | 2.5 | 0.22 ± 0.02 | 0.22 | 3 | |
| Moose F | 0.32 ± 0.02 | 0.07 | 3.75 | 0.15 ± 0.01 | 0 | 4.75 | 0.26 ± 0.02 | 0.22 | 10 | |
| Moose F + J | 0.44 ± 0.03 | 0.17 | 7.00 | 0.19 ± 0.02 | 0 | 4.75 | 0.36 ± 0.03 | 0.25 | 10 | |
| Red deer Total | 0.69 ± 0.04 | 0.28 | 7.86 | 0.64 ± 0.04 | 0.28 | 7.25 | 0.43 ± 0.03 | 0.22 | 9.25 | |
| Red deer M | 0.21 ± 0.01 | 0 | 3.88 | 0.18 ± 0.01 | 0 | 2.81 | 0.15 ± 0.01 | 0 | 2.75 | |
| Red deer F | 0.25 ± 0.02 | 0 | 5.38 | 0.22 ± 0.02 | 0 | 5.75 | 0.15 ± 0.02 | 0 | 6 | |
| Red deer F + J | 0.43 ± 0.03 | 0.1 | 7.25 | 0.38 ± 0.027 | 0.13 | 6.25 | 0.23 ± 0.023 | 0 | 6.75 | |
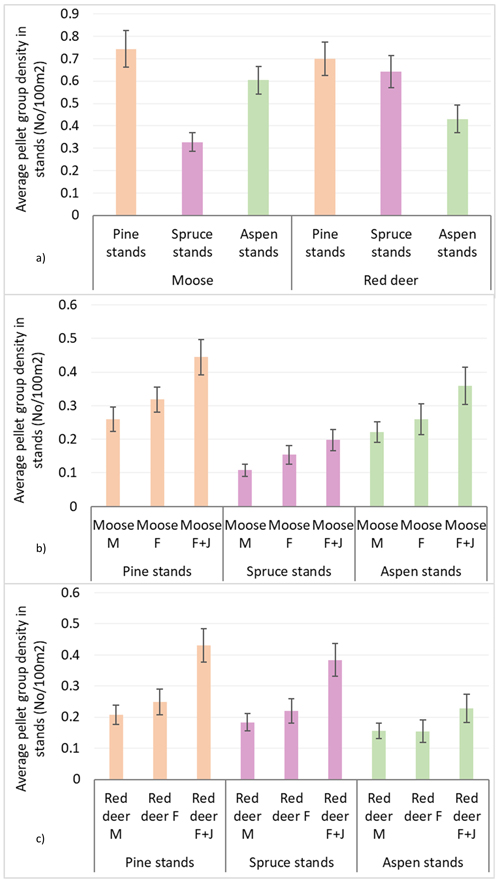
Fig. 2. Moose and red deer pellet group densities (pellet group number per 100 m2) in all pine, spruce and aspen stands in Latvia in 5-year period (2017–2021): (a) moose and red deer in total, (b) moose in sex-age classes, (c) red deer in sex-age classes. M – male; F – female; J – juvenile (mean values ± confidence interval).
3.2 The effect of moose and red deer local abundance and population structure to damage rate in pine, spruce and aspen stands
Moose pellet group densities were more than 2-times higher in damaged pine and aspen stands than in undamaged ones being 1.34 ± 0.09 and 0.43 ± 0.03 in pine stands, 0.92 ± 0.07 and 0.38 ± 0.03 in aspen stands, respectively; these differences were statistically significant (Mann-Whitney U test, Z damaged vs undamaged pine stands = 10.716; P = 0.000, r = 0.39; Z damaged vs undamaged aspen stands = 8.000, P = 0.000; r = 0.31) (Fig. 3). Only in damaged pine and spruce stands there was significantly higher density index for moose F than for moose M – 0.56 ± 0.04 and 0.47 ± 0.04 in pine stands, and 0.18 ± 0.04 and 0.06 ± 0.02 for moose F and M in spruce stands, respectively (Mann-Whitney U test, Z damaged pine stands = 2.202; P = 0.028; r = 0.09; Z damaged spruce stands = 2.310, P = 0.025; r = 0.14). In undamaged pine stands as well as in damaged and undamaged aspen stands there were no differences between moose M and F density indices (Fig. 4).
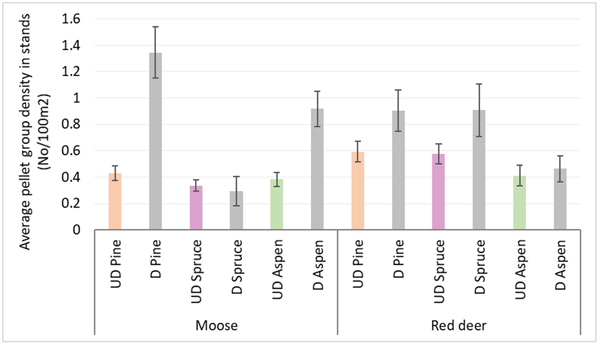
Fig. 3. Moose and red deer pellet group densities in undamaged and damaged pine, spruce and aspen stands in Latvia in 5-year period (2017–2021). UD – undamaged stands, D – damaged stands. (Mean values ± confidence interval).
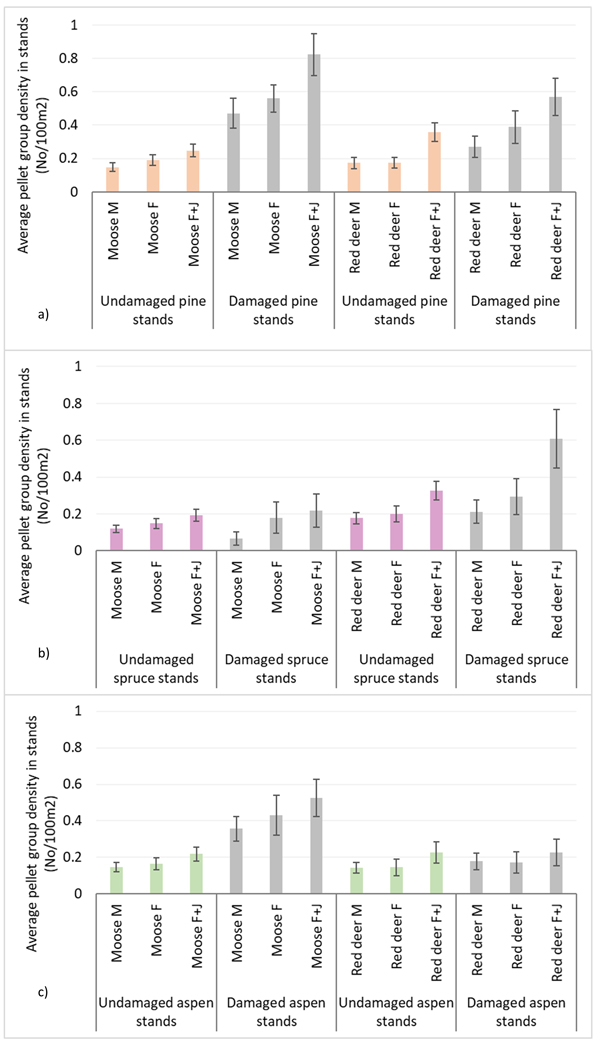
Fig. 4. Moose and red deer pellet group densities of all animals and their sex-age groups in undamaged and damaged pine (a), spruce (b) andaspen (c) stands in Latvia in 5-year period (2017–2021). M – male; F – female; J – juvenile; UD – undamaged stands, D – damaged stands. (Mean values ± confidence interval).
Red deer pellet group density was significantly (1.5-times) higher in damaged pine (0.90 ± 0.08) and spruce (0.91 ± 0.1) stands than in undamaged ones (0.59 ± 0.04 and 0.57 ± 0.04, respectively) (Mann-Whitney U test, Z damaged vs undamaged pine stands = 2.978, P = 0.002; r = 0.11; Z damaged vs undamaged spruce stands = 4.368, P = 0.000; r = 0.17) (Fig. 3). There were no significant differences between red deer F and M pellet group densities in damaged and undamaged stands in any of three forest stand groups (Fig. 4).
Generalized linear model results show significant connection between moose M and F density indices and damage rate in pine stands – if the density of moose M or F in the pine stand increases, the proportion of damaged pines will also increase significantly (GLM; Bmoose M = 5.176, P = 0.000 and Bmoose F = 7.999; P = 0.000). In spruce stands, where moose M density is smaller, the damaged tree proportion is significantly higher (Bmoose M = –1.534; P = 0.030); and in aspen stands, if the moose M or F, or red deer M densities are higher, the damaged aspen proportion in stand also is significantly higher (GLM; Bmoose M = 20.140; P = 0.000; Bmoose F = 8.033; P = 0.000; Bred deer M = 7.710; P = 0.008) (Table 2).
| Table 2. Damaged tree proportion change predictions in pine, spruce and aspen stands by using deer density indices. Test results of Generalized Linear model (significant differences are bolded). | ||||||||
| Parameter | B | Std. Error | 95% Wald Confidence Interval | Hypothesis Test | ||||
| Lower | Upper | Wald Chi-Square | df | Sig. | ||||
| Pine stands | (Intercept) | 6.024 | 0.6915 | 4.669 | 7.379 | 75.886 | 1 | 0.000 |
| Moose M | 5.176 | 1.2233 | 2.779 | 7.574 | 17.906 | 1 | 0.000 | |
| Moose F | 7.999 | 1.1916 | 5.663 | 10.334 | 45.060 | 1 | 0.000 | |
| Red deer M | 2.613 | 1.4217 | –0.173 | 5.400 | 3.379 | 1 | 0.066 | |
| Red deer F | 1.963 | 1.0878 | –0.169 | 4.095 | 3.258 | 1 | 0.071 | |
| (Scale) | 213 564 a | 10.9845 | 193.084 | 236.216 | ||||
| Spruce stands | (Intercept) | 1.215 | 0.2168 | 0.790 | 1.640 | 31.391 | 1 | 0.000 |
| Moose M | –1.534 | 0.7072 | –2.920 | –0.148 | 4.703 | 1 | 0.030 | |
| Moose F | 0.549 | 0.4767 | –0.385 | 1.484 | 1.328 | 1 | 0.249 | |
| Red deer M | 0.235 | 0.5547 | –0.852 | 1.322 | 0.179 | 1 | 0.672 | |
| Red deer F | 0.378 | 0.3933 | –0.393 | 1.149 | 0.924 | 1 | 0.336 | |
| (Scale) | 19 133 a | 1.0501 | 17.182 | 21.306 | ||||
| Aspen stands | (Intercept) | 7.027 | 1.0665 | 4.937 | 9.117 | 43.417 | 1 | 0.000 |
| Moose M | 20.140 | 2.1302 | 15.964 | 24.315 | 89.383 | 1 | 0.000 | |
| Moose F | 8.033 | 1.4192 | 5.251 | 10.814 | 32.034 | 1 | 0.000 | |
| Red deer M | 7.710 | 2.9278 | 1.971 | 13.448 | 6.934 | 1 | 0.008 | |
| Red deer F | –1.356 | 2.0084 | –5.292 | 2.581 | 0.456 | 1 | 0.500 | |
| (Scale) | 396 235 a | 22.5046 | 354.493 | 442.891 | ||||
| Dependent Variable: Damaged tree proportion in stand. Model: (Intercept), Moose M, Moose F, Red deer M, Red deer F. a: Maximum likelihood estimate. | ||||||||
3.3 Pellet group counts vs. trail camera data in the pilot territory
According to the pellet group count results along transect lines in the pilot territory, the average numbers per 100 m2 of moose and red deer pellet pellet groups increased over a 3-year period (Table 3). However, there were no significant differences in moose and red deer pellet group densities between the years 2019 and 2020 (Mann-Whitney U test, Pin all cases > 0.05). Due to technical failures (missing pattern of value distribution in 2021), it was not possible to calculate the significance level of these changes during entire three-year period.
| Table 3. Values (mean ± standard error SE) of moose and red deer pellet group count results in pilot study area in central part of Latvia (Mean ± standard error SE) and total No of pellet groups counted (N) in these transects. (M – males; F – females; J – juveniles). | ||||||
| 2019 | 2020 | 2021 | ||||
| Mean ± SE | N | Mean ± SE | N | Mean* | N | |
| Moose Total | 0.21 ± 0.04 | 62 | 0.27 ± 0.04 | 85 | 0.35 | 111 |
| Moose M | 0.09 ± 0.02 | 27 | 0.08 ± 0.02 | 27 | 0.07 | 23 |
| Moose F | 0.08 ± 0.02 | 25 | 0.12 ± 0.02 | 39 | 0.17 | 55 |
| Moose F + J | 0.12 ± 0.02 | 10 | 0.18 ± 0.03 | 19 | 0.10 | 33 |
| Red deer Total | 1.27 ± 0.09 | 372 | 1.39 ± 0.11 | 442 | 2.10 | 664 |
| Red deer M | 0.17 ± 0.03 | 49 | 0.24 ± 0.04 | 77 | 0.42 | 134 |
| Red deer F | 0.75 ± 0.06 | 220 | 0.89 ± 0.07 | 285 | 1.23 | 388 |
| Red deer F + J | 0.35 ± 0.04 | 103 | 1.15 ± 0.09 | 80 | 0.45 | 142 |
| * Due to technical failures (missing pattern of value distribution in 2021), it was not possible to calculate the standard error for these values for year 2021. | ||||||
There were significantly higher density index of moose F than M, in 2020, 0.123 ± 0.021 and 0.085 ± 0.021, respectively (Mann-Whitney U test, Z = 2.079, P = 0.037; r = 0.26). Red deer F density indices were significantly higher than M in both years (Mann-Whitney U test, Z in both cases > 8.500, P = 0.000; r = 0.52) (Table 3).
In total, 13 671 video files and 7570 pictures of moose and red deer were captured with trail cameras. 23.5% of all red deer files were included in the category “unknown” and 10.8% were categorized as “not-a-male”. For moose, these rates were 8.5% and 3.2%, respectively. In further analysis, we used files in which species, sex and age were clearly defined. 9114 files with red deer detections were divided into 644 30-min events (spring 227, summer 417 (with attractant - 302 and without attractant - 115)) and 1698 files with moose detection – in 118 30- min events (spring 31, summer 86 (with attractant - 52 and without attractant - 34)).
There were no statistically significant differences between mean numbers per 30-min event for moose sightings depending on spring or summer season, but there were significantly more moose detections per 30-min events in summer from places with attractants than without (Mann-Whitney U test, Z = 0.022, P = 0.043; r = 0.002). There were significantly more red deer seen per 30-min event in spring than in summer (Mann-Whitney U test, Z = 3.940, P < 0.001; r = 0.10). There were significant differences for maximal numbers of red deer seen within 30-min events between places with and without attractants in summer (Mann-Whitney U test, Z = 2.954, P = 0.003; r = 0.11; see Table 4 for details).
| Table 4. Mean values of maximal animal numbers per 30-minute events in considered seasons (spring, summer/autumn) depending on trail camera placement in pilot study area – with or without attractants (in spring all cameras were located near attractants.). Sum – sum of maximal numbers of animal per 30-minute events. | ||||||||
| Spring | Summer Total | Summer with attractant | Summer without attractant | |||||
| Mean | Sum | Mean | Sum | Mean | Sum | Mean | Sum | |
| Moose Total | 1.31 ± 0.10 | 36 | 1.23 ± 0.04 | 100 | 1.31 ± 0.06 | 65 | 1.12 ± 0.05 | 35 |
| Moose M | 0.34 ± 0.08 | 11 | 0.401 ± 0.05 | 35 | 0.40 ± 0.07 | 21 | 0.41 ± 0.08 | 14 |
| Moose F | 0.59 ± 0.09 | 19 | 0.56 ± 0.05 | 48 | 0.52 ± 0.07 | 27 | 0.62 ± 0.08 | 21 |
| Moose F + J | 0.78 ± 0.15 | 25 | 0.75 ± 0.08 | 65 | 0.84 ± 0.11 | 44 | 0.62 ± 0.08 | 21 |
| Red deer Total | 1.05 ± 0.08 | 678 | 1.26 ± 0.07 | 810 | 1.33 ± 0.09 | 499 | 0.82 ± 0.06 | 311 |
| Red deer M | 1.30 ± 0.06 | 108 | 1.12 ± 0.03 | 135 | 1.23 ± 0.07 | 47 | 1.07 ± 0.03 | 88 |
| Red deer F | 2.59 ± 0.13 | 478 | 1.64 ± 0.06 | 465 | 1.75 ± 0.08 | 304 | 1.45 ± 0.09 | 161 |
| Red deer F + J | 0.88 ± 0.07 | 570 | 1.05 ± 0.08 | 675 | 1.20 ± 0.09 | 452 | 0.59 ± 0.06 | 223 |
The sex ratio of moose cows and bulls F:M did not differ significantly only in spring, when according to the camera data this ratio was 1:0.58 and according to the pellet count data 1:0.47. In the remaining cases (all summer camera data and data from cameras with and without attractants), this ratio was at least 1:0.67 according to camera data and 1:0.26 according to the pellet count data, and these differences were statistically significant (Table 5). In red deer, there were no significant differences between F:M sex ratios determined from trail camera data and pellet count data. Their sex ratio depends neither on season nor on camera location and was quite similar being F:M = 1:0.73 in places without attractants and F:M = 1:0.7 in places with attractants.
| Table 5. χ2 test results of F and M proportions in moose and red deer between camera data in different seasons/placements and pellet group count results (insignificant differences are bolded). | |||
| Model | Sex ratio F:M | χ2 value | P |
| moose CAMERA SPRING vs. moose PELLETS 2020 | 1:0.58 vs. 1:0.47 | 0.241 | 0.624 |
| moose CAMERA SUMMER vs. moose PELLETS 2021 | 1:0.73 vs. 1:0.26 | 10.423 | 0.001 |
| moose CAMERA SUMMER with attractants vs. moose PELLETS 2021 | 1:0.78 vs. 1:0.26 | 8.879 | 0.003 |
| moose CAMERASUMMER without attractants vs. moose PELLETS 2021 | 1:0.67 vs. 1:0.26 | 5.223 | 0.022 |
| Red deer CAMERA SPRING vs. red deer PELLETS 2020 | 1:0.25 vs. 1:0.21 | 0.899 | 0.342 |
| Red deer CAMERA SUMMER vs. red deer PELLETS 2021 | 1:0.27 vs. 1:0.31 | 1.202 | 0.273 |
| Red deer CAMERA SUMMER with attractants vs. red deer PELLETS 2021 | 1:0.28 vs. 1:0.31 | 0.631 | 0.427 |
| Red deer CAMERA SUMMER without attractants vs. red deer PELLETS 2021 | 1:0.24 vs. 1:0.31 | 1.361 | 0.243 |
4 Discussion
Results of our study confirm the correlation of increased damage with higher numbers of moose and red deer pellet indices (although the effect size for red deer was small r = 0.11), as well as confirm that moose are responsible for the majority of damage in pine and aspen stands, whereas red deer – for damage in pine and spruce stands. A study conducted in Sweden provides data of moose habitat use detected by winter pellet counts and tracking with GPS telemetry that confirms moose preference to young forest stands using both techniques (Månsson et al. 2011). It is an evidence of habitat selection, since the animals had equal opportunity to enter and remain in the studied forest stands where they browsed i.e. ‘longer staying – more browsing damages – more dung left over the winter’. Although the largest mean density of moose pellet groups (both bulls and cows as well as calves) is found in pine stands, these stands carry also relatively largest amount of red deer pellets. Thus, young pine forest is the most densely inhabited woodland among the studied ones.
Our first hypothesis, that there is a strong correlation between damage amount and ungulate population structure, was confirmed partially. The increase in the density of moose bulls and cows works as good predictor of damage increases in young pine and aspen stands (see GLM results, Table 2), and in damaged and undamaged pine stands the density of moose bulls was significantly lower than the density of cows (but the effect size was very small (r = 0.09)). The density index of red deer in damaged pine and spruce stands is also female biased, however, statistically insignificant probably due to the smaller numbers of counted deer pellet groups (Fig. 4).
Non-significant differences between moose and red deer sex and age grouping determined by two different methods seasonal pattern (pellet counts and trail camera sets, see Table 5) in the same pilot area is a promising indication to encourage managers to implement a more efficient monitoring system using trail cameras. However, an impact of season and habitat type on spatial and social structure of ungulate populations should stay in mind when monitoring results are interpreted and applied for management. A possible explanation for some significant differences in moose summer records by trail cameras with next winter pellet group density index (e.g. year 2021 in Table 5) is most likely due to the mobility and changing seasonal pattern of habitat use in this species. Comprehensive studies on spatiotemporal variation of habitat use in Norwegian moose population is done by Bjørneraas (Bjørneraas et al. 2011; Bjørneraas et al. 2012). Researchers highlight two main predictors for ungulate habitat selection and space use – availability and distribution of the habitats providing shelter and high-quality food. Thus, certain trade-offs persist between a high-quality and energy rich forage and safety regarding disturbance and risks by humans and predators. In theory, it might prevent the moose in winter from some forest stands, especially females with calves after thinning of young stands and driven hunts. In red deer, in turn, stags tend to migrate for winter separately from females with calves (Jarnemo 2008) which frequently change locations between tree covered and open habitats year around (Reinecke et al. 2014). Although our results do not support a spatial segregation of red deer sex groups between the seasons (Table 5), it cannot be taken for granted in all landscape types within Latvia. Therefore, local knowledge of home range size and seasonal movements in both deer species should be obtained for further elaboration of population management system.
Despite the fact that winter pellet group counting requires intense field work, it is still the most widely used census technique in Latvia and provides the best hard evidence of moose and red deer presence, location specific population densities and sex-age structure. Hence, this method indicates not just the relative population density but to some extent also highlights the use of habitats by a certain species, as well as the sex and age of the individuals. In practice, it has been used by supervising authorities both for increasing harvest quotas to mitigate damage as well as for banning moose harvest in years when the population diminished below sustainable levels. For instance, this was required after the collapse of the USSR and the consequent unmanaged land use in the 1990s when the moose population declined significantly due to overuse (Bragina et al. 2018). The animal numbers, even though obtained with high preciseness and certainty, can be misleading without context with circumstances for using them as a management target. Acknowledging this, Latvia and other Baltic countries, together with representatives of major European regions, participated in an international scientific workshop resulting in a call for a transition to an adaptive management policy instead of a strict quota calculation system from census data (Apollonio et al. 2017). Therefore, interaction between the detectable occurrence frequency of certain sex and age representatives in specific habitats where they can potentially cause measurable damage affecting pine stand rejuvenation could provide a warning that population harvest is insufficient locally or at a country level, or should be more targeted to a certain sex or age group within population. As detectable change in the sex proportion of moose populations is correlated with increased browsing damage, efficient survey techniques for sex and age structure is a topical issue for management. The traditionally used winter pellet group index might be biased by three factors – limited capacity of surveyors, insufficient differentiation among female, male and fawn dung, and varying decomposition rate of pellets. Global warming has changed climate conditions in the boreal zone, prolonging the vegetation period (Ruiz-Perez and Vico 2020) and winters are warmer with increased precipitation (Avotniece et al. 2017), also in the form of wet snow (Venäläinen et al. 2020) or even without snow. These winter conditions may prevent the application of monitoring methods by using snow footprint counts due to the absence of snow, pellet group counts may not be feasible because winter conditions may be insufficient to maintain the visibility of ungulate dung until spring. Therefore, it is very important to develop alternative methods for ungulate population studies.
Our study examined the feasibility of the use of trail cameras for the assessment of ungulate demographic structure within a hunting area, since they are already in use by hunters to follow species composition and animal movements, mostly near feeding places. There are about 1000 hunting areas in Latvia, involving more than 20 000 hunters (Baumanis 2013). They might be encouraged and motivated to become involved in citizen science by sharing trail camera data. One factor that could work as motivation for hunters to share their trail camera data is involvement in decision-making processes for setting ungulate hunting quotas and possible avoidance of conflicts with forest managers. Trail camera data analysis could give an assessment of population status in post and pre-harvest seasons and provide rapid input to update management goals. Furthermore, camera relocation is probably not required, and their placement next to feeding and salt licking sites, as they are most commonly utilized in hunting areas, may provide sufficient data on sex proportions in populations at a local level, however, habitat use and seasonal aspects should be taken in consideration for data comparison in the longer term. In addition, there are some methodological challenges to overcome, such as equalizing the camera settings (trigger time, video length, picture file number per event etc.), which is important for data compatibility (Wearn and Glover-Kapfer 2019). The use of artificial intelligence for data sorting and species and sex recognition is crucial, because of limited human resources for analyzing large amounts of data in a limited time (Price et al. 2016). Relevant management challenges require unified census methods that can be correctly interpreted for adaptive ungulate control. Herfindal (2015) has emphasized the importance of strategic planning and large-scale collaboration between forest owners to reduce forest damage by moose. Large ungulates, such as moose and red deer are most important game species and their populations can be regulated by sex- and age-selective hunting strategies, which in turn can affect population growth rates and sex-age patterns (Milner et al. 2010; Naevdal et al. 2012).
5 Conclusion
This study identified four main conclusions regarding damage to young forest stands, in particular pine stands, in Latvian forests under the influence of increasing browsing pressure by sympatric moose and red deer populations. Firstly, local densities of moose and red deer populations in young pine stands exceed those in young stands of other tree species. Secondly, at least locally in moose populations the densities within their most preferred and consequently most damaged tree stands are associated with a higher proportion of females over males. Thirdly, the female and male proportion is a comparatively easily detectable index, and should be implemented for a regular monitoring as a warning signal about population density increases and escalated forest damage risks. Fourthly, both pellet group counts and trail cameras can provide useful evidences on sex and age structure in moose and red deer populations. Both methods should be calibrated for better comparability. However, the use of trail cameras is more widely applicable and they are easier to use for hunters than pellet census. Therefore, the integration of trail camera data into wildlife and forestry management besides many other circumstances to be considered, should be encouraged, and can provide a way to involve hunters in data gathering and decision-making processes.
Author contributions
Conceptualization and methodology GD, JO, JJ and DJ; formal analysis GD and JO; resources JJ, JB, DJ and AV; data curation AV; writing – original draft preparation GD and JO; writing – review and editing GD, JO, DJ, GB and AV; visualization GD; supervision JO and DJ; project administration DJ and JO; funding acquisition DJ and JO. All authors have read and agreed to the published version of the manuscript.
Funding
This research was funded by the project ‘ICT-based wild animal census approach for sustainable wildlife management’ (1.1.1.1/18/A/146) co-funded by the European Regional Development Fund 1.1.1.1. measure “Support for applied research”.
Data availability statement
The data used in the research are stored in the databases of the Institute for Environmental Solutions and Forest Research Institute ‘Silava’ and are available from the authors upon reasonable request.
Acknowledgments
We thank our research group of Latvian State Forest Research Institute ‘Silava’ for collecting field data in the framework of the National forest monitoring program.
Conflicts of interest
The authors declare no conflict of interest. The funders had no role in the design of the study; in the collection, analyses, or interpretation of data; in the writing of the manuscript; or in the decision to publish the results.
References
Alves J, Alves da Silva J, Soares AMVM, Fonseca C (2013) Pellet group count methods to estimate red deer densities: precision, potential accuracy and efficiency. Mamm Biol 78: 134–141. https://doi.org/10.1016/j.mambio.2012.08.003.
Andersone-Lilley Ž, Balčiauskas L, Ozoliņš J, Randveer T, Tõnisson J (2010) Ungulates and their management in the Baltics (Estonia, Latvia and Lithuania). In: Apollonio M, Andersen R, Putman R (eds) European Ungulates and their Management in the 21st Century. Cambridge University Press, Cambridge, pp 103–128.
Apollonio M, Belkin VV, Borkowski J, Borodin OI, Borowik T, Cagnacci F, Danilkin AA, Danilov PI, Faybich A, Ferretti F, Gaillard JM, Hayward M, Heschtaut P, Heurich M, Hurynovich A, Kashtalyan A, Kerley GIH, Kjellander P, Kowalczyk R, Kozorez A, Matveytchuk S, Milner JM, Mysterud A, Ozoliņš J, Panchenko DV, Peters W, Podgorski T, Pokorny B, Rolandsen CM, Ruusila V, Schmidt K, Sipko TP, Veeroja R, Velihurau P, Yanuta G (2017) Challenges and science-based implications for modern management and conservation of European ungulate populations. Mamm Res 62: 209–217. https://doi.org/10.1007/s13364-017-0321-5.
Avotniece Z, Klavins M, Rodinavs V (2012) Changes of extreme climate events in Latvia. Environ Clim Technol 9: 4–11. https://doi.org/10.2478/v10145-012-0010-1.
Avotniece Z, Aniskevich S, Malinovskis E (2017) Climate change scenarios for Latvia. Report summary. State Ltd. ‘Latvian Environment, Geology and Meteorology Centre’, Riga, Latvia.
Avots E, Vecvanags A, Filipovs J, Brauns A, Skudrins G, Done G, Ozolins J, Anbarjafari G, Jakovels D (2022) Towards automated detection and localization of red deer Cervus elaphus Using passive acoustic sensors during the rut. Remote Sens 14, article id 2464. https://doi.org/10.3390/rs14102464.
Baleishis R, Bluzma P, Ornicans A, Tõnisson J (1998) The history of moose in the Baltic countries. Alces 34: 339–3445.
Ball JP, Dahlgren J (2002) Browsing damage on Pine (Pinus sylvestris and P. contorta) by a migrating moose (Alces alces) population in winter: relation to habitat composition and road barriers. Scand J For Res 17:427–435. https://doi.org/10.1080/028275802320435441.
Baumanis I, Jansons Ā, Neimane U (2014) Ģenētika, selekcija un sēklkopība Latvijā. [Selection, genetics and seeding in Latvia]. LSFRI Silava, UD Academic press ‘Saule’. ISBN 978-9984-14-696-6.
Baumanis J (2013) Situation assessment of ungulate (Arctiodactyla) populations and their management principles in Latvia. Resume of the PhD Paper, Salaspils, Jelgava.
Baumanis J, Straupe I, Donis J (2011) Economic aspects of game management in Latvia. Proceedings of the Annual 17th International Scientific Conference, “Research for rural development 2011”, Jelgava, Latvia, 18–20 May 2011. Latvia University of Agriculture, pp 52–58.
Beljan K, Pokupić M, Mataković H, Bruzzese S (2022) Investment analysis of a joint forest and game management – a case study from Croatian Dinarides. South-east Eur For 13: 97–106. https://doi.org/10.15177/seefor.22-10.
Bjørneraas K, Solberg EJ, Herfindal I, Van Moorter B, Rolandsen CM, Tremblay JP, Skarpe C, Sæther BE, Eriksen R, Astrup R (2011) Moose Alces alces habitat use at multiple temporal scales in a humanaltered landscape. Wildl Biol 17: 44–54. https://doi.org/10.2981/10-073.
Bjørneraas K, Herfindal I, Solberg EJ, Sæther BE, van Moorter B, Rolandsen CM (2012) Habitat quality influences population distribution, individual space use and functional responses in habitat selection by a large herbivore. Oecologia 168: 231–243. https://doi.org/10.1007/s00442-011-2072-3.
Bragina EV, Ives A R, Pidgeon AM, Balčiauskas L, Csányi S, Khoyetskyy P, Kysucká K, Lieskovsky J, Ozolins J, Randveer T, Štych P, Volokh A, Zhelev C, Ziołkowska E, Radeloff VC (2018) Wildlife population changes across Eastern Europe after collapse of socialism. Front Ecol Environ 16: 77–81. https://doi.org/10.1002/fee.1770.
Brousseau M, Thiffault N, Beguin J, Roy V, Tremblay JP (2017) Deer browsing outweighs the effects of site preparation and mechanical release on balsam fir seedlings performance: Implications to forest management. For Ecol Manag 405: 360–366. https://doi.org/10.1016/j.foreco.2017.09.024.
Bugmann H, Weisberg PJ (2003) Forest-ungulate interactions: monitoring, modeling and management. J Nat Conserv 10: 193–201. https://doi.org/10.1078/1617-1381-00028.
Burneviča N, Jansons Ā, Zaļuma A, Kļaviņa D, Jansons J, Gaitnieks T (2016) Fungi inhabiting bark stripping wounds made by large game on stems of Picea abies (L.) Karst. in Latvia. Balt For 22: 2–7.
Candaele R, Lejeune P, Licoppe A, Malengreaux C, Brostaux Y, Morelle K, Latte N (2020) Mitigation of bark stripping on spruce: the need for red deer population control. Eur J For Res 140: 227–240. https://doi.org/10.1007/s10342-020-01326-z.
Christianson D, Creel S (2008) Risk effects in elk (Cervus elaphus): sex-specific responses in grazing and browsing due to predation risk from wolves. Behav Ecol 19: 1258–1266. https://doi.org/10.1093/beheco/arn079.
Done G, Bagrade G, Baumanis J, Jakovels D, Ozoliņš J (2021) Acceleration of the century – determinants, assessment tools and management challenges of the red deer population in Latvia. In: Csanyi S, Kalandarishvili A (eds). Abstract book of the 35th IUGB Congress, Hungary, 20–24 September 2021, pp 13–14.
Dressel S, Ericsson G, Johansson M, Kalén C, Pfeffer SE, Sandström C (2020) Evaluating the outcomes of collaborative wildlife governance: the role of social-ecological system context and collaboration dynamics. Land Use Policy 99, article id105028. https://doi.org/10.1016/j.landusepol.2020.105028.
Engeman RM (2005) Indexing principles and widely applicable paradigm for indexing animal populations. Wildl Res 32: 203–210. https://doi.org/10.1071/WR03120.
Felton A, Felton A, Cromsigt JPGM, Edenius L, Malmsten J, Wam HK (2017) Interactions between ungulates, forests, and supplementary feeding: the role of nutritional balancing in determining outcomes. Mamm Res 62: 1–7. https://doi.org/10.1007/s13364-016-0301-1.
Franklin O, Krasovskiy A, Kraxner F, PLatov A, Schepaschenko D, Leduc S, Mattsson B. Moose or spruce: a systems analysis model for managing conflicts between moose and forestry in Sweden. BioRxiv 2020.08.11.241372. [Preprint]. https://doi.org/10.1101/2020.08.11.241372.
Gerhardt P, Arnold JM, Hackländer K, Hochbichler R (2013) Determinants of deer impact in European forests – a systematic literature analysis. For Ecol Manag 310: 173–186. https://doi.org/10.1016/j.foreco.2013.08.030.
Gicquel M, Sand H, Månsson J, Wallgren M, Wikenros C (2020) Does recolonization of wolves affect moose browsing damage on young Scots pine? For Ecol Manag 473, article id 118298. https://doi.org/10.1016/j.foreco.2020.118298.
Green SE, Rees JP, Stephens PA, Hill RA, Giordano AJ (2020) Innovations in camera trapping technology and approaches: the integration of citizen science and Artificial Intelligence. Animals 10, article id 132. https://doi.org/10.3390/ani10010132.
Härkönen S, Heikkilä R (1999) Use of pellet group counts in determining density and habitat use of moose Alces alces in Finland. Wildl Biol 5: 233–239. https://doi.org/10.2981/wlb.1999.028.
Härkönen S, Eerikäinen K, Lähteenmäki R, Heikkilä R (2008) Does moose browsing threaten European aspen regeneration in Koli National park, Finland? Alces 44: 31–40.
Heinze E, Boch S, Fischer M, Hessenmoller D, Klenk B, Muller J, Prati D, Schulze ED, Seele C, Socher S, Halle S (2010) Habitat use of large ungulates in northeastern Germany in relation to forest management. For Ecol Manag 261: 288–296. https://doi.org/10.1016/j.foreco.2010.10.022.
Helle P, Ikonen K, Kantola A (2016) Wildlife monitoring in Finland: online information for game administration, hunters, and the wider public. Can J For Res 46: 1491–1496. https://doi.org/10.1139/cjfr-2015-0454.
Herfindal I, Tremblay JP, Hester AJ, Lande US, Wam HK (2015) Associational relationships at multiple spatial scales affect forest damage by moose. For Ecol Manag 348: 97–107. https://doi.org/10.1016/j.foreco.2015.03.045.
Hoffman M, Flø BE (2016) Reconciling local control with appropriate scale in Norwegian moose management. J Environ Policy Plan 19: 183–196. https://doi.org/10.1080/1523908X.2016.1188371.
Jarnemo A (2008) Seasonal migration of male red deer (Cervus elaphus) in southern Sweden and consequences for management. Eur J Wildl Res 54: 327–333. https://doi.org/10.1007/s10344-007-0154-7.
Jędrzejewski W, Sidorovich V (2010) The art of tracking animals. Mammal Research Institute Polish Academy of Sciences. ISBN: 978-83-929140-6-8.
Katzner TE, Arlettaz R (2020) Evaluating contributions of recent tracking-based animal movement ecology to conservation management. Front Ecol Evol 7, article id 519. https://doi.org/10.3389/fevo.2019.00519.
Latvian forest sector in facts and figures (2022) NGO ‘Zaļās mājas’, Riga, Latvia. https://www.zm.gov.lv/en/media/11529/download?attachment.
Lavsund S (1987) Moose relationship to forestry in Finland, Norway and Sweden. Swedish Wildlife Research, Supplement 1: 229–244.
Linnel JDC, Cretois B, Nilsen EB, Rolandsen CM, Solberg EJ, Veiberg V, Kaczensky P, van Moorter B, Panzacchi M, Rauset GR, Kaltenborn B (2020) The challenges and opportunities of coexisting with wild ungulates in the human-dominated landscapes of Europe’s Anthropocene. Biol Conserv 244, article id 108500. https://doi.org/10.1016/j.biocon.2020.108500.
Loosen AE, Devineau O, Skarpe C, Zimmermann B, Cromsigt J, Mathisen KM (2021) Ungulate-adapted forestry shows promise for alleviating pine browsing damage. For Ecol Manag 482, article id 118808. https://doi.org/10.1016/j.foreco.2020.118808.
LSFRI “Silava” (2022) National Forest Monitoring according with The Regulation of the Cabinet of Ministers, No. 238 and Medium-term Development Strategy of LSFRI “Silava”. https://silava.lv/images/Petijumi/Nacionalais-meza-monitorings/2022-04-28-MRM-metodika.pdf.
Maccracken J, van Ballenberghe V (1987) Age and sex related differences in fecal pellet dimensions of moose. J Wildl Manage 51: 360–364. https://doi.org/10.2307/3801017.
Månsson J, Andrén H, Sand H (2011) Can pellet counts be used to accurately describe winter habitat selection by moose Alces alces? Eur J Wildl Res 57: 1017–1023. https://doi.org/10.1007/s10344-011-0512-3.
Martinez A, Martin AJ (2019) A matrix system using quality classes can be applied for managing sustainable wild ungulates populations: convergence above optimum capacity. Ecol Eng 138: 289–297. https://doi.org/10.1016/j.ecoleng.2019.07.026.
Mathisen KM, Milner JM, Skarpe C (2017) Moose – tree interactions: rebrowsing is common across tree species. BMC Ecol 17, article id 12. https://doi.org/10.1186/s12898-017-0122-3.
Mathisen KM, Wójcicki A, Borowski Z (2018) Effects of forest roads on oak trees via cervid habitat use and browsing. For Ecol Manag 424: 378–386. https://doi.org/10.1016/j.foreco.2018.04.057.
Milner JM, Bonenfant C, Mysterud A (2010) Hunting Bambi – evaluating the basis for selective harvesting of juveniles. Eur J Wildl 57: 565–574. https://doi.org/10.1007/s10344-010-0466-x.
Naevdal E, Olaussen JO, Skonhoft A (2012) A bioeconomic model of trophy hunting. Ecol Econ 73: 194–205. https://doi.org/10.1016/j.ecolecon.2011.10.026.
Palencia P, Rowcliffe JM, Vicente J, Acevedo P (2020) Assessing the camera trap methodologies used to estimate density of unmarked populations. J Appl Ecol 58: 1583–1592. https://doi.org/10.1111/1365-2664.13913.
Pascual-Rico R, Martín-López B, Sánchez-Zapata JA, Morales-Reyes Z (2020) Scientific priorities and shepherds’ perceptions of ungulate’s contributions to people in rewilding landscapes. Sci Total Environ 705, article id 135876. https://doi.org/10.1016/j.scitotenv.2019.135876.
Price-Tack JL, West BS, McGowan CP, Ditchkoff SS, Reeves SJ, Keever AC, Grand JB (2016) AnimalFinder: a semi-automated system for animal detection in time-lapse camera trap images. Ecol Inform 36: 145–151. https://doi.org/10.1016/j.ecoinf.2016.11.003.
Putman R, Langbein J, Green P, Watson P (2011) Identifying threshold densities for wild deer in the UK above which negative impacts may occur. Mamm Rev 41: 175–196. https://doi.org/10.1111/j.1365-2907.2010.00173.x.
Reinecke H, Leinen L, Thißen I, Meißner M, Herzog S, Schütz S, Kiffner C (2014) Home range size estimates of red deer in Germany: environmental, individual and methodological correlates. Eur J Wildl Res 60: 237–247. https://doi.org/10.1007/s10344-013-0772-1.
Reimoser F, Putman R (2011) Impact of wild ungulates on vegetation: costs and benefits. In: Putman R, Apollonio M, Andersen R (eds) Ungulate management in Europe, problems and practices. Cambridge University Press, Cambridge, pp 144–192.
Rönnegård L, Sand H, Andrén H, Månsson J, Pehrson Å (2008) Evaluation of four methods used to estimate population density of moose Alces alces. Wildl Biol 14: 358–371. https://doi.org/10.2981/0909-6396(2008)14[358:EOFMUT]2.0.CO;2.
Ruiz-Peres G, Vico G (2020) Effects of temperature and water availability on Northern European boreal forests. Front For Glob Change 3, article id 34. https://doi.org/10.3389/ffgc.2020.00034.
Shively RD, Crouse JA, Thompson DP, Barboza PS (2019) Is summer food intake a limiting factor for boreal browsers? Diet, temperature, and reproduction as drivers of consumption in female moose. PLoS One 14, article id e0223617. https://doi.org/10.1371/journal.pone.0223617.
Skriba G (2011) Staltbriežu skaits un izplatība Latvijā. [Origin, distribution and management of red deer in Latvia]. Rīga, Jelgavas tipogrāfija.
Spitzer R, Felton A, Landman M, Singh NJ, Widemo F, Cromsigt JPGM (2020) Fifty years of European ungulate dietary studies: a synthesis. Oikos 129: 1668–1680. https://doi.org/10.1111/oik.07435.
State Forest Service (2023) Statistics of game population in Latvia 2023. https://www.vmd.gov.lv/lv/medijamo-dzivnieku-populacijas. [in Latvian].
Tallian A, Ordiz A, Zimmermann B, Sand H, Wikenros C, Wabakken P, Bergqvist G, Kindberg J (2021) The return of large carnivores: Using hunter observation data to understand the role of predators on ungulate populations. Glob Ecol Conserv 27, article id e01587. https://doi.org/10.1016/j.gecco.2021.e01587.
Tauriņš E (1982) Latvijas zīdītājdzīvnieki. [Mammals of Latvia]. Rīga, Zvaigzne.
Trolliet F, Huynen MC, Vermeulen C, Hambuckers A (2014) Use of camera traps for wildlife studies. A review. Biotechnol Agron Soc Environ 18: 446–454.
Vecvanags A, Aktas K, Pavlovs I, Avots E, Filipovs J, Brauns A, Done G, Jakovels D, Anbarjafari G (2022) Ungulate detection and species classification from camera trap images using RetinaNet and Faster R-CNN. Entropy 24, article id 353. https://doi.org/10.3390/e24030353.
Venäläinen A, Lehtonen I, Laapas M, Ruosteenoja K, Tikkanen OP, Viiri H, Ikonen VP, Peltola H (2020) Climate change induces multiple risks to boreal forests and forestry in Finland: a literature review. Glob Change Biol 26: 4178–4196. https://doi.org/10.1111/gcb.15183.
Wallgren M, Bergström R, Bergqvist G, Olsson M (2013) Spatial distribution of browsing and tree damage by moose in young pine forests, with implications for the forest industry. For Ecol Manag 305: 229–238. https://doi.org/10.1016/j.foreco.2013.05.057.
Wam HK, Hofstad O (2007) Taking timber browsing damage into account: a density dependent matrix model for the optimal harvest of moose in Scandinavia. Ecol Econ 62: 45–55. https://doi.org/10.1016/j.ecolecon.2007.01.001.
Wearn OR, Glover-Kapfer P (2019) Snap happy: camera traps are an effective sampling tool when compared with alternative methods. Royal Soc Open Sci 6, article id 181748. https://doi.org/10.1098/rsos.181748.
Total of 69 references.
