Matti Haapanen 
Realised genetic gains from past Finnish silver birch seed orchards
Haapanen M. (2024). Realised genetic gains from past Finnish silver birch seed orchards. Silva Fennica vol. 58 no. 1 article id 23072. https://doi.org/10.14214/sf.23072
Highlights
- Seed orchard materials generally outperformed unimproved trees in all growth and quality traits, but individual seed orchards showed substantial performance variability
- Realised gains in stem volume and forking showed an increasing temporal trend, whereas gains in branch quality were positive and steady
- Gains in stem volume and branch quality trade off slightly
- The bi-clonal seed orchard variety “JR-2” emerged as the best overall performer across all the seed orchards, whereas the older variety “JR-1” was mediocre
- An alternative statistical concept, D-value, was introduced to compare levels of genetic gains for different scaled, normally distributed traits.
Abstract
Genetic gains realised through silver birch (Betula pendula Roth) seed orchards were studied using data from common-garden trials established at 34 sites in southern and central Finland. The test materials include seedlots representing 19 commercial seed orchards that operated between 1972 and 2009, and 21 natural stands. All the trials were assessed for several growth and quality traits between the ages of 9 and 24. Realised gains were estimated based on univariate linear mixed models with corrections for latitudinal seed transfer effects. Overall, seed orchard materials outperformed unimproved reference materials in all the traits but results for individual seed orchards varied substantially. Stem volume gains ranged from 1.0% to 31.1%. Improved trees had, on average, 6.8% (up to 26.7%) fewer ramicorn branches and 16.2% (up to 57.6%) fewer forks than unimproved trees. Branch and overall quality showed consistently positive gains. More recently established seed orchards performed better than older ones, and seed orchards with fewer clones outperformed those with dozens of clones. "JR-1" and "JR-2" bi-clonal seed orchards fared differently, with "JR-1" showing modest genetic gains and "JR-2" emerging as the top overall performer across all seed orchards. An alternative statistical concept, the D-value, was utilised to assess the magnitude of genetic gain for different scaled, normally distributed traits. Average D-values implied a similar level of improvement for stem volume, branch quality, and forking, and a smaller gain for stem slenderness and the number of ramicorn branches. The results for individual seed orchards suggest a slight trade-off between stem volume growth and branch quality.
Keywords
Betula pendula;
seed orchards;
genetic gain;
forest reproductive materials
-
Haapanen,
Natural Resources Institute Finland (Luke), Latokartanonkaari 9, 00790 Helsinki, Finland
 https://orcid.org/0000-0003-3294-501X
E-mail
matti.haapanen@luke.fi
https://orcid.org/0000-0003-3294-501X
E-mail
matti.haapanen@luke.fi
Received 17 November 2023 Accepted 13 February 2024 Published 19 February 2024
Views 32321
Available at https://doi.org/10.14214/sf.23072 | Download PDF

1 Introduction
Silver birch (Betula pendula Roth) is commercially the third-most important tree species in Finland, providing raw material for sawn products, veneer, pulping, and energy. Most birch wood is obtained in mixed stands of natural birch, pine, and spruce, but monoculture stands are expanding and growing in importance (Niemistö et al. 2008; Hynynen et al. 2010). Birch planting on a significant scale began in the mid-1960s (Raulo 1977). The annually planted area has thereafter fluctuated greatly, influenced by varying industrial demand for birch wood, animal damage to newly planted stands, and landowner incentives. In the peak year of 1992, silver birch seedlings were planted on approximately 14 000 hectares, often with government subsidies for afforestation (Koski and Rousi 2005; Niemistö et al. 2008). In recent years, the annual planting area of silver birch has ranged between 2000 and 5000 hectares (Natural Resources Institute Finland 2023).
Silver birch breeding started with plus tree selection in the late 1940s, but it really gained steam in the late 1960s when the Foundation for Forest Tree Breeding developed a method for mass-producing birch seed in a polyethene-covered greenhouse (Lepistö 1973; Kärki 1976). By that time, the base material of breeding consisted of about one thousand phenotypically selected plus trees (Yrjänä et al. 2023). Greenhouse conditions, together with high nutrient and CO2 levels, were found to accelerate graft development and seed production, and the method was rapidly adopted both for breeding and commercial seed production. Since the first seed orchard was established in 1970 (Hagqvist and Hahl 1997), 30 greenhouse seed orchards have supplied genetically improved birch seed to Finnish forestry. As of today, silver birch planting in Finland relies entirely on seed orchard-produced seed materials (Natural Research Institute Finland 2023).
The goal of silver birch breeding is to improve volume growth and quality traits important to the veneer and sawmill industries, such as branch size and angle, stem straightness, and the absence of stem defects (Niemistö et al. 2008). After more than five decades of breeding, genetic gains in these traits have only been addressed once, by Hagqvist and Hahl (1997, 1998). Examining results from eight progeny trials, they reported substantial improvements in stem volume growth and stem tapering, and smaller, and less clear, changes in branch quality traits.
Silver birch breeding efforts have also taken place outside of Finland, for instance, in Sweden (Danell and Werner 1989), Estonia, Latvia (Gailis et al. 2020), and Ireland (O’Dowd 2004). These initiatives have resulted in a few attempts to predict future genetic gains using estimates of quantitative genetic parameters (Danell and Werner 1991; Rosvall et al. 2000; Gailis et al. 2020). Other studies have addressed the growth of clone-propagated birch stands (Liziniewicz et al. 2022) and improved birches representing two different levels of genetic improvement (Zeltiņš et al. 2022). However, there is a general shortage of studies focusing on realised gains based on direct comparisons of representative, commercially deployed improved and unimproved birch materials growing in similar circumstances.
The objective of this study was to provide an up-to-date assessment of the realised genetic gains from Finnish silver birch seed orchards operating from the early 1970s to the late 2000s. The analysis relies on data gathered from common-garden trials where seed orchard materials have been grown alongside unimproved reference materials.
2 Materials and methods
2.1 Materials
The study material comprised 64 014 silver birch trees planted in 34 field trials in southern and central Finland between 1977 and 2011 (Fig. 1). The trials were established on former agricultural fields or moist forest sites at an initial spacing of either 1600 or 1975 trees per hectare. The materials consisted of seedlots from 19 commercial silver birch seed orchards (53 114 trees) and from 21 naturally regenerated stands (10 900 trees). The origins of the test materials on each trial site exhibited about two degrees latitudinal variation (Fig. 2).
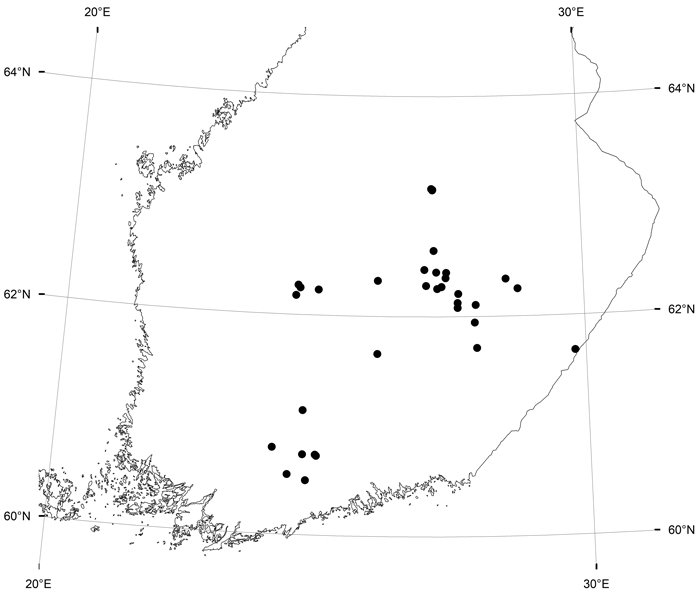
Fig. 1. The locations of the 34 tree breeding field trials of silver birch in southern and central Finland.
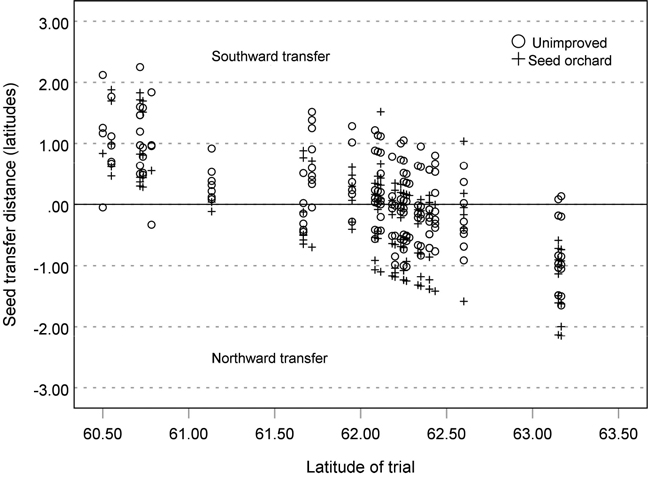
Fig. 2. Latitudinal seed transfer distances of the seed orchard and unimproved progenies tested in the 34 silver birch field trials in southern and central Finland.
The seed orchards studied were in operation between 1972 and 2009. In addition to the most common type of seed orchards established with grafts of dozens (32 to 115) of plus trees, the test materials include samples from two (primarily) seedling seed orchards and five seed orchards with only two clones. The latter ones produced two tested full-sib families marketed under the acronyms “JR-1” and “JR-2” in the 1980s and 1990s (Table 1).
| Table 1. The 19 silver birch seed orchards represented in the 34 common-garden trials. Origin means the geographical origin of seed orchard clones in Finland. | ||||||||
| Orchard | Alias | Origin | Type | Clones | Area ha | Establishment year, production years | Trials | Offspring |
| 288 | South-Central | Seedling | 120 | 0.14 | 1972, 1973–1978 | 3 | 1491 | |
| 336 | Central | Clonal | 115 | 0.14 | 1977, 1979–1987 | 19 | 23 715 | |
| 362 | JR-1 | Southern | Clonal | 2 | 0.03 | 1979, 1982–1996 | 26 | 1493 |
| 363 | JR-1 | Southern | Clonal | 2 | 0.04 | 1985, 1986–1993 | 26 | 1493 |
| 364 | Southern | Seedling | 50 | 0.08 | 1985, 1987–1991 | 10 | 3334 | |
| 373 | Central | Clonal | 47 | 0.15 | 1987, 1989–1996 | 15 | 13 714 | |
| 377 | JR-1 | Southern | Clonal | 2 | 0.05 | 1989, 1992–1996 | 26 | 1493 |
| 378 | Southern | Clonal | 33 | 0.10 | 1989, 1992–1997 | 7 | 685 | |
| 379 | Central | Clonal | 32 | 0.20 | 1989, 1990–1993 | 4 | 578 | |
| 381 | Southern | Clonal | 35 | 0.10 | 1990, 1991–1998 | 4 | 566 | |
| 383 | JR-2 | Southern | Clonal | 2 | 0.06 | 1990, 1991–1998 | 19 | 1491 |
| 384 | JR-1 | Southern | Clonal | 2 | 0.06 | 1990, 1991–1998 | 26 | 1493 |
| 387 | Southern | Clonal | 41 | 0.05 | 1991, 1993–2003 | 3 | 348 | |
| 390 | Central-North | Clonal | 50 | 0.08 | 1992, 1994–2000 | 2 | 291 | |
| 393 | Central | Clonal | 69 | 0.07 | 1992, 1995–2002 | 2 | 2067 | |
| 422 | Central | Clonal | 78 | 0.14 | 1998, 2001–2004 | 8 | 516 | |
| 424 | Central | Clonal | 49 | 0.05 | 1992, 1995–2003 | 2 | 1456 | |
| 430 | Central | Clonal | 48 | 0.15 | 1998, 2001–2009 | 8 | 525 | |
| 431 | Southern | Clonal | 35 | 0.11 | 1999, 2003–2009 | 3 | 353 | |
The field trials were laid out using a randomised complete blocks design, with most trials consisting of four to seven blocks. Two types of trials contributed data for this study: Realised gain trials (13), designed to compare the performance of a small number of unimproved and improved bulk seedlots, and progeny trials (21) which were established to assess the genetic merit of plus trees based on the performance of their open-pollinated or controlled-crossed offspring. While progeny trials are not primarily intended to offer information on genetic gains, they often include a few seedlots gathered from natural stands as well as multiple seedlots of plus trees harvested from seed orchards. When at least fifteen plus-tree progenies were from a certain seed orchard, they were considered a sufficient sample of the orchard and pooled into a single “bulk” seedlot. The plots in the progeny trials consist of 8 or 16 trees, whereas most realised gain trials have larger plots of 25 or 49 trees. Two of the progeny trials have single-tree plots.
The data came from assessments conducted between 1993 and 2023 for several growth and quality traits prior to the first thinning, between the ages of 9 and 24. The measurement data were from all the test trees, excluding 17 trials with multiple-tree plots, where within-plot subsampling (ranging from 4 to 33 trees per plot, usually inner trees) was practised to reduce the amount of measurement work and possible inter-plot competition. All the trees sampled for measurement were assessed for stem diameter at breast height (DBH) and (except for one trial) for total tree height (H). Stem volume (VOL) was derived by fitting the values of H and DBH to the volume function of Laasasenaho (1982). Stem slenderness (HD) was calculated as a simple height to diameter ratio.
Quality traits were evaluated using visual whole-tree scoring. The scoring system varied by trait and, in some cases, between measurements. The traits consisted of overall quality (OQ: five or six categories), branch quality (BQ: six categories), and stem straightness (SS: three, four, or six categories). BQ was assessed visually by giving ¾ weight to the size of the branches relative to the stem diameter, and ¼ weight to branch angle and the number of branches. In addition, the total number of thick and strikingly vertical ramicorn branches (NRAM) and the number of forks (NFOR) was counted for each stem.
Not all the trials were assessed for all the traits. Nearly all the trials provided data on growth traits (H, DBH, VOL) and branch quality (BQ), but only 11 of the 34 trials data provided data on stem straightness (SS).
Based on assessor comments, trees that were visually observed to be influenced by external factors such as snow, mammal browsing, shade, wet microsite, and so on were omitted from the analysis.
2.2 Analyses
Data transformations were carried out before the analyses to 1) remove scale effects and 2) to rescale the categorical (ordinal) variables to normal scores. First, the growth traits H, DBH, and VOL in each trial were standardised to the same trait mean and standard deviation (obtained as the average of all the trials). This eliminated scale effects, i.e., discrepancies in average tree size caused by varying measurement age, site fertility and trial location. The mean height, for instance, ranged from 6.9 to 19.5 metres, and the standard deviation of tree height from 0.8 to 2.1 meters among the trials.
The categorical scores and counts were converted into normal scores (zero mean, unit variance) using the procedure RANK (option BLOM) of the statistical package SAS (SAS Institute 2009). The conversion, yielding normally and identically distributed scores within each trial and block, allowed divergent data (the same trait assessed using a different categorisation) to be combined for a joint analysis. It also eliminated that part of the variation in the original scores which resulted from varying trait expression in different environments.
A preliminary evaluation of the normal-scored data showed that many assessors give systematically lower quality scores to larger trees with thicker branches compared to smaller trees with thinner branches, with this tendency differing by the assessor. To remove the impact of tree size on quality assessment, BQns and OQns were regressed on DBH separately for each trial, and the regression residuals replaced the original normal scores in subsequent analyses. Stem straightness (SSns) was not adjusted for DBH due to the lack of correlation between the traits.
The growth traits H, DBH, VOL and HD were analysed using the procedure MIXED of the statistical package SAS (SAS Institute Inc 2009). The model used was:
![]()
where y is the trait, Gi is the ith genetic group (fixed) effect, Lk is the latitude of the kth trial site (fixed), ΔLjk is the latitudinal difference between the jth seedlot and the kth trial site (fixed), b is a fixed regression coefficient, tk is the effect of the kth trial site (random, (0,σt2), bkl is the effect of the lth block within the kth trial (random, (0,σb2)), and eijklm is the residual associated with the ijklmth tree (0,σe2). Each seed orchard was treated as a unique genetic group, whereas the 21 natural stand seedlots were pooled into a single group (“Unimproved”). The latitudinal transfer effects of the natural stand seedlots at each trial site were still factored in on a seedlot basis.
When Eq. 1 was applied for the normal-scored traits (OQns, BQns, SSns) (Eq. 1), the trial and block factors were omitted because the variation due to these factors was eradicated by the normal score transformation applied on the block level. Other factors representing the effects of seedlot transfer (ΔLjk2 and Lk × ΔLjk) were also excluded from the analyses when they were found not to significantly enhance the model.
The count variables NRAM and NFOR were analysed using a reduced generalized linear mixed model consisting of the genetic group and ΔL and ΔL2 as fixed explanatory factors and trial and block as random factors.
Realized genetic gain (RG) was calculated for each seed orchard using the ratio:

where LSMo denotes the least-square mean of a seed orchard and LSMu is the least-square mean of the unimproved materials, both estimated at the point of zero latitudinal transfer (ΔL = 0).
Although the group-mean difference expressed as a percentage (Eq. 2) is useful for metric ratio-scale traits like tree height or volume, it is not relevant for traits evaluated on a scale with no natural zero point. An alternative statistic was used to assess genetic gain for all normally distributed traits. The D-value (Demidenko 2016), obtained from the following equation, measures the separation of group distributions:

The cumulative distribution function (CDF) returns the probability that a randomly chosen improved (LSMo) tree has a greater trait-value than a randomly chosen unimproved tree (LSMu). The common standard deviation σ was estimated by the square-root of the sum of the variance components of the last three random effects of the mixed model (Eq. 1).
3 Results
Seed orchard materials outperformed unimproved birches across the growth and quality traits examined. Individual seed orchards, however, showed a significant performance variation. For instance, the estimated gains in tree height, diameter at breast height, and stem volume ranged from 1.6% to 12.1% (H), from 0.6% to 9.4% (DBH), and from 1.0% to 31.1% (VOL). The respective D-values for different seed orchards ranged from 0.51 to 0.71 (Tables 2, 3, and Fig. 3). The highest average D-value (0.64) was found for tree height. The changes in the stem slenderness (HD) were small (on average, 1.9%) and generally non-significant. Gains in stem volume showed an increasing tendency over time (Fig. 4).
| Table 2. Realised genetic gains from 19 silver birch seed orchards in tree height (H), stem diameter (DBH), stem volume (VOL), stem slenderness (HD) and number of ramicorn branches (NRAM) and forks (NFOR) as percentages of the unimproved mean. The standard errors of the gains are given within parentheses. The bold values were found significant at p < 0.05 of Dunnett’s test. In the seed orchard column, “JR-1” refers to the four seed orchards Nos. 362, 363, 377, and 384, while “JR-2” refers to seed orchard No. 383. | ||||||||||||
| Orchard | H | DBH | VOL | HD | NRAM | NFOR | ||||||
| JR-1 | 3.9 | (0.8) | 3.2 | (1.1) | 8.9 | (2.7) | 0.2 | (0.9) | –6.1 | (4.1) | –42.7 | (9.5) |
| JR-2 | 11.1 | (0.7) | 4.0 | (0.9) | 18.9 | (2.4) | 7.3 | (0.7) | –7.5 | (4.1) | –57.6 | (10.4) |
| 288 | 3.5 | (1.7) | 2.7 | (1.9) | 8.3 | (5.1) | 1.2 | (1.4) | –9.5 | (7.4) | –0.7 | (16.9) |
| 336 | 4.1 | (0.7) | 2.2 | (0.8) | 7.7 | (2.1) | 1.8 | (0.6) | –6.0 | (2.2) | –3.6 | (4.1) |
| 364 | 3.8 | (1.0) | 3.5 | (1.3) | 11.7 | (3.2) | 0.7 | (0.9) | –9.3 | (3.8) | –10.4 | (8.3) |
| 373 | 6.8 | (0.8) | 5.3 | (0.9) | 17.4 | (2.3) | 1.6 | (0.6) | –9.2 | (2.3) | –11.0 | (3.9) |
| 378 | 4.2 | (1.1) | 0.6 | (1.4) | 6.1 | (3.5) | 4.2 | (1.1) | –14.4 | (7.7) | –4.7 | (11.4) |
| 379 | 3.6 | (1.3) | 3.3 | (1.6) | 11.2 | (4.3) | –0.4 | (1.3) | 1.6 | (8.8) | –3.8 | (14.6) |
| 381 | 6.7 | (1.3) | 3.8 | (1.6) | 13.6 | (4.3) | 3.3 | (1.3) | 11.6 | (8.4) | 4.3 | (13.8) |
| 387 | 7.4 | (1.6) | 6.1 | (1.9) | 18.2 | (4.9) | 1.1 | (1.4) | 4.7 | (7.9) | –41.1 | (18.2) |
| 390 | 1.9 | (2.2) | 1.7 | (2.1) | 1.0 | (7.3) | 4.5 | (2.4) | ||||
| 393 | 2.8 | (2.0) | 3.4 | (1.7) | 6.3 | (6.2) | 1.3 | (1.9) | ||||
| 422 | 5.1 | (1.1) | 5.3 | (1.3) | 14.1 | (3.6) | 1.0 | (1.1) | –6.4 | (7.4) | –34.1 | (17.0) |
| 424 | 1.6 | (2.0) | 2.5 | (1.7) | 5.4 | (6.2) | 0.5 | (1.9) | ||||
| 430 | 7.0 | (1.1) | 9.4 | (1.3) | 23.9 | (3.6) | –1.0 | (1.1) | –26.7 | (8.4) | –9.1 | (14.7) |
| 431 | 12.8 | (1.6) | 9.2 | (1.9) | 31.1 | (4.8) | 3.5 | (1.4) | –10.9 | (8.4) | –17.6 | (15.5) |
| Average | 5.4 | 4.1 | 12.7 | 1.9 | –6.8 | –16.2 | ||||||
| Table 3. D-values from 19 silver birch seed orchards for tree height (H), stem diameter (DBH), stem volume (VOL), overall quality (OQns), branch quality (BQns), stem straightness (SSns), number of ramicorns (NRAMns) and number of forks (NFORns). The values indicate the probability of a randomly chosen seed orchard tree having a greater trait value than a random unimproved tree. In the seed orchard column, “JR-1” refers to the four seed orchards Nos. 362, 363, 377, and 384, while “JR-2” refers to seed orchard No. 383. | |||||||||
| Orchard | H | DBH | VOL | HD | OQns | BQns | SSns | NRAMns | NFORns |
| JR-1 | 0.60 | 0.55 | 0.56 | 0.50 | 0.58 | 0.62 | 0.52 | 0.48 | 0.34 |
| JR-2 | 0.77 | 0.56 | 0.63 | 0.63 | 0.71 | 0.73 | 0.63 | 0.48 | 0.27 |
| 288 | 0.59 | 0.54 | 0.56 | 0.52 | 0.57 | 0.56 | 0.53 | 0.47 | 0.50 |
| 336 | 0.61 | 0.53 | 0.55 | 0.53 | 0.57 | 0.57 | 0.52 | 0.48 | 0.49 |
| 364 | 0.60 | 0.55 | 0.58 | 0.51 | 0.53 | 0.53 | 0.54 | 0.47 | 0.47 |
| 373 | 0.68 | 0.58 | 0.62 | 0.53 | 0.59 | 0.61 | 0.54 | 0.47 | 0.47 |
| 378 | 0.61 | 0.51 | 0.54 | 0.57 | 0.60 | 0.59 | 0.56 | 0.45 | 0.49 |
| 379 | 0.60 | 0.55 | 0.58 | 0.49 | 0.58 | 0.59 | 0.56 | 0.50 | 0.49 |
| 381 | 0.68 | 0.56 | 0.59 | 0.56 | 0.57 | 0.62 | 0.52 | 0.53 | 0.51 |
| 387 | 0.69 | 0.59 | 0.62 | 0.52 | 0.52 | 0.51 | 0.35 | ||
| 390 | 0.55 | 0.53 | 0.51 | 0.58 | 0.61 | 0.57 | 0.52 | ||
| 393 | 0.58 | 0.55 | 0.54 | 0.52 | 0.56 | 0.58 | 0.54 | ||
| 422 | 0.64 | 0.58 | 0.60 | 0.52 | 0.60 | 0.63 | 0.59 | 0.48 | 0.38 |
| 424 | 0.54 | 0.54 | 0.54 | 0.51 | 0.58 | 0.56 | 0.53 | ||
| 430 | 0.68 | 0.64 | 0.66 | 0.48 | 0.62 | 0.56 | 0.46 | 0.41 | 0.47 |
| 431 | 0.81 | 0.64 | 0.71 | 0.56 | 0.53 | 0.47 | 0.44 | ||
| Average | 0.64 | 0.56 | 0.59 | 0.53 | 0.59 | 0.59 | 0.54 | 0.48 | 0.44 |
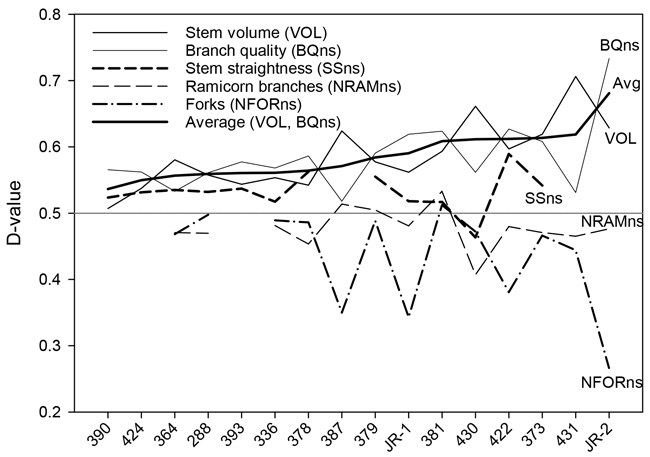
Fig. 3. D-values of the silver birch seed orchards for stem volume, branch quality stem straightness, number of ramicorns, and number of forks. The seed orchards are arranged in the ascending order of the average stem volume and branch quality D-values, reflecting the overall value of the orchard.
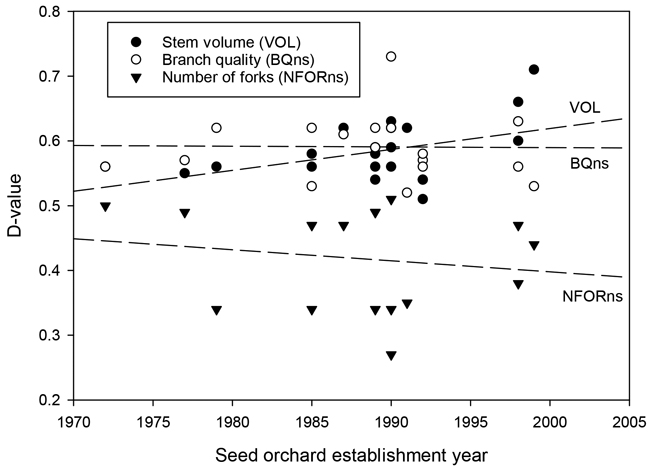
Fig. 4. The relationship between the establishment year of the silver birch seed orchard and the D-values for stem volume (VOL), branch quality (BQns), and the number of forks (NFORns).
The results for branch quality (BQns) were very close to those for OQns (Table 3). D-values for OQns and BQns varied from 0.53 to 0.71 and from 0.59 to 0.73, respectively. The gains in the quality traits were, on average, similar in older and newer seed orchards (Fig. 4).
Apart from a single seed orchard (No. 430), all the improved materials were straighter than the unimproved trees. Improvements in stem straightness (SSns) were slightly smaller than in OQns and BQns (Table 3).
Stem defects occurred less frequently in seed orchard lots than in unimproved materials (Tables 2, 3). The genetic improvement effects were more obvious in the case of forking, which showed a 16.2% average reduction. The frequency of ramicorn branches decreased by only 6.8%. These results likewise varied greatly between seed orchards. On average, more recently established seed orchards and those with few clones showed fewer defects than earliest seed orchards and those with many dozens of clones (Fig. 5). At the orchard level, the gains in NRAM and NFOR appeared to be essentially independent of one another (Tables 2, 3).
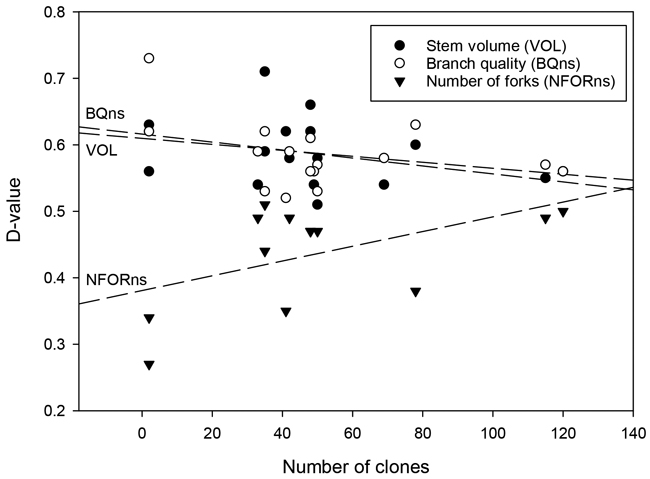
Fig. 5. The relationship between the number of clones in the silver birch seed orchards and the D-values for stem volume (VOL), branch quality (BQns), and the number of forks (NFORns).
Overall, there was a trade-off between genetic gains for stem volume and branch or overall quality (Fig. 3). The highest stem-volume gains were observed for the two most recent seed orchards, Nos. 430 and 431 (23.9% and 31.1%, respectively). These gains were partially offset by more modest gains in BQns and OQns. Conversely, those seed orchards that showed the smallest gains in VOL, specifically Nos. 390, 393, and 424, demonstrated at least fair improvements in quality traits (Table 3, Fig. 3).
“JR-2”, the younger of the two bi-clonal seed orchard varieties, outperformed both the older variety, “JR-1“, as well as all other seed orchards in terms of growth and quality, showing a tremendous reduction (–57.6%) in forking. The growth performance of “JR-1” was somewhat below average, although it rated among the better seed orchards in terms of branch size and forking (Table 3, Fig. 3).
The response to the latitudinal transfer of seedlots was most pronounced in stem volume and forking. Prolonged transfer distances, regardless of direction, had an unfavourable effect on both traits. The curvilinear pattern of association found for these traits was in line with the findings by Viherä-Aarnio et al. (2013). These findings are not elaborated further because the purpose was to distinguish transfer effects from genetic effects rather than to estimate the transfer effects themselves, for which the test material was not optimal.
4 Discussion
A simple statistical concept, the D-value, is apparently used here for the first time to assess the magnitude of genetic gains in forest trees. Demidenko (2016) originally advocated this statistic as a sample-size independent alternative to the p-values that are commonly used in statistical significance testing. In terms of genetic gain, the D-value applies to any normally distributed trait. As a result, it supplements the widely used ratio estimate (Eq. 2), which is only useful for metric characteristics that have a natural zero point, such as tree height or stem volume. The D-value quantifies the difference in trait distribution between the improved and unimproved groups, expressing the shift as a probability ranging from zero to one. While the D-value concept appears useful for comparing gains in different scaled traits, it has apparent limitations, the most notable of which is the difficulty of interpreting the probability in terms of economic value.
Individual seed orchard performance varied considerably, suggesting that genetic gains for silver birch must be determined on a seed-orchard basis. While the genetic merit of seed orchard parents is obviously a major factor under such variability, the premises of clonal selection are mostly not well documented, making it difficult to say why some orchards clearly outperformed others of the same period. Nevertheless, a few general trends are discernible. The progress made over the first thirty years of birch breeding is marked by the overall improving performance from the earliest seed orchards to the most recent ones. This implies increasing access to new, improved materials from the breeding programme and their subsequent deployment in seed orchards. The favourable trend is most visible for stem volume growth and forking. Both forks and ramicorn branches are phenotypically discernible traits that are obviously selected against at all stages of breeding. This explains their reduced occurrence in seed orchard materials, most notably those from the bi-clonal orchards (Tables 2, 3). The value of such improvements is clear by the findings of Kilpeläinen et al. (2011). They studied saw log recovery in thinnings and observed that various stem defects are the primary cause of the decreased value of silver birch stems, resulting in 60% of harvested stems graded as lower value pulpwood.
Branch quality has remained a key characteristic in birch breeding since the original phenotypic selection of silver birch plus trees, which placed a strong emphasis on good natural pruning (Koski and Rousi 2005). Branch quality showed modest and steady genetic gains without a temporal trend. Despite the preference of breeders for birches with thin and perpendicular branches, the results suggest that the focus of birch breeding has steadily shifted from branch quality to volume growth. This would best explain the lack of a distinct time trend, since further gains in branch quality have been probably restrained by the positive (thus unfavorable) genetic correlation between stem and branch growth (Zeltiņš et al. 2018).
Unsurprisingly, the number of orchard clones is also linked to the genetic gain of seed orchard crops. Many of the past birch seed orchards contained dozens, up to over a hundred, plus tree clones. The practice was at least partly driven by the concurrent use of greenhouse facilities for commercial seed production and breeding by the Foundation for Forest Tree Breeding that was engaged in both activities from the 1970s to the 1990s (Metsänjalostussäätiö 1973). While breeding progress is sped up by using many orchard trees in controlled crosses, this comes at the cost of selection intensity, which is an important component of genetic gain (Falconer and Mackay 1996). Such integration is obviously not optimal for neither breeding nor seed production. In some specific cases, such as with the seed orchards Nos. 288 and 364, the small gains could also be attributed to ineffective selection, as these two orchards were seedling seed orchards primarily made up of phenotypically selected saplings transplanted to the orchard from juvenile progeny trials (Hagqvist and Hahl 1997).
The five bi-clonal seed orchards that were active in the 1980s and 1990s mass-produced two tested full-sib families commonly known by their acronyms “JR-1” and “JR-2” (Table 1). “JR-1” is a progeny of two first-generation plus trees, E1970 and E1980. Jyrki Raulo, a former birch breeder, found the family in a single progeny trial where it stood out for its good growth and quality (Raulo 1979). The current findings put JR-1’s purported overall superiority into question, implying that the benefits of this family are, in fact, mostly limited to reduced forking and generally good branch quality. The growth performance of this family, however, is no better than that of multi-clonal seed orchards from the same period. The other full-sib family “JR-2” (the progeny of two second-generation plus trees, V596 and V558), produced in a single seed orchard No. 383, on the other hand, performed the best among all the seed orchards examined. Apart from significant genetic gains (18.9%) in stem volume growth, “JR-2” showed the highest gains in stem forking and branch quality.
The excellent field performance of the “JR-2” variety demonstrates the potential benefit of mass-reproducing tested, outstanding full-sib families in indoor seed orchards where pollen contamination is avoided. The success of the concept is critically dependent on the simultaneous and adequate flowering of the orchard clones, though. Even when the two clones are of the same geographical origin, individual genetic variability in flowering time tends to be an issue for proper orchard functioning. The risk of non-overlapping flowering is obviously smaller when there are many clones in the orchard. The Finnish experience proves that seed crops from multi-clonal orchards markedly surpass those from bi-clonal silver birch seed orchards.
Because of the scarcity of realised genetic gain studies in silver birch, it is interesting to compare the present results to the only direct reference available, the study by Hagqvist and Hahl (1997, 1998) where they analysed eight silver birch progeny trials measured at the average age of 10 years. The plus tree progenies showed nearly 30% improvements in stem volume growth (Hagqvist and Hahl 1997, 1998) and a 6–10% improvement in relative branch diameter. They also reported more detailed results for three silver birch seed orchards, two of which, Nos. 288 and 336 were also common with this study. The estimated genetic gains in stem volume growth for these two seed orchards were about 34% (Hagqvist and Hahl 1997, pp. 24, 29) and 15% (Hagqvist and Hahl 1997, p. 34), respectively. Current estimates for the same two orchards are far lower (8.3% and 7.7%) suggesting that the gains by Hagqvist and Hahl (1998) may have been exaggerated. Hagqvist and Hahl (1998) expressed various concerns and reservations about their results, pointing out that individual progeny trials had considerably varied outcomes, with two trials showing suspiciously high volume-growth gains, and that there were only few unimproved controls – usually one or two – in each trial.
Another factor that could explain the imparity of their results with the current ones is the way seed transfer effects were considered. Silver birch is known to be responsive to latitudinal transfer in key traits such as yield, survival, and stem defects (Viherä-Aarnio et al. 2013). Instead of removing the transfer bias by statistical means, Hagqvist and Hahl (1997, 1998) subjectively chose the most appropriate natural stand seedlots to serve as “local” references for comparing the improved seedlots. Still, some of those controls appear to have represented more northern origins than the improved test materials (Hagqvist and Hahl 1997, p. 9). The relatively more southern origin of the plus tree materials may have resulted in an exaggeration of the volume gain compared with the current study, where the genetic-group differences were estimated simultaneously with the effects of latitudinal transfer distance. This could also explain why, contrary to the current findings, Hagqvist and Hahl (1997, 1998) found that unimproved progenies had fewer ramicorn branches and forks than improved ones, as more northern origins generally show fewer stem defects (Viherä-Aarnio et al. 2013).
Certain issues with the test materials probably influenced the current results as well. For instance, even though the data came from many trials, the representation of different seed orchards was greatly skewed. Some seed orchards, such as “JR-1” and “JR-2”, were included as improved controls in 26 and 19 trials, respectively, whereas six seed orchards were only tested in two or three progeny trials. The number of tested trees also varied greatly among the seed orchards (Table 1), with genetic gains from less represented seed orchards generally lacking statistical significance (Table 2).
The representativeness of test materials for gain estimation is an additional concern. Control seedlots are usually presumed to be representative samples of the underlying natural population. However, as Hagqvist and Hahl (1998) point out, this requirement is not properly met in Finnish silver birch progeny trials where the controls have been derived from selected natural stands that were specifically registered for seed collection due to their good phenotypic appearance. Moreover, these seedlots were commonly harvested from the best trees in these stands, in some cases even comprising selected plus trees. Undoubtedly, the seedlots collected this way are likely to overvalue the genetic worth of the native silver birch. Consequently, the estimates of realised gain may be regarded as understating the true effect of past breeding efforts. The magnitude of this bias is difficult to assess. On the other hand, such phenotypically good stands were earlier substitutes for seed orchards as seed sources. In this sense, the controls in the present trials could also be regarded as acceptable “practical standards”.
To provide adequately credible performance data, common-garden trials are expected to run for at least 10 to 20 years. This is generally impractical for the gain estimation since, by the time the commercial seedlots tested have achieved sufficient maturity, they have typically been replaced in forest regeneration by new seed orchard materials. This is particularly true for rapidly rotating (8 to 10 years) silver birch seed orchards. The seed materials studied here were deployed a 20 to 30 years ago. Although the past seed orchards are genetically most likely not on par with the present-day seed orchards, they account for the majority of planted birch stands still standing, making research into their genetic gains still well-founded.
The present results demonstrate the overall progress made in birch breeding from the early 1970s to the late 1990s through changes in individual tree traits that were assessed early in the rotation. Naturally, forest managers and landowners place a higher value on genetically induced increases in wood productivity at the stand level, as well as the corresponding financial gains that are likewise dependent on timber quality. To obtain such projections, the genetic effects observed early in the rotation must be considered in growth models. In Finland, the currently available growth models for planted birch stands were developed decades ago (Oikarinen 1983), based on stands established with unidentified seed sources long before the seed orchard era. Given that silver birch plants are today exclusively raised from genetically improved seed, it is obvious that new growth and stand yield models must be developed that properly catch up to the increases due to past birch breeding activities. The range of genetic gains documented in this study will hopefully prove beneficial for ongoing and future studies that seek to modernise the growth models and make them better suited for the current planted silver birch stands.
Acknowledgements
I wish to thank Ms. Leena Yrjänä for devising the map of trials (Fig. 1). I am also grateful for the editor and reviewers for their insightful comments and suggestions.
Declaration of openness of research materials, data, and code
The data used in the study are permanently stored at the Forest Genetics Register of Luke (Yrjänä et al.). The data and digital materials (SAS program code) used in this study are available from the author on reasonable request.
Funding
Natural Resources Institute Finland (Luke), projects 41007-00229400 (ProBirch), 41001-00000601 (Forest tree breeding and seed orchard programs).
References
Danell Ö, Werner M (1989) Övergripande plan för björkförädling. [Overall plan for birch breeding]. Arbetsrapport nr 226, Institutet för Skogsförbättring, Uppsala.
Danell Ö, Werner M (1991) Svensk björkförädling – förväntade framsteg under första generationen. [Swedish birch breeding – expected progress in the first generation]. Rapport nr 22, Institutet för Skogsförbättring, Uppsala.
Demidenko E (2016) The p-value you can’t buy. Am Stat 70: 33–38. https://doi.org/10.1080/00031305.2015.1069760.
Falconer D, Mackay T (1996) Quantitative genetics. Longman, Harrow, UK.
Gailis A, Zeltiņš P, Purviņš A, Augustovs J, Vīndedzis V, Zariņa I, Jansons Ā (2020) Genetic parameters of growth and quality traits in open-pollinated silver birch progeny tests. Silva Fenn 54, article id 10220. https://doi.org/10.14214/sf.10220.
Hagqvist R, Hahl J (1997) Rauduskoivun siemenviljelysten jalostushyöty: koeaineistot ja siemenviljelykohtaiset tulokset. [Genetic gains in silver birch seed orchards: experimental materials and results by seed orchard]. Metsänjalostussäätiön työraportteja 46: 1–47.
Hagqvist R, Hahl J (1998) Genetic gain provided by seed orchards of silver birch in southern and central Finland. Reports of the Foundation for Forest Tree Breeding 13: 1–32.
Hynynen J, Niemistö P, Viherä-Aarnio A, Brunner A, Hein S, Velling P (2010) Silviculture of birch (Betula pendula Roth and Betula pubescens Ehrh.) in northern Europe. Forestry 83: 103–119. https://doi.org/10.1093/forestry/cpp035.
Kärki L (1976) Toward more effective tree breeding through the use of flower induction halls. Yearbook 1976, The Foundation for Forest Tree Breeding, pp 37–45.
Kilpeläinen H, Lindblad J, Heräjärvi H, Verkasalo E (2011) Saw log recovery and stem quality of birch from thinnings in southern Finland. Silva Fenn 45: 267–282. https://doi.org/10.14214/sf.117.
Koski V, Rousi M (2005) A review of the promises and constraints of breeding silver birch (Betula pendula Roth) in Finland. Forestry 78: 187–198. https://doi.org/10.1093/forestry/cpi017.
Laasasenaho J (1982) Taper curve and volume functions for pine, spruce, and birch. Commun Inst For Fenn 108: 1–74. http://urn.fi/URN:ISBN:951-40-0589-9.
Lepistö M (1973) Accelerated birch breeding – in plastic greenhouses. For Chron 49: 173–174. https://doi.org/10.5558/tfc49172-4.
Liziniewicz M, Barbeito I, Zvirgzdins A, Stener L-G, Niemistö P, Fahlvik N, Johansson U, Karlsson B, Nilsson U (2022). Production of genetically improved silver birch plantations in southern and central Sweden. Silva Fenn 56, article id 10512. https://doi.org/10.14214/sf.10512.
Metsänjalostussäätiö (1973) Activity of the foundation for forest tree breeding in Finland in 1973. Yearbook 1973, The Foundation for Forest Tree Breeding, p 26.
Natural Resources Institute Finland (2023) Statistics database. https://www.luke.fi/en/statistics/. Accessed 4 November 2023.
Niemistö P, Viherä-Aarnio A, Velling P, Heräjärvi H, Verkasalo E (2008) Koivun kasvatus ja käyttö. [The silviculture and use of silver birch]. Metsäkustannus. ISBN 978-952-5694-12-3.
O’Dowd N (2004) The improvement of Irish birch. Phase 1: selection of individuals and populations. COFORD, Dublin.
Oikarinen M (1983) Etelä-Suomen viljeltyjen rauduskoivikoiden kasvatusmallit. [Growth and yield models for silver birch (Betula pendula) plantations in southern Finland]. Commun Inst For Fenn 113. http://urn.fi/URN:ISBN:951-40-0619-4.
Raulo J (1977) Development of dominant trees in Betula pendula Roth and Betula pubescens Ehrh. plantations. Commun Inst For Fenn 90.4. http://urn.fi/URN:NBN:fi-metla-201207171123.
Raulo J (1979) Stem quality of Betula pendula Roth progenies in South and Central Finland. Commun Inst For Fenn 97.5. http://urn.fi/URN:NBN:fi-metla-201207171127.
Rosvall O, Jansson G, Andersson B, Ericsson T, Karlsson B, Sonesson J, Stener L-G (2001) Genetiska vinster i nuvarande och framtida fröplantager och klonblandningar. [Genetic gain from present and future seed orchards and clone mixes]. Redogörelse, Siftelsen Skogsbrukets Forskningsinstitut, Skogforsk, Uppsala.
SAS Institute Inc (2009) SAS/STAT 9.2 User’s guide, mixed modeling (book excerpt). SAS Institute Inc, Cary.
Viherä-Aarnio A, Kostiainen K, Piispanen R, Saranpää P, Vapaavuori E (2013) Effects of seed transfers on yield and stem defects of silver birch (Betula pendula Roth). For Ecol Manag 289: 133–142. https://doi.org/10.1016/j.foreco.2012.10.030.
Yrjänä L, Koski R, Aalto A, Viirros R (2023) Metsägeneettinen rekisteri. [The Forest Genetics Register]. Luonnonvarakeskus. http://urn.fi/urn:nbn:fi:att:ef3fe7d1-e1c9-46af-9498-384584429ce9.
Zeltiņš P, Matisons R, Gailis A, Jansons J, Katrevics J, Jansons A (2018) Genetic parameters of growth traits and stem quality of silver birch in a low-density clonal plantation. Forests 9, article id 52. https://doi.org/10.3390/f9020052.
Zeltiņš P, Šņepsts G, Donis J, Rieksts-Riekstiņš R, Kangur A, Jansons A (2022) Advancing height growth models for the improved forest reproductive material of the main tree species in Latvia. Balt For 28, article id 682. https://doi.org/10.46490/BF682.
Total of 27 references.
