Atte Koskivaara  ,
Katja Lähtinen,
Anne Toppinen
,
Katja Lähtinen,
Anne Toppinen
Longitudinal analysis of financial performance of sawmills and wood construction element producers in Finland
Koskivaara A., Lähtinen K., Toppinen A. (2025). Longitudinal analysis of financial performance of sawmills and wood construction element producers in Finland. Silva Fennica vol. 59 no. 2 article id 24033. https://doi.org/10.14214/sf.24033
Highlights
- Wood element producers show more variation in profitability measures during 2012–2021 than sawmills
- Element producers’ financial stability shows a decreasing trend in comparison to slight growth in the case of sawmills
- Value-added has a positive effect on both sectors competitiveness whereas cost items have negative effects
- Investments have a positive effect on element producers’ solvency and negative on sawmills.
Abstract
The global outlook for wood construction is positive, driven by bio- and circular economy programs promoting wood use in construction. The industrialization of building processes is also seen as essential for improving construction efficiency and competitiveness. However, despite this positive outlook, wood construction in Finland remains a niche that has yet to reach its full potential. To reduce the dependency between the concrete and construction sectors, the wood element value chain needs competitive businesses to foster innovations and capture a larger market share in this highly competitive industry. However, the performance of two important stages of the value chain, sawmilling and wood element manufacturing, has not been measured in the scientific literature. The competitiveness of Finnish sawmills and wood element producers were analyzed by studying the industry’s financial performance using firm-level panel data and a regression approach over the 2012–2021 period. The results suggest higher variation across element producers’ profitability, while sawmills are more homogenous. Both value chain stages show signs of typical manufacturing industries, as materials and salaries proved to have a relatively high negative impact on competitiveness. However, differences were also found especially regarding short-term solvency and liquidity trends and average levels of costs and value-added. To understand competitiveness in the wood construction sector, an insight into intra- and inter-industry dynamics and value chain positioning is therefore required. Financially viable sawmilling and wood element firms are essential not only for business survival but for transforming the construction industry’s logic.
Keywords
wood construction;
competitiveness;
profitability;
business;
financial analysis;
innovation;
value-added
-
Koskivaara,
Natural Resources Institute Finland (Luke), Bioeconomy and environment, Latokartanonkaari 9, 00790 Helsinki, Finland
 https://orcid.org/0000-0001-7454-0470
E-mail
atte.koskivaara@luke.fi
https://orcid.org/0000-0001-7454-0470
E-mail
atte.koskivaara@luke.fi
-
Lähtinen,
Natural Resources Institute Finland (Luke), Bioeconomy and environment, Latokartanonkaari 9, 00790 Helsinki, Finland
https://orcid.org/0000-0001-6260-5062
E-mail
katja.lahtinen@luke.fi
-
Toppinen,
University of Helsinki, Faculty of Agriculture and Forestry, Latokartanonkaari 7, 00014 Helsingin yliopisto, Finland
https://orcid.org/0000-0003-0910-1505
E-mail
anne.toppinen@helsinki.fi
Received 7 June 2024 Accepted 21 September 2025 Published 1 October 2025
Views 40708
Available at https://doi.org/10.14214/sf.24033 | Download PDF

Supplementary Files
1 Introduction
Competitiveness is essential for a company’s survival and growth within its market, with innovation the key driver of competitiveness and productivity also shaping the industry as a whole (Simmie 2004). Over time, the constituents of competitiveness have shifted from a focus on efficiency and physical production factors (Marshall 1972) to value creation and the use of intangible resources which enable the development of new market offerings and higher flexibility in operations (Porter 1998). In the 1990s, the importance of proactive adaptation to the changes in the external business environment based on company-level strategic choices began to receive increasing emphasis (Conner 1991; Grant 1991).
For example, the concept of competitiveness is ambiguous (Korhonen et al. 2017) because the scope of the analysis in the literature ranges from microeconomy (Porter and Christensen 1999) to macroeconomy (Flachenecker 2018) levels (Siggel 2006; Chikán et al. 2022). Compared with macroeconomic competitiveness addressing national economies, for example, this study focuses on microeconomic competitiveness at the level of individual firms in particular industries (Siggel 2006). As a proxy for companies’ competitiveness, we focus on their financial performance, which has commonly been used in previous studies as a measure to analyze forest industries’ competitiveness (Korhonen et al. 2017).
Toward the 2000s, companies’ environmental and social performance requirements started to drastically change their business environment, including forest industries (Toppinen et al. 2016). Circular, green and bioeconomy strategies (D’Amato and Korhonen 2021) derived from international (European Commission 2018, 2019) and national (Mickwitz et al. 2011) policy processes have been the main constituents of pressures from the external business environment on forest-based businesses to contribute to the sustainability transition (Bioökonomierat 2015). As a result, the analysis of competitiveness has also become more complex due to the need to consider sustainability aspects as determinants of business success (Korhonen et al. 2017).
Forest industry businesses manufacture many types of intermediate and end products for business customers and consumers (Shmulsky and Jones 2011; Lähtinen et al. 2023) with chemical (e.g., pulp and paper) and mechanical (e.g., sawnwood and engineered wood products) processes. Alongside increasing challenges and complexities in the external business environment, climate, energy, and forest policies provide new opportunities for forest industry businesses to seek competitiveness in the markets (Antikainen et al. 2017; Lähtinen and Häyrinen 2022). For example, their products are expected to increasingly replace fossil-based products in the construction, textile, chemical, biofuel, and packaging industries (Hurmekoski et al. 2022) and provide renewable solutions with potential for cascading (Ollikainen 2014). The pressure on forest industries to enhance their sustainability performance has therefore been both a necessity and an encouragement for innovations (Pätäri et al. 2016). Additionally, in the context of transformative industrial change in the forest industry, regional actors, including sawmills, face an increasing set of responsibilities, including establishing the legitimacy of change, shaping the industry’s innovation trajectory, and achieving social acceptance for change (Martin et al. 2023).
The construction industry is the main user of mechanically manufactured forest industry products such as sawnwood and engineered wood products (Shmulsky and Jones 2011; Bumgardner et al. 2013) processed by wood product firms. Coniferous sawnwood is both an intermediate product (e.g., used as a material for engineered wood products) and end product (i.e., used as such, e.g., in building). It has been an internationally traded commodity for centuries, with intensified production and trade in the twenty-first century (Gil et al. 2023). Sawnwood processing (i.e., sawmill industry) has been often described as a raw-material-dependent (Väätäinen et al. 2021) mature and production-focused activity (Brege et al. 2010; Stendahl et al. 2013) characterized by a low degree of innovation and customer understanding (Hansen et al. 2017). Based on this, sawmills have been considered to lean toward a production-oriented business logic in which companies’ pursuit of competitiveness has been based on production efficiency through e.g., large production volumes and highly technologized production processes, enabling minimizing costs of raw materials and salaries (Lähtinen and Toppinen 2008).
To amend their financial performance, higher priced sawnwood products have been identified as the main option for sawmills to achieve a healthy financial performance (Lähtinen and Toppinen 2008). In practice, this refers to the request for increasing innovation activities, which independently of industries has been found to have a positive impact on companies’ business success (Saunila and Ukko 2012). For example, this has led to a quest for higher value-added production potential in sawmills by adding new properties to products and services in production (e.g., dimensions and surface treatments according to customers’ needs) (Korhonen and Niemelä 2005). In addition, some firms have started to build new collaboration relationships with their customers in secondary processing and the construction industry to increase their product portfolio and gain higher profit margins (Brege et al. 2014; Makkonen and Sundqvist-Andberg 2017; Makkonen 2018).
Compared with sawmills, the main business focus for engineered wood product manufacturers (i.e., wood element producers) is the processing of sawnwood to manufacture components and elements according to construction industry needs (Pelli and Lähtinen 2020; Lähtinen and Häyrinen 2022). In some cases, wood element producers have started to operate as developers and builders in the construction industry markets (Stehn et al. 2021). However, compared to internationalized sawmills, wood element producers operate mainly in the domestic markets. According to the Alma Talent data used in the study, their exports are minimal, as only a few wood element producers have reported their export share of turnover in the first place. Moreover, in cases when figures are reported, they often account for only a few percent, whereas exports are often a major source of turnover for sawmills.
The positive prospects for both sawmills and wood element producers exist both in the domestic and international markets, as companies in the construction industry face pressures to increase the use of renewable materials and extend the life cycle of products and buildings (Dangel 2016) and with a strategic shift from products to services and systems (Weber and Schaper-Rinkel 2017). In addition, the industrialization of building processes in an urbanized society has long been considered a requirement for enabling the better construction efficiency and competitiveness of construction industry businesses (Nadim and Goulding 2011). Using wood as the main building material can substantially reduce carbon dioxide emissions, as wood product manufacturing typically requires less fossil energy, the processing of wood produces by-products that can replace fossil fuels, and wood itself acts as a carbon sink, compared with conventional building materials such as concrete and steel (Sathre and Gustavsson 2007).
Although the outlook for wood construction is widely regarded as positive in contributing to the decarbonization of the built environment (Hurmekoski et al. 2022), the use of wood construction components has remained a promising niche that has yet to meet its full potential (Toppinen et al. 2019a). According to Jussila et al.’s (2022) systematic literature review results, the causes of the slow development have been the path dependencies (e.g., established processes, practices, and human skills) in the construction industry favoring the use of concrete, especially in multistory buildings. Their review findings therefore showed the need for more extensive research on wood-based value chains to challenge the construction industry’s concrete-dominant building traditions. In addition, construction has also moved toward urban buildings in Finland (Tiitu et al. 2021), which is an application where wood has traditionally played only a small role compared with detached housing (Schauerte 2010). Nevertheless, opportunities also exist for large-scale wooden constructions (Bysheim and Nyrud 2009; Hurmekoski et al. 2015).
In all, both sawmills and wood element producers have potential to seek competitiveness through the provision of market offerings contributing to sustainability change in the construction industry (Jussila and Lähtinen 2020; Pelli and Lähtinen 2020; Lähtinen and Häyrinen 2022). In addition, increasing the value of products through processing activities meeting customers’ needs has been emphasized as a solution to strengthen companies’ competitiveness (Lähtinen and Toppinen 2008; Makkonen and Sundqvist-Andberg 2017). However, a quantitative analysis and comparisons of the financial performance of firms focusing on primary (i.e., sawmills) and secondary (i.e., wood element producers) processing are missing from the literature.
To address this gap, the study’s main objective is to assess the financial performance of Finnish sawmills and wood element producers. This is addressed with the following research questions: First, does a focus on primary or secondary processing in the wood product industry influence the financial performance of firms? Second, how do variable costs, investment costs, and value creation affect the financial performance of the different types of companies? To answer the research questions, four hypotheses are set:
H1: Profitability ratios show higher variation for wood element producers operating in an emerging industry than for sawmills.
H2: Material and salary costs have a negative impact on the financial performance of both sawmills and wood element producers.
H3: Investment costs have a negative impact on financial performance of both sawmills and wood element producers.
H4: Value-added has a positive impact on financial performance of both sawmills and wood element producers.
2 Strategic choices of sawmills and wood element producers
In the wood product industry, process and product innovations have traditionally gained the most attention in value creation (Nybakk et al. 2011). However, especially since the beginning of the century, increasing the value-added of products and integrating services into product offerings have been considered important innovations and strategies for the business success of sawmills and wood element producers (Hansen et al. 2006; Nybakk et al. 2011; Brege et al. 2014; Pelli and Lähtinen 2020). Furthermore, customer-oriented business approaches have been promoted by several forestry researchers to assess the industry’s strategic concerns (Hurmekoski and Hetemäki 2013; Stendahl et al. 2013; Näyhä et al. 2015), as well as the utilization of intangible resources (Cohen and Kozak 2002).
Especially in the last decade, industrial prefabrication of the components and modules used in construction (i.e., wood element production) has been emphasized as a promising avenue for the wood product industry to seek new business opportunities (Bumgardner et al. 2013). According to Lessing and Brege (2014), the business possibilities of wood element producers to supply solutions for the construction industry include reliable and fast delivery times, as well as the enabling of a high degree of production stability and coordination with subcontractors, suppliers, and design, although potential drawbacks such as reduced design flexibility also exist.
For wood industry firms, the provision of new wood-based solutions for the building processes has meant collaborative new relationships with construction industry companies and the uptake of new business models through process and product innovations, for example (Brege et al. 2014). Furthermore, firms focusing on supplying the wood elements for industrialized building processes have been seen to have potential to encourage other wood industry firms to develop their products and services in response to the construction industry’s emerging needs (Hurmekoski et al. 2018).
Thus, although sawmills and wood element producers may sustain their individual roles in the value-chains, they may gain synergic benefits through collaboration to better meet customers’ needs through joint innovation activities to serve their common customers (e.g., construction companies) (Makkonen and Sundqvist-Andberg 2017), for example. This also connects with the potential of sawmills and wood element producers as forest industry actors to take a role in regional, sectoral, or technological innovation systems (Weiss et al. 2020). An outcome of such activities is that wood industry companies may both create value for the construction industry (Lazarevic et al. 2020) and initiate sustainability change in construction through local activities (Koskivaara and Lähtinen 2023).
According to the Finnish Timber Guide (Wood From Finland 2024), at its lowest processing level, sawnwood produced for the Finnish domestic market and exports is dimensioned and rough-planed to precise standardized measurements. In addition, most sawmills also supply all-round planed products with a wide range of profiles, used in load-bearing structures, and buildings’ facades and interiors, for example. In value creation for the construction industry, sawmills therefore primarily act as product and component suppliers. By focusing on cost reduction and process efficiency, sawmills have often invested in high-tech production technologies (Hansen et al. 2007). As a result, companies have emphasized tangible assets when seeking a competitive advantage.
In comparison, wood element producers use sawn wood to manufacture engineered wood products such as glued laminated timber (glulam), laminated veneer lumber (LVL), and cross-laminated timber (CLT). Engineered wood products are used especially in prefabricated elements (e.g., roof elements, floor/wall elements (non-volumetric), and/or module (volumetric) elements), which enable industrial offsite building processes (Lam and Prion 2003; Heräjärvi et al. 2004). The need for sustainability change has opened new opportunities for wood element producers to provide building solutions for the construction industry (Pelli and Lähtinen 2020). As a result, some have also taken roles as contractors and developers in the building projects (Toppinen et al. 2019a, 2019b).
Wood element producers and sawmills operate in separate processing stages in construction industry value creation (Fig. 1). Wood industry companies’ (i.e., sawmills and wood element producers) solutions for positioning themselves in value creation for the construction industry with the selected products and related services is not only a question of technologies but they also reflect the choices made within companies on their business models, including their roles in serving construction industry customers through knowledge about their needs related to building processes.
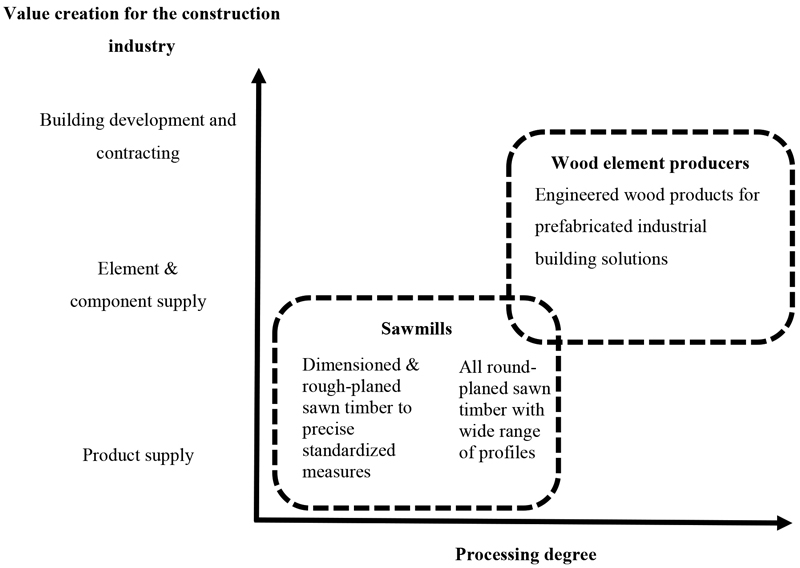
Fig. 1. Processing degree in mechanical wood industries combined with value creation for the construction industry. Through supplier-customer relationships, sawmills and wood element producers connect with each other through their products and services for building processes (dashed lines) (modified from Brege et al. 2014).
The manufacture of sawn wood and wood elements represents different, though partly overlapping, stages of processing in mechanical wood industries (i.e., primary, secondary) that result in different types of connections with construction industry’s building processes (as visualized in Fig. 1). From individual firms’ perspective, the strategic focus on either primary or secondary processing is thus driven by a different logic in product manufacturing with internal tangible (e.g., raw materials, technologies) and intangible (e.g., capabilities, customer relationships) resources (Lähtinen 2007), for example. These strategic decisions therefore result in firm-specific differences in their financial performance (Lähtinen 2009), even for companies operating in the same industries (e.g., sawmilling or wood element production).
Our study employs financial performance as a measure for sawmills’ and wood element producers’ competitiveness, in line with previous forest industry studies (Korhonen et al. 2017). Although industrial structures (Porter 1985) such as roundwood and construction markets (Toivonen et al. 2021; Asada et al. 2023) also affect the competitiveness of forest industry firms (e.g., sawmills and wood element producers). Through successful strategic choices, companies may outperform their competitors and gain above-average financial performance within their industries (Lähtinen 2007; Lähtinen and Toppinen 2008). Compared with the industry-level assessment of the factors of competition, firm-level evaluations are generally scarce due to the lack of data, despite the fact that single companies constitute the competitiveness of any industry (Falciola et al. 2020). Through timescales, firm-level financial performance provides ex-post information about the success in business model implementation based on ex-ante interpretation of future events occurring in the external environment (Hunt and Morgan 1996; Barr 1998; Siggel 2006).
At the core of the companies’ business models are their strategic choices on product portfolios and roles in value chains (e.g., Fig. 1). These rely mostly on their internal strategic strengths (i.e., resources and capabilities), which are firm-specific characteristics affecting the potential of an individual firm to succeed in its business environment (Spanos and Lioukas 2001; Hawawini et al. 2003; Lähtinen 2007). However, for manufacturing firms such as sawmills and wood element producers, the possibilities of making strategic changes through the formulation of business models are strongly affected by the path dependencies in their use of raw materials and machinery (Lähtinen and Häyrinen 2022).
Hence, gaining information about ex-post financial performance of companies operating in mechanical industries helps in understanding the economic realities of individual businesses to contribute to addressing the emerging need for the decarbonization of the construction sector, for example. In addition, comparisons between individual companies in their financial performance add knowledge about how the dynamics between different measures (especially value creation) contribute to their actual economic success and long-term viability in the markets.
3 Materials and methods
3.1 Evaluation of competitiveness with financial performance measures
In this study, we employed a panel dataset of firm-specific financial statement information. Such data enable an evaluation of how ex-ante business model choices related to product portfolios (i.e., primary or secondary processing) have affected firms’ financial performance. This can be implemented by evaluating the impacts of variable costs (i.e., salaries and materials), investment costs (i.e., investments), and value creation (i.e., value-added) on firms’ financial performance measures (Lähtinen and Toppinen 2008), described in detail in Chapter 3.2. Regarding costs, despite expenses not being divided into variable and fixed costs in financial statements, they are often viewed separately in business management to better enable the assessment of income and expenses in different production volumes, for example (Briciu 2008). Variable costs depend on the production volumes and fixed costs are considered as annual expenses. Hence, while profits can be achieved only through the allocation of variable costs, fixed costs such as investments in new production technologies are typically viewed as providing productive capacity (Dixon 1940).
In the analysis of this study, the data originated in firms’ official financial statements (i.e., the income statement and balance sheet) and their attachments from ten accounting periods (2012–2021) collected by the Finnish Patent and Registration Office and acquired as adjusted financial statement information from the Alma Talent database. An outcome of adjustments was that the impacts of discretionary items (e.g., the differences between companies in their practices to record depreciations) and one-time items (e.g., sources of income caused by exceptional activities such as selling production facilities) were removed for the sake of comparability (Committee of Corporate Analysis 2011, 2017).
In financial statement accounts, the balance sheet describes a company’s financial position, whereas the income statement represents the structure of a company’s earnings (Committee for Corporate Analysis 2011). For example, a cash flow statement may also be used to acquire information about the annual net investments, which is based on the official balance sheet figures for investments and divestments in intangible and tangible assets.
In assessing the determinants of competitiveness with financial statement information, similar economic events faced by individual companies (e.g., changes in regulation and/or market) (Barr 1998) enhances the comparability of firm-level data (De Franco et al. 2011). In our study, this was related to a focus on companies from the two processing stages (i.e., sawnwood or wood element products) within the wood products industry to standardize the impacts of other potential factors for business success (e.g., strategic focus on other forest industry products) (Lähtinen and Toppinen 2008). In addition to adjusted firm-level financial statement data, Alma Talent provided qualitative information in the form of news that has been utilized to check companies’ product portfolios (i.e., a focus on primary or secondary processing of wood industry products) enabling the validity of the data to be checked and the interpretation of the results to be supported.
Thus, prior to the analysis, the preliminary scrutiny of companies’ product portfolios was implemented to include only a strategic focus on the manufacture of sawnwood or wood element products in the final dataset. In addition, for the sake of comparability in the size of the two types of wood product industry company categories, only companies with a turnover within a range of 1–75 millions of euros/year were included in the analysis. An outcome of this procedure was that the data of this study comprise 36 sawmills (i.e., the main business focus in the primary processing of sawnwood) and 34 wood construction element producers (i.e., the main business focus in the secondary processing of wood construction elements). In personnel numbers, sawmills and wood construction element producers in the dataset were quite alike (Fig. 2).
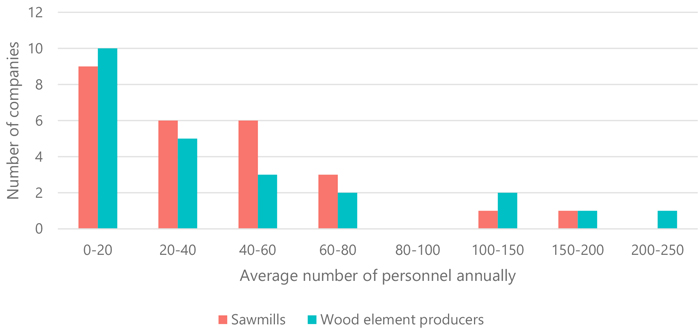
Fig. 2. Distribution of studied sawmills and wood element producers by number of average personnel annually.
These specific industry classifications are not separately recorded by official statistics as such, making it difficult to assess the coverage of companies precisely in their corresponding industries in this study. However, according to the Finnish Sawmills Association (2025), there are over 80 industrial scale sawmills in Finland, and hundreds of smaller mills operating locally. Regarding element producers, a report conducted in 2020 by the Ministry of Economic Affairs and Employment of Finland (Sipiläinen 2020), lists a total of 32 companies which produce wooden construction elements in Finland, indicating that the set of companies used in this study is fairly comprehensive.
3.2 Characteristics of different financial performance measures
As financial proxies for assessing the ex-ante capacity of wood product firms to compete in the markets with particular product portfolios defined in firms’ business models (Nybakk et al. 2011; Brege et al. 2014), information about variable costs (i.e., the monetary value of material purchases and salaries from the income statement), the net value of investments (i.e., the monetary value of investments from the cash flow statement), and value creation (i.e., the monetary value of value-added from the income statement) were used (Lähtinen and Toppinen 2008). To enable their use in a comparable manner, the explanatory variables derived from accounting data are expressed as proportions of turnover. For ex-post assessments of their outcomes in firm-specific competitiveness in sawmilling and wood construction element production, financial ratios were selected with the goal of receiving comprehensive information about companies’ financial position.
The selection of the financial measures for the ex-post evaluations was based on the information about the characteristics of different financial statement figures and recommendations provided by the Committee of Corporate Analysis (2011, 2017), the availability of data in the Alma Talent database, and information received from empirical studies on wood product industry competitiveness (Lähtinen and Toppinen 2008). In practice, the goal was to find and choose such financial information about measures that described liquidity, solvency, and profitability, considered as traditional dimensions of financial performance in the financial statement analysis (Laitinen 2000).
An outcome of the selection process for appropriate financial performance measures was that ratios describing liquidity (Current Ratio with benchmark values above 2 showing good liquidity, 1–2 satisfactory and below 1 showing poor liquidity), solvency (Equity Ratio % with benchmark values above 40% indicating good solvency, 20–40% satisfactory and below 20% poor solvency), and profitability (Return On Capital Employed, ROCE % and Net Profit Ratio %) were chosen for use as proxies for competitiveness (Committee of Corporate Analysis 2011).
Current Ratio is calculated as the relation between the sum of inventories and financial assets, and short-term liabilities, and it describes companies’ capabilities of taking care of their debts economically on time. For example, inventories comprise raw materials and semi-finished and end products in storage, and financial assets are liquid monetary reserves (e.g., deposits, stocks), while short-term liabilities are composed of advances received from externally purchased sales and debts for services and products. Equity Ratio is a measure of solvency, which means companies’ endurance in withstanding losses and capability of making long-term economic commitments calculated as a proportion of shareholders’ equity and total equity (i.e., the sum of shareholders’ equity and liabilities). In addition, two types of profitability ratios were chosen due to their differences in depicting the time scale of the measurement: Net Profit Ratio % is only a division between net sales and turnover (i.e., profit) in the accounting period and is here referred to as absolute profitability, as it reflects the overall profitability of business operations, while ROCE % is referred to as a measure of relative profitability, as it takes into account the profits in relation to the capital invested in the company (Committee for Corporate Analysis 2011).
The monetary information used in this study can be divided into ex-ante drivers of competitiveness and ex-post outcomes of competitiveness (Table 1). In addition to the variables presented in Table 1, Turnover and Average number of personnel annually were used in the study. Personnel is measured as full-time employment equivalents.
| Table 1. Financial information to assess monetary drivers and outcomes of firms-specific competitiveness, their equations, and sources of information. | |||
| Monetary information | Key ratio | Equation | Source of financial information |
| Ex-ante drivers of competitiveness | |||
| Material costs | Material use / Turnover | Material use / Turnover | Income statement |
| Employment costs | Salaries / Turnover | Salaries / Turnover | Income statement |
| Net value of investments | Investments / Turnover | (Change in intangible and tangible assets between consecutive years – depreciation) / Turnover | Balance sheet (assets), income statement (depreciation) |
| Value creation | Value-added / Turnover | = (Sales – Bought services – Material costs) / Turnover. | Income statement |
| Ex-post outcomes of competitiveness | |||
| Liquidity | Current Ratio | = (Inventories + Financial assets) / Short-term liabilities | Balance sheet |
| Solvency | Equity Ratio | = Adjusted total equity (i.e., shareholders’ equity) / (Adjusted balance sheet total – Advances received) | Balance sheet |
| Profitability (absolute) | Net Profit Ratio (%) | = (Net result / Turnover) × 100% | Income statement |
| Profitability (relative) | ROCE (%) | = (Net result + Financing costs + taxes 12 months) / Average. capital employed × 100% | Income statement and balance sheet |
| All the ex-ante variables are measured as euros and ex-post outcomes are ratios derived from calculations. The income statement captures the operational flow for the accounting period, while the balance sheet reflects the cumulative financial position, including retained earnings. | |||
In line with the study’s objectives, the statistical methods used were twofold. As the first phase of statistical analysis, companies’ sizes were scrutinized using the measures of company size (turnover, average number of personnel annually) and the assessment of competitiveness measured with liquidity (Current Ratio), solvency (Equity Ratio), and absolute (Net Profit Ratio %), and relative profitability (ROCE %). The results for companies’ sizes and competitiveness are presented in box plot figures illustrating ten accounting years (2012–2021) to assess companies’ financial performance variation within the industry.
As the second phase of statistical analysis, linear mixed model (LMM) regressions were employed. LMM is a useful approach for analyzing e.g., repeated measures or longitudinal data (Cnaan et al. 1997). In mixed effect models, group-level coefficients are often called random effects which account for variation between groups, whereas other coefficients are called fixed effects and account for within-group variation (Gelman and Hill 2006). In our models, fixed effects for Value-added, Materials, Salaries, Investments, and Year are used to account for the observed variation within companies over time. These variables control for known factors that influence company performance, allowing the isolation of their individual contributions to the outcome. To capture variation between companies, unique Company IDs are included as random effects with a random intercept. This approach assumes that company-specific factors (e.g., business model, leadership, or market position) vary randomly and independently across companies (Gelman and Hill 2006).
Normality, homoscedasticity, and independence are necessary assumptions for regression analysis (Berenson et al. 2002). In this study, the normality assumption was tested using Q–Q plots (Appendix 1) because there were too few annual observations for standard normality tests to be reliable. After the Q–Q plots analysis, natural logarithmic transformation was applied for Current Ratio (named Ln Current Ratio) due to a noticeable curvature in both models (sawmills and element producers). Residual diagnostics were assessed using residuals vs. fitted values plot (Appendix 2). The residuals appeared to be randomly scattered, with no clear patterns or systematic structure. This indicates that both the homoscedasticity and independence assumptions were met.
In regression analysis, it is important to assess potential multicollinearity, particularly when some variables based on accounting data may be closely related. Collinearity among predictors can lead to difficulties in interpreting the model, as the predictors share common variance in the response variable. This overlap makes it challenging to independently estimate the individual contribution of each predictor (Graham 2003). To assess for multicollinearity, variance inflation factor (VIF) values were calculated for all models (four for both sawmills and element producers). A typical cutoff threshold for dropping variables from models based on VIF values is between 5 and 10 (Craney and Surles 2002), with 10 suggesting strong collinearity (Quinn and Keough 2002). With all the VIF values in the study’s models being well below these thresholds (Table 2), no such problems arose.
| Table 2. Variance inflation factor (VIF) values for full models for sawmill and element producer. | |||||||||
| Sawmills | |||||||||
| Ln Current Ratio | Equity Ratio | Net Profit Ratio (%) | ROCE (%) | ||||||
| Salaries | 1.05 | 1.04 | 1.2 | 1.3 | |||||
| Materials | 1.6 | 1.54 | 1.81 | 1.76 | |||||
| Investments | 1.01 | 1.01 | 1.04 | 1.01 | |||||
| Value-added | 1.5 | 1.49 | 1.68 | 1.62 | |||||
| Element producers | |||||||||
| Ln Current Ratio | Equity Ratio | Net Profit Ratio (%) | ROCE (%) | ||||||
| Salaries | 3.13 | 3.12 | 2.68 | 1.09 | |||||
| Materials | 2.09 | 2.09 | 2.02 | 1.44 | |||||
| Investments | 3.24 | 3.27 | 3.05 | 1.07 | |||||
| Value-added | 1.63 | 1.63 | 1.76 | 1.44 | |||||
The dependent variable Yij represents the outcome of interest (e.g., financial performance measure: liquidity, solvency, relative profitability and absolute profitability) for the i-th observation (financial year) within the j-th company (individual company). For the fixed effects, the outcome is influenced by a global intercept β0, which represents the population-averaged parameter across all companies, Year (β1(Yearij)), which captures the effect of temporal trends over time, and other specific explanatory variables representing firm-specific characteristics (Materialsij, Salariesij, Value-Addedij, and Investmentsij). For the random effect, β0j represents the company-specific random intercepts. ∈ij is an error term reflecting the difference between the predicted and the observed values.

In our models, autocorrelation was corrected using the autoregressive AR(1) process. In addition, variance component parameters were estimated with the restricted maximum likelihood (REML) method. REML is often the preferred approach (Lin et al. 2013) and is found to be the most efficient slope estimator in linear mixed modeling (Alpargu and Dutilleul 2006). R programming language and the nlme package were used in the estimation.
4 Results
4.1 Development of financial performance in sawmills and wood element producers
Next, the results of the first phase of statistical analysis are shown. According to the results for turnover development, Fig. 3 shows distribution of annual turnovers for sawmills and wood element producers. The graph shows stable growth for both industries since 2014.
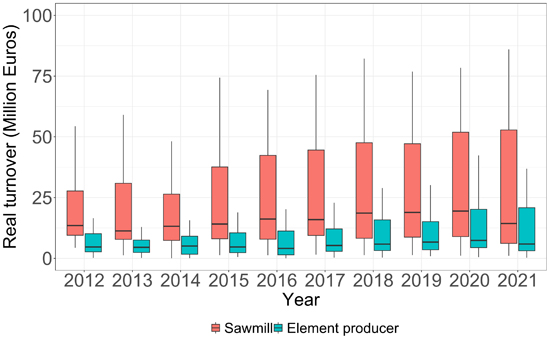
Fig. 3. Annual real turnover (million euros) of sawmills and wood element producers, adjusted to 2021 prices using producer price indices, products by activity, presented as industry-level distributions. The dataset includes 234 observations for wood element producers and 266 for sawmills in terms of turnover.
In contrast to the flat development of average personnel count observed in sawmills (median ranging from 24 to 28 employees on average per year), there has been a more significant increase in the number of personnel among wood element producers, especially in the upper quartiles after 2016 (15 in 2014 and 27 in 2021) (Fig. 4).
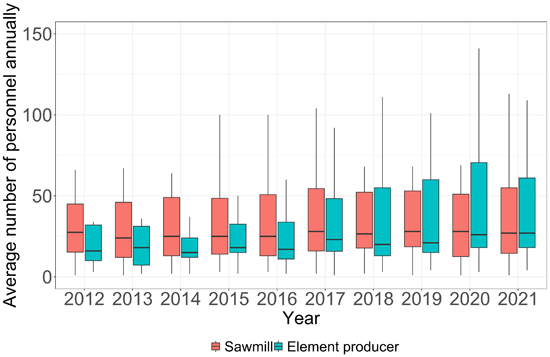
Fig. 4. Average number of personnel annually as full-time employment equivalents of sawmills and wood element producers, presented as industry-level distributions. The dataset includes 207 observations for wood element producers and 249 for sawmills in terms of personnel.
In the 2012–2021 period, liquidity describing companies’ ability to economically take care of their debts (Fig. 5) was at satisfactory levels for both industries (minimum and maximum median values for Current Ratio 1.1–1.8 and 1.0–1.4 respectively). However, the trends for two types of industries differed: While sawmills’ capability of taking care of their debts was slowly strengthening, the development was the opposite for wood element producers over the studied period. Yet, as the lower and upper quartiles show, there was considerable variation within industries during some years, (especially 2013 and 2018 for element producers and 2021 for sawmills). This indicates that industry-level medians only show the general development paths in businesses, and within industries, individual companies may have ended up with a success or failure, depending on their strategic choices, for example.
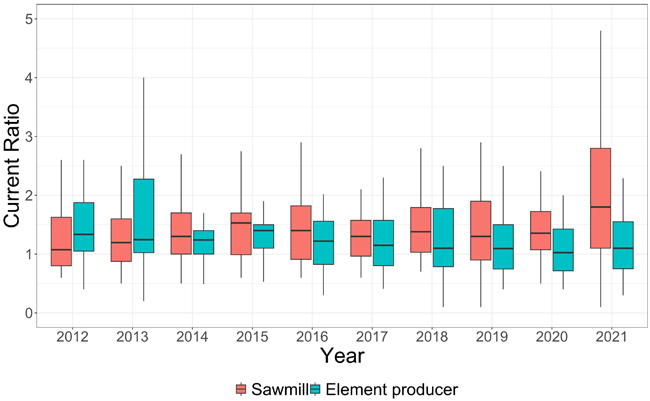
Fig. 5. Development of Current Ratio over ten accounting periods, grouped by industry. The figure represents the distribution of values for sawmills and wood element producers in each accounting period.
Regarding companies’ solvency, assessing their financial endurance to losses and ability to make long-term economic commitments was good and satisfactory for sawmills and between poor and satisfactory for element producers (minimum and maximum median values for Equity Ratio +25%–+43% and +18%–+39% respectively). In line with the development of liquidity, there was thus a strengthening trend for solvency of sawmills and weakening for wood element producers in the period of interest. Furthermore, similar to liquidity, there was considerable variation in the lower and upper quartiles for Equity Ratio, caused by company-specific differences in business success (Fig. 6).
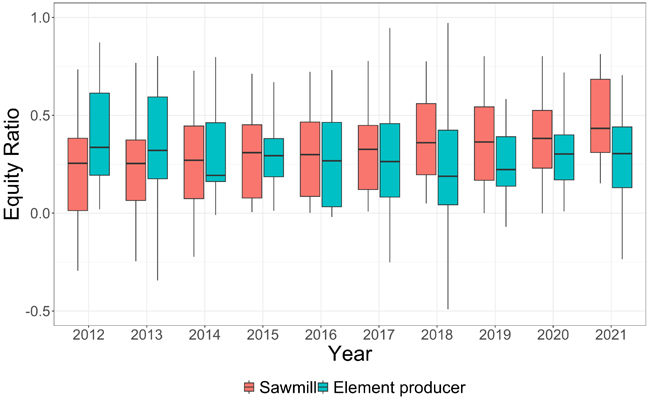
Fig. 6. Development of Equity Ratio over ten accounting periods, grouped by industry. The figure represents the distribution of values for sawmills and wood element producers in each accounting period.
To provide information about absolute (Net Profit Ratio (%)) and relative (ROCE (%)) profitability, industrial-level annual median values were scrutinized. It should be mentioned that since both Net Profit Ratio (%) and ROCE (%) are based on industry-level annual medians, including within-industry deviations, the annual figures in Figs. 7 and 8 must not be compared with each other as such: For example, it is possible for industry-level to have a negative Net Profit Ratio (%) and a positive ROCE (%) for a particular year (e.g., sawmills in 2012), while for an individual company, such an outcome would not be gained (i.e., the negative net result divided by capital employed would result in a negative ratio).
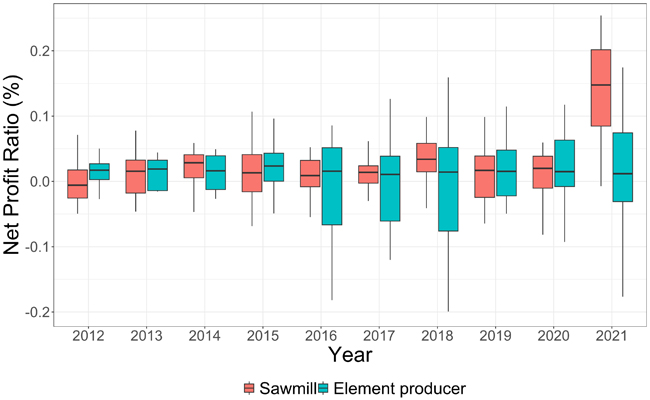
Fig. 7. Development of Net Profit Ratio (%) over ten accounting periods, grouped by industry. The figure represents the distribution of values for sawmills and wood element producers in each accounting period.
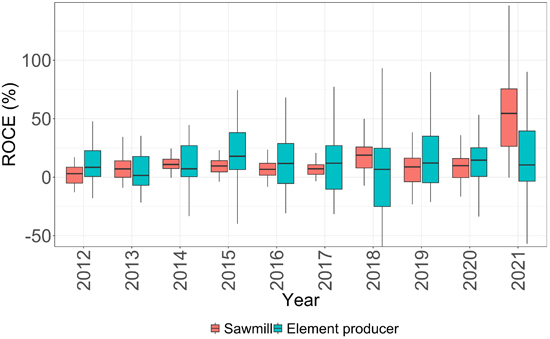
Fig. 8. Development of ROCE (%) over ten accounting periods, grouped by industry. The figure represents represent the distribution of values for sawmills and wood element producers in each accounting period.
According to the results for absolute profitability (Fig. 7), the industry-level median for Net Profit Ratio %, apart from 2021 (+14.8%) in sawmilling was rather stable (between –0.6% and +3.4%), as it was for wood element producers (between +0.7%–+2.4%), for the whole period. Regarding the success within industries, according to the upper quartiles, sawmilling and wood element production were more aligned, while for the lower quartiles, the fluctuation among wood element producers was more perceivable.
In the case of ROCE (%) (Fig. 8), the industrial-level annual medians for both sawmills and wood element producers were similar to Net Profit Ratio (%). As Fig. 8 illustrates, in sawmilling industry-level relative profitability (ROCE (%)), the median in the period of interest was always positive, and except for three years (2014: +11%, 2018: +18.9%, and 2021: 55%), below 10%. Contrastingly, in wood element production, the median was above 10% in seven years (2012: 14.5%; 2015: 15.3%; 2016: 11.1%; 2017: 11.7%; 2019: 11.9%; 2020: 13%; and 2021: 10.2%). In addition, compared with sawmills, the variation in quartiles for ROCE (%) were larger for wood element producers.
By years, Materials and Value-added in millions of euros were bigger for sawmills for the whole study period, while for Salaries, wood element producers overtook sawmills in 2017. Compared with other explanatory variables, most annual fluctuations in the average values between sawmills and wood element producers emerged in Investments, although 2017 seemed to be a turning point in the increase of investment activities for wood element producers, similar to the increase in Salaries.
Both growth in Salaries and Investments for wood element producers are in line with the information in Fig. 4 showing the annual averages for the number of employees in the two company types: Until 2016, both sawmills and wood element producers had about 30 workers per company, while after 2017, wood element producers employed about 50 workers on average. Based on the information about the increase in investment activities and recruitment of workforce, after 2016, there were therefore intentions in the wood element producing companies for growth through ex-ante plans related to the implementation of business models. Yet it is noteworthy that in the ex-post information, those efforts reflecting increases in wood element producers’ use of strategic resources (Materials, Salaries, Investments) were not realized in the monetary growth of businesses measured by turnover (Fig. 3) or value-added creation (Value-added) (Table 3).
| Table 3. Explanatory variable averages by year and industry. Standard deviations in parenthesis. The higher value of the two industries is in bold. Values in million euros. | ||||||||
| Materials | Salaries | Value-added | Investments | |||||
| Sawmills | Element producers | Sawmills | Element producers | Sawmills | Element producers | Sawmills | Element producers | |
| 2012 | 9 (6.8) | 2.9 (2.8) | 1.4 (1) | 1.1 (1.1) | 4.1 (3.2) | 1.2 (1.7) | 0.3 (0.4) | 0.4 (0.5) |
| 2013 | 8.6 (7.1) | 2.5 (2.5) | 1.3 (1) | 1 (1) | 4.1 (3.7) | 1.2 (1.3) | 0.4 (0.6) | 0.2 (0.2) |
| 2014 | 9.3 (7.7) | 2.3 (2.1) | 1.3 (0.9) | 0.8 (0.9) | 3.3 (3.4) | 1 (1) | 0.9 (1.3) | 0.2 (0.3) |
| 2015 | 10.2 (9) | 2.7 (2.3) | 1.5 (1.2) | 1.1 (1) | 4.3 (3.7) | 1.1 (1.7) | 3 (7.4) | 0.3 (0.3) |
| 2016 | 10.6 (9.1) | 2.7 (3.2) | 1.5 (1.1) | 1.1 (1.2) | 4.3 (3.9) | 1.3 (2.7) | 0.8 (1) | 0.7 (1.4) |
| 2017 | 11.2 (10) | 4 (5.7) | 1.5 (1.2) | 1.6 (2.3) | 4.8 (4.3) | 1.9 (2.9) | 0.7 (0.9) | 1.1 (2.9) |
| 2018 | 12.8 (11.6) | 5.2 (8) | 1.7 (1.2) | 2 (3) | 5.3 (4.5) | 2.5 (3.9) | 0.8 (1.2) | 0.9 (2.7) |
| 2019 | 12.8 (11.2) | 4.6 (5.9) | 1.7 (1.3) | 2 (2.5) | 5 (4.1) | 3.2 (5.6) | 0.6 (0.7) | 0.3 (0.4) |
| 2020 | 12.5 (11.2) | 4.2 (4.8) | 1.7 (1.3) | 1.9 (2.1) | 5 (4.2) | 3.1 (4.1) | 0.6 (0.7) | 0.7 (1.2) |
| 2021 | 15.8 (14.5) | 6.9 (7.7) | 1.9 (1.5) | 2.4 (2.7) | 10.3 (9.7) | 3.3 (5.3) | 1.1 (1.3) | 0.4 (0.5) |
| Average | 11.3 (9.8) | 3.8 (4.5) | 1.6 (1.2) | 1.5 (1.8) | 5.1 (4.5) | 2 (3) | 1 (1.5) | 0.5 (1) |
4.2 Firm-level longitudinal regression analysis explaining financial performance
For Current Ratio as a measure of liquidity, statistical evidence was gained for the negative impact of Salaries (coefficient –3.22) and Investments (–0.33) to decrease the liquidity of sawmills, and Materials (–0.7) of wood element producers respectively. Negative impacts of Salaries and Investments on Current Ratio in sawmills are multidimensional phenomena: In the short term, especially in technology-intensive industries, investments reduce the utilization rate of production capacity reflected in liquid assets (e.g., fewer final products in storage, own funds used for making investments). However, as Investments are commonly funded by debt financing, they do not necessarily have drastic effects on liquidity (see coefficient). At the same time, employment costs do not typically decrease proportionally with the short-term reductions in the capacity utilization rate. Instead, employees are commonly involved, for example, in the uptake of new machinery (i.e., salary costs are not reduced), which explains the magnitude of impacts of Salaries on liquidity. Regarding material costs, it must be kept in mind that they mainly comprise logs in sawmilling, while in wood element production, the materials are processed products (e.g., sawnwood or engineered wood products). For wood element producers, the results for Materials considerably (see coefficient) affecting wood element producers’ liquidity are explained by high proportional increases in their material costs from 2017 (Table 3), which coincided with an increase in investments with impacts on their liquid assets (similar dynamics with sawmills) (see also Fig. 7).
Equity Ratio is a measure of solvency, which means companies’ endurance for withstanding losses and capability of making long-term economic commitments. As shown in Table 4’s results, statistical evidence was received for Materials (coefficient –0.82) and Investments (–0.24) having negative effects on solvency in sawmilling. The strong negative impacts (see coefficient) of costs of Materials on solvency in sawmilling concretize how the profit generation capacity of business is affected by the expenses of roundwood, and how within one accounting period, they are directly transferred to the accumulation of shareholders’ equity through profits/losses on the balance sheet. In addition, for sawmills as technology-intensive businesses, Investments usually require debt taking, which decreases solvency. The results for solvency measured with Equity Ratio shows different dynamics for wood element producers. As Table 5 illustrates, in wood element production, Value-added (coefficient 0.24) and Investments (0.02) also had positive impacts on solvency. In the income statement, a Value-added item shows companies’ ability to cover salaries and other costs (e.g., loan amortizations and interest, taxes, and depreciations) that are transferred to the contribution of shareholders’ equity on the balance sheet. This is also connected with the slight positive effects (see coefficient) of Investments on solvency in wood element production: As wood element production is more labor-intensive (and less technology-intensive) than sawmilling, the monetary benefits of the uptake of investments in new machinery are also realized in the shorter term in the income statement as profit generation capacity. This is further transferred to the accumulation of shareholders’ equity on the balance sheet, and finally to solvency.
| Table 4. Parameter estimates from linear mixed-effects models for sawmills, based on four financial performance indicators: salaries, materials, investments, and value-added). Intercept terms are included for reference. | ||||
| Ln Current Ratio | Equity Ratio | Net Profit Ratio (%) | ROCE (%) | |
| Liquidity | Solvency | Profitability (absolute) | Profitability (relative) | |
| (Intercept) | 0.66 (0.32)** | 0.7 (0.27)*** | 0.32 (0.08)*** | 0.92 (0.24)*** |
| Salaries | –3.22 (1.15)*** | –0.84 (0.81) | –0.68 (0.16)*** | –1.46 (0.46)*** |
| Materials | 0.27 (0.43) | –0.82 (0.37)** | –0.39 (0.1)*** | –0.62 (0.32) |
| Investments | –0.33 (0.13)*** | –0.24 (0.08)*** | –0.02 (0.02) | –2.05 (0.32)*** |
| Value-added | –0.08 (0.26) | 0.27 (0.22) | 0.15 (0.08)** | 0.54 (0.24)** |
| N | 241 | 246 | 247 | 243 |
| R2 | 0.59 | 0.79 | 0.46 | 0.42 |
| Significance levels: **5%, ***1% level. | ||||
| Table 5. Parameter estimates from linear mixed-effects models for wood construction element producers, based on four financial performance indicators: salaries, materials, investments, and value-added. Intercept terms are included for reference. | ||||
| Ln Current Ratio | Equity Ratio | Net Profit Ratio (%) | ROCE (%) | |
| Liquidity | Solvency | Profitability (absolute) | Profitability (relative) | |
| (Intercept) | 0.35 (0.18) | 0.31 (0.11)*** | 0.35 (0.09)*** | 0.74 (0.22)*** |
| Salaries | 0.01 (0.22) | –0.08 (0.14) | –0.89 (0.1)*** | –0.75 (0.32)** |
| Materials | –0.7 (0.26)*** | –0.23 (0.16) | –0.49 (0.12)*** | –1.01 (0.34)*** |
| Investments | 0.01 (0.02) | 0.02 (0.01)** | –0.11 (0.01)*** | –0.1 (0.33) |
| Value-added | –0.03 (0.12) | 0.24 (0.08)*** | 0.19 (0.07)** | 0.12 (0.16) |
| N | 210 | 210 | 209 | 196 |
| R2 | 0.47 | 0.33 | 0.9 | 0.42 |
| Significance levels: **5%, ***1% level. | ||||
In the analysis, profitability was assessed using two measures, Net Profit Ratio (%) (i.e., absolute profitability based on income statement information), and ROCE (%) (i.e., relative profitability based on both income statement and balance sheet information). Thus, while Net Profit Ratio (%) does not consider the assets needed in production (e.g., machinery) or liabilities tied to businesses, ROCE (%) addresses such items with views on absolute profitability. In addition, compared to dependent variables on liquidity (Current Ratio) and solvency (Equity Ratio) ratios based merely on balance sheet information, Net Profit Ratio (%) and ROCE (%) are different types of measures: The first describes short-term outcomes in business practices (Net Profit Ratio (%)); the second depicts the dynamics between short-term outcomes (i.e., the difference between revenues and expenses) and long-term strategic commitments (i.e., assets and liabilities) in businesses (as reflected in ROCE (%)).
In the analysis, statistical evidence was gained that sawmills and wood element producers faced similar impacts of Salaries, Materials, and Value-Added on their Net Profit Ratio (%): Salaries and Materials were found to affect companies’ absolute profitability negatively, and Value-added positively. In addition, in terms of the magnitude of impacts, the results were similar between businesses (i.e., the coefficients for sawmills were –0.68, –0.39, and 0.15, and for element producers –0.89, –0.49, and 0.19 respectively). Furthermore, according to the modeling results, Investments were found to have negative impacts on Net Profit Ratio (%) in wood element production, while such a pattern was not evident for sawmills. In general, the results for Net Profit Ratio (%) concretize the importance of the management of all types of production costs (i.e., Materials and Salaries) and value creation capability (i.e., Value-added) in both types of companies within an accounting period. However, regarding the Net Profit Ratio model, the endogeneity bias cannot be fully ruled out using the methodology chosen because turnover influences both Value-added and the Net Profit Ratio (as one of the reviewers pointed out). This results in a more cautious interpretation of these results.
Compared with the results for Net Profit Ratio (%), in the case of ROCE (%), the results between sawmills and wood element producers were quite different, and only the statistical evidence for the negative effects of Salaries on relative profitability were similar between two businesses (coefficient for sawmills, –1.46 and for element producers, –0.75). In addition, Investments showed negative (coefficient –2.05) impacts for sawmills, and Value-added positive (0.54), and Materials negative effects (–1.01) on wood element producers’ ROCE (%). In all, the impact of salaries on relative profitability is caused by both variable costs accruing proportionally in relation to the use of capacity (i.e., variable costs) and costs accruing, for example, in administration and when investing in new machinery uptake (i.e., fixed costs), which together contribute to net profits in companies. For sawmills, the result for Investments is in line with other key ratios on companies’ financial performance: Although large investments enable the uptake of new technologies and renewal of businesses, they also have long-term impacts on finance through an increase in debt taking and downtimes in the use of production capacity, for example. In wood element production, the impacts of Materials on ROCE (%) are caused by dynamics between production costs (i.e., the materials used in processing) and assets (i.e., intermediate and final product inventories). For example, if the prices of intermediate products proportionally increase more than final products, and the value of inventories simultaneously decreases, relative profitability is reduced.
The coefficient of determination (R2) explains how much of the variation in the dependent variable is predictable from independent variables (Hössjer 2008). In our models for the sawmills (Table 4), solvency shows the highest explanatory power (0.79), while profitability and liquidity have lower values (Net Profit Ratio (%) 0.46, ROCE (%) 0.42, and Current Ratio 0.59). For the element producers, the Net Profit Ratio (%) model has the highest R2 at 0.9, showing that the model explains profitability well. In contrast, the Equity Ratio model has the lowest R2 at 0.33, indicating weaker explanatory power. The Current Ratio and ROCE (%) models have R2 values of 0.47 and 0.42 respectively, showing moderate explanatory power.
5 Discussion and conclusions
In this research, we studied the financial performance of Finnish sawmills and wood element producers operating in the mechanical forest industries to assess their competitiveness. As with the competitiveness of any company in any industry, the variation in the financial performance of firms is affected by industry-level differences (e.g., raw materials and technologies used, product offerings) and firm-specific differences within those industries (e.g., formulation and implementation of business models based on internal strategic capabilities and resources) (Porter 1985; Hawawini et al. 2003).
According to the scientific literature (Korhonen and Niemelä 2005; Brege et al. 2010; Makkonen and Sundqvist-Andberg 2017) and public discussion in Finland, the opportunities for forest industry companies to enhance competitiveness are especially related to increasing the value-added of products. Using comparative firm-level financial statement information about sawmills and wood element producers therefore forms an interesting setup for the study. To facilitate an in-depth analysis of industry-level and within firm financial performance, a two-phased statistical analysis was employed as a methodology of the study.
First, graphical illustrations of the financial performance measures were generated to describe the development in industry-level competitiveness and evaluate the results in relation to Hypothesis 1. Second, linear mixed regression models were created for firm-level panel data based on 2012–2021 to provide information about Hypotheses 2, 3, and 4. As a result of the modeling analysis, information was gained about the impacts of materials, salaries, value-added, and investments that as explanatory variables represented the impacts of sawmills’ and wood element producers’ firm-specific ex-ante business model choices on ex-post financial performance. Table 6 summarizes the outcomes and rationale of the results of the study in connection with Hypotheses 1–4.
| Table 6. Summary of hypotheses’ outcomes and their rationale. | ||
| Hypothesis | Outcome | Rationale |
| H1: Profitability ratios show higher variation for wood element producers operating in an emerging industry than for sawmills. | Not rejected | According to Figures 7 & 8, there is more variation in profitability measures of element producers than sawmills |
| H2: Material and salary costs have a negative impact on the financial performance of both sawmills and wood element producers. | Not rejected | According to Tables 4 & 5, only negative impacts were found for Salaries and Materials on both industries’ competitiveness measures |
| H3: Investment costs have a negative impact on financial performance of both sawmills and wood element producers. | Inconclusive | According to Tables 4 & 5, Investments show a varying effect on industries’ Equity Ratio (negative for sawmills, positive for element producers), as well as a negative effect on sawmills’ Current Ratio and ROCE (%), and a negative effect on element producers’ Net Profit Ratio (%) |
| H4: Value-added has a positive impact on financial performance of both sawmills and wood element producers. | Not rejected | According to Tables 4 & 5, Value-added has a positive effect on sawmills’ Net Profit Ratio (%) and ROCE (%), and element producers’ Equity Ratio and Net Profit Ratio (%) |
According to the results, Hypothesis 1: “Profitability ratios show more annual variation for wood element producers than for sawmills,” is not rejected. This is strongly connected with the study’s theoretical framework, which suggests that wood element producers operating in an emerging industry have more variation in their ex-ante business model formulation and implementation than sawn wood producers. In the mature sawmilling industry, sawlogs serve as the primary raw material (Väätäinen et al. 2021), whereas element producers have a wider pool of ex-ante choices to begin with, as they can use sawnwood or different engineered wood products (e.g., LVL, CLT, or glulam) (Heräjärvi et al. 2004). Wood element producers may also have higher variability in relation to their roles in connection with construction industries (e.g., material supplier, subcontractor, main contractor) (Brege et al. 2014; Pelli and Lähtinen 2020). Furthermore, for example, a wood element manufacturer can choose its product offering (e.g., non-volumetric or volumetric elements) to distinguish against competitors (e.g., Wood From Finland 2024).
Furthermore, in connection with Hypothesis 1, the greater variance in companies’ profitability may indicate that the industry is still emerging and affected by unestablished operational practices. In relation to industry maturity, the results reveal that wood element producers are more labor-intensive, as more human resources are required to complete their operational tasks than with sawmills. This is reasonable given the sawmill industry’s maturity and its orientation toward developing automized production capability (Lähtinen and Toppinen 2008; Brege et al. 2010; Stendahl et al. 2013). Compared with sawmills, for wood element producers with customers in the construction industry, involvement in tendering processes, discussions with architects, and continuous development activities with customers also require working time (Makkonen and Sundqvist-Andberg 2017). In all, this study provides sufficient evidence to state that the wood element production industry has higher variance in companies’ profitability, but more research is needed to assess more precisely what the main ex-ante strategic choices (e.g., product offering) have been that have enhanced and hindered wood element manufacturers’ profitability.
Regarding industry-level development also linked to the findings for Hypothesis 1, the rates of liquidity and solvency show signs of opposite development between the two industries. According to both measures, the pathways were the same during the period of interest: an upward trend for sawmills and a downward trend for element producers. From our theoretical perspective, a possible explanation for this is that the emerging nature of the wood construction element industry means that companies are partially accelerating growth and leveraging opportunities in debt (Lähtinen and Toppinen (2008), on the dynamics between growth and debt financing). However, other factors are also involved, including structural change in housing markets with a declining construction of detached houses (Dangel 2016), a segment in Finland where wood has typically had a major market share (Hurmekoski et al. 2015).
The findings on Hypotheses 2, 3, and 4 are based on the results from the panel data models. Largely following the data characteristics (financial statements), the models share great similarities between the two types of businesses (i.e., sawmilling and wood element producers): Variable costs (Material, Salaries) were found to have a negative impact on both industries’ financial ratios employed to assess the overall competitiveness; for Value-added, statistical evidence for the positive effects on firm-level competitiveness was gained. Yet the results also show that value creation alone is insufficient for companies’ competitiveness, as a company must be sufficiently profitable in the long term to make monetary compensations for the capital invested (i.e., loan interest and amortizations for creditors, and dividends for shareholders), as was concretized in the results for liquidity, solvency, and profitability for both sawmills and wood element producers. In addition to the similarities between the two types of businesses, the results of this study proved to be consistent with the findings of Lähtinen and Toppinen (2008), who also used financial statements as data within a regression analysis.
Furthermore, these results, which prove the information about Hypotheses 2, 3, and 4, demonstrate that production activities are a core feature of both sawmilling and wood element manufacturing rather than having a greater emphasis on developing services or software, for example. This is in line with the findings of Makkonen (2018), although for both sawmills and wood element producers, digitalization could open new business opportunities through new value creation for construction industry customers, for example. Hence, neither Hypothesis 2 nor 4 could be rejected. Hypothesis 3, regarding Investments’ impact on the two industries, resulted in an inconclusive outcome. Although the effect was negative on performance indicators in most cases, there was also a slightly positive impact on element producers’ solvency. This inconclusive evidence on the linkages between Investments and competitiveness measures may be caused by neglecting the dynamic effects caused by the fact that the larger the investment, the more time from initialization to full uptake of production capacity is usually taken. Similarly, assessing the impact of investments is also challenging in connection with the use of human resources: Although the uptake of new production capacity builds new expertise within a company, such use of human resources is reported in accounting as salary costs in the income statement, not investments in intangible assets on the balance sheet (concerning the dynamics of investments and salaries, see also Lähtinen and Toppinen 2008).
Other limitations related to the interpretation of the results include at least the selected time frame, which always includes period-specific events and external influences. For example, rapid changes in financial performance are possible in industries prone to economic fluctuations, due largely to increased global market development. There are differences between types of industries, and in relation to economic fluctuations, companies’ ability to absorb market shocks depends on the end-use market. This is an issue between domestic and international markets, as a broader market scope enables risk diversification.
In addition, while ex-post assessments of competitiveness based on financial performance offer valuable information about the consequences of ex-ante strategic decisions made within individual companies, they do not validate the exact causes of those outcomes. In all, the competitiveness of an individual company is affected both by the market conditions and the adaptability of the particular company to the external circumstances (Caves 1980; Porter 1985). Thus, both the ex-ante strategic decisions within the industry and an individual company affect the ability of companies to withstand shocks. For example, a focus on public or infrastructure construction may be affected differently by different business cycles compared with residential construction.
The studied two processing stages consist of a selected sample of companies according to the study’s objectives and data availability, and the results therefore cannot be generalized without discretion. In addition, while information about industrial-level strategies, for example, is related to investments, and product portfolios are quite openly available, detailed information about firm-specific strategies is much more difficult to acquire. In practice, it requires the collection of detailed firm-level data on the constituents of the business models and strategies (Lähtinen 2009). The authors therefore note that further research is needed to better comprehend the industry dynamics and linkages between the ex-ante strategic decisions and ex-post financial outcomes of the companies’ competitiveness.
The need for value creation and business model development has been emphasized as an opportunity for business renewal and enhancement of competitiveness in the mechanical wood processing industries (Makkonen and Sundqvist-Andberg 2017; Pelli and Lähtinen 2020; Stehn et al. 2021). By using exact firm-level financial statement information, our results showed that competitiveness is not straightforward for the identification of sources. Instead, it requires an understanding of both the dynamics within and between the sawmilling and wood element production industries, but also their decision regarding upstream (i.e., raw material from forests) and downstream (i.e., construction companies) activities.
For sawmills and wood element producers, involvement in the circular bioeconomy not only concerns their own businesses but a change in the logic of the entire construction industry. To ensure viability, mechanical wood industry businesses must maintain their liquidity, solvency, and profitability not only from the perspective of industries but at the level of individual businesses. For example, in relation to this, the observed high variability in profitability measures among wood element producers, alongside future expectations in the growth of wooden construction, creates an interesting aspect for a more detailed study for better understanding managerial decisions. Finally, in line with a systematic review of the drivers of competitiveness by Korhonen et al. (2017), there is an increasing need to study the viability of high-value, low natural-resource-intensive niche strategies to align with national and international bioeconomy agendas, with the current focus on high resource efficiency and material circularity. However, the method applicable to this would call for more qualitative and case-based approaches than those undertaken here.
Funding
The authors thank the funders for enabling implementation of this study, which was done with funding from the Strategic Research Council affiliated with the Academy of Finland project (grant number 335245) “Citizens as agents of change in decarbonizing suburban and rural housing” (DECARBON-HOME), and Business Finland (grant number: 8491/31/2022) “Resilient urban building and housing solutions from Finnish Front runner Firms – Pathways for Global Exports” (FoREfront) and the authors’ own organizations, i.e., Natural Resources Institute Finland (Luke) and the University of Helsinki.
Authors’ contributions
Atte Koskivaara: Data collection, wrangling, and analysis, idea of the study, selection of the theoretical framework, formulation of the research questions, design and implementation of the analysis, interpretation of the results, scientific writing of the manuscript, and revision of the article.
Katja Lähtinen: Formulation of the research questions, design and implementation of the analysis, interpretation of the results, scientific writing of the manuscript, and revision of the article.
Anne Toppinen: Formulation of the research questions, interpretation of the results, scientific writing of the manuscript and and revision of the article.
Declaration of openness of research materials and data
The data were acquired from a private provider, Alma Talent Ltd, and are confidential and thus unavailable. All calculus has been implemented using R-software and illustrations with Microsoft office and opened in detail in the text. The metadata for this study are available at https://doi.org/10.5281/zenodo.11504653.
References
Alpargu G, Dutilleul P (2006) Stepwise regression in mixed quantitative linear models with autocorrelated errors. Commun Stat Simul Comput 35: 79–104. https://doi.org/10.1080/03610910500416082.
Antikainen R, Dalhammar C, Hildén M, Judl J, Jääskeläinen T, Kautto P, Koskela S, Kuisma M, Lazarevic D, Mäenpää I, Ovaska J-P, Peck P, Rodhe H, Temmes A, Thidell Å (2017) Renewal of forest based manufacturing towards a sustainable circular bioeconomy. Reports of the Finnish Environment Institute 13. http://hdl.handle.net/10138/186080.
Barr PS (1998) Adapting to unfamiliar environmental events: a look at the evolution of interpretation and its role in strategic change. Organ Sci 9: 644–669. https://doi.org/10.1287/orsc.9.6.644.
Berenson ML, Levine DM, Krehbiel TC (2002) Basic business statistics: concepts and applications. Prentice Hall. ISBN 978-0130903006.
Bioökonomierat (2015) Bioeconomy policy (part II): synopsis of national strategies around the world. German Bioeconomy Council, Berlin.
Brege S, Nord T, Sjöström R, Stehn L (2010) Value-added strategies and forward integration in the Swedish sawmill industry: positioning and profitability in the high-volume segment. Scand J For Res 25: 482–493. https://doi.org/10.1080/02827581.2010.496738.
Brege S, Stehn L, Nord T (2014) Business models in industrialized building of multi-storey houses. Constr Manag Econ 32: 208–226. https://doi.org/10.1080/01446193.2013.840734.
Briciu S (2008) Variable and fixed costs in company management. Ann Univ Apulensis Ser Econ 1: 1–14. https://doi.org/10.29302/oeconomica.2008.10.1.14.
Bumgardner M, Johnson S, Luppold W, Maplesden F, Pepke E (2013) Markets and market forces for lumber. In: Hansen E, Panwar R, Vlovsky R (eds) The global forest sector: changes, practices, and prospects. CRC Press, pp 41–76. https://doi.org/10.1201/b16186.
Bysheim K, Nyrud AQ (2009) Using a predictive model to analyze architects’ intentions of using wood in urban construction. For Prod J 59: 65–74.
Chikán A, Czakó E, Kiss-Dobronyi B, Losonci D (2022) Firm competitiveness: a general model and a manufacturing application. Int J Prod Econ 243, article id 108316. https://doi.org/10.1016/j.ijpe.2021.108316.
Cnaan A, Laird NM, Slasor P (1997) Using the general linear mixed model to analyse unbalanced repeated measures and longitudinal data. Stat Med 16: 2349–2380. https://doi.org/10.1002/(SICI)1097-0258(19971030)16:20%3C2349::AID-SIM667%3E3.0.CO;2-E.
Cohen DH, Kozak RA (2002) Research and technology: market-driven innovation in the twenty-first century. For Chron 78: 108–111. https://doi.org/10.5558/tfc78108-1.
Committee of Corporate Analysis (2011) The guide to the analysis of financial statements of Finnish companies. Gaudeamus, Helsinki University Press, Helsinki. ISBN 978-952-495-242-2.
Committee of Corporate Analysis (2017) Yritystutkimuksen tilinpäätösanalyysi. Gaudeamus, Helsinki University Press, Helsinki. ISBN 978-952-495-951-3.
Conner KR (1991) A historical comparison of resource-based theory and five schools of thought within industrial organization economics: do we have a new theory of the firm? J Manag 17: 121–154. https://doi.org/10.1177/014920639101700109.
Craney TA, Surles JG (2002) Model-dependent variance inflation factor cutoff values. Qual Eng 14: 391–403. https://doi.org/10.1081/QEN-120001878.
D’Amato D, Korhonen J (2021) Integrating the green economy, circular economy and bioeconomy in a strategic sustainability framework. Ecol Econ 188, article id 107143. https://doi.org/10.1016/j.ecolecon.2021.107143.
Dangel U (2016) Potential and outlook. In: Turning point in timber construction: a new economy, 1st edition. Walter de Gruyter GmbH, Basel/Berlin/Boston, pp 153–192. https://doi.org/10.1515/9783035608632.
De Franco G, Kothari S, Verdi R (2011) The benefits of financial statement comparability. J Account Res 49: 895–931. https://doi.org/10.1111/j.1475-679X.2011.00415.x.
Dixon RL (1940) Fixed and variable costs. Account Rev 15: 218–222.
European Commission (2018) The European Green Deal. Brussels.
European Commission (2019) A sustainable bioeconomy for Europe: strengthening the connection between economy, society and the environment. Brussels. https://doi.org/10.2777/792130.
Falciola J, Jansen M, Rollo V (2020) Defining firm competitiveness: a multidimensional framework. World Dev 129, article id 104857. https://doi.org/10.1016/j.worlddev.2019.104857.
Flachenecker F (2018) The causal impact of material productivity on macroeconomic competitiveness in the European Union. Environ Econ Policy Stud 20: 17–46. https://doi.org/10.1007/s10018-016-0180-3.
Gelman A, Hill J (2006) Data analysis using regression and multilevel/hierarchical models. Cambridge University Press, Cambridge. https://doi.org/10.1017/CBO9780511790942
Gil JM, Montañés A, Vásquez-González B (2023) Are prices converging in the global sawnwood market? For Policy Econ 155, article id 102998. https://doi.org/10.1016/j.forpol.2023.102998.
Graham MH (2003) Confronting multicollinearity in ecological multiple regression. Ecology 84: 2809–2815. https://doi.org/10.1890/02-3114.
Grant RM (1991) The resource-based theory of competitive advantage: implications for strategy formulation. Calif Manag Rev 33: 114–135. https://doi.org/10.2307/41166664.
Hansen E, Dibrell C, Down J (2006) Market orientation, strategy, and performance in the primary forest industry. For Sci 52: 209–220. https://doi.org/10.1093/forestscience/52.3.209.
Hansen E, Juslin H, Knowles C (2007) Innovativeness in the global forest products industry: exploring new insights. Can J For Res 37: 1324–1335. https://doi.org/10.1139/X06-323.
Hansen E, Rasmussen CC, Nybakk E (2017) Recessionary period activities in forest sector firms: impacts on innovativeness. J For Econ 28: 80–86. https://doi.org/10.1016/j.jfe.2017.06.004.
Hawawini G, Subramanian V, Verdin P (2003) Is performance driven by industry‐or firm‐specific factors? A new look at the evidence. Strateg Manag J 24: 1–16. https://doi.org/10.1002/smj.278.
Heräjärvi H, Jouhiaho A, Tammiruusu V, Verkasalo E (2004) Small-diameter Scots pine and birch timber as raw materials for engineered wood products. Int J Forest Eng 15: 23–34. https://doi.org/10.1080/14942119.2004.10702494.
Hössjer O (2008) On the coefficient of determination for mixed regression models. J Stat Plan Inference 138: 3022–3038. https://doi.org/10.1016/j.jspi.2007.11.010.
Hurmekoski E, Hetemäki L (2013) Studying the future of the forest sector: review and implications for long-term outlook studies. For Policy Econ 34: 17–29. https://doi.org/10.1016/j.forpol.2013.05.005.
Hurmekoski E, Jonsson R, Nord T (2015) Context, drivers, and future potential for wood-frame multi-story construction in Europe. Technol Forecast Soc Change 99: 181–196. https://doi.org/10.1016/j.techfore.2015.07.002.
Hurmekoski E, Pykäläinen J, Hetemäki L (2018) Long-term targets for green building: explorative Delphi backcasting study on wood-frame multi-story construction in Finland. J Clean Prod 172: 3644–3654. https://doi.org/10.1016/j.jclepro.2017.08.031.
Hurmekoski E, Hetemäki L, Jänis J (2022) Outlook for the forest-based bioeconomy. In: Hetemäki L, Kangas J, Peltola H (eds) Forest bioeconomy and climate change. Springer International Publishing, Cham, pp 55–89. https://doi.org/10.1007/978-3-030-99206-4_4.
Jussila J, Lähtinen K (2020) Effects of institutional practices on delays in construction – views of Finnish homebuilder families. Hous Stud 35: 1167–1193. https://doi.org/10.1080/02673037.2019.1651831.
Jussila J, Nagy E, Lähtinen K, Hurmekoski E, Häyrinen L, Mark-Herbert C, Roos A, Toivonen R, Toppinen A (2022) Wooden multi-storey construction market development – systematic literature review within a global scope with insights on the Nordic region. Silva Fenn 56, article id 10609. https://doi.org/10.14214/sf.10609.
Korhonen J, Hurmekoski E, Hansen E, Toppinen A (2017) Firm-level competitiveness in the forest industries: review and research implications in the context of bioeconomy strategies. Can J For Res 48: 141–152. https://doi.org/10.1139/cjfr-2017-0219.
Korhonen S, Niemelä JS (2005) A conceptual analysis of capabilities: identifying and classifying sources of competitive advantage in the wood industry. The Finnish Journal of Business Economics 54: 11–47.
Koskivaara A, Lähtinen K (2023) Land-use planning in municipalities as a driver for sustainable residential building in Finland: a regional innovation system approach. J Sustain Res 5, article id e230006. https://doi.org/10.20900/jsr20230006.
Lähtinen K (2007) Linking resource-based view with business economics of woodworking industry: earlier findings and future insights. Silva Fenn 41: 149–165. https://doi.org/10.14214/sf.312.
Lähtinen K (2009) Assessing the resource usage decisions and financial performance in Finnish sawmills within the resource-based view framework. Diss For 89. https://doi.org/10.14214/df.89.
Lähtinen K, Häyrinen L (2022) Servitisation and the future of business development – insights from the forest industry. In: D’Amato D, Toppinen A, Kozak R (eds) The role of business in global sustainability transformations. Routledge, pp 96–115. https://doi.org/10.4324/9781003003588-9.
Lähtinen K, Toppinen A (2008) Financial performance in Finnish large- and medium-sized sawmills: the effects of value-added creation and cost-efficiency seeking. J For Econ 14: 289–305. https://doi.org/10.1016/j.jfe.2008.02.001.
Lähtinen K, Häyrinen L, Jussila J, Harju C, Toppinen A, Toivonen R (2023) Branding wooden multi-storey construction – real-estate agents as gatekeepers for enhancing consumer value in housing. J For Econ 38: 37–76. https://doi.org/10.1561/112.00000538.
Lam F, Prion H (2003) Engineered wood products for structural purposes. In: Thelandersson S, Larsen HJ (eds) Timber engineering. John Wiley & Sons Inc, pp 15–22. ISBN 978-0-470-84469-4.
Lazarevic D, Kautto P, Antikainen R (2020) Finland’s wood-frame multi-storey construction innovation system: analysing motors of creative destruction. For Policy Econ 110, article id 101861. https://doi.org/10.1016/j.forpol.2019.01.006.
Lin B, Pang Z, Jiang J (2013) Fixed and random effects selection by REML and pathwise coordinate optimization. J Comput Graph Stat 22: 341–355. https://doi.org/10.1080/10618600.2012.681219.
Makkonen M (2018) Stakeholder perspectives on the business potential of digitalization in the wood products industry. BioBus 3: 63–80. https://doi.org/10.22382/bpb-2018-006.
Makkonen M, Sundqvist-Andberg H (2017) Customer value creation in B2B relationships: sawn timber value chain perspective. J For Econ 29: 94–106. https://doi.org/10.1016/j.jfe.2017.08.007.
Marshall A(1972) Principles of economics, 8th edition. Macmillan Press Ltd, London.
Martin H, Grundel I, Dahlström M (2023) Reconsidering actor roles in regional innovation systems: transformative industrial change in the forest-based bioeconomy. Reg Stud 57: 1636–1648. https://doi.org/10.1080/00343404.2022.2151581.
Mickwitz P, Hildén M, Seppälä J, Melanen M (2011) Sustainability through system transformation: lessons from Finnish efforts. J Clean Prod 19: 1779–1787. https://doi.org/10.1016/j.jclepro.2011.07.011.
Nadim W, Goulding JS (2011) Offsite production: a model for building barriers. Eng Constr Archit Manag 18: 82–101. https://doi.org/10.1108/09699981111098702.
Näyhä A, Pelli P, Hetemäki L (2015) Services in the forest-based sector – unexplored futures. Foresight 17: 378–398. https://doi.org/10.1108/FS-08-2013-0034.
Nybakk E, Crespell P, Hansen E (2011) Climate for innovation and innovation strategy as drivers for success in the wood industry: moderation effects of firm size, industry sector, and country of operation. Silva Fenn 45: 415–430. https://doi.org/10.14214/sf.110.
Pätäri S, Tuppura A, Toppinen A, Korhonen J (2016) Global sustainability megaforces in shaping the future of the European pulp and paper industry towards a bioeconomy. For Policy Econ 66: 38–46. https://doi.org/10.1016/j.forpol.2015.10.009.
Pelli P, Lähtinen K (2020) Servitization and bioeconomy transitions: insights on prefabricated wooden elements supply networks. J Clean Prod 244, article id 118711. https://doi.org/10.1016/j.jclepro.2019.118711.
Porter ME (1998) The competitive advantage of nations. The Free Press, New York. ISBN 978-1-45165-149-2.
Porter ME, Christensen CR (1999) Microeconomic competitiveness: findings from the 1999 executive survey. In: The Global Competitiveness Report, World Economic Forum, Geneva
Quinn GP, Keough MJ (2002) Experimental design and data analysis for biologists. Cambridge University Press, Cambridge. https://doi.org/10.1017/CBO9780511806384.
Sathre R, Gustavsson L (2007) Effects of energy and carbon taxes on building material competitiveness. Energy Build 39: 488–494. https://doi.org/10.1016/j.enbuild.2006.09.005.
Saunila M, Ukko J (2012) A conceptual framework for the measurement of innovation capability and its effects. Balt J Manag 7: 355–375. https://doi.org/10.1108/17465261211272139.
Schauerte T (2010) Wooden house construction in Scandinavia – a model for Europe. In: Internationales Holzbau-Forum (IHF 2010): Aus der Praxis – Für die Praxis. CH-Biel, Eberl Print GmbH, pp 1–10. http://urn.kb.se/resolve?urn=urn:nbn:se:lnu:diva-10157.
Shmulsky R, Jones D (2011) Front matter. In: Shmulsky R, Jones PD (eds) Forest products and wood science an introduction. https://doi.org/10.1002/9780470960035.fmatter.
Siggel E (2006) International competitiveness and comparative advantage: a survey and a proposal for measurement. J Ind Compet Trade 6: 137–159. https://doi.org/10.1007/s10842-006-8430-x.
Simmie J (2004) Innovation and clustering in the globalised international economy. Urban Stud 41: 1095–1112. https://doi.org/10.1080/00420980410001675823.
Sipiläinen I (2020) Katsaus teolliseen puurakentamiseen − puuelementit. [An overview of industrial wood construction − wood elements]. Publications of the Ministry of Economic Affairs and Employment 2020/16. http://www.urn.fi/URN:ISBN:978-952-327-510-2.
Spanos YE, Lioukas S (2001) An examination into the causal logic of rent generation: contrasting Porter’s competitive strategy framework and the resource-based perspective. Strateg Manag J 22: 907–934. https://doi.org/10.1002/smj.174.
Stehn L, Engström S, Uusitalo P, Lavikka R (2021) Understanding industrialised house building as a company’s dynamic capabilities. Constr Innov 21: 5–21. https://doi.org/10.1108/CI-09-2019-0086.
Stendahl M, McCluskey D, Eliasson L (2013) Integrated production of semi-finished components in sawmills, part I: external interactions. Wood Mater Sci Eng 8: 253–270. https://doi.org/10.1080/17480272.2013.834965.
The Finnish Sawmills Association (2025) Sawmill industry. https://sahateollisuus.com/en/industry/.
Tiitu M, Naess P, Ristimäki M (2021) The urban density in two Nordic capitals – comparing the development of Oslo and Helsinki metropolitan regions. Eur Plan Stud 29: 1092–1112. https://doi.org/10.1080/09654313.2020.1817865.
Toppinen A, Lähtinen K, Holopainen J (2016) On corporate responsibility. In: Panwar R, Hansen E, Kozak R (eds) Forests, business and sustainability. Routledge, New York, pp 70–90. ISBN 978-1-138-77929-7.
Toppinen A, Miilumäki N, Vihemäki H, Toivonen R, Lähtinen K (2019a) Collaboration and shared logic for creating value-added in three Finnish wooden multi-storey building projects. Wood Mater Sci Eng 14: 269–279. https://doi.org/10.1080/17480272.2019.1653365.
Toppinen A, Sauru M, Pätäri S, Lähtinen K, Tuppura A (2019b) Internal and external factors of competitiveness shaping the future of wooden multi-storey construction. Constr Manag Econ 37: 201–216. https://doi.org/10.1080/01446193.2018.1513162.
Väätäinen K, Anttila P, Eliasson L, Enström J, Laitila J, Prinz R, Routa J (2021) Roundwood and biomass logistics in Finland and Sweden. Croat J For Eng 42: 39–61. https://doi.org/10.5552/crojfe.2021.803.
Weber KM, Schaper-Rinkel P (2017) European sectoral innovation foresight: identifying emerging cross-sectoral patterns and policy issues. Technological Forecasting and Social Change 115: 240–250. https://doi.org/10.1016/j.techfore.2016.09.007.
Weiss G, Ludvig A, Živojinović I (2020) Four decades of innovation research in forestry and the forest-based industries – a systematic literature review. For Policy Econ 120, article id 102288. https://doi.org/10.1016/j.forpol.2020.102288.
Wood From Finland (2024) Finnish timber guide 2024. https://woodfromfinland.fi/timber-guide/.
Total of 84 references.
