Brahim Meskour  ,
Adnane Labbaci,
Moussa Ait El Kadi,
Oualid Hakam,
Victor Ongoma,
Mohammed Hssaisoune,
Abdellaali Tairi,
Mohammed El Hafyani,
Lhoussaine Bouchaou
,
Adnane Labbaci,
Moussa Ait El Kadi,
Oualid Hakam,
Victor Ongoma,
Mohammed Hssaisoune,
Abdellaali Tairi,
Mohammed El Hafyani,
Lhoussaine Bouchaou
Drought and vegetation dynamics in dryland of arganeraie biosphere reserve in Morocco: toward an understanding of the impact of environmental shocks on the Agro-sylvo-pastoral system
Meskour B., Labbaci A., Ait El Kadi M., Hakam O., Ongoma V., Hssaisoune M., Tairi A., El Hafyani M., Bouchaou L. (2025). Drought and vegetation dynamics in dryland of arganeraie biosphere reserve in Morocco: toward an understanding of the impact of environmental shocks on the Agro-sylvo-pastoral system. Silva Fennica vol. 59 no. 2 article id 24056. https://doi.org/10.14214/sf.24056
Highlights
- Argan agro-sylvo-pastoral system is a unique agro-ecosystem of arid land in the world
- Climate variability, drought and vegetation dynamic are assessed in the GIAHS site using a combination of remote sensing and field investigation
- Findings highlights a significant decrease in agricultural and woodland cover and consistent increase in drought
- Resilience implications are discussed to inform socio-economic actors.
Abstract
Agroforestry systems are critical for building resilience to socio-environmental shocks, especially in drought-prone arid and semi-arid areas. This study the ecological impact of drought on the Mediterranean Globally Important Agricultural Heritage Systems (GIAHS) site of Ait Saoub-Ait Mansour in Morocco. Machine learning-based random forest (RF) classification and change detection were used to explore the change in land use classes such as built-up areas, agricultural areas, woodland, and bare land. Spatiotemporal analysis of temperature, precipitation, and Precipitation-Evapotranspiration Index (SPEI) is performed using Mann-Kendall and Sen’s slope test for the period 1983–2020. Additionally, the Normalised Difference Vegetation Index (NDVI) is analyzed from 2000 to 2020 for some specified crop species such as Argan tree (Argania spinosa (L.) Skeels), cereal, palm tree, and cereal mixed. The results show a decrease in the area of agricultural and woodland and a consistent increase in drought (decrease in SPEI-6 and SPEI-12) over time. Annual and seasonal trends in NDVI for Argan tree, cereal, palm tree, and mixed cereal are negative. These findings provide consistent evidence of the ongoing degradation of this ecosystem and the changing climate. The resilience implications are discussed to inform socio-economic actors and stakeholders.
Keywords
drought;
ecosystem resilience;
GIAHS;
Morocco
-
Meskour,
Applied Geology and Geo-Environment Laboratory, Faculty of Sciences, Ibn Zohr University, Agadir, 80035, Morocco
 https://orcid.org/0009-0003-1698-8949
E-mail
brahim.meskour@edu.uiz.ac.ma
https://orcid.org/0009-0003-1698-8949
E-mail
brahim.meskour@edu.uiz.ac.ma
- Labbaci, Applied Geology and Geo-Environment Laboratory, Faculty of Sciences, Ibn Zohr University, Agadir, 80035, Morocco; Geosciences and Geo-Environment Laboratory, Faculty of Sciences, Ibn Zohr University, Agadir, 80035, Morocco E-mail a.labbaci@uiz.ac.ma
- Ait El Kadi, Applied Geology and Geo-Environment Laboratory, Faculty of Sciences, Ibn Zohr University, Agadir, 80035, Morocco E-mail moussa.aitelkadi@edu.uiz.ac.ma
- Hakam, Center for Remote Sensing Applications, Mohammed VI Polytechnic University, 43150, Ben-Guerir, Morocco E-mail oualid.hakam@um6p.ma
- Ongoma, International Water Research Institute, Mohammed VI Polytechnic University, Ben Guerir, 43150, Morocco E-mail victor.ongoma@um6p.ma
-
Hssaisoune,
Applied Geology and Geo-Environment Laboratory, Faculty of Sciences, Ibn Zohr University, Agadir, 80035, Morocco; Faculty of Applied Sciences, Ibn Zohr University, B.O. 6146 Azrou District, 86153, Ait Melloul, Morocco; International Water Research Institute, Mohammed VI Polytechnic University, Ben Guerir, 43150, Morocco
https://orcid.org/0000-0002-9388-3804
E-mail
m.hssaisoune@uiz.ac.ma
-
Tairi,
Applied Geology and Geo-Environment Laboratory, Faculty of Sciences, Ibn Zohr University, Agadir, 80035, Morocco
https://orcid.org/0009-0000-5612-4123
E-mail
a.tairi@uiz.ac.ma
- El Hafyani, Applied Geology and Geo-Environment Laboratory, Faculty of Sciences, Ibn Zohr University, Agadir, 80035, Morocco E-mail m.elhafyani@uiz.ac.ma
- Bouchaou, Applied Geology and Geo-Environment Laboratory, Faculty of Sciences, Ibn Zohr University, Agadir, 80035, Morocco; International Water Research Institute, Mohammed VI Polytechnic University, Ben Guerir, 43150, Morocco E-mail l.bouchaou@uiz.ac.ma
Received 22 October 2024 Accepted 19 October 2025 Published 24 October 2025
Views 47402
Available at https://doi.org/10.14214/sf.24056 | Download PDF

Supplementary Files
1 Introduction
A prolonged dry period in the natural climate cycle has an effect on water quantity and access. It causes drought that can be classified based on its causes and consequences. Further, droughts are characterized in terms of their severity, location, duration and timing (WMO and GWP 2016). Meteorological drought occurs when there is a prolonged period of significantly below-average precipitation. It is mainly weather-related and can lead to other types of drought such as agricultural drought that is caused when there is not enough soil moisture to support crops and plants. Hydrological drought is associated with both surface and groundwater shortages, such as reduced river flows, dried-up lakes. Socio-economic drought arises when water scarcity begins to have an impact on human activities, leading to disruptions in the availability and the water demand (Van Loon 2015).
Drought directly affects about 1.84 billion people globally, an estimated quarter of humanity (UNCCD 2023). According to the World Bank (2023), 85% of this population is estimated to live in low or middle-income countries. In addition, drought increases the risk of deforestation and land degradation by 17% in arid and semi-arid areas (UNCCD 2023). Although drought is a natural hazard, human influence due to land use (LU) change is an important and essential factor that worsens the impact (Ayugi et al. 2022; Tanarhte et al. 2024).
Climate change effects, characterised by high spatiotemporal variability of precipitation (Abahous et al. 2018, 2020; Pérez-Cutillas and Salhi 2024) and prolonged meteorological drought, have devastating socio-environmental impact. These include biodiversity losses, increases in wildfires, decreases in water storage, groundwater depletion, and growing animal and plant diseases (Verner et al. 2018). In addition, agricultural practices in rainfed systems are highly vulnerable to drought (Agoussine and Bouchaou 2004; Choukr-Allah et al. 2016; Abahous et al. 2018; Hssaisoune et al. 2020). According to Filho et al. (2023), climate poses a great risk to the realization of United Nations Sustainable Development Goals such as SDG 1, 2, and 15, on No Poverty, No Hunger, and Life on Land, respectively, among many others.
The United Nations (UN 2016), reported that land degradation affects 19% of Moroccan land as soils are fragile and suffer from water and wind erosion. Therefore, cropland and rangeland are losing their productivity, threatening livelihoods and causing socio-economic problems. For instance, cropland and rangeland degradation is estimated to cost between US$91 million and US$178 million annually (Croitoru and Sarraf 2010). Moreover, drought and land degradation increase social vulnerability and cause rural exodus which represented almost 20.7% of the entire internal migrant population in 2014 (HCP 2023).
In North Africa (NA) and the Mediterranean region, climatic projections indicate a high likelihood of more frequent and intense drought events (Elkouk et al. 2021, 2022; Ayugi et al. 2022). In Morocco, drought and its socioeconomic impacts in the past millennia are well documented (Chbouki 1992; Cook et al. 2016; Ait Brahim et al. 2017; Baqloul et al. 2021; Tadoumant et al. 2022), as well as in contemporary times (Swearingen and Bencherifa 2000; Bouchaou et al. 2011; Driouech et al. 2021; Hadri et al. 2021). It is estimated that a drought event can cost the agriculture sector up to $500 million (Moneo and Iglesias 2007).
The Arganeraie Biosphere Reserve (ABR), located in central and southwest Morocco, is an agro-sylvo-pastoral and socio-ecological system, which is tolerant to the region’s aridity (UNESCO 2018). The argan trees considered the main component of the ABR, contribute to the preservation of the ecosystem by creating an atmosphere that supports floristic and faunistic biodiversity (Saddik et al. 2024). In the occidental Anti-Atlas as part ABR, the argan based agro-sylvo-pastoral system of Ait Souab-Ait Mansour is registered as the Globally Important Agricultural Heritage System Programme (GIAHS) of the United Nations Food and Agricultural Organisation (FAO) (https://www.fao.org/giahs/en/). The argan trees constitute around 70% of the woodland area in the ABR (M’hirit et al. 1998; Chakhchar et al. 2022). Despite its resilience, this ecosystem faces intense environmental and socio-economic challenges, including land degradation, exploitation and preservation trade-off, rural-urban migration, and loss of local knowledge and practices (Barkaoui et al. 2022; Santoro et al. 2023; Baqloul et al. 2024; Hakam et al. 2024; Tadoumant et al. 2024; Tairi et al. 2024).
There is a need for understanding the occurrence of the challenges in ABR so as to devise and implement effective response strategies. Effective drought management must be cross-sectorial, and addressed at different levels starting from community to national scale and beyond. This is supported by an elaborate Integrated Drought Management (IDM). IDM framework is based on three interrelated pillars: (1) monitoring and early warning systems; (2) vulnerability and impact assessment; and (3) mitigation, preparedness, and response (Pischke and Stefanski 2016; Wilhite 2017). Thus, accurate drought assessment and monitoring are essential steps toward IDM. Different approaches are used to assess drought and its impact on ecosystems. Among the most cost-efficient and rapid, the use of indices and models derived from remotely sensed data provides valuable insights into spatial and temporal drought dynamics, land surface conditions, and vegetation health (WMO and WGP 2016; Bouaakkaz et al. 2020; Boudhar et al. 2022; Labbaci and Bouchaou 2022, Han and Singh 2023).
This work aims to assess the drought effects on land degradation in ABR. In this way, land use changes and vegetation are used as a proxy of drought and precipitation deficit (i.e., meteorological drought) as the main trigger of other types of droughts, namely: hydrological, agricultural, and socio-economic. The findings of this study would help to assess the impact of environmental shocks in the context of the Argan ecosystem. Moreover, the ambition is to inform stakeholders on mitigation and adaptation efforts.
2 Material and methods
2.1 Study area
The GIAHS site Agro-silvo-pastoral system of the Argan tree in the Ait Souab-Ait Mansour region is in the Southeast of Agadir in the Souss Massa region. It lies between the longitude 8°15’00”W and 9°30’00’’W, and the latitude of 28°15’00’’N and 30°00’00’’N (Fig. 1). It has an elevation varying from 159 to 2376 m. The study area is characterized by a Mediterranean climate with a dry period from March to November (Fig. 2), cold winter in December, January, and February, and hot dry summer in June, July, and August. The rainfall regime is influenced by orographic disturbances, which are responsible for the stormy nature in summer and ocean disturbances at the start of the winter and spring rains.
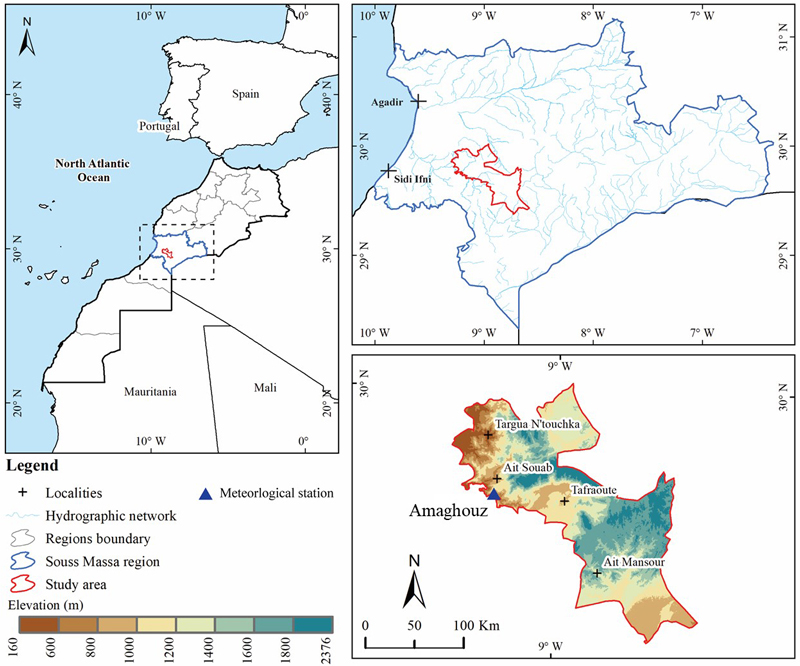
Fig. 1. The location and topography of the study area map.
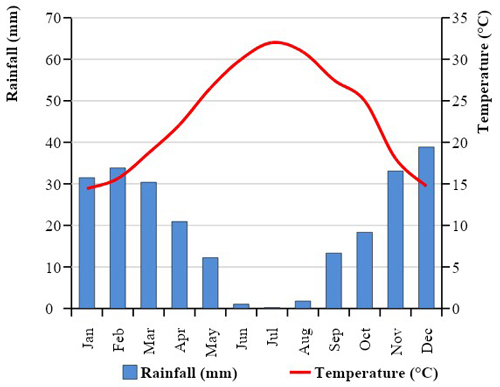
Fig. 2. Rainfall and temperature climatology of the GIAHS site based on observed data for the Amaghouz station for the period 1983–2022. Globally Important Agricultural Heritage Systems (GIAHS).
The income of the rural population in the area is mainly dependent on biodiversity-related sources such as agriculture and tourism (Santoro et al. 2023). Thus, biodiversity plays a key role in food security and livelihood, providing services for sustainability and economic development.
2.2 Methodology
The satellite images were downloaded and processed and used to create LULC maps, and calculate NDVI and other spectral indices. Then, the NDVI time series were analyzed for the period 2000–2020, for the different species within the GIAHS such as palm tree, argan tree, and cereals. Secondly, precipitation and temperature were analyzed from 1983 to 2020, based on data availability (Fig. 3). Because of limited gauging stations, the precipitation data were extracted from the PERSIANN-CDR (Rainfall Estimation from Remotely Sensed Information using Artificial Neural Networks – Climate Data Record). PERSIANN-CDR dataset has a resolution of 0.25° × 0.25° (Ashouri et al. 2015). The temperature data were extracted from the ERA5-Land product by the European Centre for Medium-Range Weather Forecasts (ECMWF) in 2019 (Muñoz-Sabater et al. 2021). These products were evaluated and assessed using a gauging station, and by calculating the correlation coefficient (CC), the root-mean-square error (RMSE), and relative bias in percent (PBIAS) (Khettouch et al. 2023; Hakam et al. 2024). The trend of these parameters was performed using Mann–Kendall (MK) (Mann 1945; Kendall 1975) test and Sen’s slope estimator (Sen 1968). Finally, drought was quantified using The Standardized Precipitation-Evapotranspiration Index (SPEI) (Eq. 1) (Vicente-Serrano et al. 2010). The SPEI was calculated at 6- and 12-month timescales to evaluate seasonal and annual drought conditions, respectively. SPEI at nine months scale (SPEI09) to twelve months (SPEI12) are more appropriate for agricultural drought analysis (Liu et al. 2024). On the other hand, SPEI at less than six months scale is appropriate for characterization of meteorological drought. These calculations were conducted using the SPEI package within the R environment (Beguería et al. 2014). The estimation of potential evapotranspiration (PETi) for each month was calculated using the Hargreaves method. This method utilizes thermal meteorological variables, including minimum and maximum temperatures and latitude, to estimate the potential evapotranspiration rate. By incorporating these factors, the Hargreaves method provides a reliable estimation of PETi, which is essential for understanding the moisture deficit Di (Eq. 1).
![]()
where Di represents the moisture deficit (measured in mm) for month i, Pi stands for the precipitation (mm) in month i, and PETi denotes the potential evapotranspiration (mm) for month i.
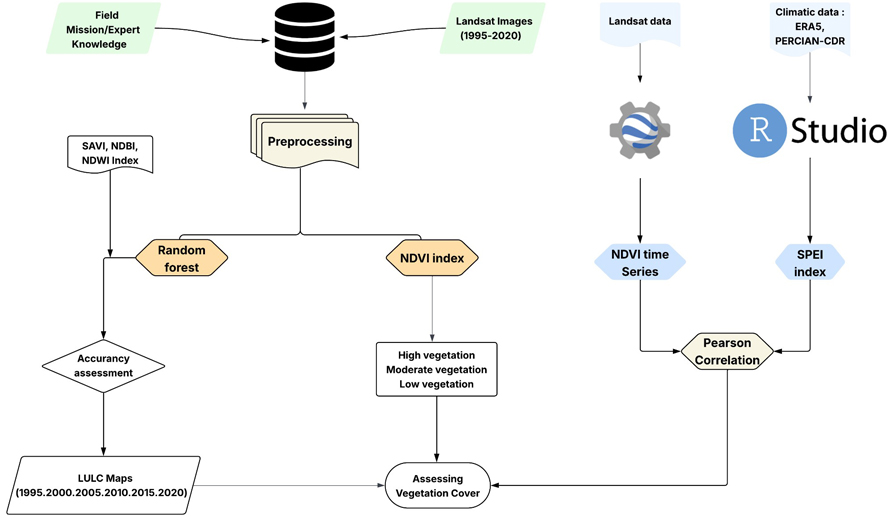
Fig. 3. Flowchart of the adopted methodology for assessing Drought and vegetation dynamics dynamics in GIAHS site. Globally Important Agricultural Heritage Systems (GIAHS), The spectral indices used include the Soil-Adjusted Vegetation Index (SAVI), Normalized Difference Built-up Index (NDBI), and Normalized Difference Water Index (NDWI). The classification was carried out using the Random Forest (RF) algorithm implemented in Google Earth Engine (GEE). LULC – Land Use and Land Cover; SAVI – Soil-Adjusted Vegetation Index; NDBI – Normalized Difference Built-up Index; NDWI – Normalized Difference Water Index; RF – Random Forest; OA – Overall Accuracy; Kappa – Kappa coefficient.
2.2.1 Field data collection
In order to collect the necessary field information for the classification, data collection companies coupled with Google Earth visualization, were carried out during the period September 2022, February and May 2023. Several points were collected covering the different classes, as well as the location, the notes and the photos to complete the detail. This field campaign allowed reliable training and the validation dataset, which was then incorporated into the classification process using RF classifier. Around 800 points were collected in 80% were used as training data, and 20% were used for the validation.
2.2.2 Image data pre-processing
The Landsat satellite imagery including Multispectral Scanner (MSS), Enhanced Thematic Mapper Plus (ETM+), Thematic Mapper (TM), and Operational Land Imager (OLI) data, downloaded from the United States Geological Survey (USGS) Earth Explorer platform (https://earthexplorer.usgs.gov/), were used to create LULCC and NDVI maps for the years 1995, 2000, 2005, 2010, 2015, and 2020. All images were captured from July to September when various vegetation types remained in a stable state to ensure accurate compararganisons of LULC variations. The selection of satellite images followed the criteria outlined by Sun et al. (2009): (1) preference for images with less than 10% cloud coverage, with a priority for cloud-free conditions whenever feasible; (2) prioritization of satellite image series with extensive temporal coverage to enable robust long-term analysis.
2.2.3 Random forest classifier
The LULC maps were carried out using the RF classifier. Several classes were taken into account such as bare land, agriculture, build-up area, and woodland. The RF is a supervised machine learning algorithm that can be used for both classification and regression tasks. It is a popular method for land cover classification because it can handle large datasets and high-dimensional spaces and is resistant to overfitting. Breiman (2001) developed it as a machine learning algorithm that improves the precision of the classification and reduces the processing costs compared to the traditional methods. This algorithm is based on multiple decision trees to perform the classification and the regressions tasks. Many trees were built for stability (ntree = 200), and since store all the variables for each split. The features for classification were derived from multi-spectral data and other indices (i.e., NDVI, NDWI, and SAVI) found within the earth engine. A sample was identified for four different land cover classes (agriculture, woodland, bare land, built-up land) and was created by hand drawing the land cover boundaries using high-resolution imagery, field entry, and expert interpretation, ensuring spatial and homogeneity for each land cover class. The sampling was distributed spatially, each training dataset was randomly split into 80% training data and 20% testing data using a random column. Since the default settings have been demonstrated to produce high classification accuracy while successfully limiting overfitting in comparable land cover investigations, they were employed as advised by Ming et al. (2016) and Rodriguez-Galiano et al. (2012). The classifier was trained using ee.Classifier.smileRandomForest() and model accuracy was assessed using the field data and by calculating the confusion matrix, overall accuracy (OA; Eq. 2), the kappa index (KI; Eq. 3), producer’s accuracy (PA; Eq. 4), and user’s accuracy (UA; Eq. 5) (Congalton 1991). The Kappa coefficient gauges the agreement between the classifier’s resulting classes and the ground truth, with values ranging from 0to 1. A Kappa coefficient of 0signifies no agreement, while a value of 1 indicates perfect agreement (Stehman 1996; Foody 2020). Overall Accuracy and Kappa statistics are pivotal metrics utilized to evaluate the accuracy of land cover classification (Mawenda et al. 2020).


where N represents the total number of observations, while r denotes the number of rows and columns in the error matrix. The term Xii signifies the count of observations in both column i and row i (the diagonal element). Additionally, Xi+ and X+i represent the marginal totals of the columns and rows, respectively (Tariq et al. 2023).
2.2.4 Spectral indices
For better classification guidance and orientation, some spectral indices such as NDVI (Eq. 6) (Rouse Jr et al. 1974), Soil-Adjusted Vegetation Index (SAVI) (Eq. 7) (Huete 1988), Normalized Difference Built-up Index (NDBI) (Eq. 8) (Zha et al. 2003), and Normalized Difference Water Index (NDWI) (Eq. 9) (Gao 1996). These indices give ideas on the different land use types such as vegetation, built-up, and water.


where NIR is near-infrared reflectance, RED is the red reflectance, GREEN represents the green reflectance, SWIR represents the Short-Wave Infrared and L is the adjustment factor.
2.2.5 Change detection of LULC classification
The area and percentage of change, or the rate of change, are widely applied quantitative methods for detecting LCLU changes, revealing the magnitude of loss and gain for each land cover/land use in the region (Opedes et al. 2022), currently measured in hectares and percentage. Mathematically, this is presented using Eq. 10:
![]()
where LCLUi represents the land cover/land use area of a specific class in the previous year (i), while LCLUi+1 denotes the land cover/land use area of the same class in the subsequent year (i + 1).
2.2.6 Index based change detection
The study examined the variability in vegetation condition and drought severity over 20 years through the analysis of NDVI time series. The average of multiple point-in-time series provides information about vegetation changes. Time series were generated from Landsat data accessed via the Google Earth Engine platform, the NDVI time series provided insights into the annual and seasonal dynamics of various vegetation species within the research area. Trend analysis was computed to quantify vegetation change trends in both annual and seasonal averages (Winter, Spring, Summer, and Autumn) across agricultural classes. Furthermore, NDVI maps were classified based on the NDVI values according to Table 1. This classification is an adaptation of the classification already carried out by Mohajane et al. (2018).
| Table 1. Classification of land cover types based on NDVI values for the GIAHS site. | |
| NDVI Values | Class description |
| NDVI < 0.03 | Bare land |
| 0.03 < NDVI < 0.3 | Low-density vegetation |
| 0.3 < NDVI < 0.4 | Moderate-density Vegetation |
| NDVI > 0.4 | High-density Vegetation |
| NDVI: Normalized Difference Vegetation Index; GIAHS: Globally Important Agricultural Heritage Systems (GIAHS). | |
3 Results
3.1 Spatio-temporal climate variability
The precipitation ranges between 150 and 170 mm yr–1 going from the south to the north. The temperature ranges from 15 °C to 24 °C, with the northwest regions recording the highest temperature (Fig. 4).
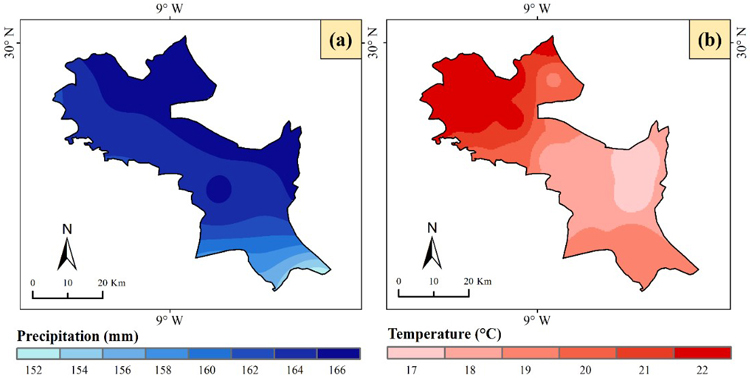
Fig. 4. Climatology of annual (a) precipitation and (b) temperature, in the GIAHS site from 1983–2020. Globally Important Agricultural Heritage Systems (GIAHS).
The spatio-temporal dynamics of temperature and precipitation during the period of 1983–2020 across the GIAHS site throughout the seasons are presented in (Figs. 5,6). Figures 5A1–A4 and 5Y1–Y4 show a negative trend with a precipitation shift from the southeast to the northwest starting in winter to autumn. While the summer and the autumn show a positive trend. The precipitation decreased by –1.5 mm yr–1 in the northwest during winter and increased by 1 mm yr–1 during autumn. Figures 6K1–K4 and 6G1–G4 depict the temporal variation of temperature from 1983 to 2020. Temperature variability shows a relatively higher increase in the southern than in the northern part of the GIAHS site during both spring and winter. Overall, the warming rate is less than 0.2 °C yr–1 over most parts of the study area. In summer, the temperature variability remains stable with a slow increasing trend. In autumn, a small proportion of the GIAHS site experiences increasing temperatures with a slow positive trend. While fluctuations in temperature and precipitation patterns provide valuable insights into climate dynamics, they also influence the occurrence and severity of meteorological drought.
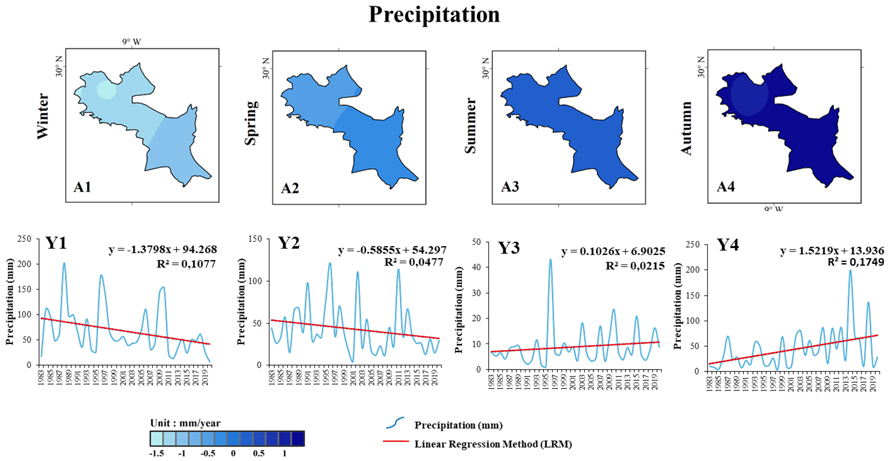
Fig. 5. Spatial-temporal changes in precipitation in the GIAHS site during 1983–2020. (A1–A4) show the seasonal spatial trends in precipitation (unit: mm/year) derived using the Linear Regression Method (LRM), while (Y1–Y4) represent the corresponding interannual variation and linear trends. Seasons are as follows: (1) Winter, (2) Spring, (3) Summer, and (4) Autumn. Globally Important Agricultural Heritage Systems (GIAHS). View larger in new window/tab.
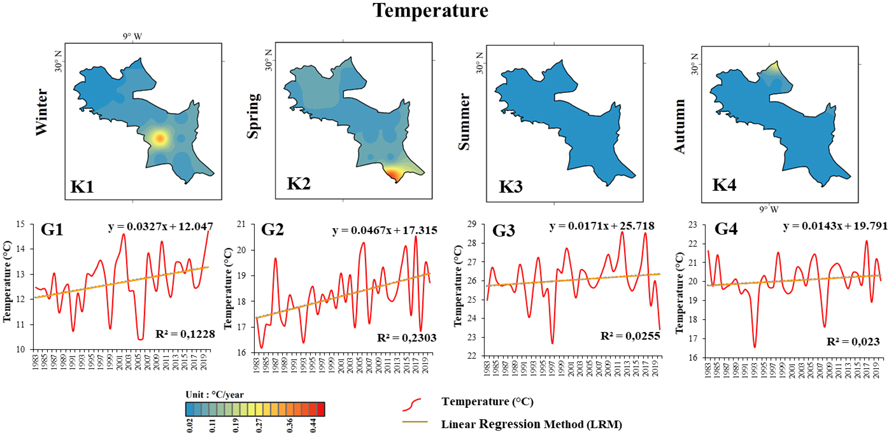
Fig. 6. Spatial-temporal changes in temperature in the GIAHS site during 1983–2020. (K1–K4) illustrate the seasonal spatial trends in temperature (unit: °C/year) using the Linear Regression Method (LRM), and (G1–G4) show the corresponding interannual variation and trends. Seasons are as follows: (1) Winter, (2) Spring, (3) Summer, and (4) Autumn. Globally Important Agricultural Heritage Systems (GIAHS). View larger in new window/tab.
3.2 Analysis of meteorological drought
Drought analysis is based on SPEI 6 and 12-month timescales to evaluate the impact of changing climatic characteristics on meteorological drought in the GIAHS site (Fig. 7). The SPEI analysis at SPEI-6 and SPEI-12 timescales provide insights into the drought patterns over different decades. In the first decade, from 1983 to 1990, four drought years (1984, 1986, 1987, and 1988) were identified as experiencing low to high levels of drought. The second decade, from 1990 onwards, saw fewer drought occurrences (1995, 1998, and 1999) according to SPEI-6 and SPEI-12 measurements. Moving to the third decade, spanning from 2000 to 2003, with additional occurrences in 2007 and 2008, a longer drought spell was observed compared to previous decades. Similarly, the fourth decade, ranging from 2012 to 2015, with additional occurrences in 2017 and 2018, revealed a prolonged drought period.
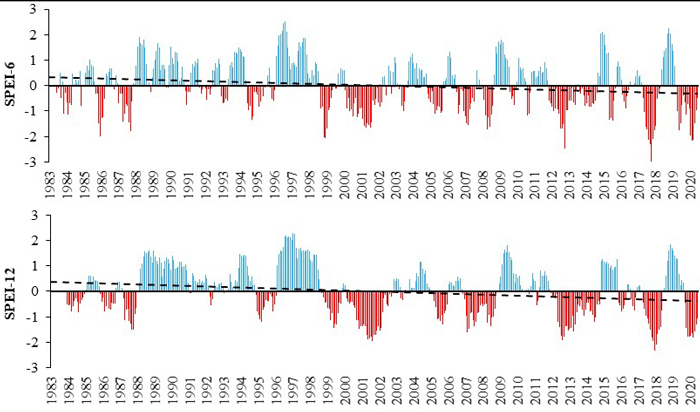
Fig. 7. Time series of changes in SPEI at the seasonal scale (SPEI-6) and annual scale (SPEI-12) from 1983 to 2020 in the GIAHS site. The Standardized Precipitation-Evapotranspiration Index (SPEI).
3.3 Land use /land cover changes
The classification was carried out using satellite and ground truth data and by applying the RF. The evaluation of the results was performed by calculating the overall accuracy, Cohen’s kappa coefficient, and the confusion matrix. The results showed a high value of overall accuracy for all the classifications of about 83.33%, 85.90%, 95.77%, 93.72%, 95.62%, and 97.87% respectively for 1995, 2000, 2005, 2010, 2015, and 2020. and Cohen’s kappa coefficient of about 0.82, 0.86, 0.90, 0.93, 0.95, and 0.96, respectively (Table 2).
| Table 2. Confusion matrix and accuracy assessment of (LULC) classification for the GIAHS site. | ||||||
| Year | Ground truth | |||||
| 1995 | Classes | Agriculture | Woodland | Bare land | Built-up | Producer’s accuracy |
| Agriculture | 83.33 | 0.67 | 0.07 | 0.00 | 99.12 | |
| Woodland | 0.00 | 87.33 | 0.21 | 19.35 | 81.72 | |
| Bare land | 16.67 | 4.67 | 99.49 | 16.13 | 72.63 | |
| Build up | 0.00 | 7.33 | 0.24 | 64.52 | 89.51 | |
| User’s accuracy | 83.33 | 87.33 | 99.48 | 64.52 | ||
| OA = 83.66; KI = 0.82 | ||||||
| 2000 | Classes | Agriculture | Woodland | Bare land | Built-up | Producer’s accuracy |
| Agriculture | 88.24 | 2.40 | 0.11 | 14.29 | 84.01 | |
| Woodland | 0.00 | 91.62 | 0.17 | 7.14 | 92.62 | |
| Bare land | 11.76 | 4.79 | 99.49 | 14.29 | 76.33 | |
| Build up | 0.00 | 1.20 | 0.23 | 64.29 | 97.82 | |
| User’s accuracy | 88.24 | 91.61 | 99.49 | 64.28 | ||
| OA = 85.90; KI = 0.86 | ||||||
| 2005 | Classes | Agriculture | Woodland | Bare land | Built-up | Producer’s accuracy |
| Agriculture | 93.75 | 2.08 | 0.00 | 0.00 | 97.83 | |
| Woodland | 6.25 | 97.92 | 0.00 | 0.00 | 94.00 | |
| Bare land | 0.00 | 0.00 | 99.73 | 8.33 | 92.30 | |
| Build up | 0.00 | 0.00 | 0.27 | 91.67 | 99.71 | |
| User’s accuracy | 93.75 | 97.92 | 99.73 | 91.67 | ||
| OA = 95.77; KI = 0.90 | ||||||
| 2010 | Classes | Agriculture | Woodland | Bare land | Built-up | Producer’s accuracy |
| Agriculture | 93.55 | 9.23 | 0.00 | 0.00 | 91.00 | |
| Woodland | 6.45 | 90.77 | 0.00 | 0.00 | 93.37 | |
| Bare land | 0.00 | 0.00 | 99.93 | 9.38 | 91.37 | |
| Build up | 0.00 | 0.00 | 0.07 | 90.63 | 99.92 | |
| User’s accuracy | 93.55 | 90.77 | 99.93 | 90.62 | ||
| OA = 93.72; KI = 0.93 | ||||||
| 2015 | Classes | Agriculture | Woodland | Bare land | Built-up | Producer’s accuracy |
| Agriculture | 91.67 | 4.29 | 0.02 | 0 | 95.51 | |
| Woodland | 8.33 | 95.24 | 0 | 0 | 91.96 | |
| Bare land | 0 | 0.48 | 99.89 | 8.33 | 91.92 | |
| Build up | 0 | 0 | 0.09 | 91.67 | 99.90 | |
| User’s accuracy | 91.67 | 95.24 | 99.89 | 91.67 | ||
| OA = 95.62; KI = 0.95 | ||||||
| 2020 | Classes | Agriculture | Woodland | Bare land | Built-up | Producer’s accuracy |
| Agriculture | 92.86 | 0.69 | 0 | 0 | 99.26 | |
| Woodland | 7.14 | 99.04 | 0.01 | 0 | 93.27 | |
| Bare land | 0 | 0 | 99.93 | 0.62 | 99.38 | |
| Build up | 0 | 0 | 0.07 | 99.38 | 99.93 | |
| User’s accuracy | 92.86 | 99.31 | 99.92 | 99.38 | ||
| OA = 97.87; KI = 0.96 | ||||||
| LULC: land use/land cover; GIAHS: Globally Important Agricultural Heritage System. | ||||||
The results LULC change illustrate that the bare land is the dominant class in all the period (Fig. 8). While, the woodland and agricultural areas decreased during the same period from 1.90% to 1.07% and 0.82% to 0.43%, respectively. On the other hand, the Build-up areas have been increased from 0.002% to 0.054% (Fig. 8 and Table 3).
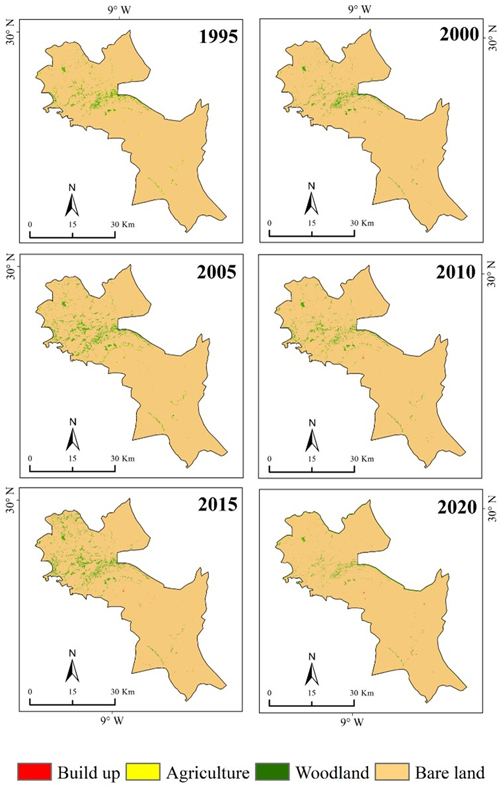
Fig. 8. Spatio-temporal change of LULC over the period 1995–2020 within the Globally Important Agricultural Heritage System (GIAHS) site.
| Table 3. Temporal variability in LULC Composition across Different Classes: 1995–2020. | ||||||
| Classes | 1995 (%) | 2000 (%) | 2005 (%) | 2010 (%) | 2015 (%) | 2020 (%) |
| Bare land | 97.268 | 98.123 | 96.562 | 97.869 | 96.783 | 98.429 |
| Woodland | 1.902 | 1.789 | 3.082 | 1.995 | 3.149 | 1.079 |
| Built-up | 0.002 | 0.018 | 0.009 | 0.026 | 0.045 | 0.055 |
| Agriculture | 0.828 | 0.070 | 0.347 | 0.111 | 0.022 | 0.436 |
| LULC: land use land cover (LULC). | ||||||
3.4 Change detection of LULC
LULC change detection between 1995 and 2000 revealed a modest increase of 0.86% in desert bareland, alongside a decrease of 0.76% in agricultural land, a slight gain of 0.02% in built-up areas, and a reduction of 0.11% in woodland cover (Fig. 9). Moving to the subsequent period from 2000 to 2005, there was a modest decrease of 1.56% in bareland, juxtaposed with a 1.29% increase in forest cover, a 0.28% growth in agricultural land, and a marginal 0.01% decline in built-up areas. Transitioning to the timeframe spanning 2010 to 2015, the analysis revealed a 1.09% decline in bareland, a 1.15% rise in forest cover, a slight 0.02% increase in built-up areas, and a 0.09% reduction in agricultural land. Notably, the most significant changes in land cover and land use at the GIAHS site occurred between 2015 and 2020, characterized by a notable 1.65% increase in bareland, a 2.07% decline in forest cover primarily attributed to conversion to range land, a 0.1% growth in built-up areas, and a 0.41% expansion in agricultural land.
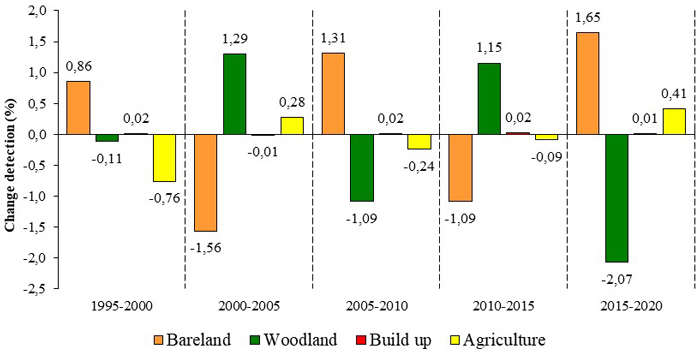
Fig. 9. Area based change detection of LCLU in respective periods.
3.5 Spatiotemporal and Crop-Specific NDVI Dynamics
Results of the NDVI change maps are presented in Fig. 10 and Table 4. The findings indicate that low vegetation density (LVD) is the dominant class throughout all periods, with a slight decrease from 98.57% in 1985 to 96.38% in 2020. Moderate vegetation density (MVD) has increased during the same period, from 0.55% to 1.52%. Conversely, the percentage of the area with high vegetation density (HVD) has also increased, from 0.25% to 0.53%.
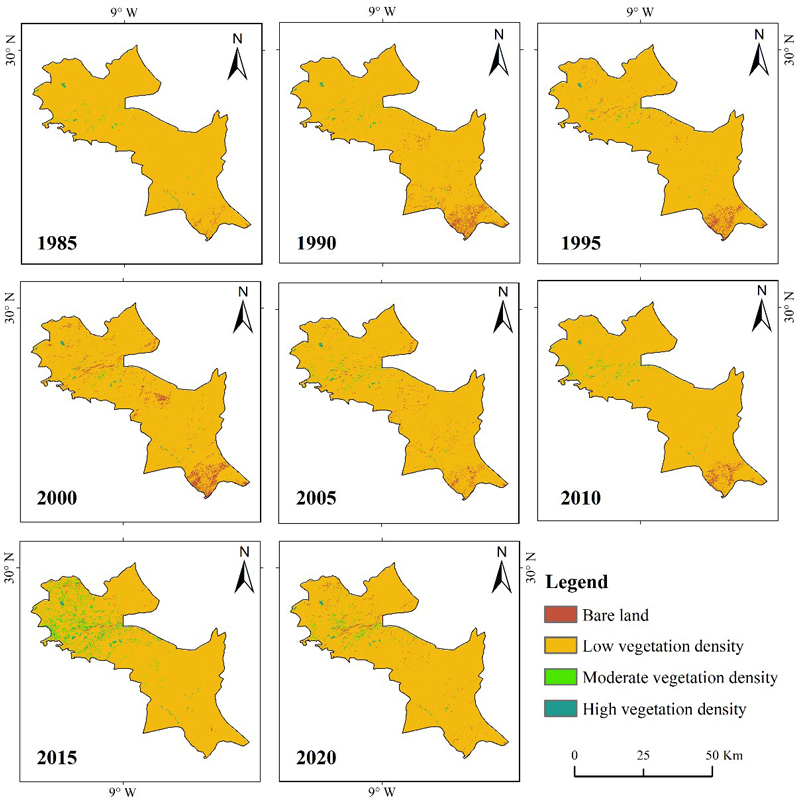
Fig. 10. Spatial patterns of NDVI rate of change in the Globally Important Agricultural Heritage System (GIAHS) site from 2000 to 2020.
| Table 4. Percentage temporal variation of vegetation density classes: 1985–2020. | ||||||||
| NDVI class | 1985 | 1990 | 1995 | 2000 | 2005 | 2010 | 2015 | 2020 |
| BL | 0.63 | 2.76 | 2.55 | 2.55 | 2.16 | 1.22 | 0.68 | 1.57 |
| LVD | 98.57 | 96.65 | 96.78 | 94.72 | 96.50 | 97.38 | 92.8 | 96.38 |
| MVD | 0.55 | 0.39 | 0.45 | 0.45 | 0.98 | 1.1 | 5.22 | 1.52 |
| HVD | 0.25 | 0.20 | 0.22 | 0.30 | 0.36 | 0.30 | 1.30 | 0.53 |
| BL, LDV, MVD, and HDV are acronyms for Bare Land, Low Vegetation Density, Moderate Vegetation Density, and High Vegetation Density, respectively. | ||||||||
Fig. 11 presents the annual NDVI trends for various crop types (Cereals, Argan trees, Palm trees, and Cereals mixed with other species) spanning the period from 2000 to 2020. The results of the MK test show an upward trend for the Argan trees and palm trees and a downward trend for the Cereals and the Cereals with other species. The NDVI seasonal trend of the two classes of Cereals and Cereals mixed with other species showed a downward trend during all seasons. seasonal NDVI for the argan trees, show an increase except for winter. While the NDVI seasonal trend of palm trees showed an uptrend except for summer (Fig. 12).
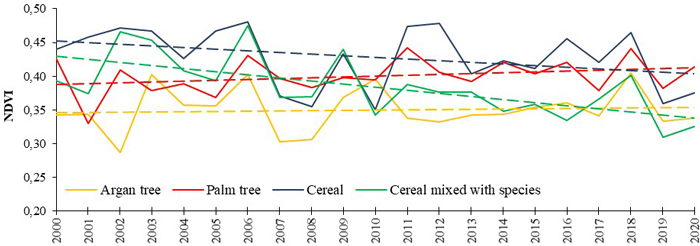
Fig. 11. Annual NDVI trends among various crop types from 2000 to 2020. Cereal mixed with species cereals are cultivated together with other crops, such as legumes, maize and alfalfa (Medicago sativa).
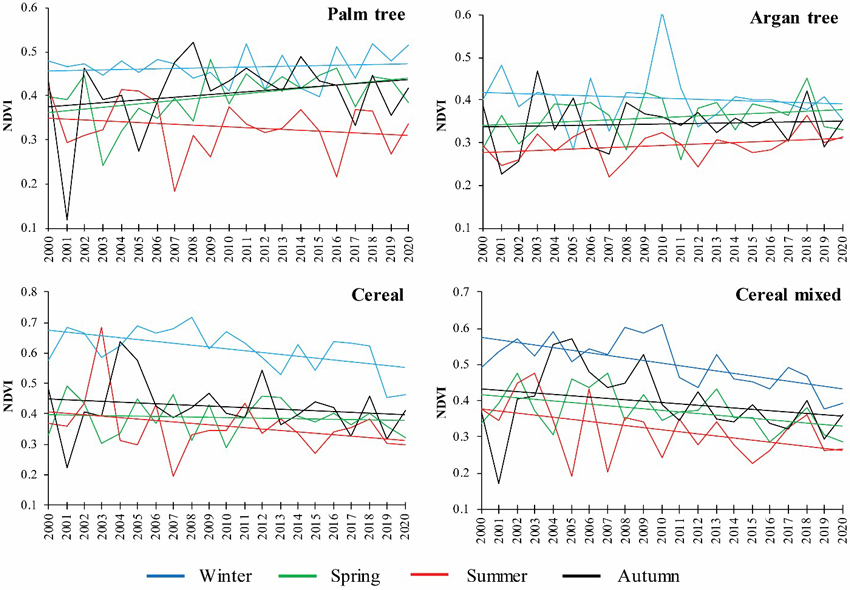
Fig. 12. Seasonal NDVI trends among various crop types from 2000 to 2020.
3.6 Temporal analysis of LULC and meteorological droughts
3.6.1 Trend analysis
Results of the NDVI trend analysis are intriguing (Table 5). NDVI values for palm trees and argan trees showed a non-significant upward trend, with Tau values of 0.18 and 0.02 respectively, low z-scores of 1.11 and 0.09, as well as Sen’s slopes of 0.001 and 0.006. Conversely, cereal crops exhibited significant downward trends, particularly for mixed cereals (p < 0.001), with a Tau of –0.48, a z-score of –2.99, and a negative Sen’s slope of –0.004. These findings suggest that crops such as cereals are less resilient to the observed drought conditions in the region during this period compared to fruit trees.
| Table 5. Mann-Kendall trend and Sen’s slope of remote sensing and drought index. | ||||||
| Variables | NDVI | SPEI-6 | SPEI-12 | |||
| Palm tree | Argan tree | Cereal | Cereal mixed with species | |||
| Z-score | 1.11 | 0.09 | –1.42 | –2.99* | –3.95* | –4.52* |
| Sen’s slope | 0.001 | 0.006 | –0.002 | –0.004 | –0.001 | –0.001 |
| Tau | 0.18 | 0.02 | –0.23 | –0.48 | –0.12 | –1.43 |
| Variance | 1096.6 | 1096.6 | 1096.6 | 1096.6 | 10158610 | 10158460 |
| * Significant p-value at 99% confidence level; SPEI-6: Standardized Precipitation Evapotranspiration Index at 6 months; SPEI-12: Standardized Precipitation Evapotranspiration Index at 12 months. | ||||||
The meteorological indices, SPI-6 and SPI-12 also showed a significant downward trend (p < 0.001), confirming the previous observations. The negative Sen’s slope (–0.001) and negative z-scores (–3.95 and –4.52) of SPEI on both scales (SPEI-6 and SPEI-12) highlighted a decreasing trend, indicating a significant shift towards climate warming in the region.
3.6.2 Correlation analysis
Positive correlations were observed between NDVI and both seasonal (SPEI-6) and annual (SPEI-12) drought indices, indicating that vegetation dynamics respond to climatic variability. However, the strength of this relationship varied among vegetation types, reflecting differences in sensitivity to drought conditions (Fig. 13). Cereals mixed with other species refer to agricultural areas where cereals are cultivated together with other crops, such as legumes, maize and alfalfa (Medicago sativa), (displayed the highest correlation coefficient with the SPEI on an annual scale (r = 0.51), followed by palm trees (r = 0.48) and argan trees (r = 0.36). Conversely, cereals showed weak relationships with SPEI on both time scales.
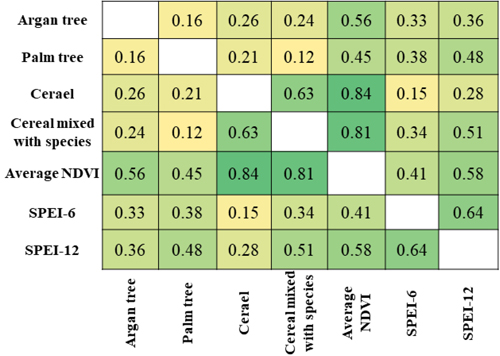
Fig. 13. Pearson correlation coefficient matrix of drought indicators. Cereal mixed with species (cereals are cultivated together with other crops, such as legumes, maize and alfalfa (Medicago sativa)). SPEI-6: Standardized Precipitation Evapotranspiration Index at 6 months; SPEI-12: Standardized Precipitation Evapotranspiration Index at 12 months.
4 Discussion
4.1 Dought dynamics in the GIAHS
This study investigates drought effects on agriculture and livelihoods in a traditional agro-sylvo-pastoral heritage system of the south of the Mediterranean. To this end, an approach integrating climate, satellite, and ground data was adopted to better understand the impact of climatic conditions on the spatio-temporal distribution of vegetation over the period 2000–2020. Findings highlight an intensification of climatic variability in recent years. This pattern is characterized by a decrease in precipitation and higher temperatures clearly illustrated in Fig. 4. These findings demonstrate the trend towards a hotter and drier climate in southwest Morocco and North Africa. While fluctuations in temperature and precipitation patterns provide valuable insights into climate dynamics (Figs. 5,6), they also influence the occurrence and severity of meteorological drought. Using the SPEI-3 and SPEI-6 as an index of meteorological drought indicates that the decreasing trend in negative SPEI values leads to a decrease in vegetation in the region, notably in the form of expansion of agricultural lands.
Accordingly, previous research concluded the mounting of the drought risks and its impact on livelihoods (Khomsi et al. 2015). Other studies (Ouhamdouch and Bahir 2017; Tanarhte et al. 2024) have also noted a significant decrease in precipitation in southern Morocco, which aligns with our results. Spatially, a trend towards decreased precipitation and increased temperatures has been observed over the last four decades, with more pronounced variations in the North than in the South (Fig. 5). Additionally, an increase in temperatures and a decrease in precipitation during the rainy seasons have been particularly notable in our study region, distinctly in Tafraout and Ait Souab (Fig. 6). Furthermore, a trend towards increased precipitation in autumn has been observed, suggesting a shift in the rainy season from winter and spring to autumn, consistent with previous studies (Acharki et al. 2019; Hakam et al. 2022).
4.2 Changes in the landscape
This work shows the climate effects on LULC changes over the past decades. Despite the modest changes, in a dry and highly arid environment like the GIAHS site, the reduction of small amounts of vegetation is an indicator of the impact of drought conditions. NDVI of the cereals showed a downward trend, whereas the NDVI time series for palm trees and argan trees showed a non-significant increase. This can be interpreted by the relative resilience of these species to difficult climatic conditions and droughts. Furthermore, field investigations revealed the contribution of other factors to argan and palm degradation, including soil erosion, fires, and the lack of adaptation of soil and water conservation methods in high-altitude areas, such as terraces. For instance, Ziyadi et al. (2019) identified the significant climatic and social challenges facing TAS (Terraced Agroforestry System) in the Anti-Atlas region. Regional climate change scenarios forecast warmer and drier conditions for the area as shown in Fig. 14. At the social level, the new generation of local communities shows declining interest in maintaining TAS and increasingly seeks opportunities in the Souss-Massa plain cities. Moreover, the decline of the rural population and mass immigration to neighboring cities is also a direct socio-economic issue involved in ecosystem degradation. The population of all rural mountainous communes of the GIAHS shows a decrease from 1994 to 2025 according to the official consensus (MHPV 2017).
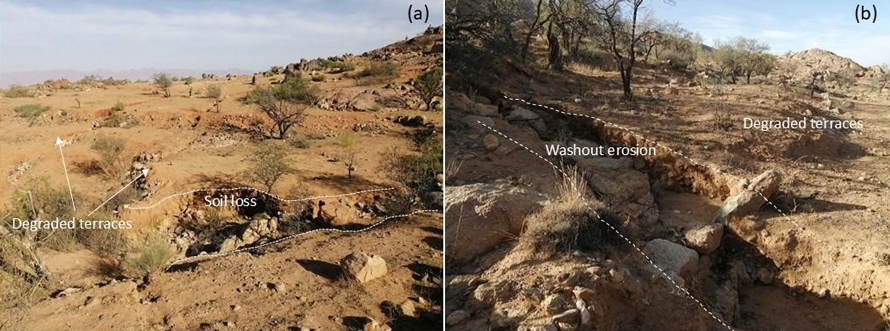
Fig. 14. Illustration of the impact of abandon on terraces: (a) soil loss and degraded terraces (b) Water erosion in the Southeast of the GIAHS. Credit: Moussa Ait El Kadi.
On several scales, LULC changes are influenced by a complex interplay of biophysical and human factors, including extreme weather events and anthropogenic activities (Wang et al. 2023). In 2022, Karmaoui et al. (2022a) identified a series of natural and economic factors driving LULC changes in the semi-arid region of Morocco. They found that the pressure on natural resources, particularly groundwater, and soil quality is at risk due to ongoing land development. In addition, Hadri et al. 2021, studied the effect of meteorological drought on vegetation and crop response in the Chichaoua-Mejjate basin. The analysis indicates an upward trend in drought, with the vegetation activity heavily influenced by drought. Thus, Highlights uncertainties in drought monitoring due to irrigation and a weak correlation between SPI and SWI, affected by overexploitation of the aquifer and extensive irrigation. In a similar context, Moumane et al. (2022) revealed a significant expansion of desertified lands (+168.09%) between 1991 and 2021. Moreover, the oasis of Ait Mansour has experienced significant desertification related to human and natural factors. For instance, due to extreme heat events and non-responsible citizen practices, the palm grove of this oasis has deteriorated because of fire incidents. Field visits in February and May 2023 allowed us to document these events as it is reported in Fig. 15.
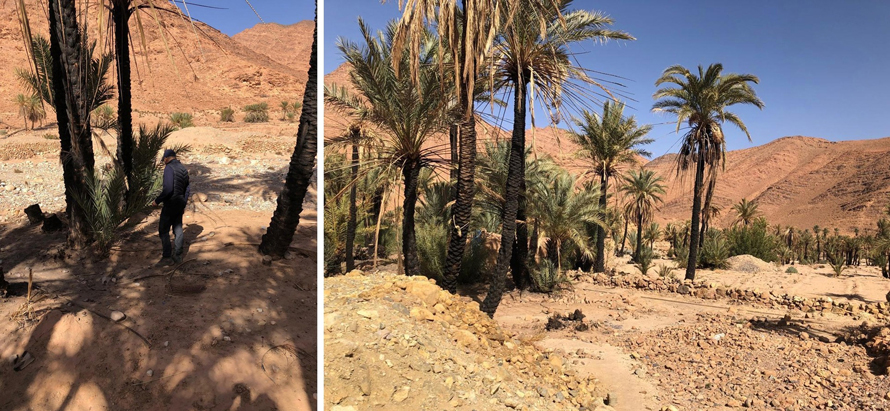
Fig. 15. Palm trees threatened by fire in Ait Mansour Oasis. Credit: Brahim Meskour.
Future drought threats are not solely driven by climate change but also involve social factors (Elkouk et al. 2022; Karmaoui et al. 2022b). In this region, local communities depend on traditional agriculture, where Argan trees are a primary source of income. Agricultural practices have been severely impacted by prolonged droughts, water scarcity, soil erosion, and migrations (Le Polain De Waroux and Lambin 2012).
4.3 Challenges and insights for resilience
Despite prolonged periods of drought in the region, endemic species have shown remarkable resilience. For example, the argan tree can survive water deficits and extreme precipitation fluctuations through a series of morphological, anatomical, physiological, and metabolic mechanisms (Soufiani et al. 2023). These adaptations include maintaining relatively high water content in their leaves, enabling them to withstand prolonged periods of drought. However, the local agricultural sector has been severely impacted by frequent and severe droughts since the 1980s.
The Argan ecosystem would benefit from research and innovation to improve its resilience and recover from drought events. For instance, Genin et al. (2017) explored the association of prickly pear and argan plantation and showed significant improvement in the soil organic matter and the development of argan plantation. In addition to species association, the use of fogger shrubs can be considered in the restoration of arid agro-pastoral land (Zucca et al. 2011). While the regeneration efforts face water scarcity issues, non-conventional water (fog and stormwater, reclaimed water) could be a valid option in the Anti-atlas context (Hussein et al. 2019; Ait el Kadi et al. 2024), as highlighted by Castelli et al. (2019), who stressed how water collection and landscape restoration might improve mesoclimate regulation in dryland agroecosystems. Furthermore, Boselli et al. (2020) demonstrated that in the Assaragh site of the Anti-Atlas, the abandonment of terraced agroecosystems is primarily driven by social rather than climatic factors, highlighting the need for integrative, community-centered interventions to preserve agrobiodiversity and resilience. These findings align with our study, suggesting that reinforcing traditional knowledge and local governance can be pivotal for the sustainability of GIAHS sites under increasing environmental pressures.
This study serves as a preliminary investigation into drought as an environmental shock and its impact on an arid agro-sylvo-pastoral system. However, future research efforts should integrate the social dimension to better understand the dynamic between social and environmental shocks and explore drought adaptation pathways.
5 Conclusion
This study provides a comprehensive spatial and temporal analysis of drought as an environmental shock in the GIAHS site based on the agro-sylvo-pastoral system. The integration of land use land cover (LULC) and change metrics in assessing spatio-temporal variability of drought severity proves highly effective. Utilizing remote sensing-based vegetation time series metrics, alongside drought indices and climatological indices, enabled a nuanced understanding of ecosystem dynamics. Landsat satellite imagery (Thematic Mapper, Enhanced Thematic Mapper Plus, and Operational Land Imager) facilitated detailed LULC mapping, while the Mann-Kendall test and Sen’s slope estimator revealed significant trends in SPEI and NDVI variability.
The results showed a substantial decrease in agricultural and woodland areas, with the surface of woodland and agriculture decreasing by 43.28% and 47.35% from 1983 to 2020. Additionally, the NDVI for key species such as the Argan tree, cereal, palm tree, and mixed cereals displayed significant annual and seasonal negative trends, indicating deteriorating vegetation health. The SPEI-6 and SPEI-12 indices demonstrated a consistent decline, reflecting an increasing drought trend over time. Notably, temperature increased by 0.2 °C, while precipitation decreased by –1.5 mm yr–1, further intensifying drought conditions.
These findings underscore the compounded impact of environmental shocks namely, decreasing land cover, rising temperatures, and diminishing precipitation on the agro-sylvo-pastoral system. The projected increase in drought intensity and frequency is expected to exacerbate the ecosystem’s degradation, posing significant challenges for future resilience.
This work establishes a foundational baseline for proposing an Integrated Drought Management (IDM) framework tailored to North Africa’s drylands. The insights derived from this study are vital for agro-ecosystem stakeholders, offering actionable guidance to bolster the resilience of the GIAHS site. By proactively addressing these environmental challenges, stakeholders can implement strategic interventions to safeguard and sustain the socio-ecological integrity of this globally important agricultural heritage system.
Declaration of openness of research materials
The research materials, data, and code used in this study are openly available in https://github.com/brahimmeskour/GEE-code-classification-.git.
Acknowledgments
The authors express their appreciation to the representation of Institut de recherche pour le development (IRD) in Morocco for its support.
Funding
This work received financial support through the partners of the Joint Call of the Co-fund ERA-NETs SUSFOOD2 (Grant N° 727,473) and FOSC (Grant N° 862,555). This paper presents part of the outputs of the MedAgriFood Resilience project.
This paper presents part of the outputs of the DIONYSUS project supported and funded under Horizon 2020, the European Union’s Framework Programme for Research and Innovation in the Mediterranean Areas (PRIMA-S1).
The first author thanks the CNRST through the “PhD-Associate Scholarship – PASS” Program.
Author contribution statement
The authors confirm contribution to the paper as follows:
Methodology, conception and study design: B. Meskour, L. Adnane, M. Ait el Kadi, M. Hssaisoune, O. Hakam, V. Ongoma, M. El Hafayni; Data collection: B. Meskour, M. Hssaisoune, A. Tairi, M. Ait el Kadi; Analysis and interpretation of results: B. Meskour, A. Labbaci, M. Ait el Kadi, V. Ongoma, O. Hakam, M. El Hafyani; First draft: B. Meskour, V. Ongoma, O. Hakam, M. Ait el Kadi, M. El Hafyani, M. Hssaisoune; Supervision: L. Bouchaou, A. Labbaci, M. Hssaisoune, V. Ongoma; Writing – review and editing: B. Meskour, A. Labbaci, M. Ait el Kadi, V. Ongoma, M. Hssaisoune, O. Hakam, M. El Hafyani, L. Bouchaou; Project administration: L. Bouchaou, L. Adnane, M. Hssaisoune; Funding acquisition: L. Bouchaou.
All authors reviewed and approved the final version of the manuscript.
References
Abahous H, Ronchail J, Sifeddine A, Kenny L, Bouchaou L (2018) Trend and change point analyses of annual precipitation in the Souss-Massa region in Morocco during 1932–2010. Theor Appl Climatol 134: 1153–1163. https://doi.org/10.1007/s00704-017-2325-0.
Acharki S, Amharref M, El Halimi R, Bernoussi A-S (2019) Évaluation par approche statistique de l’impact des changements climatiques sur les ressources en eau: application au périmètre du Gharb (Maroc). [Assessment by statistical approach of climate change impact on water resources: application to the Gharb perimeter (Morocco)]. Rev Sci Eau 32: 291–315. https://doi.org/10.7202/1067310ar.
Ait Brahim Y, Seif-Ennasr M, Malki M, N’da B, Choukrallah R, El Morjani Z, Sifeddine A, Abahous H, Bouchaou L (2016) Assessment of climate and land use changes: impacts on groundwater resources in the Souss-Massa River Basin. In: Choukrallah R, Ragab R, Bouchaou L, Barceló D (eds) The Souss-Massa River Basin, Morocco. The Handbook of Environmental Chemistry, vol 53. Springer, Cham. https://doi.org/10.1007/698_2016_71.
Ait Brahim Y, Cheng H, Sifeddine A, Wassenburg JA, Cruz FW, Khodri M, Sha L, Pérez-Zanón N, Beraaouz EH, Apaéstegui J, Guyot J-L, Jochum KP, Bouchaou L (2017) Speleothem records decadal to multidecadal hydroclimate variations in southwestern Morocco during the last millennium. Earth Planet Sci Lett 476: 1–10. https://doi.org/10.1016/j.epsl.2017.07.045.
Ait El Haj F, Ouadif L, Akhssas A (2023) Monitoring land use and land cover change using remote sensing techniques and the precipitation-vegetation indexes in Morocco. Ecol Eng Environ Tech 24: 272–286. https://doi.org/10.12912/27197050/154937.
Ait El Kadi M, Bouchaou L, Castelli G, Re V, Çakmakçı Y, Bresci E, Hssaissone M (2024) Multi-aspect assessment of operational fog collection systems: a rural development perspective, insights from the Sidi Ifni project in Morocco. J Arid Environ 222, article id 105174. https://doi.org/10.1016/j.jaridenv.2024.105174.
Ashouri H, Hsu K, Sorooshian S, Braithwaite DK, Knapp KR, Cecil LD, Nelson BR, Prat OP (2015) PERSIANN-CDR: daily precipitation climate data record from multisatellite observations for hydrological and climate studies. Bull Am Meteorol Soc 96: 69–83. https://doi.org/10.1175/BAMS-D-13-00068.1.
Ayugi B, Eresanya EO, Onyango AO, Ogou FK, Okoro EC, Okoye CO, Anoruo CM, Dike VN, Ashiru OR, Daramola MT, Mumo R, Ongoma V (2022) Review of meteorological drought in Africa: historical trends, impacts, mitigation measures, and prospects. Pure Appl Geophys 179: 1365–1386. https://doi.org/10.1007/s00024-022-02988-z.
Baqloul A, Schefuß E, Kölling M, Dupont L, Groeneveld J, Zhao X, Reddad H, Bouchaou L, Bouimetarhan I (2021) Climate and land-use effects on hydrological and vegetation signals during the last three millennia: evidence from sedimentary leaf waxes in southwestern Morocco. Holocene 31: 699–708. https://doi.org/10.1177/0959683620988053.
Baqloul A, Tadoumant S, Bouchaou L, Hssaisoune M, Bouimetarhan I (2024) Holocene climate variability in Morocco: a comprehensive analysis of environmental and societal impacts. Frontiers in Science and Engineering, International Journal 13: 47–54.
Barkaoui M, Msanda F, Boubaker H, El-Boullani R, Asri OE, Chokri A, El-Yaagoubi M, Koutaya A, Eloirdi A, Arifi K, Chahboune M (2022) Ethnobotany, traditional knowledge, and nutritional value of argan (Argania spinosa (L.) Skeels) in Western Anti-Atlas of Morocco. Braz J Biol 84, article id e260477. https://doi.org/10.1590/1519-6984.260477.
Beguería S, Vicente-Serrano SM, Reig F, Latorre B (2014) Standardized precipitation evapotranspiration index (SPEI) revisited: parameter fitting, evapotranspiration models, tools, datasets and drought monitoring. Int J Climatol 34: 3001–3023. https://doi.org/10.1002/joc.3887.
Beroho M, Briak H, Cherif EK, Boulahfa I, Ouallali A, Mrabet R, Kebede F, Bernardino A, Aboumaria K (2023) Future scenarios of land use/land cover (LULC) based on a CA-Markov simulation model: case of a Mediterranean watershed in Morocco. Remote Sens 15, article id 1162. https://doi.org/10.3390/rs15041162.
Bouaakkaz B, Morjani ZEA, Elkouk A, Bouchaou L (2020) Mapping land cover from Sentinel-2A using support vector classifier and random forest regressor in the Souss Basin Morocco. In: Ezziyyani M (ed) Advanced Intelligent Systems for Sustainable Development (AI2SD’2019). Advances in Intelligent Systems and Computing, vol 1104. Springer, Cham. https://doi.org/10.1007/978-3-030-36671-1_32.
Bouchaou L, Tagma T, Boutaleb S, Hssaisoune M, El Morjani ZEA (2011) Climate change and its impacts on groundwater resources in Morocco: the case of the Souss-Massa basin. In: Treidel H, Martin-Bordes JL, Gurdak JJ (eds) Climate change effects on groundwater resources: a global synthesis of findings and recommendations. CRC Press. https://doi.org/10.1201/b11611.
Bouchaou L, Choukr-Allah R, Hirich A, Seif-Ennasr M, Malki M, Abahous H, Bouaakaz B, Nghira A (2017) Climate change and water valuation in Souss-Massa region: management and adaptive measures. European Water 60: 203–209.
Boudhar A, Baba WM, Marchane A, Ouatiki H, Bouamri H, Hanich L, Chehbouni A (2022) Water resources monitoring over the Atlas Mountains in Morocco using satellite observations and reanalysis data. In: Adelabu S, Ramoelo A, Olusola A, Adagbasa E (eds) Remote sensing of African mountains. Springer, Cham. https://doi.org/10.1007/978-3-031-04855-5_8.
Breiman L (2001) Random forests. Mach Learn 45: 5–32. https://doi.org/10.1023/A:1010933404324.
Castelli G, Castelli F, Bresci E (2019) Mesoclimate regulation induced by landscape restoration and water harvesting in agroecosystems of the horn of Africa. Agr Ecosyst Environ 275: 54–64. https://doi.org/10.1016/j.agee.2019.02.002.
Chakhchar A, Ben Salah I, El Kharrassi Y, Filali-Maltouf A, El Modafar C, Lamaoui M (2022) Agro-fruit-forest systems based on argan tree in Morocco: a review of recent results. Front Plant Sci 12, article id 783615. https://doi.org/10.3389/fpls.2021.783615.
Chbouki N (1992) Spatio-temporal characteristics of drought as inferred from tree-ring data in Morocco. PhD Thesis, The University of Arizona, USA.
Congalton RG (1991) A review of assessing the accuracy of classifications of remotely sensed data. Remote Sens Environ 37: 35–46. https://doi.org/10.1016/0034-4257(91)90048-B.
Cook BI, Anchukaitis KJ, Touchan R, Meko DM, Cook ER (2016) Spatiotemporal drought variability in the Mediterranean over the last 900 years. J Geophys Res Atmos 121: 2060–2074. https://doi.org/10.1002/2015JD023929.
Croitoru L, Sarraf M (2010) The cost of environmental degradation: case studies from the Middle East and North Africa (Farsi). Directions in Development | Environment. World Bank Group, Washington, D.C. http://documents.worldbank.org/curated/en/319151563877497857.
Driouech F, Stafi H, Khouakhi A, Moutia S, Badi W, ElRhaz K, Chehbouni A (2021) Recent observed country-wide climate trends in Morocco. Int J Climato 41: E855–E874. https://doi.org/10.1002/joc.6734.
Elkouk A, El Morjani ZEA, Pokhrel Y, Chehbouni A, Sifeddine A, Thober S, Bouchaou L (2021) Multi-model ensemble projections of soil moisture drought over North Africa and the Sahel region under 1.5, 2, and 3 °C global warming. Clim Change 167, article id 52. https://doi.org/10.1007/s10584-021-03202-0.
Elkouk A, Pokhrel Y, Satoh Y, Bouchaou L (2022) Implications of changes in climate and human development on 21st-century global drought risk. J Environ Manag 317, article id 115378. https://doi.org/10.1016/j.jenvman.2022.115378.
Filho WL, Wall T, Salvia AL, Dinis MAP, Mifsud M (2023) The central role of climate action in achieving the United Nations’ Sustainable Development Goals. Sci Rep 13, article id 20582. https://doi.org/10.1038/s41598-023-47746-w.
Gao B-C (1996) NDWI – a normalized difference water index for remote sensing of vegetation liquid water from space. Remote Sens Environ 58: 257–266. https://doi.org/10.1016/S0034-4257(96)00067-3.
Genin M, Alifriqui M, Fakhech A, Hafidi M, Ouahmane L, Genin D (2017) Back to forests in pre-Saharan Morocco? When prickly pear cultivation and traditional agropastoralism reduction promote argan tree regeneration. Silva Fenn 51, article id 1618. https://doi.org/10.14214/sf.1618.
Hadri A, Saidi MEM, Boudhar A (2021) Multiscale drought monitoring and comparison using remote sensing in a Mediterranean arid region: a case study from west-central Morocco. Arab J Geosci 14, article id 118. https://doi.org/10.1007/s12517-021-06493-w.
Hakam O, Baali A, El Kamel K, Ahouach Y, Azennoud K (2022) Comparative evaluation of precipitation-temperature based drought indices (DIs): a case study of Moroccan Lower Sebou basin. Kuwait J Sci 49, article id 695. https://doi.org/10.48129/kjs.13911.
Hakam O, Ongoma V, Beniaich A, Meskour B, El Kadi MA, Brouziyne Y, Hssaisoune M, Tairi A, Labbaci A, Bouchaou L (2024) Assessment of the impact of climate change on Argan tree in the Mediterranean GIAHS site, Morocco: current and future distributions. Model Earth Syst Env 10: 5529–5552. https://doi.org/10.1007/s40808-024-02077-1.
Hamdani N, Baali A (2020) Characterization of groundwater potential zones using analytic hierarchy process and integrated geomatic techniques in Central Middle Atlas (Morocco). Appl Geomat 12: 323–335. https://doi.org/10.1007/s12518-020-00300-z.
Han J, Singh VP (2023) A review of widely used drought indices and the challenges of drought assessment under climate change. Environ Monit Assess 195, article id 1438. https://doi.org/10.1007/s10661-023-12062-3.
HCP (2023) Rural migrants in Morocco: a confirmation of the feminization of the exodus and a selection of the most enterprising young people. Rapport Brefs du Plan 22. High Commission for Planning, Rabat, Morocco.
Hssaisoune M, Bouchaou L, Sifeddine A, Bouimetarhan I, Chehbouni A (2020) Moroccan groundwater resources and evolution with global climate changes. Geosciences 10, article id 81. https://doi.org/10.3390/geosciences10020081.
Huete AR (1988) A soil-adjusted vegetation index (SAVI). Remote Sens Environ 25: 295–309. https://doi.org/10.1016/0034-4257(88)90106-X.
Hussain MI, Muscolo A, Farooq M, Ahmad W (2019) Sustainable use and management of non-conventional water resources for rehabilitation of marginal lands in arid and semiarid environments. Agric Water Manag 221: 462–476. https://doi.org/10.1016/j.agwat.2019.04.014.
Karmaoui A, Ben Salem A, El Jaafari S, Chaachouay H, Moumane A, Hajji L (2022a) Exploring the land use and land cover change in the period 2005–2020 in the province of Errachidia, the pre-sahara of Morocco. Front Earth Sci 10, article id 962097. https://doi.org/10.3389/feart.2022.962097.
Karmaoui A, El Jaafari S, Chaachouay H, Hajji L (2022b) The socio-ecological system of the pre-Sahara zone of Morocco: a conceptual framework to analyse the impact of drought and desertification. GeoJournal 87: 4961–4974. https://doi.org/10.1007/s10708-021-10546-8.
Kendall MG (1975) Rank correlation methods, 4th edition. Charles Griffin, London.
Khettouch A, Hssaisoune M, Hermans T, Aouijil A, Bouchaou L (2023) Ground validation of satellite-based precipitation estimates over poorly gauged catchment: the case of the Drâa basin in Central-East Morocco. Med Geosci Rev 5: 159–175. https://doi.org/10.1007/s42990-023-00108-0.
Khomsi K, Mahe G, Tramblay Y, Sinan M, Snoussi M (2015) Trends in rainfall and temperature extremes in Morocco. Nat Hazards Earth Syst Sci Discuss 3: 1175–1201. https://doi.org/10.5194/nhessd-3-1175-2015.
Labbaci A, Bouchaou L (2021) Assessing land degradation and sensitivity to desertification using MEDALUS model and Google Earth Engine in a semi-arid area in Southern Morocco: case of Draa watershed. Frontiers in Science and Engineering, International Journal 11: 75–88.
Le Polain De Waroux Y, Lambin EF (2012) Monitoring degradation in arid and semi-arid forests and woodlands: the case of the argan woodlands (Morocco). Appl Geogr 32: 777–786. https://doi.org/10.1016/j.apgeog.2011.08.005.
Liu Q, Yang S, Li S, Zhang H, Zhang J, Fan H (2024) The optimal applications of scPDSI and SPEI in characterizing meteorological drought, agricultural drought and terrestrial water availability on a global scale. Sci Total Environ 952, article id 175933. https://doi.org/10.1016/j.scitotenv.2024.175933.
Mann HB (1945) Nonparametric tests against trend. Econometrica 13: 245–259. http://www.jstor.org/stable/1907187.
MHPV (2017) Regional monograph on the housing sector and urban policy.
M’hirit O, Benzyane M, Benchekroun F, El Yousfi SM, Bendaanoun M (1998) L’Arganier: Une espèce fruitière-forestière à usages multiples. [L’Argeanier, a fruit-forest species with multiple uses]. ISBN 978-2870096840.
Ming D, Zhou T, Wang M, Tan T (2016) Land cover classification using random forest with genetic algorithm-based parameter optimization. J Appl Remote Sens 10, article id 035021. https://doi.org/10.1117/1.JRS.10.035021.
Mohajane M, Essahlaoui ALI, Oudija F, Hafyani ME, Hmaidi AE, Ouali AE, Teodoro AC (2018) Land use/land cover (LULC) using Landsat data series (MSS, TM, ETM+ and OLI) in Azrou Forest, in the Central Middle Atlas of Morocco. Environments 5, article id 131. https://doi.org/10.3390/environments5120131.
Moneo M, Iglesias A (2007) Description of drought management actions [Part 1. Components of drought planning. 1.3. Methodological component]. In : Iglesias A, Moneo M, LópezFrancos A (eds) Drought management guidelines technical annex. Options Méditerranéennes, Série B. Etudes et Recherches 58: 175–196. CIHEAM / EC MEDA Water, Zaragoza.
Moumane A, Al Karkouri J, Benmansour A, El Ghazali FE, Fico J, Karmaoui A, Batchi M (2022) Monitoring long-term land use, land cover change, and desertification in the Ternata oasis, Middle Draa Valley, Morocco. Remote Sens Appl: Soc Environ 26, article id 100745. https://doi.org/10.1016/j.rsase.2022.100745.
Muñoz-Sabater J, Dutra E, Agustí-Panareda A, Albergel C, Arduini G, Balsamo G, Boussetta S, Choulga M, Harrigan S, Hersbach H (2021) ERA5-Land: a state-of-the-art global reanalysis dataset for land applications. Earth Syst Sci Data13: 4349–4383. https://doi.org/10.5194/essd-13-4349-2021.
Opedes H, Mücher S, Baartman JE, Nedala S, Mugagga F (2022) Land cover change detection and subsistence farming dynamics in the fringes of Mount Elgon National Park, Uganda from 1978–2020. Remote Sens 14, article id 2423. https://doi.org/10.3390/rs14102423.
Ouhamdouch S, Bahir M (2017) Climate change impact on future rainfall and temperature in semi-arid areas (Essaouira Basin, Morocco). Environ Process 4: 975–990. https://doi.org/10.1007/s40710-017-0265-4.
Pérez-Cutillas P, Salhi A (2024) Long-term hydroclimatic projections and climate change scenarios at regional scale in Morocco. J Environ Manag 371, article id 123254. https://doi.org/10.1016/j.jenvman.2024.123254.
Pischke F, Stefanski R (2016) Drought management policies – from global collaboration to national action. Water Policy 18: 228–244. https://doi.org/10.2166/wp.2016.022.
Rodriguez-Galiano VF, Ghimire B, Rogan J, Chica-Olmo M, Rigol-Sanchez JP (2012) An assessment of the effectiveness of a random forest classifier for land-cover classification. ISPRS J Photogramm Remote Sens 67: 93–104. https://doi.org/10.1016/j.isprsjprs.2011.11.002.
Rouse JW Jr, Haas RH, Deering DW, Schell JA, Harlan JC (1974) Monitoring the vernal advancement and retrogradation (green wave effect) of natural vegetation. NASA Technical Report No. E75-10354.
Saddik A, Hssaisoune M, Belaqziz S, Labbaci A, Tairi A, Meskour B, Bouchaou L (2024) Assessing the health and yield of argan trees in Morocco’s unique ecosystem: a multispectral and machine learning approach. Int J Remote Sens 45: 9192–9220. https://doi.org/10.1080/01431161.2024.2407560.
Santoro A, Ongoma V, Ait El Kadi M, Piras F, Fiore B, Bazzurro A, Romano F, Meskour B, Hssaisoune M, Labbaci A, Tairi A, Chfadi T, Bouchaou L (2023) Innovation of argan (Argania spinosa (L.) Skeels) products and byproducts for sustainable development of rural communities in Morocco: a systematic literature review. Biodivers Conserv 32: 1231–1258. https://doi.org/10.1007/s10531-023-02691-y.
Sen PK (1968) Estimates of the regression coefficient based on Kendall’s tau. J Am Stat Assoc 63: 1379–1389. https://doi.org/10.1080/01621459.1968.10480934.
Soufiani M, Chakhchar A, Aissam S, Ferradous A, Douira A, Meddich A, El Modafar C (2023) Effect of soil drought stress on leaf water status and photosynthetic apparatus in argan seedlings (Argania spinosa). Plant Biosyst 157: 1029–1037. https://doi.org/10.1080/11263504.2023.2238714.
Sun Z, Ma R, Wang Y (2009) Using Landsat data to determine land use changes in Datong basin, China. Environ Geol 57: 1825–1837. https://doi.org/10.1007/s00254-008-1470-2.
Swearingen W, Bencherifa A (2000) An assessment of the drought hazard in Morocco. In: Wilhite DA (ed) Drought: a global assessment. Routledge, pp 279–286. ISBN 0-415-16833-3.
Tadoumant S, Bouimetarhan I, Baqloul A, Hssaisoune M, Reddad H, Bouchaou L (2022) Modern pollen distribution and its relationship with environmental gradient in southern Morocco. Rev Palaeobot Palynol 298, article id 104595. https://doi.org/10.1016/j.revpalbo.2021.104595.
Tadoumant S, Baqloul A, Hssaisoune M, Bouchaou L (2024) Climate change impact on endemic species in central Morocco. Frontiers in Science and Engineering, International Journal 13: 131–142.
Tairi A, Bentahar Z, Hssaisoune M, Meskour B, Ait El Kadi M, Bouchaou L (2024) Assessing the effects of agricultural terracing on water erosion rates using the RUSLE model in the Targa-n-Touchka watershed, Morocco. Frontiers in Science and Engineering, International Journal 13: 55–67.
Tanarhte M, De Vries A, Zittis G, Chfadi T (2024) Severe droughts in North Africa: a review of drivers, impacts and management. Earth Sci Rev 259, article id 104701. https://doi.org/10.1016/j.earscirev.2024.104701.
UN (2016) Land degradation neutrality in the Arab region – preparing for SDG implementation. United Nations Economic and Social Commission for Western Asia. https://www.unescwa.org/publications/land-degradation-neutrality-arab-region-preparing-sdg-implementation. Accessed 10 Nov 2024.
UNCCD (2023) UNCCD data dashboard. https://data.unccd.int/. Accessed 18 May 2024.
UNESCO (2018) Arganeraie Biosphere Reserve, Morocco. UNESCO. https://www.unesco.org/en/mab/arganeraie.
Van Loon AF (2015) Hydrological drought explained. WIREs Water 2: 359–392. https://doi.org/10.1002/wat2.1085.
Verner D, Treguer D, Redwood J, Christensen J, McDonnell R, Elbert C, Konishi Y, Belghazi S (2018) Climate variability, drought, and drought management in Morocco’s agricultural sector. World Bank Group.
Vicente-Serrano SM, Beguería S, López-Moreno JI (2010) A multiscalar drought index sensitive to global warming: the standardized precipitation evapotranspiration index. J Clim 23: 1696–1718. https://doi.org/10.1175/2009JCLI2909.1.
Wang H, Liu Y, Wang Y, Yao Y, Wang C (2023) Land cover change in global drylands: a review. Sci Total Environ 863, article id 160943. https://doi.org/10.1016/j.scitotenv.2022.160943.
Wilhite DA (2017) National drought management policy guidelines: a template for action. In: Wilhite DA, Pulwarty R (eds) Drought and water crises: integrating science, management, and policy. CRC Press, pp 55–94.
WMO, GWP (2016) Handbook of drought indicators and indices. Svoboda M, Fuchs BA (eds). Integrated Drought Management Programme (IDMP), Integrated Drought Management Tools and Guidelines Series 2. Geneva, Switzerland.
World Bank (2023) Droughts and deficits: the impact of water scarcity on economic growth. https://www.worldbank.org/en/news/immersive-story/2023/09/12/droughts-and-deficits-the-global-impacts. Accessed 2 Mar 2024.
Zha Y, Gao J, Ni S (2003) Use of normalized difference built-up index in automatically mapping urban areas from TM imagery. Int J Remote Sens 24: 583–594. https://doi.org/10.1080/01431160304987.
Zucca C, Julitta F, Previtali F (2011) Land restoration by fodder shrubs in a semi-arid agro-pastoral area of Morocco: effects on soils. Catena 87: 306–312. https://doi.org/10.1016/j.catena.2011.06.017.
Total of 83 references.
