Atte Kumpu  ,
Mikko Peltoniemi,
Martin Forsius,
Annikki Mäkelä
,
Mikko Peltoniemi,
Martin Forsius,
Annikki Mäkelä
Soil carbon and nitrogen in unmanaged forests in Southern and Eastern Finland
Kumpu A., Peltoniemi M., Forsius M., Mäkelä A. (2025). Soil carbon and nitrogen in unmanaged forests in Southern and Eastern Finland. Silva Fennica vol. 59 no. 3 article id 24072. https://doi.org/10.14214/sf.24072
Highlights
- Unmanaged forest soils store more carbon and nitrogen than managed forest soils
- In unmanaged forest soils the carbon and nitrogen storages remain stable over time.
Abstract
Soils have an essential role in ecosystem carbon balance. The soils of natural-like old unmanaged forests have been studied less than those of managed stands. In this study, we collected soil core samples and measured the soil carbon and nitrogen content of 27 old unmanaged forest soils in Southern and Eastern Finland. The results were compared against existing data from managed stands of similar site types. The data was also compared with earlier soil measurements from the same sites to look for any significant changes. The analysis resulted in an average of 2.58, 2.44 and 1.62 kg m-2 of soil carbon and 0.087, 0.097 and 0.074 kg m-2 of nitrogen in the organic layer, 0–10 cm of mineral soil layer and 10–20 cm of mineral soil layer, respectively. Carbon contents in the mineral soil layers were higher in unmanaged forests than in managed forests, but not in the organic-layer. Similarly for nitrogen, there was a significant difference between the unmanaged forests and the managed stands for both mineral soil layers, but not for the organic layer. There were no significant changes in soil carbon or nitrogen contents between the old and new measurements in the old unmanaged forests. The results align with the assumption that carbon and nitrogen content are higher in unmanaged forests than in managed forests due to their higher litter input on average, and more stable and cooler conditions. This means that old unmanaged forests have an important role as carbon storage and that the carbon storage is stable.
Keywords
Norway spruce;
boreal forest;
mineral soil layer;
organic soil layer
-
Kumpu,
University of Helsinki, Department of Forest Sciences, P.O. Box 27, FI-00014 University of Helsinki, Finland
 https://orcid.org/0000-0001-9547-1697
E-mail
atte.kumpu@helsinki.fi
https://orcid.org/0000-0001-9547-1697
E-mail
atte.kumpu@helsinki.fi
- Peltoniemi, Natural Resources Institute Finland (Luke); Bioeconomy and environment, Latokartanonkaari 9, FI-00790 Helsinki, Finland E-mail mikko.peltoniemi@luke.fi
-
Forsius,
Finnish Environment Institute (Syke), Nature solutions, Latokartanonkaari 11, FI-00790 Helsinki, Finland
https://orcid.org/0000-0003-0125-5120
E-mail
martin.forsius@syke.fi
-
Mäkelä,
University of Helsinki, Department of Forest Sciences, P.O. Box 27, FI-00014 University of Helsinki, Finland
https://orcid.org/0000-0001-9633-7350
E-mail
annikki.makela@helsinki.fi
Received 19 December 2024 Accepted 16 November 2025 Published 15 December 2025
Views 24269
Available at https://doi.org/10.14214/sf.24072 | Download PDF

Supplementary Files
1 Introduction
In the discussion concerning the role of forests as carbon sinks and their role with climate change, the focus is often on the living biomass, as the trees themselves have traditionally been the most important product of the forest ecosystem. However, with long-term carbon storage, soil carbon could be a more important factor than the living trees themselves. The earth’s soils have been estimated to contain over 2000 Pg of organic carbon (Batjes 2016), which makes it larger than both the atmospheric pool and the biotic organic carbon pool (Scharlemann et al. 2014; Masson-Delmotte et al. 2021). The carbon storage of forest mineral and peat soils is estimated to be one of the major stocks in Finnish ecosystems, about equal to carbon storage in wetlands and larger than in forest and ground vegetation biomass (Turunen and Valpola 2020; Forsius et al. 2023). The development of this carbon storage is driven by the growth of the forest which, especially in boreal forest, is largely regulated by nitrogen availability (LeBauer and Treseder 2008; Högberg et al. 2017). This means that the amount and availability of soil nitrogen is crucial for the forest ecosystem and therefore directly affects carbon sequestration.
Several studies have reported about the soil carbon and nitrogen levels in managed boreal forests based on forest ecosystem monitoring programmes, such as the UN-ECE ICP Forests Level II programme in Finland (Merilä et al. 2014, 2024) or the Swedish Forest Soil Inventory (Spohn and Stendahl 2022). These and other studies have concluded that both carbon and nitrogen stocks increase with increasing stand fertility (Johnson and Curtis 2001) and are generally lower in the north than in the south (Mäkelä et al. 2022; Merilä et al. 2024). A recent study demonstrated that soil carbon stocks have been increasing in the mature, managed ICP Forests Level II sites in Finland, the increase being faster in stands of higher fertility (Lindroos et al. 2022). On the other hand, it has also been suggested that higher site fertility results in lower carbon content in the organic layer (Vesterdal and Raulund-Rasmussen 1998; Kyaschenko et al. 2017; Kyaschenko et al. 2019) due to faster decomposition rates and different fungal communities.
There is less information about carbon stocks in old unmanaged stands, probably because the proportion of those in the total forest cover has been rather small. The area of protected forest will likely increase in the near future because of recent developments of national and EU-level targets on biodiversity conservation and climate change mitigation (EC 2019, 2020). More information on the development of carbon and nitrogen stocks in stands left unmanaged beyond their commercial rotation age, as well as in true old-growth stands, is therefore in increasing demand.
The level of soil organic carbon is largely determined as a balance between the input of above-ground and below-ground litter, and the decomposition that returns carbon back to the atmosphere (Liski et al. 2005). Export of dissolved organic carbon from managed and pristine forest land to surface waters also forms part of the soil carbon budget (Finér et al. 2021), but this is of relatively minor importance especially when comparing managed and unmanaged upland forests (Johnson 1992; Johnson and Curtis 2001; Mayer et al. 2020). Previous studies have shown that thinnings and clear cuts affect soil respiration by quickly releasing a large quantity of easily decomposable biomass into the forest floor and soil in the form of logging residues (Kolari et al. 2004; Pumpanen et al. 2004; Kumpu et al. 2018), but the effect of this on the soil C balance is short-lived (Kolari et al. 2004). A more persistent difference between managed and unmanaged stands is the accumulation of coarse woody debris, which is very low in managed forests as most of the woody biomass is removed in thinnings and clear cuts (Korhonen et al. 2021). In contrast, in a natural forest dead trees first become deadwood, of which a large portion will eventually end up as soil organic carbon (Siitonen 2001; Korhonen et al. 2021).
Whether or not the additional litter input in the form of deadwood implies a larger carbon stock in natural stands than in managed stands, depends on the total litter input to the soil in the natural stands relative to managed stands, as well as the rate of soil organic matter decomposition. Both of these essentially depend on nitrogen availability to the trees. Environmental conditions mediated by stand structure can influence nitrogen availability through biotic and abiotic processes in ways that are not detectable in the total nitrogen stock of the forest (Van Sundert et al. 2020).
A main difference between the structure of natural and managed stands is that the former are generally more heterogenous both in stand architecture, age distribution and species composition (Smith and Long 2001). Natural stands often consist of dense and open patches with variable light and temperature conditions on the forest floor, which also affect ground vegetation and the moisture conditions in the soil. Temperature and moisture are important factors that influence the rate of decomposition (Lal 2005; Kumpu et al. 2018) as they control soil microbial and fungal activity and thus influence nitrogen availability to trees. While these more favourable environmental conditions may function towards increasing nitrogen availability, the large amount of woody debris stored in the organic layer of an unmanaged stand could lead to an opposite trend, as the decomposition of deadwood binds nitrogen to microbial biomass (Rinne et al. 2016), and the organic layer C:N ratio may generally become larger than in managed stands due to the low N content of the coarse woody litter (Nave et al. 2010; Hume et al. 2017).
In contrast, soil scarification in managed stands can modify soil temperature and moisture conditions as well as the spatial distribution of soil N in ways that favour faster growth after regeneration (Ring and Sikström 2024). The total nitrogen budget is determined by anthropogenic deposition, biological fixation, and leaching (Posch et al. 2019; Salemaa et al. 2020). The inputs of nitrogen should not differ significantly between managed and unmanaged stands, especially in the southern half of Finland where the level of nitrogen deposition is high enough (3–4 mg m–2 yr–1) to block the biological fixation (Salemaa et al. 2019). The crucial question is then: does forest management accelerate nitrogen leaching from forests? Studies have suggested (Johnson and Curtis 2001; Dannenmann et al. 2006), that forest management often causes periodical, short-term nitrogen deposits in to the soil due to logging residues, whereas in an old unmanaged stand, the soil nitrogen input is divided more evenly through the years and is mostly the result of litter-fall. The short-term nitrogen deposit caused by thinnings is most likely used by the remaining trees but in case of clear cuts, it is possible that leaching of nitrogen can occur because of soil scarification (George et al. 2017) although there is evidence that in Finnish conditions nitrogen leaching after clear cuts is minimal (Palviainen et al. 2004). Considering the small anthropogenic input and the likely minimal leaching in the absence of clear cuts, it seems reasonable to assume that the total nitrogen pool of an old unmanaged forest does not decline in the long run.
In Finland, the Natural Resources Institute (Luke) has established a measurement network in unmanaged, natural-like forests in 1990–1996, known as the Lumes-sites. These sites were primarily established in conservation areas that did not show signs of past forest management (Isomäki et al. 1998), although some evidence of human activity, such as old stumps, can be seen in some of the sites. A total of 57 plots in the network have been measured twice for their above-ground characteristics since 1990 (Peltoniemi and Mäkipää 2011), with a subset (27 plots) measured a third time in 2019 (Green 2020; Akujärvi et al. 2025). The soil carbon and nitrogen storage has also been measured in these plots in 2001–2003 (Tamminen and Ilvesniemi 2012) and again in 2021 for this study. This data set provides a unique source for estimating and monitoring natural stands, including soil carbon and nitrogen. For comparison we used the Biosoil data set (Merilä et al. 2014; Mäkelä et al. 2022; Ilvesniemi 2023), which consists of over 600 sample plots from managed forests all across Finland. This data set includes measured soil carbon and nitrogen content for the different organic and mineral soil layers as well as site characteristics for each site.
The objective of this study was to compare the soil carbon and nitrogen storage in unmanaged and managed spruce stands in southern Finland. We estimated the soil carbon and nitrogen storage in the unmanaged stands by collecting and analysing soil core samples and compared the results with similar managed stands from the biosoil Biosoil data set. We also compared the unmanaged data with the old measurements from the same sites (Tamminen and Ilvesniemi 2012) to see if there had been any changes in the soil carbon and nitrogen stocks. We designed our sampling to match the old measurements as close as possible.
Our hypotheses are:
1) Forests outside normal forest management i.e. in unmanaged, natural-like conditions will have larger soil carbon storage than managed forests with similar site characteristics,
2) The total soil nitrogen storage is larger in the old unmanaged stands than in the managed stands,
3) The nitrogen and carbon storage remain stable in old unmanaged stands.
2 Material and methods
2.1 Sites
For this study we used 27 test sites in Southern and Eastern Finland (Fig. 1), which included natural or natural-like stands in national parks, protected areas or in areas reserved for protection. The sites were part of a larger natural forest project (Lumes) established between 1993 and 1996 (Isomäki et al. 1998).
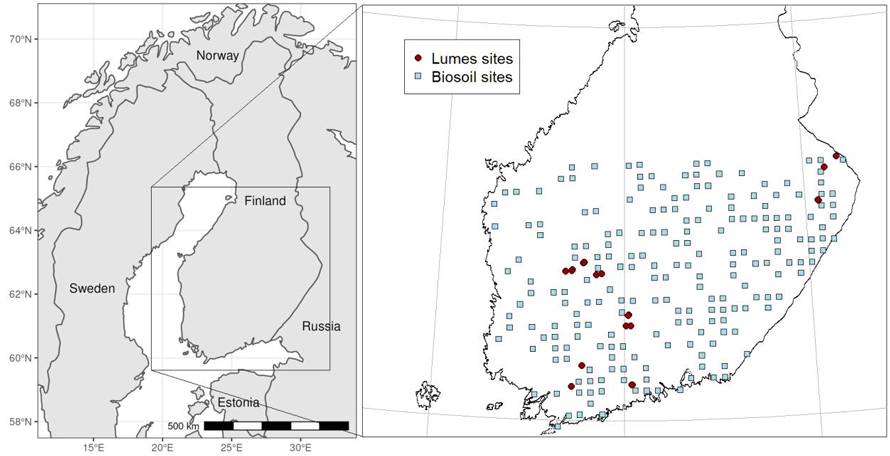
Fig. 1. The locations of the 27 unmanaged Lumes-sites and 206 managed Biosoil-sites that were used for this study. Note that there is some overlap with some of the unmanaged sites.
The sites were mostly spruce (Picea abies (L.) Karst.) dominated stands, with a mix of pine (Pinus sylvestris L.) and broadleaf trees (Betula pendula Roth, Populus tremula L.). The sites were mostly old-growth or uneven-aged structure with a varying volume of deadwood (Isomäki et al. 1998) and with no signs of previous forest management (Peltoniemi and Mäkipää 2010). The test sites were on mineral soils, mostly sandy glacial till, pure sand or silt with mor-type humus. Most of the sites were rocky and some showed signs of paludification. The site specific information about the stand characteristics (Akujärvi et al. 2025) is given in Table 1.
| Table 1. The main characteristics of the standing stock of all the trees in the study sites, with the exception of Dominant species and age that are based on maximum relative basal area. Note that sites PA6C and PA122 are missing from this table as they were not included in the Akujärvi el al. (2025) data. | |||||||
| Site | Height (m) | DBH (cm) | Dominant age (years) | Basal area m2 | Volume m3 | Dominant species | Crown cover |
| JO101 | 22.6 | 26.3 | 175 | 40 | 436 | Picea abies | 57% |
| JO124 | 22.7 | 25.8 | 173 | 41 | 440 | Picea abies | 51% |
| JO135 | 24.8 | 27.8 | 183 | 34 | 390 | Picea abies | 46% |
| JO144 | 24.3 | 22.4 | 123 | 41 | 415 | Picea abies | 65% |
| PA121 | 24.6 | 29.6 | 167 | 33 | 404 | Picea abies | 31% |
| PA131 | 22.9 | 33.2 | 159 | 26 | 297 | Pinus sylvestris | 32% |
| PA132 | 22.9 | 27.4 | 165 | 31 | 342 | Picea abies | 42% |
| PA6 | 24.6 | 26.9 | 161 | 40 | 412 | Picea abies | 46% |
| PA61 | 25.2 | 31.4 | 127 | 65 | 827 | Pinus sylvestris | 56% |
| PA62 | 24.6 | 30.7 | 124 | 55 | 688 | Pinus sylvestris | 50% |
| PA63 | 23.5 | 31.9 | 110 | 58 | 696 | Pinus sylvestris | 55% |
| PA67 | 22.8 | 24.9 | 189 | 28 | 326 | Picea abies | 40% |
| PA7 | 24.3 | 28.3 | 161 | 41 | 446 | Picea abies | 57% |
| PA8 | 25.1 | 30.6 | 156 | 35 | 323 | Picea abies | 46% |
| VA101 | 32.0 | 34.7 | 184 | 27 | 426 | Picea abies | 28% |
| VA109 | 24.1 | 26.7 | 155 | 45 | 544 | Picea abies | 49% |
| VA112 | 22.5 | 18.8 | 168 | 34 | 358 | Picea abies | 57% |
| VA207 | 25.3 | 19.7 | 153 | 20 | 244 | Picea abies | 32% |
| VA209 | 27.6 | 26.8 | 154 | 38 | 433 | Picea abies | 48% |
| VA210 | 28.6 | 31.3 | 171 | 37 | 493 | Pinus sylvestris | 45% |
| VA211 | 27.5 | 24.8 | 133 | 24 | 332 | Picea abies | 31% |
| VA222 | 29.2 | 29.1 | 159 | 36 | 505 | Picea abies | 37% |
| VA228 | 22.9 | 20.5 | 95 | 30 | 335 | Picea abies | 48% |
| VA401 | 26.7 | 31.1 | 200 | 45 | 513 | Picea abies | 51% |
| VA403 | 27.6 | 33.4 | 228 | 44 | 570 | Picea abies | 44% |
2.2 Samples
A steel corer that holds a detachable PVC-core with an inside diameter of 45 mm to hold the soil sample was used to collect the samples during the summer of 2021 from July to early October. A total of 16 core samples were collected from each of the 27 sites. The sampling design was based on old unmanaged Lumes-site measurements (Tamminen and Ilvesniemi 2012) as much as possible to ensure comparability with the existing data. The samples were collected according to a grid starting from the southwest side of the site (Supplementary file S1), where as a rule, every other sample was collected to the depth reaching 20 cm in to the mineral soil and every other reaching to 10 cm. If this was not possible due to high number of stones or because of a too thin layer of soil on top of the bedrock, the deeper sample was taken from the next suitable spot. This resulted in a total of 432 core samples. The cores with the soil samples were sealed in the forest and transported to the laboratory for separation of the different layers and further analyses.
2.3 Laboratory analyses of samples
The core samples were cut into organic layer, 0–10 cm mineral soil, and 10–20 cm mineral soil layer, and the depth of the organic layer was recorded. If any of the mineral samples didn’t measure up to the full 10 cm, the length of the sample was recorded, so that the calculations could be adjusted. Furthermore, the 10–20 cm mineral soil samples were missing five samples completely, due to one test site having very little soil on top of the bedrock. In total, we had 432 organic layer samples, 432 mineral soil samples from the depth of 0–10 cm and 211 mineral soil samples from the depth of 10–20 cm. The samples were stored in cold storage at +8 °C until further processing.
Carbon and nitrogen content of the organic layer, 0–10 cm mineral soil and 10–20 cm mineral soil were measured using a Leco 828-Series Combustion analyser. To prepare the core samples for the analysis, they were dried in +40 °C for at least 48 hours, or until air dry. The dried samples were weighed and sieved through a 2 mm mesh to remove coarse roots and stones and weighed again. The organic layer samples were further ground down with a mortar and pestle to create a homogenous sample for the analysis (Tamminen and Ilvesniemi 2012). A small portion of the finished sample was weighed and enclosed in aluminium foil as a subsample and fed into the combustion analyser to obtain the carbon and nitrogen concentration of the sample.
2.4 Calculations
The carbon and nitrogen contents (g kg–1) were calculated from the subsample elements concentration and the subsample weight. This was calculated from just the sieved part of the sample to keep it comparable with the results reported by Tamminen and Ilvesniemi (2012). The mass of soil carbon and nitrogen in each layer was calculated by multiplying the measured element content by the mass of the sieved soil sample:
![]()
where mL is the mass of carbon or nitrogen of each layer (kg m–2), rcore is the radius of the soil core (m), ρ is either the carbon or nitrogen concentration of the subsample and mss is the mass of the sieved sample (kg). The carbon and nitrogen concentration of the coarse soil fragments was assumed to be zero, this is of course not true, but since the surface area of small stones is small in comparison to sieved soil matter, and because the carbon and nitrogen in small stones are not readily available, we left them out. The coarse soil fragments also included larger bits of roots that hold considerable amounts of carbon and nitrogen that were left out, because if these data were to be used as part of an ecosystem-scale assessment, this part would already be represented in the whole tree biomass carbon and nitrogen storage. The mineral soil samples that were less than 10 cm thick were corrected to correspond to the prescribed sample length. The mass of each test sample was converted to mass per area using the cross-sectional area of the soil corer sample tubes (diameter of 45 mm).
For the total mass of soil carbon and nitrogen per hectare, we had to further take into account the number of larger stones within the soil that were not represented in the soil samples because of their size. For this, we used the so-called stoniness index, i.e., the percentage of large stones in the total volume of soil, which was measured in the sites during previous measurements (Tamminen and Ilvesniemi 2012).
2.5 Comparison dataset
To compare our old unmanaged stands to average managed forests in Finland we used the openly available Biosoil data set (Ilvesniemi 2023), which has been collected in an EU-wide Forest Focus monitoring project during 2006–2007 (ICP Forests Level I) (Merilä et al. 2014). It includes over 600 sample plots across Finland, with measurements of stand characteristics and soil properties in combination with climatic variables from local weather stations. Measured soil properties include an average carbon and nitrogen content for the different organic and mineral soil layers for each site. The data-set also provided stand age information, which allowed us to test the age dependence of soil carbon and nitrogen content in the managed stands. The sampling was based on the Finnish NFI grid (Tomppo et al. 2011) that has been used for permanent sample plots measured from 1985 (Mäkipää and Heikkinen 2003).
We selected managed Biosoil sites with growing conditions similar to our unmanaged sites. This meant that we only included sites from latitudes lower than 63° 16’ and sites that were classified as site types 2 or 3 (Fig. 1), which refers to herb-rich or mesic sites, or OMT and MT (Cajander 1949), consisting of Norway spruce, Scots pine and deciduous dominated forests. This resulted in 213 managed sites, including sites of all ages that are under normal forest management (Table 2). We used these to test if rotation management led to different regional mean soil carbon and nitrogen contents than no management. We did this in two ways: 1) we assumed that the Biosoil network of sample sites was representative of all sites in the region (Fig. 1) and weighted the site means based on site type to correspond with the site type distribution in the unmanaged stands, and 2) we arranged the managed sites in 20-year classes and used the concept of normal forest (Heaps 2015) which refers to rotation forestry applying a constant rotation length with a uniform age distribution between clear cut and rotation length. Here, we assigned equal weights to all 20-year age classes and evaluated the normal forest average for two rotation lengths, 80 and 100 years.
| Table 2. The main characteristics of the managed stands of Biosoil at similar sites by main tree species and age classes. | ||||||||||||
| Age class | Average basal area (m2) | Average height (m) | Number of sites | |||||||||
| Pine | Spruce | Decid. | All | Pine | Spruce | Decid. | All | Pine | Spruce | Decid. | Sum all | |
| 0–19 | 7 | 1 | 2 | 3 | 4.8 | 2.7 | n/a | 4.3 | 8 | 9 | 17 | 34 |
| 20–39 | 23 | 20 | 19 | 21 | 11.9 | 13.1 | 18.8 | 12.8 | 10 | 11 | 5 | 26 |
| 40–59 | 21 | 24 | 22 | 23 | 17.3 | 18.3 | 18.7 | 17.9 | 16 | 19 | 10 | 45 |
| 60–79 | 28 | 28 | 24 | 28 | 23.3 | 22.3 | 22.4 | 22.5 | 5 | 31 | 3 | 39 |
| 80–99 | 26 | 27 | 36 | 27 | 21.8 | 23.7 | n/a | 23.3 | 7 | 23 | 1 | 31 |
| 100–119 | 24 | 27 | 18 | 25 | 21.5 | 23.9 | n/a | 23.3 | 6 | 13 | 1 | 20 |
| 120–140 | 13 | 27 | n/a | 26 | 13.4 | 24.4 | n/a | 23.2 | 1 | 8 | 0 | 9 |
| All | 21 | 24 | 13 | 21 | 16.5 | 20.9 | 19.4 | 19.5 | 53 | 114 | 37 | 204 |
In addition, we wanted to see how our sites had developed during the years, so we compared our results to a set of older measurements from the unmanaged Lumes sites by Tamminen and Ilvesniemi (2012), which included our 27 test sites. These data were collected between 2001 and 2003 and were similar to ours except that the dataset available only included the average carbon and nitrogen stocks for the organic layer and the top 10 cm of the mineral soil layer. When comparing the older data set with our measurements we excluded the 10–20 cm mineral soil layer.
2.6 Statistical tests
We used a two-sided unpaired t-test with unequal variances (Welch’s t-test) to compare the difference of soil carbon and nitrogen contents between our study sites and the comparison data set to see whether the lack of management had any effect on the mass per area of carbon and nitrogen (kg m–2). The weights-package of R (R Core Team 2019) was used to weight the selected managed forest data based on site type to match the site type ratio of the unmanaged data. A two-sided, paired t-test was used to see if the carbon and nitrogen storage of the unmanaged sites soils changed over time (R Core Team 2019). In addition, we studied the within and between sites variation in the 2021 dataset using analysis of variance (R Core Team 2019).
3 Results
3.1 Organic layer
The average thickness of the organic layer was 5.6 cm for our unmanaged sites with considerable differences between sites. The mean organic layer thickness for all sites varied between 2.7 and 13.1 cm (Suppl. file S2), with the individual sample thickness ranging from 1.0 to 26.0 cm. The thickest organic layer samples were usually found in wet spots within certain sites where ground layer was dominated by species of Sphagnum moss and early signs of peat formation could be observed.
3.2 Soil carbon and nitrogen content
According to the soil sample analysis of the sieved samples (< 2 mm) of unmanaged soils, the mean organic layer carbon content was 408.43 g C kg–1 and nitrogen content was 13.46 g N kg–1. These values are very similar to those reported by Tamminen and Ilvesniemi (2012) for organic layer in unmanaged stands: 412 g C kg–1 and 11.5 g N kg–1 across Finland. The results for the mineral soil layers from 0–10 cm and 10–20 cm were 36.76 g C kg–1 and 18.40 g C kg–1 for carbon and 1.44 and 0.83 g N kg–1 for nitrogen (Table 3). The values for 0–10 cm of mineral soil are larger than the national averages from Tamminen and Ilvesniemi (2012) for mineral soil layer (0–10 cm) in natural stands: 20.9 g C kg–1 and 0.89 g N kg–1.
| Table 3. The mean concentrations of soil carbon and nitrogen for samples from the different soil layers in the unmanaged Lumes-sites with their corresponding standard deviations and the number of samples. Note that this analysis only includes soil particles smaller than 2 mm. | ||||||
| Layer | Carbon | Nitrogen | ||||
| g kg–1 | Std. deviation | n | g kg–1 | Std. deviation | n | |
| Organic layer | 408.43 | 78.57 | 431 | 13.46 | 2.96 | 431 |
| Mineral soil 0–10 cm | 36.76 | 28.74 | 432 | 1.44 | 0.90 | 384 |
| Mineral soil 10–20 cm | 18.40 | 11.73 | 211 | 0.83 | 0.51 | 187 |
When converted to mass per area, the mean values for carbon were 2.58, 2.44 and 1.62 kg m–2 for organic layer, mineral soil 0–10 cm and mineral soil 10–20 cm respectively. For nitrogen, the corresponding values are 0.087, 0.097 and 0.074 kg m–2. The average C:N -ratios were 30.8, 25.7 and 22.9 for the organic layer, mineral soil 0–10 cm and mineral soil 10–20 cm respectively.
The comparison with the 213 managed Biosoil sites showed that the old unmanaged sites had higher mean carbon contents in all three layers and slightly higher nitrogen levels than the managed sites (Table 4). However, from these only the differences of the mineral soil layers were statistically significant for both carbon and nitrogen (Table 5). The soil carbon contents in the managed sites first increased with age and the levelled off whereas the soil nitrogen content seemed more or less unaffected by the stand age (Suppl. file S3). When the managed stands soil data was weighted according to the normal forest concept, the carbon stocks of managed stands were still considerably lower in all soil layers with both 80 and 100 year rotations. Soil nitrogen stocks didn’t seem to be affected by the normal forest test, and the values remained very similar to those of the unweighted managed values, with perhaps a slight increase in the mineral soil nitrogen stocks, which is a result from the higher mineral soil nitrogen mass in the younger age-classes of the managed stands (Suppl. file S3).
| Table 4. The mean, minimum and maximum values of carbon and nitrogen (kg m–2) of different layers for the soil samples measured from the unmanaged Lumes-sites, along with the values from similar sites from the managed Biosoil-data. | ||||||||||
| Organic layer | Mineral layer 0–10 cm | Mineral layer 10–20 cm | ||||||||
| Mean | Min | Max | Mean | Min | Max | Mean | Min | Max | ||
| Carbon | Biosoil | 2.058 | 0.210 | 7.956 | 1.777 | 0.114 | 5.247 | 1.141 | 0.092 | 5.552 |
| Lumes | 2.581 | 1.071 | 7.955 | 2.442 | 1.684 | 3.353 | 1.621 | 0.863 | 2.528 | |
| Nitrogen | Biosoil | 0.081 | 0.008 | 0.329 | 0.091 | 0.005 | 0.350 | 0.064 | 0.005 | 0.320 |
| Lumes | 0.087 | 0.038 | 0.364 | 0.097 | 0.067 | 0.180 | 0.074 | 0.030 | 0.128 | |
| Table 5. The results of t-tests of the mean values (kg m–2) of the three layers between the managed Biosoil-dataset and the new unmanaged Lumes results. | ||||||
| Layer | Carbon | Nitrogen | ||||
| t | df | p-value | t | df | p-value | |
| Org layers | –1.504 | 31.013 | 0.143 | –0.560 | 28.990 | 0.580 |
| 0–10 mineral layers | –9.071 | 58.181 | <0.001 | –4.647 | 48.87 | <0.001 |
| 10–20 mineral layers | –6.332 | 41.07 | <0.001 | –3.886 | 32.811 | <0.001 |
The comparison with the earlier unmanaged Lumes measurements showed no statistically significant change in soil carbon or nitrogen stocks. The average difference for soil carbon and nitrogen were –692 kg C ha–1 (p = 0.75) and +109 kg N ha–1 (p = 0.39) respectively (Fig. 2a and b). The variation between sites was greater than the mean change within an individual site across the measurement interval. The difference between sites was statistically significant for both soil carbon and nitrogen (Suppl. file S4) but the variation within sites was also notable (Suppl. file S5).
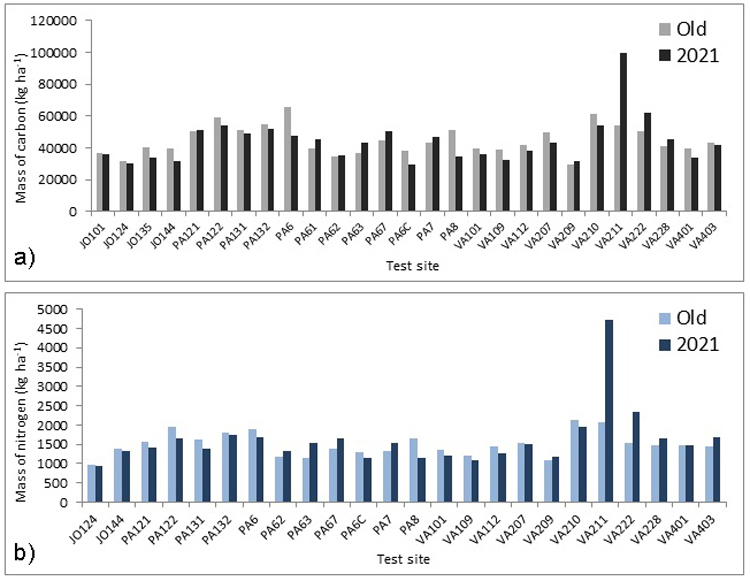
Fig. 2. (a) The mass of carbon (kg ha–1) in the organic layer and the top 10 cm of the mineral soil and (b) the mass of nitrogen (kg ha–1) in the organic layer and the top 10 cm of the mineral soil. The “Old” refers to year 2001, 2002 or 2003. Note that three sites are excluded from the figure 2 (b).
4 Discussion
The results support our Hypothesis 1 that unmanaged or natural-like forests have higher amounts of carbon in the soil than managed forests (Table 4). Our result was only statistically significant for the two mineral soil layers, but no clear difference was found for the organic layers although unmanaged stands seemed to have also higher C and N stocks than managed stands. Similarly, our second hypothesis was supported for the two mineral soil layers, as there was a significant difference between the unmanaged and managed stands in their nitrogen stock, but again not in the organic soil layer. The lack of significant differences in the organic layer carbon and nitrogen content was unexpected, given the naturally large variation of the organic layer thickness between and within the unmanaged sites.
The results on carbon and nitrogen did not show any statistically significant differences between the unmanaged Lumes-measurements of this study and the previous measurements at the same sites by Tamminen and Ilvesniemi (2012), lending support to our third hypothesis. The lack of change means that the unmanaged sites might have reached a state where the carbon inputs to the soil from the growing biomass are balanced with decomposition of organic material and the emissions from the soil, although whether or not an unmanaged old forest actually reaches a steady state is open for debate (Reichstein et al. 2009)
Although the difference between the old values and the 2021 measurements wasn’t statistically significant, there appears to be a small change that is most likely due to changes in the organic layer, as notable change in the mineral soil layer in such a small time period seems unlikely. If for example the organic layer thickness has changed at a site level or there has been a change in the amount of litter fall, this could have affected the carbon and nitrogen storage. We cannot verify this because of lack of organic layer thickness data from the previous measurements, but this does raise the question of whether there has been a large enough change in the local climate in the past decades which could have affected the soil ecosystem in these sites, or if the apparent decrease in soil carbon and increase in soil nitrogen are just a part of natural fluctuation with no long term effects. As mentioned before, soil temperature and moisture are key drivers in the decomposition process of organic matter in the forest soil (Lal 2005; Kumpu et al. 2018) and unlike some of the biotic factors these two are a direct result of the local climate. As mentioned earlier, the time step here was only 18–20 years, which is a relatively short time for an old forest ecosystem in a natural-like state. However, since we don’t have older soil measurements from these sites we cannot establish any reliable trends in either direction. In any case, the average soil organic layer thickness of 5.6 cm in the unmanaged sites did not differ much from the national average of 4.7 cm for mor-humus reported by Tamminen and Ilvesniemi (2013), which was the dominant humus type in the our unmanaged study sites.
One important difference between the natural-like unmanaged sites and the managed sites was that the former were much more uniform with regard to the growing stock and soil properties than the latter. This is largely because the unmanaged sites have been outside normal forest management for decades and many of them had reached a relatively steady uneven-aged structure, whereas the managed sites, although uniform in site type, represented a range of stand ages, densities and management intensities (Tables 1 and 2). To include these widely varying stands to the comparison data is important, as the even-aged silvicultural system consists of all age groups from one clear cut to the next. This means that an individual stand under rotation based management system is never in steady state and only together these sites represent the whole rotation cycle of the managed even-aged forest.
Combining our result that unmanaged forest soils show higher carbon storages than managed forests, with the finding in this study and by Lindroos et al. (2022) that carbon storage increases with age in mature managed forests, we can conclude that leaving a forest site unmanaged would most likely contribute to increasing its soil carbon storage for a considerable time. However, our comparison with the older unmanaged Lumes measurements suggest that the soil carbon starts to saturate somewhere along the stand conversion from managed to natural stand. On the other hand, as climate change has already been detectable between the first and last measurements of the unmanaged stands (Finnish Meteorological Institute 2021), and model simulations indicate that increasing temperatures would lead to accelerated heterotrophic respiration (Härkönen et al. 2019; Junttila et al. 2023), it remains unclear to what extent this stabilization of the soil C stocks could be due to either internal stand dynamics or external drivers. On the other hand, deadwood mass has been measured to be high and increasing in these stands (Akujärvi et al. 2025), and at least part of the dead wood will gradually be stored in the soil. The high volume of large-size dead wood may also affect the microclimate of the forest floor, resulting in accumulation of organic matter into the soil (Błońska et al. 2019). In addition, some of our soil samples included pieces of charcoal from past forest fires or slash-and-burn cultivation, which adds a long-term component to the carbon storage (Ohlson et al. 2009; Deluca and Boisvenue 2012).
The measured C:N ratios of the soils in the unmanaged stands were very similar to those of the managed stands reported by Tamminen and Ilvesniemi (2012). This suggests that the increased coarse woody litter production has not increased the relative carbon content of the soil, consistent with the finding that both C and N storages were lower in managed than unmanaged sites. This could indicate that some N losses, most probably through leaching, have taken place in the managed sites. On the other hand, the increased total nitrogen cannot be directly taken to indicate higher nitrogen availability to plant growth in the unmanaged stands, where volume growth has indeed been observed to be at a lower level than rotation-average volume growth in comparable managed stands (Akujärvi et al. 2025).
In terms of data reliability, we made sure to follow the work procedure set by Tamminen and Ilvesniemi (2012) both in the field and in the laboratory to minimize any errors related to different practice. Another question concerning the comparability of our data, is the time of the measurements. Due to the nature of these measurements, the collection of the samples has to be done during a time when the ground is not frozen. It is also a lot easier to do when the ground is not very wet, which is why we collected our samples during summer and early fall. We do not have information on the exact time of the year when the old unmanaged measurements and the managed dataset were collected; however it is reasonable to assume that the collection of their samples has to have been done in a similar time period as ours.
As mentioned, the amount of carbon and nitrogen in the mineral soil layers were calculated based on the dried and sieved (<2 mm) sample analysis, which means that larger particles are excluded. This is reasonable, as small stones do not contribute to carbon or nitrogen storage and any possible roots are assumed to be a part of the living biomass not the soil. There is however a possible problem for the organic layer calculations, where the mass of carbon and nitrogen was estimated by applying the sieved sample analysis results for the whole sample, because, unlike in the mineral soil, in the organic layer there are no small stones and the fragments larger than 2 mm contribute to the carbon storage. However, this means that any live roots in the organic layer are adding to soil carbon and nitrogen, but roots in the mineral soil do not. Fortunately, the bulk of the roots that were in our soil samples, were in the mineral layers, so the possible error in the organic-layer values should be small. Furthermore, this is a problem for the mass per area comparisons. For the comparison of the sieved samples carbon and nitrogen concentrations (g kg–1) (Tamminen and Ilvesniemi 2012) the values should be accurate.
5 Conclusions
The old unmanaged stands chosen for this study showed greater amounts of carbon and nitrogen in the mineral soil than a population of managed forests representing all age classes of even-aged silviculture at similar sites, but no clear difference was detected in the organic layer. However, both carbon and nitrogen were stable in the unmanaged stands in a comparison with the same sites 18–20 years previously. This suggests that soils of unmanaged sites remain as a carbon sink for long time but stabilize eventually. Since the period between the measurements was relatively short, there is a demand for long-term monitoring of unmanaged forest soils to ascertain whether these kinds of changes are part of natural variation or a trend resulting from changing environmental factors.
Declaration of openness of research materials, data, and code
The new Lumes-data collected for this study is openly available in Zenodo research repository: https://doi.org/10.5281/zenodo.14526484. For the old Lumes data and Biosoil-data contact Natural Resources Institute Finland (Luke).
Authors’ contributions
Atte Kumpu: Field work, laboratory analysis, data analysis, writing the article –original draft. Mikko Peltoniemi: Study design, methodology, writing the article –review and editing. Martin Forsius: methodology, writing the article –review and editing. Annikki Mäkelä: Original idea, study design, data curation, methodology, writing the article –review and editing.
Funding
Atte Kumpu, Annikki Mäkelä and Martin Forsius were supported by the Academy of Finland grant for C-NEUT project (grant nr 347863) additional funding by the European Commission from the RESONATE EU Horizon project (101000574), INAR RI Project Academy of Finland (grant nr 345532) and Suomen Metsätieteellinen Seura (20230006). The FEO project (VN/5082/2020) provided support for the analysis work. Open access funded by Helsinki University Library.
Acknowledgements
We thank Pekka Tamminen and Metla field staff for their efforts in collecting soil measurements from Lumes sites in 2001–2003. We thank Hannu Ilvesniemi and Metla field staff for coordinating soil sampling efforts in Biosoil, and publishing this data openly. We thank Anu Akujärvi for the current stand information and Elian Hannebicq for the assistance in field- and laboratory work for this study.
References
Akujärvi A, Nirhamo A, Heikkinen RK, Pykälä J, Saikkonen O, Green T, Peltoniemi M, Mäkelä A (2025) The relationship between tree carbon dynamics and the occurrences of epiphytes of conservation concern in boreal unmanaged forests. Eur J For Res. In press.
Batjes NH (2016) Harmonized soil property values for broad-scale modelling (WISE30sec) with estimates of global soil carbon stocks. Geoderma 269: 61–68. https://doi.org/10.1016/j.geoderma.2016.01.034.
Błońska E, Lasota J, Tullus A, Lutter R, Ostonen I (2019) Impact of deadwood decomposition on soil organic carbon sequestration in Estonian and Polish forests. Ann For Sci,76, article id 102. https://doi.org/10.1007/s13595-019-0889-9.
Cajander AK (1949) Metsätyypit ja niiden merkitys. [Forest types and their significance]. Acta For Fenn 56. https://doi.org/10.14214/aff.7395.
Dannenmann M, Gasche R, Ledebuhr A, Papen H (2006) Effects of forest management on soil N cycling in beech forests stocking on calcareous soils. Plant Soil 287: 279–300. https://doi.org/10.1007/s11104-006-9077-4.
Deluca T, Boisvenue C (2012) Boreal forest soil carbon: distribution, function and modelling. Forestry 85: 161–184. https: /doi.org/10.1093/forestry/cps003.
EC (2019) The European Green Deal. Brussels, 11.12.2019 COM(2019) 640 final.
EC (2020) EU Biodiversity Strategy for 2030. Bringing nature back into our lives. Brussels, 20.5.2020 COM(2020) 380 final.
Finér L, Lepistö A, Karlsson K, Räike A, Härkönen L, Huttunen M, Joensuu S, Kortelainen P, Mattsson T, Piirainen S, Sallantaus T, Sarkkola S, Tattari S, Ukonmaanaho L (2021) Drainage for forestry increases N, P and TOC export to boreal surface waters. Sci Total Environ 762, article id 144098. https://doi.org/10.1016/j.scitotenv.2020.144098.
Finnish Meteorological Institute (2021) Press release 30.9.2021. https://en.ilmatieteenlaitos.fi/press-release/hC0sXM7s1C78hQUUgmvuL. Accessed 21 August 2025.
Forsius M, Holmberg M, Junttila V, Kujala H, Schulz T, Paunu V-V, Savolahti M, Minunno F, Akujärvi A, Bäck J, Grönroos J, Heikkinen RK, Karvosenoja N, Mäkelä A, Mikkonen N, Pekkonen M, Rankinen K, Virkkala R (2023) Modelling the regional potential for reaching carbon neutrality in Finland: sustainable forestry, energy use and biodiversity protection. Ambio 52: 1757–177. https://doi.org/10.1007/s13280-023-01860-1.
George MR, Hansson LJ, Ring E, Jansson PE, Gärdenäs AI (2017) Nitrogen leaching following clear-cutting and soil scarification at a Scots pine site – a modelling study of a fertilization experiment. For Ecol Manag 385: 281–294. https://doi.org/10.1016/j.foreco.2016.11.006.
Green T (2020) Natural regeneration dynamics in old-growth Norway spruce forests throughout Southern Finland: a spatial point pattern and gap analysis. Master’s Thesis. Environmental Management. Department of Geography, University of Kiel.
Heaps T (2015) Convergence of optimal harvesting policies to a normal forest. J Econ Dyn Control 54: 74–85. https://doi.org/10.1016/j.jedc.2015.03.001.
Högberg P, Näsholm T, Franklin O, Högberg MN (2017) Tamm review: on the nature of the nitrogen limitation to plant growth in Fennoscandian boreal forests. For Ecol Manag 403: 161–185. https://doi.org/10.1016/j.foreco.2017.04.045.
Hume AM, Chen HYH, Taylor AR (2017) Intensive forest harvesting increases susceptibility of northern forest soils to carbon, nitrogen and phosphorus loss. J Appl Ecol 55: 246–255. https://doi.org/10.1111/1365-2664.12942.
Ilvesniemi H (2023) Suomen BioSoil-maaperäaineisto. Luonnonvarakeskus. https://doi.org/10.23729/082bf910-9dbe-4650-a4c7-cfa9b83d5954.
Isomäki A, Niemistö P, Varmola M (1998) Luonnontilaisten metsien rakenne seurantakoealoilla. [The structure of natural-like forests in study sites]. In: Annila E (ed) Metsäntutkimuslaitoksen tiedonantoja 705: 75–86. https://urn.fi/URN:ISBN:951-40-1647-5.
Johnson DW (1992) Effects of forest management on soil carbon storage. Water Air Soil Pollut 64: 83–120. https://doi.org/10.1007/BF00477097.
Johnson DW, Curtis PS (2001) Effects of forest management on soil C and N storage: meta analysis. For Ecol Manag 140: 227–238. https://doi.org/10.1016/S0378-1127(00)00282-6.
Kolari P, Pumpanen J, Rannik U, Ilvesniemi H, Hari P, Berninger F (2004) Carbon balance of different aged Scots pine forests in Southern Finland. Glob Chang Biol 10: 1106–1119. https://doi.org/10.1111/j.1529-8817.2003.00797.x.
Korhonen KT, Ahola A, Heikkinen J, Henttonen HM, Hotanen J-P, Ihalainen A, Melin M, Pitkänen J, Räty M, Sirviö M, Strandström M (2021) Forests of Finland 2014–2018 and their development 1921–2018. Silva Fenn 55, article id 10662. https://doi.org/10.14214/sf.10662.
Kumpu A, Mäkelä A, Pumpanen J, Saarinen J, Berninger F (2018) Soil CO2 efflux in uneven-aged and even-aged Norway spruce stands in southern Finland. iForest 11: 705–712. https://doi.org/10.3832/ifor2658-011.
Kyaschenko J, Clemmensen KE, Karltun E, Lindahl BD (2017) Below‐ground organic matter accumulation along a boreal forest fertility gradient relates to guild interaction within fungal communities. Ecol Lett 20: 1546–1555. https://doi.org/10.1111/ele.12862.
Kyaschenko J, Ovaskainen O, Ekblad A, Hagenbo A, Karltun E, Clemmensen KE, Lindahl BD (2019) Soil fertility in boreal forest relates to root‐driven nitrogen retention and carbon sequestration in the mor layer. New Phytol 221: 1492–1502. https://doi.org/10.1111/nph.15454.
Lahti T, Väisänen RA (1987) Ecological gradients of boreal forests in South Finland: an ordination test of Cajander’s forest site type theory. Vegetatio 68: 145–156. https://doi.org/10.1007/BF00114715.
Lal R (2005) Forest soils and carbon sequestration. For Ecol Manag 220: 242–258. https://doi.org/10.1016/j.foreco.2005.08.015.
LeBauer DS, Treseder KK (2008) Nitrogen limitation of net primary productivity in terrestrial ecosystems is globally distributed. Ecology 89: 371–379. https://doi.org/10.1890/06-2057.1.
Lindroos AJ, Mäkipää R, Merilä P (2022) Soil carbon stock changes over 21 years in intensively monitored boreal forest stands in Finland. Ecol Indic 144, article id 109551. https://doi.org/10.1016/j.ecolind.2022.109551.
Liski J, Palosuo T, Peltoniemi M, Sievänen R (2005) Carbon and decomposition model Yasso for forest soils. Ecol Model 189: 168–182. https://doi.org/10.1016/j.ecolmodel.2005.03.005.
Mäkelä A, Tian X, Repo A, Ilvesniemi H, Marshall J, Minunno F, Näsholm T, Schiestl-Aalto P, Lehtonen A (2022) Do mycorrhizal symbionts drive latitudinal trends in photosynthetic carbon use efficiency and carbon sequestration in boreal forests? For Ecol Manag 520, article id 120355. https://doi.org/10.1016/j.foreco.2022.120355.
Mäkipää R, Heikkinen J (2003) Large‐scale changes in abundance of terricolous bryophytes and macrolichens in Finland. J Veg Sci 14: 497–508. https://doi.org/10.1111/j.1654-1103.2003.tb02176.x.
Masson-Delmotte V, Zhai P, Pirani A, Connors SL, Péan C, Berger S, Caud N, Chen Y, Goldfarb L, Gomis MI, Huang M, Leitzell K, Lonnoy E, Matthews JBR, Maycock TK, Waterfield T, Yelekçi O, Yu R, Zhou B (2021) Climate change 2021: the physical science basis. Contribution of working group I to the sixth assessment report of the intergovernmental panel on climate change. Cambridge University Press, Cambridge. https://doi.org/10.1017/9781009157896.
Mayer M, Prescott CE, Abaker WE, Augusto L, Cécillon L, Ferreira GW, James J, Jandlj R, Katzensteiner K, Laclauk J, Laganière J, Nouvellonk Y, Paré D, Stanturf JA, Vanguelova EI, Vesterdal L (2020) Tamm review: influence of forest management activities on soil organic carbon stocks: a knowledge synthesis. For Ecol Manag 466, article id 118127. https://doi.org/10.1016/j.foreco.2020.118127.
Merilä P, Mustajärvi K, Helmisaari HS, Hilli S, Lindroos AJ, Nieminen TM, Nöjd P, Rautio P, Salemaa M, Ukonmaanaho L (2014) Above-and below-ground N stocks in coniferous boreal forests in Finland: implications for sustainability of more intensive biomass utilization. For Ecol Manag 311: 17–28. https://doi.org/10.1016/j.foreco.2013.06.029.
Merilä P, Lindroos AJ, Helmisaari HS, Hilli S, Nieminen TM, Nöjd P, Rautio P, Salemaa M, Ťupek B, Ukonmaanaho L (2024) Carbon stocks and transfers in coniferous boreal forests along a latitudinal gradient. Ecosystems 27: 151–167. https://doi.org/10.1007/s10021-023-00879-5.
Nave LE, Vance ED, Swanston CW, Curtis PS (2010) Harvest impacts on soil carbon storage in temperate forests. For Ecol Manag 259: 857–866. https://doi.org/10.1016/j.foreco.2009.12.009.
Ohlson M, Dahlberg B, Økland T, Brown KJ, Halvorsen R (2009) The charcoal carbon pool in boreal forest soils. Nat Geosci 2: 692–695. https://doi.org/10.1038/ngeo617.
Palviainen M, Finér L, Kurka AM, Mannerkoski H, Piirainen S, Starr M (2004) Decomposition and nutrient release from logging residues after clear-cutting of mixed boreal forest. Plant Soil 263: 53–67. https://doi.org/10.1023/B:PLSO.0000047718.34805.fb.
Peltoniemi M, Mäkipää R (2011) Quantifying distance-independent tree competition for predicting Norway spruce mortality in unmanaged forests. For Ecol Manag 261: 30–42. https://doi.org/10.1016/j.foreco.2010.09.019.
Posch M, Aherne J, Moldan F, Evans CD, Forsius M, Larssen T, Helliwell R, Cosby BJ (2019) Dynamic modeling and target loads of sulfur and nitrogen for surface waters in Finland, Norway, Sweden, and the United Kingdom. Environ Sci Technol 53: 5062–5070. https://doi.org/10.1021/acs.est.8b06356.
Post W, Emanuel W, Zinke P, Stangenberger A (1982) Soil carbon pools and world life zones. Nature 298: 156–159. https://doi.org/10.1038/298156a0.
Pumpanen J, Westman C, Ilvesniemi H (2004) Soil CO2 efflux from a podzolic forest soil before and after forest clear-cutting and site preparation. Boreal Environ Res 9: 199–212.
R Core Team (2019) R: a language and environment for statistical computing. R Foundation for 847 Statistical Computing, Vienna, Austria. https://www.R-project.org/.
Reichstein M, Ågren GI, Fontaine S (2009) Is there a theoretical limit to soil carbon storage in old-growth forests? A model analysis with contrasting approaches. In: Wirth C, Gleixner G, Heimann M (eds) Old-growth forests: function, fate and value. Springer, Berlin, Heidelberg, Ecological Studies 207: 267–281. https://doi.org/10.1007/978-3-540-92706-8_12.
Ring E, Sikström U (2024) Environmental impact of mechanical site preparation on mineral soils in Sweden and Finland – a review. Silva Fenn 58, article id 23056. https:// doi.org/10.14214/sf.23056.
Salemaa M, Lindroos A-J, Merilä P, Mäkipää R, Smolander A (2019) N2 fixation associated with the bryophyte layer is suppressed by low levels of nitrogen deposition in boreal forests. Sci Total Environ 653: 995–1004. https://doi.org/10.1016/j.scitotenv.2018.10.364.
Salemaa M, Kieloaho A-J, Lindroos A-J, Merilä P, Poikolainen J, Manninen S (2020) Forest mosses sensitively indicate nitrogen deposition in boreal background areas. Environ Pollut 261, article id 114054. https://doi.org/10.1016/j.envpol.2020.114054.
Scharlemann JP, Tanner EV, Hiederer R, Kapos V (2014) Global soil carbon: understanding and managing the largest terrestrial carbon pool. Carbon Manag 5: 81–91. https://doi.org/10.4155/cmt.13.77.
Siitonen J (2001) Forest management, coarse woody debris and saproxylic organisms: Fennoscandian boreal forests as an example. Ecol Bull 49: 11–41. https://www.jstor.org/stable/20113262.
Smith FW, Long JN (2001) Age-related decline in forest growth: and emergent property. For Ecol Manag 144: 175–181. https://doi.org/10.1016/S0378-1127(00)00369-8.
Spohn M, Stendahl J (2022) Carbon, nitrogen, and phosphorus stoichiometry of organic matter in Swedish forest soils and its relationship with climate, tree species, and soil texture. Biogeosciences 19: 2171–2186 https://doi.org/10.5194/bg-19-2171-2022.
Tamminen P, Ilvesniemi H (2012) Maaperän hiili ja typpi luonnontilaisissa ja talousmetsissä. Working Papers of the Finnish Forest Research Institute 236. https://urn.fi/URN:ISBN:978-951-40-2369-9.
Tamminen P, Ilvesniemi H (2013) Extensive forest soil monitoring. In: Merilä P, Jortikka S (eds) Forest condition monitoring in Finland – national report. The Finnish Forest Research Institute (Metla). [Online report]. http://urn.fi/URN:NBN:fi:metla-201305087584.
Tomppo E, Heikkinen J, Henttonen HM, Ihalainen A, Katila M, Mäkelä H Tuomainen T, Vainikainen N (2011) Designing and conducting a forest inventory-case: 9th National Forest Inventory of Finland. Managing Forest Ecosystems 22, Springer Science & Business Media. https://doi.org/10.1007/978-94-007-1652-0.
Turunen J, Valpola S (2020) The influence of anthropogenic land use on Finnish peatland area and carbon stores 1950–2015. Mires Peat 26, article id 26. https://doi.org/10.19189/MaP.2019.GDC.StA.1870.
Van Sundert K, Radujkovic D, Cools N, De Vos B, Etzold S.a, Fernandez-Martinez M, Janssens IA, Merila P, Penuelas J, Sardans J, Stendahl J, Terrer C, Vicca S (2020) Towards comparable assessment of the soil nutrient status across scales-Review and development of nutrient metrics. Glob Chang Biol 26: 392–409. https://doi.org/10.1111/gcb.14802.
Vesterdal L, Raulund-Rasmussen K (1998) Forest floor chemistry under seven tree species along a soil fertility gradient. Can J For Res 28: 1636–1647. https://doi.org/10.1139/x98-140.
Total of 58 references.
