
Tom Erik Thorkildsen  ,
Eirik Ogner Jåstad,
Per Kristian Rørstad,
Erik Trømborg
,
Eirik Ogner Jåstad,
Per Kristian Rørstad,
Erik Trømborg
Forest sector impacts from increased reutilization of post-consumer wood in the Nordic-Baltic region
Thorkildsen T. E., Jåstad E. O., Rørstad P. K., Trømborg E. (2026). Forest sector impacts from increased reutilization of post-consumer wood in the Nordic-Baltic region. Silva Fennica vol. 60 no. 3 article id 25005. https://doi.org/10.14214/sf.25005
Highlights
- Wood reutilization strongly promotes particleboard production and harvest-residue use
- Because of leakage effects, multilateral wood-reutilization policy is far more efficient than unilateral policy in reducing domestic roundwood harvesting
- As wood reutilization increases, harvest-residue use rises by about twice the reduction in roundwood harvest, measured in solid cubic meters.
Abstract
Global roundwood harvests are projected to increase by 49 percent by 2050, and can negatively affect carbon sequestration, biodiversity, and essential ecosystem services. Employing a circular cascading strategy for wood resources may increase the carbon stock accumulated in wood products and reduce harvest. This study investigates a) how reutilizing 30, 50, and 70 percent of generated post-consumer wood by weight will affect the Nordic-Baltic forest sector, and b) the difference between adopting unilateral Norwegian and multilateral Nordic-Baltic wood reutilization policies. We apply the Nordic Forest Sector Model, a spatial partial equilibrium model, which includes 37 assorted forest products, and make a novel extension by including reutilized wood products. The model calculates hypothetical harvest and production volumes as well as prices when each country is forced to meet the selected reutilization targets based on constrained welfare maximization. The results show that reutilization of wood promotes increased particleboard production, mainly in the Baltics, and increased utilization of harvest residues, foremost in Sweden and Finland, to maintain bioheat production. In the Nordic-Baltic area, between 0.42 and 0.73 cubic meters of roundwood would be saved for every cubic meter of wood reutilized, while the corresponding rates for Norway are 0.26 to 0.36. Due to leakage effects, unilateral Norwegian policies result in domestic roundwood reduction to reutilization rates as low as 0.03 to 0.05. This implies that it is vital to coordinate policies with adjacent countries to reduce leakage if the objective of wood reutilization is to reduce domestic extraction of roundwood.
Keywords
circular economy;
forest sector modeling;
harvest leakage;
reclaimed wood;
recycling targets;
wood waste
-
Thorkildsen,
Faculty of Environmental Sciences and Natural Resource Management, Norwegian University of Life Sciences, P.O. Box 5003, NO-1432 Ås, Norway
 https://orcid.org/0009-0009-7221-698X
E-mail
tom.erik.thorkildsen@nmbu.no
https://orcid.org/0009-0009-7221-698X
E-mail
tom.erik.thorkildsen@nmbu.no
-
Jåstad,
Faculty of Environmental Sciences and Natural Resource Management, Norwegian University of Life Sciences, P.O. Box 5003, NO-1432 Ås, Norway
https://orcid.org/0000-0002-1089-0284
E-mail
eirik.jastad@nmbu.no
- Rørstad, Faculty of Environmental Sciences and Natural Resource Management, Norwegian University of Life Sciences, P.O. Box 5003, NO-1432 Ås, Norway E-mail per.kristian.rorstad@nmbu.no
- Trømborg, Faculty of Environmental Sciences and Natural Resource Management, Norwegian University of Life Sciences, P.O. Box 5003, NO-1432 Ås, Norway E-mail erik.tromborg@nmbu.no
Received 5 February 2025 Accepted 28 July 2026 Published 20 August 2026
Views 12278
Available at https://doi.org/10.14214/sf.25005 | Download PDF

Supplementary Files
1 Introduction
Shifting from a linear to a circular economy is seen as the key to decouple economic growth from resource extraction such as wood harvesting (European Commission 2019, 2023). By making this transition, the European Union (EU) hopes to achieve both climate change mitigation and protection of ecosystem services (European Commission 2019). In this context, the EU has implemented stringent overall recycling targets: 70 percent for the construction sector since 2020, 70 percent of packaging by 2030, and 65 percent of municipal waste by 2035, including material-specific targets for packaging waste (Directive (EU) 2018/851 2018; Directive (EU) 2018/852 2018). Future policies may also include mandates for high-quality recycling, remanufacturing, and minimum recycled content in products (European Commission 2020).
The Nordic and Baltic harvest covered 4 percent of the global roundwood consumption in 2022 (FAO 2025), which is projected to increase from 4.0 to 6.0 billion cubic meters by 2050 (FAO 2024). Forest management and utilization of forest resources fundamentally affect carbon sequestration, biodiversity, and vital ecosystem services (United Nations Environment Programme and International Resource Panel 2024). As sustainably produced forest resources are scarce, it is recommended to commit to and enhance a circular cascading strategy, where wood is first used in long-lived products, then reused and recycled for as long as possible before it is utilized for energy (Höglmeier et al. 2017; United Nations Environment Programme and International Resource Panel 2024). Implementing such a strategy would presumably increase resource efficiency and transform the forest sector. While opportunities may open up for providers of reused and recycled wood, reduced demand for fresh wood, ceteris paribus, would be disadvantageous to foresters, sawmills, and providers of logging and timber transport. Models that could quantify these changes would thus provide useful insights to stakeholders and policymakers.
Densely populated countries with substantial demand for wood products but limited forest resources, like the Netherlands, Italy and the United Kingdom, utilize large volumes of industry residues and post-consumer wood for wood-based panels (Vis et al. 2016). The current feedstock for European particleboards was estimated to consist of 43 percent post-consumer wood and 37 percent industry residues (Cristóbal García et al. 2023). In contrast, other Nordic-Baltic countries with access to considerable forest resources per capita and greater heating demand due to cold winters largely incinerate their generated post-consumer wood to provide bioheat (Vis et al. 2016). While bioheat could be produced from mixed wood waste, sorting and preparing post-consumer wood for use in wood-based panels incurs additional costs (Vis et al. 2016; Lesar et al. 2018).
Wood recycling can be more challenging than paper recycling, as it involves a more complex and fragmented industry (Vis et al. 2016). Given that it took Europe 29 years to accelerate paper recycling from 40 percent (1991) to 73 percent (2020) (European Paper Recycling Council 2023), achieving a 70 percent recycling rate for wood by 2035 may seem overly ambitious. However, as other waste fractions may be even more challenging to recycle, the overall recycling objectives seem out of reach if Europe fails to achieve a matching wood-specific rate. Some countries have demonstrated progress, e.g., the United Kingdom achieved a 44 percent recycling rate for wood packaging in 2021 (Harte et al. 2020; GOV.UK 2024). Moreover, reuse centers that collect and redistribute reusable materials, including structural wood, wooden pallets, etc., are now being established across Europe. Although standard pallets are usually used numerous times before they are discarded and recorded as waste, analysis carried out by Gedde et al. (2025) indicates that obsolete and damaged packaging accounts for between a fifth and a third of all wood waste generated by Norwegian industries, and that this fraction has a high cascading potential. Improved sorting of wood waste and separation closer to the source, e.g., at the construction or demolition site, would strengthen the prospects for reutilization at the highest quality level (Vis et al. 2016).
Based on a building stock model, Höglmeier et al. (2017) approximated that 25 percent of the post-consumer wood from the Bavarian construction sector could be reused, while 44 percent was suited for reutilization in particleboard and fiberboard. Analysis of 24 samples of shredded post-consumer wood from South-Eastern Norway showed that between 39 and 67 percent was clean wood chips free of visible contamination, and thus well-suited for recycling (Altgen et al. 2025). Szichta et al. (2022) used a material flow analysis (MFA) model to predict the reutilized amount of recovered post-consumer wood 30 years ahead in Germany and found that sawnwood and particleboard constituted the major fractions. Fraanje (1997) applied the framework of Sirkin and ten Houten (1994) to demonstrate that cascading of wood could save or postpone harvest and thus reduce carbon emissions. Several life cycle assessments (LCAs) have concluded that a wood cascading strategy reduces the global warming potential (GWP) (Mehr et al. 2018; Faraca et al. 2019b; Navare et al. 2022), and that it reduces extraction of roundwood (Risse et al. 2017; Niu et al. 2021). By conducting a dynamic consequential LCA in the case of the United Kingdom, Forster et al. (2023) concluded that cascading contributed to substitution of alternative products and reduced demand for roundwood, and thus increased rotation age and carbon sequestration in the forest, as well as increased carbon storage in harvested wood products (HWP). By combining LCA with a multi-objective optimization model, Taskhiri et al. (2019) found that wood cascading could reduce wood extraction by as much as 35 percent. A techno-economic assessment based on LCA concludes that the selected energy mix, assumptions about wood products being carbon neutral, and allowance for subsequent life cycles determine whether it is preferable to recycle before incinerating post-consumer wood (Cristóbal García et al. 2023). Contrary to what we know from basic economic theory, attributional LCAs generally assume that consumption of reutilized wood products completely substitutes an alternative product made from freshly harvested wood. Consequential LCAs better integrate economic theory but typically rely on retrieved generic data generated by a sector-by-sector Leontief input-output model, without revealing primary data.
By applying the French Forest Sector Model (FFSM), Lorang et al. (2023) show how different assumptions about the substitution rate between fresh and recycled pulp are crucial for judging whether paper recycling contributes to a net increase or decrease in carbon emissions. Several other studies applying partial equilibrium models point to notable trade and leakage effects in the forest sector. Such leakage occurs when an expected effect in a geographically separate market is partly offset by the opposite effect in external markets, e.g., when reduced logging in one country is counteracted by increased logging in other countries. Concurrently, considerable leakage weakens single countries’ incentives to introduce unilateral measures because major parts of the benefits are allocated to external countries where it is challenging to validate. Hu et al. (2024) found that leakage rates for roundwood from single Nordic countries were in the range of 59 to 106 percent, where more than 70 percent of the leakage was absorbed by non-Nordic countries. Kallio et al. (2018) and Päivinen et al. (2022) estimated the roundwood leakage from Europe resulting from harvest restrictions to 80 and 64 percent, respectively. Fischer et al. (2024) conclude that, due to harvest leakage to more vulnerable forests abroad, protecting 30 percent of the European forests in accordance with the Kunming-Montreal Global Biodiversity Framework (2022) would harm global diversity.
Although several studies have, separately and from different perspectives, assessed reutilization options for post-consumer wood, associated carbon impacts, substitutability, and leakage effects, the absence of quantitative assessments of forest sector impacts connecting these topics is noticeable. We have thus applied the Nordic Forest Sector Model (NFSM) to assess and quantify the sectoral impacts of increased reutilization of wood. We construct the feedback loop in the Nordic-Baltic forest sector by integrating official data on generated post-consumer wood and knowledge about applicable reutilization options. The model implicitly determines various leakage effects and substitution rates from introducing reutilization alternatives. This study aims to answer two interconnected questions:
a) How do different levels of wood reutilization affect harvesting, production, and allocation of intermediate and end products, as well as prices in the Nordic-Baltic forest sector?
b) What are the differences between implementing Norwegian unilateral and Nordic-Baltic multilateral policies to increase reutilization?
The next section introduces the NFSM, outlines key data assumptions, and details the reutilization scenarios. Following this, results are presented, focusing on the impacts of reutilization rates on industry production and trade. The discussion section explores the study’s implications and limitations. Finally, the paper concludes with insights and recommendations for advancing wood reutilization policies and practices.
2 Materials and methods
2.1 The Nordic Forest Sector Model
The Nordic Forest Sector Model (NFSM) is a spatial, partial equilibrium model that simulates the dynamics of forestry, forest industries, and bioenergy markets in Norway, Sweden, Finland, Denmark, Estonia, Latvia, and Lithuania based on a neoclassical economics perspective. It connects transport costs with the interaction between geographically separated markets for distinct product categories, a conjunction first theorized by Samuelson (1952). Price and quantity traded in each separate and distinct market are determined both based on predefined internal supply and demand functions and the net inflow of uniform goods from other markets. Goods flow from low-price markets to high-price markets as long as the transport costs do not exceed the price difference. NFSM handles the major forest product categories, including roundwood, sawnwood, wood-based panels, pulp and paper products, harvest and industrial residues, and bioenergy, which are linked through various interconnecting mechanisms. By-production is largely driven by the demand for the main product. Some products, typically by-products, are input factors to an end product. Moreover, substitute goods affect several markets as they compete across product categories. The model, written in the General Algebraic Modeling Language (GAMS) (GAMS Development Corporation n.d.), solves a mixed integer linear programming (MILP) problem, optimizing welfare, defined as the sum of consumer and producer surpluses, given a large set of constraints. It gives insights into supply, demand, and price equilibria, making it valuable for policy and market analysis. A detailed description of NFSM is given in Jåstad (2020).
The NFSM is one of several descendants of the Global Trade Model (GTM), developed at the International Institute of Applied Systems Analysis (Kallio et al. 1987). NFSM builds on the Norwegian Trade Model (NTM), NTM II, and NTM III, originally developed by Trømborg and Solberg (1995), refined by Bolkesjø (2004), and further extended by Trømborg and Sjølie (2011). The model has been continuously updated, with significant contributions by Mustapha (2016) and Jåstad (2020), to better represent forest industries and bioenergy markets in the Nordic region.
NFSM has been used to analyze the effects of large-scale forest-based biofuel production on the Nordic forest sector (Jåstad et al. 2019), and the Nordic power sector (Mustapha et al. 2019). It has also been used to investigate the causal relationship between increased supply for bioheat production and electricity prices (Jåstad et al. 2021). Recently, it has been used by Hu et al. (2024) to assess and quantify harvest and production leakage from reduced roundwood harvest, and its impact on industries in the global market.
NFSM includes the following key components:
1. Roundwood supply: Roundwood supply is modeled with six species and assortments (e.g., sawlogs and pulpwood from spruce, pine, and non-coniferous). Supply functions relate harvest to roundwood prices and accumulated forest stock, accessibility, utilization rates, volume elasticities, and price elasticities. The model applies historical upper and lower constraints to the ratio of sawlog to pulpwood supply.
2. Demand: Demand functions for final products, such as sawnwood, wood-based panels, and paper, are based on price elasticities. Bioheat output is exogenously set fixed to the current level.
3. Forest industries and bioenergy production: Roundwood and harvest residues are transformed into intermediate and final products. The NFSM allows for the establishment or expansion of production capacities where this is socio-economically profitable. Production quantities are scaled and governed according to a Leontief production function, incorporating inputs of resources, labor, and energy. Labor costs are assumed to be static.
4. By-product supply: The supply of by-products such as bark, sawdust, shavings, and wood chips is determined by the production of main products such as sawnwood and wood-based panels. The availability of harvest residues depends on the roundwood supply. The price of intermediate products depends on demand for associated end products. This interdependence is crucial for capturing the dynamics of forest industry operations.
5. Trade and transport: The model simulates regional and international trade based on profitability. Trade volumes and clearing prices for each market are modeled based on demand, production, and the cost of transporting goods between regions, as first expressed by Samuelson (1952). The cheapest transport options between regions’ administrative centers, on road, rail, or seaways, are computed.
NFSM includes 37 assorted products, including seven types of primary wood, 11 types of intermediate products (e.g., wood chips, bark, sawdust, pulp), 14 final products (e.g., three grades of sawnwood, three grades of wood-based panels, four types of paper, and three types of bioheat), and post-consumer wood, divided into four quality fractions. The NFSM divides the Nordic-Baltic countries into 380 geographically separate regions. Norway is divided into 356 regions, Sweden and Finland are each divided into 10 regions, while Denmark, Estonia, Latvia, and Lithuania are modeled as single regions. The “rest of the world” is divided into four regions. In total, the model thus operates 14 208 interconnected partial markets. This structure allows for a detailed analysis of trade and production within and outside the Nordic and Baltic countries, capturing both internal and international market flows. For more technical details, including the model’s objective functions and constraints, see Trømborg and Sjølie (2011), Mustapha (2016), and Jåstad (2020).
2.2 Model extension
2.2.1 Generated post-consumer wood
To be able to investigate how the forest sector is affected by the transition to a circular economy, NFSM has been extended by incorporating reused sawnwood, remanufactured sawnwood, and recycled chips derived from post-consumer wood (Fig. 1). Based on specified reutilization levels, technical boundaries, and associated costs, the model simulates the conversion of post-consumer wood to second-life products and their redistribution into the market. Supply of post-consumer wood is exogenously given based on official 2021 statistics, excluding wood classified as hazardous waste (Statistics Norway 2024c; FAO 2025) and further distributed among regions based on population (Statistics Sweden 2022; Official Statistics Portal 2024a, 2024b; Statistics Denmark 2024; Statistics Estonia 2024; Statistics Finland 2024; Statistics Norway 2024a). FAO data (FAO 2025) were generated on generated, exported, and imported quantities of ‘recovered post-consumer wood’, and calibrated with Norwegian ‘wood waste’ statistics (Statistics Norway 2024c). Although the sources use slightly different terminology, we consistently refer to ‘post-consumer wood’ to emphasize that it has a potential for reutilization.
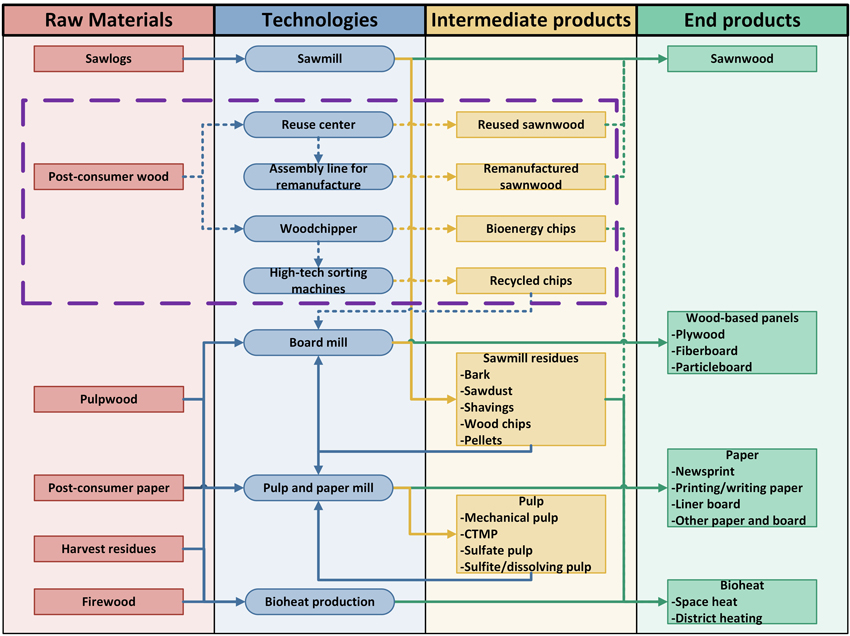
Fig. 1. The NFSM flow diagram illustrates how the model connects industrial technology with raw materials and production of intermediate and end products. The red dashed frame marks the current model extension for reutilization of post-consumer wood.
Reliable data on the drivers and distribution of wood waste generation remains scarce. Several studies (Kaza et al. 2018; He et al. 2022; Alhanaqtah 2023) have linked the general municipal solid waste generation to population and GDP per capita. Preliminary investigations suggest that the variables ‘population’ and ‘GDP’ can be used to estimate The amount of wood waste generated in Norway. While Statistics Norway publishes raw data for municipal wood waste at the municipal level, sector-specific model-generated estimates are provided at the national level for all other sectors (Statistics Norway 2017). Due to the lack of data, this approach could not be applied at the municipal level in Norway or in other Nordic-Baltic regions. It was therefore decided to use a straightforward, transparent approach: a regional distribution of wood waste based solely on population. To convert from tonnes to cubic meters, we used a conversion factor of 0.41–1, based on Belbo and Gjølsjø (2008). Post-consumer wood per capita varies between 35 kg in Denmark and 146 kg in Norway (Table 1).
| Table 1. Generated and exported amounts of post-consumer wood by country/region. | ||||
| Country/Region | Population | Post-consumer wood | ||
| Capita* | Generated** | Net exports** | Per capita*** | |
| Baltics | 6 054 032 | 519 512 m3 | 0 m3 | 35 kg |
| Denmark | 5 840 045 | 390 244 m3 | –53 974 m3 | 27 kg |
| Finland | 5 548 241 | 1 345 580 m3 | –434 338 m3 | 99 kg |
| Norway | 5 391 369 | 1 917 073 m3 | 1 142 732 m3 | 146 kg |
| Sweden | 10 452 326 | 2 736 756 m3 | –1 168 065 m3 | 107 kg |
| * Sources: Statistics Estonia (2024), Official Statistics Portal (2024a), Official Statistics Portal (2024b), Statistics Denmark (2024), Statistics Finland (2024), Statistics Norway (2024a), Statistics Sweden (2022) ** Sources: FAO (2025), Statistics Norway (2024c). Converted from tonnes (Mg) to cubic meters (m3) per a conversion factor of 0.41–1 in accordance with Belbo and Gjølsjø (2008). Net exports as specified in the baseline scenario (0) *** Generated quantities by capita converted to kilograms (kg) | ||||
European countries categorize wood waste in slightly different ways (Irle et al. 2023), which complicates comparisons. Analysis carried out by EcoReFibre in Europe, InFutUReWood in the United Kingdom, and SirkTRE partners in Norway show that a fourth of generated wood waste was classified as wood packaging, another fourth as untreated solid wood, and less than a tenth as MDF or non-wood (Harte et al. 2020; Irle et al. 2023; Gedde et al. 2025) (Table 2). Höglmeier et al. (2017) estimated that 25 percent of the post-consumer wood from the Bavarian construction sector could potentially be reused, while 44 percent could be utilized for particleboards. It should be noted that Nordic countries seem to be structurally different from other European countries, as a large share of the dwellings are made of wood (Lähtinen et al. 2021), and that the production of wood-based panels is modest (Vis et al. 2016). The Nordic construction sector accounts for a much larger share of total wood waste compared to the European average (Vis et al. 2016), which contributes to a higher share of untreated solid wood (Gedde et al. 2025).
| Table 2. Compilation of various analyses of post-consumer wood. | |||
| Post-consumer wood fraction | SirkTRE – Norway, Gedde et al. (2025)* | InFutUReWood – the United Kingdom, Harte et al. (2020) | EcoReFibre – unspecified, Europe, Irle et al. (2023) |
| Solid wood | 29% wood packaging 26% untreated 13% treated | 27%** packaging waste 31% clean wood 42% treated wood | 59% solid wood |
| Wood-based panels | 7% untreated 13% treated | 12% chipboard 6% MDF 7% plywood 3% OSB | 33% panel products 4% fiberboard |
| Furniture, etc. | 6% furniture and doors | 3%** community wood recycling | |
| Contaminated and misplaced | 5% contaminated and misplaced 1% non-wood | 4% non-wood | |
| * Scaled by sectors based on Statistics Norway (2024c) ** Double-counting due to a) 27 percent of post-consumer wood originates from packaging waste, and b) 3 percent of post-consumer wood is redistributed through community wood recycling as furniture etc. | |||
2.2.2 Connecting quality fractions and reutilization options
Based on given claims and delimitations (Table 3) we make three key assumptions when modeling the reutilization options for post-consumer wood:
1. Medium-density fiberboard (MDF), misplaced non-wood, and surface peeling from treated wood cannot be reutilized and must thus be incinerated for bioheat.
2. The majority of wood packaging and solid, untreated wood can potentially be reused or remanufactured.
3. Everything else can potentially be converted to recycled chips suited for use in the core layer of particleboards, with an upper limit of 50 percent of the total feedstock.
| Table 3. Claims and own assumptions about the technical options for reutilization of post-consumer wood listed with associated sources. | |
| Claims | Associated sources |
| Policy instruments that stimulate value chains that collect, repair, and redistribute obsolete wooden pallets and cable drums can unleash a great potential for reuse and remanufacture. | (Gedde et al. 2025) |
| Whole lengths of structural wood can be dismantled and reused. | (Sakaguchi et al. 2016; Whittaker et al. 2021) (Harte et al. 2020; Llana et al. 2020) |
| A lack of automated grading standards for reused structural wood has been identified as a limiting factor. | (Husgafvel et al. 2018; Harte et al. 2020) |
| A pioneering Norwegian standard for visual grading has recently been published. | (Standard Norge 2025) |
| Structural wood could be planed, sanded, sliced, and utilized for cross-laminated timber (CLT). | (Irle et al. 2015; Irle et al. 2019; Harte et al. 2020) |
| Strength testing experiments have investigated the limits of reuse. | (Llana et al. 2022; Carrasco et al. 2023; Dong et al. 2024) |
| Finger-jointed post-consumer sawnwood could potentially achieve strength classes of C18 and C24, approved for general construction, but this requires careful pre-sorting and laborious work to remove metal. | (Stolze et al. 2023) |
| Sorting machines, connecting high-speed assembly lines and advanced sensor technology can effectively reject impurities, clean, dry, and sort chipped post-consumer wood by species and qualities. | (Mancini et al. 2018; Friedrich et al. 2022; Lima et al. 2022; Irle et al. 2023; Konstantinidis et al. 2023; Mancini et al. 2024) |
| If allocated to the core layer of a particleboard, at least up to 50 percent of the fresh wood chips could be replaced with recycled chips, which is also reflected in current practice in Europe. | (Azambuja et al. 2018; Faraca et al. 2019a; Döring et al. 2021; Niemz and Sandberg 2022; Nguyen et al. 2023) |
| Technology able to recycle and reutilize wood fibers for medium-density fiberboard (MDF) is available. | (Lubis et al. 2018; Hong et al. 2020) |
| MDF constitutes less than a tenth of both consumed wood products and generated post-consumer wood in the Nordic-Baltic area. | (FAO 2025) |
| The model may be adjusted with respect to two pragmatic simplifications not expected to significantly affect the results: • Recycling of MDF fibers has a modest impact on Nordic-Baltic reutilization and can thus be omitted. • Reused and remanufactured pallets, cable drums, etc. can be included in the existing product categories for reused and remanufactured sawnwood. | Own assumptions |
By combining these three key assumptions with insights from analyses of the composition of discarded wood (Table 2), post-consumer wood is modeled as four separate quality fractions with differentiated technical boundaries for reutilization: ‘reusable’ (25 percent), ‘remanufacturable’ (15 percent), ‘recyclable’ (50 percent), and ‘incinerable’ (10 percent). Four different technologies able to treat one or more of these quality fractions are defined: ‘reuse center’, ‘assembly line for remanufacture’, ‘woodchipper’, and ‘high-tech sorting machine’ (Fig. 1). These technologies are able to return four different products to the market: ‘reused sawnwood’, ‘remanufactured sawnwood’, ‘recycled chips’, and ‘bioenergy chips’.
In accordance with current practice, a woodchipper may chip any quality fraction to produce bioenergy chips only suited for bioenergy production: local heat, district heat, and combined heat and power (CHP). While the incinerable fraction is predetermined to be incinerated for energy, the model has the flexibility to reutilize all other quality fractions for one or two optional second-life products. The reusable, remanufacturable, and recyclable fractions may be sent to a ‘high-tech sorting machine’ able to convert them to recycled chips suited for use in the core layer of particleboards. The reusable fraction may be sent to a ‘reuse center’ and converted to reused sawnwood. If processed by an ‘assembly line for remanufacture’, the remanufacturable fraction may be converted to remanufactured sawnwood.
This model setup is adapted to the influential 10R framework presented by Potting et al. (2017), where lower R numbers take precedence over higher R numbers to express the ideal cascading order. The second-life products incorporated in this model are thus ranked in the order: R3 (Re-use: ‘reused sawnwood’), R6 (Remanufacture: ‘remanufactured sawnwood’), R8 (Recycle: ‘recycled chips’), and R9 (Recover: ‘bioenergy chips’). In accordance with the EU’s recycling policies, we do not count R9 as reutilization as this implies incineration with energy recovery. Table 4 and Fig. 2 give an overview of the connections between technologies, compliant fractions, processes, second-life products, R number, and applicable use.
| Table 4. Connections between technologies, compliant post-consumer wood quality fractions, processes, second-life products, and applicable use. | ||||
| Technology | Compliant quality fractions | Processes | second-life product | Applicable use |
| Reuse center | Reusable | Cleaning, heating, repairing, removing fasteners. | Reused sawnwood (R3) | Same as fresh sawnwood |
| Assembly line for remanufacture | Remanufacturable | Screening, cutting, finger-jointing, planing. | Remanufactured sawnwood (R6) | Same as fresh sawnwood |
| High-tech sorting machines | Reusable Remanufacturable Recyclable | Sorting and cleaning pre-chipped post-consumer wood | Recycled chips (R8) | Core layer of particleboards (max 50%) |
| Woodchipper | Reusable Remanufacturable Recyclable Incinerable | Chipping of unsorted post-consumer wood | Bioenergy chips (R9) | Bioenergy (local heat, district heat, and combined heat and power (CHP)) |
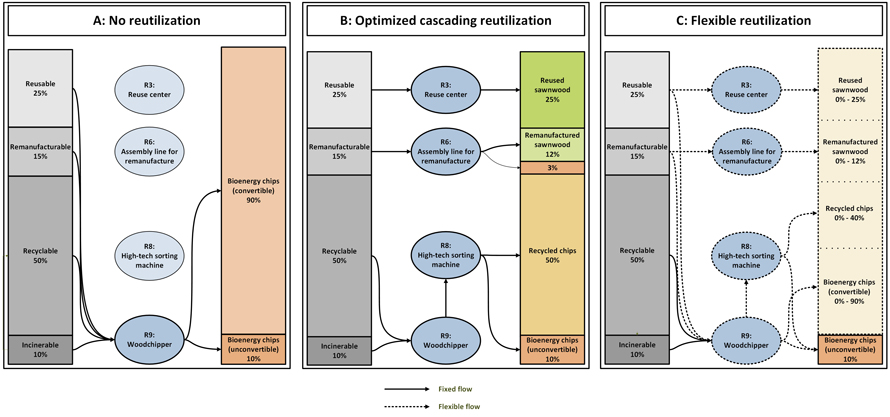
Fig. 2. The flow diagrams illustrate the modeled alternative pathways for reutilization of post-consumer wood. Illustration A shows a corner solution corresponding to the baseline scenario (0), where all quality fractions are chipped and used as bioenergy chips. Illustration B shows the opposite corner solution where a region reutilizes all quality fractions in optimized cascading order, in accordance with the hierarchy of the R Framework. Illustration C shows the model’s flexibility to reutilize some fractions, or parts of each fraction, at its highest level of quality, and the rest at lower levels. All intermediate solutions are available, which gives the model flexibility for unique allocations for each region based on welfare maximization. View larger in new window/tab.
After deducing a 20 percent shrinkage from the remanufacturing process, the model assumes a technical reutilization potential of 87 percent for unsorted post-consumer wood, which is consistent with estimates from Miljødirektoratet (the Norwegian Environmental Agency) (2021), claiming that 90 percent could be reutilized for particleboards.
For a country to meet its reutilization target, the specified proportion of post-consumer wood must be domestically refined to either reused sawnwood, remanufactured sawnwood, or recycled chips, but may be consumed anywhere within the Nordic-Baltic region. Quality fractions emerging from post-consumer wood may be transported separately for treatment at any location with compliant technology. The model determines endogenously which quality fractions are transported where, and how much is converted to which product, based on a reutilization-rate constraint and welfare maximization. The model uses the following order of decision:
(1) The reusable fraction is either
a. converted to reused sawnwood, or
b. transported to another region with compliant technology, or
c. added to the recyclable fraction
(2) The remanufacturable fraction is either
a. converted to remanufactured sawnwood, or
b. transported to another region with compliant technology, or
c. added to the recyclable fraction
(3) The recyclable fraction is either
a. converted to recycled chips, or
b. transported to another region with compliant technology, or
c. added to the incinerable fraction
(4) The incinerable fraction shall be converted to bioenergy chips.
When reutilization targets are imposed, some regions will optimize cascading by following the R hierarchy to the letter (B), while regions facing more extensive reutilization costs will continue with the current standard, converting all fractions to bioenergy chips (A) (Fig. 2). However, many regions will operate somewhere between these two corner solutions (C).
2.2.3 Constrained welfare maximization
The crucial cost assumptions used in modeling of the reutilization options described in section 2.2.2 can be summarized as follows:
• Remanufactured sawnwood: 2 hours of labor cost per cubic meter (m3). Calibrated so that remanufacture remains unprofitable until all reuse options are exhausted.
• Reused sawnwood: 0.5 hours of labor cost per cubic meter (m3). Calibrated to be unprofitable unless policy changes are implemented to incentivize reuse.
• Particleboard: Cost and consumption assumed to be identical for particleboards containing recycled chips and those made entirely from fresh wood. Calibrated to be unprofitable without policy changes. A maximum of 50 percent of particleboard production at any given location can be sourced from recycled chips.
• Energy: Cost and consumption assumptions are identical to comparable products from fresh wood. Costs are calibrated to ensure that historical amounts of post-consumer wood are consumed before policy changes are introduced. Total energy consumption remains constant, implying that if the post-consumer wood supply decreases, other woody biomass categories must compensate for the shortfall.
Transport costs are a critical factor in determining how much post-consumer wood is treated where it is generated, and how much is refined by another region. Post-consumer wood, reused sawnwood, and remanufactured sawnwood have equivalent transport costs to fresh sawnwood from spruce, while bioenergy chips and recycled chips have the same transport costs as fresh wood chips. The cost functions for reutilization are primarily designed to ensure a plausible market mechanism where the least expensive reutilization occurs first. Variable reutilization costs depend on labor costs that differ from country to country. The model allows for capacity expansions simply based on variable costs. To maximize welfare, given that the reutilization target is achieved, the model simultaneously considers net costs of each reutilization option, related transport costs, end-prices, and the subsequent impacts on all other partial markets.
2.3 Policy scenarios
In the baseline scenario, Norway exports 60 percent of its post-consumer wood to Sweden, where it is utilized for district heating and combined heat and power (CHP). Finland and Denmark also import post-consumer wood from the rest of the world, about half as much as Sweden in total. Official Nordic and Baltic data on the proportion of recovered post-consumer wood are incomplete. Recently updated 2021 data for Norway indicates that two fifths of the post-consumer wood was “sent to recycling” (Statistics Norway 2024b), which includes volumes rejected and discarded in the recycling processes. To our knowledge, these fractions are typically exported as wood waste and recycled in countries outside our specified model area. The internal recycling rate is unknown but assumed to be negligible. In the baseline scenario, we thus assume zero reutilization in the Nordic-Baltic region as all post-consumer wood is either utilized for bioenergy or exported abroad.
Since other materials seem even more challenging to recycle, we argue that the wood-specific recycling rate should be aligned with the general level in order to meet EU’s overall recycling requirements, which is planned to be scaled up to between 65 and 70 percent for all sectors by 2035. We thus include three reutilization levels: 30, 50, and 70 percent of domestically generated convertible post-consumer wood, by weight. The model thus forces each country to reutilize the specified proportion. The ‘incinerable’ fraction predefined to end up as ‘bioenergy chips (unconvertible)’ is omitted when calculating the level of achievement. These reutilization levels are first imposed on Norway alone, referred to as unilateral policy, then on the entire modeling area, referred to as multilateral policy. In total, six different hypothetical policies are compared with the baseline scenario. Defined policy codes (Table 5) are frequently used to refer to each distinct scenario in the results chapter.
| Table 5. Assigned policy codes related to given reutilization levels and policy alternatives. | ||
| Policy codes | Reutilization level (%) | Policy alternatives |
| 0 | 0 | Baseline |
| U30 | 30 | Unilateral (Norway) |
| U50 | 50 | |
| U70 | 70 | |
| M30 | 30 | Multilateral (Nordic-Baltic countries) |
| M50 | 50 | |
| M70 | 70 | |
Even though NFSM would otherwise have been well suited for dynamic time-series analysis, due to considerable uncertainty about the development of policy incentives, costs, and technology related to reutilization of wood, it was decided to run the model in “shock effect mode”. Hypothetical single-year results for the specified reutilization levels are thus compared with the baseline scenario based on available consistent 2021 data.
3 Results
3.1 Unilateral policies
When Norway sets unilateral reutilization targets, the export of post-consumer wood is reduced from initially 60 percent of what is domestically generated, constituting 1.1 million cubic meters, to either 36 (U30), 25 (U50), or 5 percent (U70). The export of unrefined post-consumer wood is replaced by nearly identical export volumes of recycled chips (Fig. 4), foremost utilized in Swedish and Baltic particleboard production. While the Norwegian particleboard price is nearly unaffected, the Baltic price is reduced by 4 percent in U70. The total Nordic-Baltic particleboard production of 3.4 million cubic meters in the baseline scenario increases by 13 (U30), 18 (U50), or 17 percent (U70). A summary of the production volumes of particleboards and other product categories is provided in Table 6.
| Table 6. Produced volumes in thousands of solid cubic meters (bioenergy output is given in GWh) and percentage change relative to the baseline scenario (0) in parentheses. | |||||||
| Norway | |||||||
| 0 | U30 | U50 | U70 | M30 | M50 | M70 | |
| Post-consumer wood | 1917 | 1917 - | 1917 - | 1917 - | 1917 - | 1917 - | 1917 - |
| Sawlogs | 6782 | 6739 (–0.6%) | 6739 (–0.6%) | 6719 (–0.9%) | 6570 (–3.1%) | 6469 (–4.6%) | 6430 (–5.2%) |
| Pulpwood | 6971 | 6987 (0.2%) | 6986 (0.2%) | 6994 (0.3%) | 6996 (0.4%) | 6998 (0.4%) | 7015 (0.6%) |
| Harvest residues | 0 | 0 - | 0 - | 0 - | 0 - | 0 - | 0 - |
| Dust | 308 | 308 (0.0%) | 308 (0.0%) | 308 (0.0%) | 310 (0.7%) | 308 (0.0%) | 308 (0.0%) |
| Bark | 1679 | 1675 (–0.2%) | 1656 (–1.4%) | 1678 (–0.1%) | 1637 (–2.5%) | 1569 (–6.6%) | 1616 (–3.8%) |
| Shavings | 17 | 17 (–0.2%) | 16 (–2.5%) | 17 (–0.2%) | 16 (–5.5%) | 15 (–12.3%) | 17 (1.2%) |
| Pellets | 87 | 87 (–0.4%) | 49 (–44.4%) | 87 (–0.6%) | 87 (0.0%) | 49 (–44.4%) | 49 (–44.4%) |
| Fresh wood chips | 1266 | 1272 (0.5%) | 1273 (0.6%) | 1273 (0.6%) | 1268 (0.2%) | 1270 (0.4%) | 1273 (0.6%) |
| Recycled chips | 0 | 452 - | 684 - | 1041 - | 505 - | 765 - | 786 - |
| Bioenergy chips | 774 | 709 (–8.4%) | 571 (–26.3%) | 607 (–21.6%) | 762 (–1.6%) | 1054 (36.2%) | 709 (–8.4%) |
| Bioenergy (GWh) | 7 | 7 - | 7 - | 7 - | 7 - | 7 - | 7 - |
| Fresh sawnwood | 3311 | 3305 (–0.2%) | 3296 (–0.4%) | 3306 (–0.1%) | 3171 (–3.9%) | 2999 (–9.4%) | 3168 (–4.3%) |
| Reused sawnwood | 0 | 65 - | 132 - | 163 - | 13 - | 97 - | 358 - |
| Remanufactured sawnwood | 0 | 0 - | 47 - | 4 - | 0 - | 0 - | 64 - |
| Particleboards | 405 | 405 (0.0%) | 445 (9.7%) | 405 (0.0%) | 418 (3.1%) | 405 (0.0%) | 464 (14.6%) |
| Plywood | 0 | 0 (0.0%) | 0 (0.0%) | 0 (0.0%) | 0 (0.0%) | 0 (0.0%) | 0 (0.0%) |
| Fiberboards | 170 | 170 (0.0%) | 170 (0.0%) | 170 (0.0%) | 170 (0.0%) | 170 (0.0%) | 170 (0.0%) |
| Nordics/Baltics | |||||||
| 0 | U30 | U50 | U70 | M30 | M50 | M70 | |
| Post-consumer wood | 6909 | 6909 - | 6909 - | 6909 - | 6909 - | 6909 - | 6909 - |
| Sawlogs | 84 921 | 84 630 (–0.3%) | 84 700 (–0.3%) | 84 529 (–0.5%) | 83 662 (–1.5%) | 82 898 (–2.4%) | 81 511 (–4.0%) |
| Pulpwood | 122 804 | 122 891 (0.1%) | 122 859 (0.0%) | 122 865 (0.1%) | 123 153 (0.3%) | 123 153 (0.3%) | 122 800 (0.0%) |
| Harvest residues | 14 021 | 14 763 (5.3%) | 14 806 (5.6%) | 15 500 (10.5%) | 16 397 (16.9%) | 17 320 (23.5%) | 18 208 (29.9%) |
| Dust | 11 350 | 11 310 (–0.4%) | 11 320 (–0.3%) | 11 295 (–0.5%) | 11 185 (–1.5%) | 11 090 (–2.3%) | 10 884 (–4.1%) |
| Bark | 30 186 | 30 140 (–0.2%) | 30 130 (–0.2%) | 30 113 (–0.2%) | 29 985 (–0.7%) | 29 802 (–1.3%) | 29 477 (–2.3%) |
| Shavings | 3000 | 2989 (–0.4%) | 2992 (–0.3%) | 2984 (–0.5%) | 2958 (–1.4%) | 2938 (–2.1%) | 2872 (–4.3%) |
| Pellets | 6919 | 6919 (0.0%) | 6880 (–0.6%) | 6936 (0.2%) | 6913 (–0.1%) | 6877 (–0.6%) | 6871 (–0.7%) |
| Fresh wood chips | 40 616 | 40 623 (0.0%) | 40 623 (0.0%) | 40 623 (0.0%) | 40 618 (0.0%) | 40 621 (0.0%) | 40 623 (0.0%) |
| Recycled chips | 0 | 452 - | 684 - | 1041 - | 1266 - | 1950 - | 2511 - |
| Bioenergy chips | 7360 | 6694 (–9.1%) | 6501 (–11.7%) | 6004 (–18.4%) | 5212 (–29.2%) | 4057 (–44.9%) | 2710 (–63.2%) |
| Bioenergy (GWh) | 116 | 116 - | 116 - | 116 - | 116 - | 116 - | 116 - |
| Reused sawnwood | 1 | 206 - | 133 - | 303 - | 874 - | 1181 - | 1544 - |
| Remanufactured sawnwood | 61 | 71 - | 105 - | 75 - | 72 - | 234 - | 657 - |
| Fresh sawnwood | 43 653 | 43 495 (–0.4%) | 43 532 (–0.3%) | 43 441 (–0.5%) | 42 959 (–1.6%) | 42 530 (–2.6%) | 41 797 (–4.3%) |
| Particleboards | 3363 | 3782 (12.5%) | 3966 (18.0%) | 3916 (16.5%) | 4056 (20.6%) | 4189 (24.6%) | 4142 (23.2%) |
| Plywood | 1831 | 1831 (0.0%) | 1831 (0.0%) | 1831 (0.0%) | 1831 (0.0%) | 1831 (0.0%) | 1831 (0.0%) |
| Fiberboards | 366 | 366 (0.0%) | 366 (0.0%) | 366 (0.0%) | 366 (0.0%) | 366 (0.0%) | 366 (0.0%) |
The Norwegian production of bioenergy chips falls from initially 40 percent of domestic post-consumer wood, equivalent to 0.8 million cubic meters, to 37 (U30), 30 (U50), or 32 percent (U70). The reduction roughly corresponds to the increased conversion to reused and remanufactured sawnwood. Unlike other Nordic and Baltic countries, Norway has not developed supply chains for harvest residues, and according to the model results, this resource remains untapped for all scenarios. When access to bioenergy chips depreciates, the use of fresh wood chips is increased to maintain Norwegian bioheat production at the fixed level. Average prices of fresh wood chips increase in Norway by 2 percent (U30), 4 percent (U50), or 8 percent (U70), whereas the effect on wood chip prices abroad is negligible. As Norwegian reutilization policy reduces export of post-consumer wood to Sweden first, this primarily reduces the supply of bioenergy chips in Sweden. The resulting bioheat loss, equivalent to between 1.0 and 1.4 TWh, is fully covered through increased use of harvest residues. Norwegian bioheat producers, on the other hand, replace their corresponding energy loss of between 0.1 and 0.4 TWh with increased use of fresh wood chips.
While Norwegian production volumes of fresh sawnwood, initially at 3.3 million cubic meters, are barely affected, reused and remanufactured sawnwood ensures that the total domestic sawnwood production increases by 2 to 5 percent. As domestic consumption is also nearly unaffected, the primary effect is reduced net imports from Sweden. Due to increased availability, sawnwood prices have a small but consistent decline in all Nordic and Baltic countries of about 1 percent. Domestic sawlog removals and sawlog prices are both reduced by less than 1 percent, while the increase in domestic pulpwood removals and prices is negligible. In response to Norwegian reutilization policies, the Swedish sawlog harvest is reduced by about 0.1 to 0.2 million cubic meters, approximately two to four times the corresponding volume reduction in Norway. In comparison, the Nordic-Baltic use of harvest residues increases by 0.7 (U30), 0.8 (U50), or 1.5 million solid cubic meters (U70). Due to these spillover and leakage effects, unilateral reutilization policies have a negligible impact on Norwegian wood harvest. For every cubic meter of reutilized wood, Norway reduces roundwood removals by as little as 0.05 (U30), 0.05 (U50), or 0.03 cubic meters (U70), whereas rates including effects in all Nordic-Baltic countries are 0.31 (U30), 0.19 (U50), or 0.24 (U70).
3.2 Multilateral policies
If the Nordic and Baltic countries implement harmonized wood reutilization policies, Norway’s net export of post-consumer wood is completely phased out when at least 50 percent of the post-consumer wood is reutilized in all countries (Fig. 3). In Norway, which has the highest labor cost, recycled chips prepared for export account for 63 to 98 percent of domestic reutilization. However, the trend in all other Nordic-Baltic countries is that reused and remanufactured sawnwood accounts for about half (Fig. 4). A summary of production volumes of all product categories is provided in Table 6.
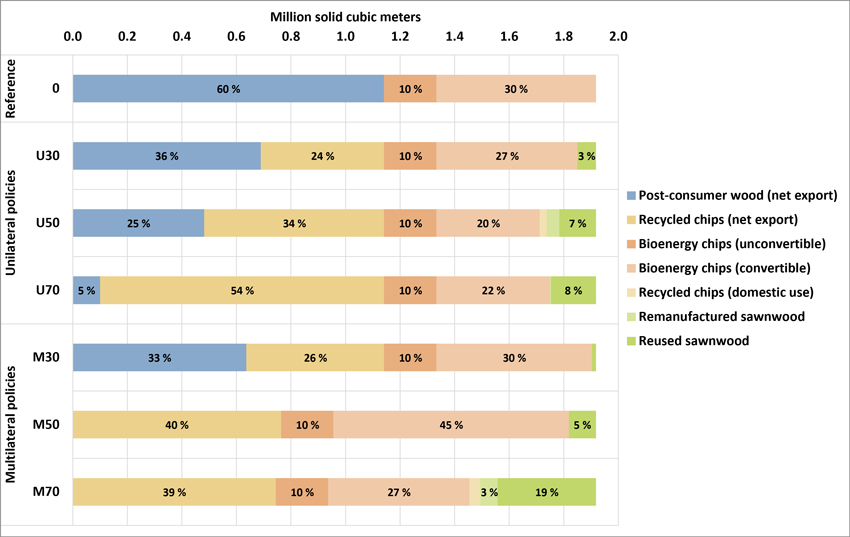
Fig. 3. The stacked bars illustrate the distribution of the aggregate end-use of post-consumer wood in Norway for the different scenarios, displayed in millions of solid cubic meters and percentage of total.
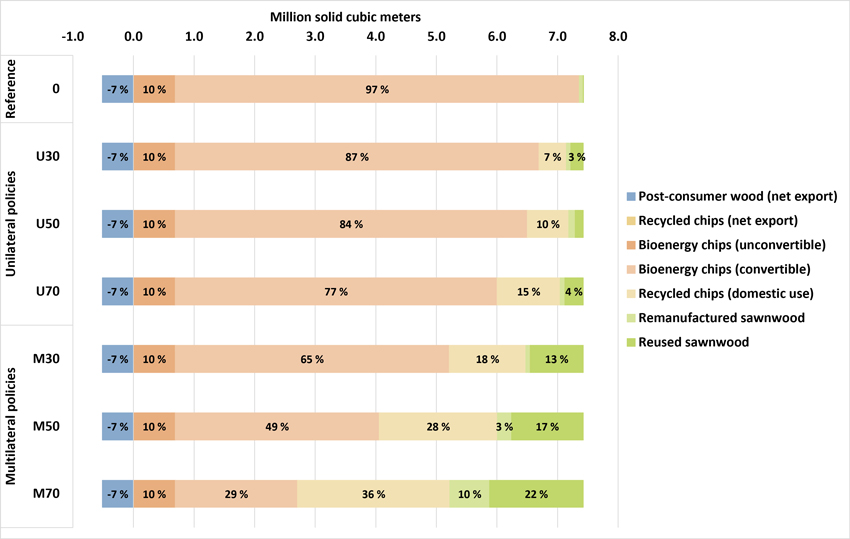
Fig. 4. The stacked bars illustrate the distribution of the aggregate end-use of post-consumer wood in the Nordic-Baltic countries for the different scenarios, displayed in millions of solid cubic meters and percentage of total.
Stepwise, Lithuania (M30), Estonia (M50), then Sweden and Denmark (M70) leverage the influx of recycled chips and consequently double their particleboard production. At M70 Norwegian particleboard production also increases by 15 percent. Simultaneously, a minor particleboard production of 0.1 million cubic meters in Finland (M50) and a major one in Latvia (M70), constituting 0.9 million cubic meters, is shut down. In total, Nordic-Baltic production increases by 21 (M30), 25 (M50), or 23 percent (M70). The overall trend is that Norway, Sweden, and Finland export recycled chips to Lithuania and Estonia: 1.2 (M30), 1.3 (M50), or 1.7 million cubic meters (M70). Particleboard prices are reduced by up to 3 percent in most countries, and by 3 to 7 percent in the Baltic countries.
Similarly to the unilateral scenarios, Norwegian bioheat producers replace bioenergy chips with fresh wood chips produced from pulpwood, and from by-production in sawmills. However, bioheat producers across the Nordic-Baltic market are increasing their output from harvest residues by 6 (M30), 9 (M50), or 12 TWh (M70) to replace bioenergy chips equivalent to 5 (M30), 7 (M50), or 10 TWh (M70), in addition to some fresh chips and bark. At M70 Sweden almost doubles the use of harvest residues, from a baseline of 2.6 to 5.1 million cubic meters, while Finland increases its use by a fourth, from 3.6 to 4.5 million cubic meters. The overall Nordic-Baltic utilization of harvest residues increases, from initially 14.0 million cubic meters, by 17 (M30), 24 (M50), or 30 percent (M70).
Like in the unilateral scenarios, reused and remanufactured sawnwood roughly replace the reduced production of fresh sawnwood in the Nordic-Baltic market, corresponding to 2 (M30), 3 (M50), or 5 percent (M70) of the initial sawnwood supply of 44 million cubic meters. Except for Denmark, which heavily depends on imported sawnwood, we see the same pattern of substitution across the Nordic-Baltic countries. Norwegian production of fresh sawnwood rebound from a 9 percent decrease (M50) to a 4 percent decrease (M70), in contrast to all other countries where production strictly declines as reutilization increases. This rebound resembles the mentioned increase in domestic particleboard production, contributing to a distinctive price “jump” for Norwegian fresh wood chips, from a 1 percent increase (M50) to a 5 percent increase (M70). Increasing reutilization rates result in strict price declines for sawnwood, from 3 to 8 percent in all Nordic and Baltic countries, where sawnwood of pine is more affected than sawnwood of spruce.
We see a consistent reduction in sawlog harvest in all Nordic-Baltic countries by 2 (M30), 2 (M50), or 4 percent (M70) from initially 85 million cubic meters. There is a corresponding price reduction for sawlogs from 1 to 7 percent, particularly harming Norwegian sawlogs from pine. Pulpwood harvest increases in insignificant proportions, while pulpwood prices increase by up to 2 percent. Like in the unilateral policy alternatives, Sweden and Finland have the largest sawlog reductions, in terms of volumes, followed by Norway and the Baltics. Compared to unilateral reutilization policies, the Nordic-Baltic sawlog harvest is reduced by two to six times more with multilateral policies while the increased utilization of harvest residues is two to five times greater.
For every cubic meter of reutilized wood, Norway reduces roundwood removals by 0.36 (M30), 0.33 (M50), or 0.26 cubic meters (M70) (Fig. 5). The corresponding impact rates in the overall Nordic-Baltic area are greater and increase when the reutilization rate increases: 0.42 (M30), 0.50 (M50), or 0.73 (M70). For every cubic meter of reutilized wood in the aggregate Nordic-Baltic area, the use of harvest residues increases by 1.11 (M30), 1.00 (M50), or 0.90 cubic meters (M70).
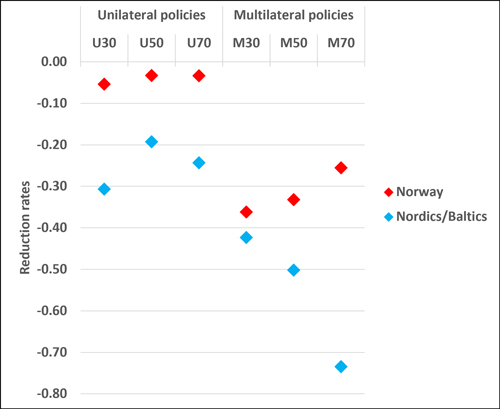
Fig. 5. The chart shows the relative reduction in logging compared to the baseline scenario (0). The reduction rate specifies the number of cubic meters of reduced roundwood harvest per cubic meter of reutilized post-consumer wood for each scenario, for Norway and the Nordic-Baltic area (including Norway), respectively.
4 Discussion
4.1 Interpretation of results
The interconnected effects of a) increasing supply of reused and remanufactured sawnwood, b) increasing supply of recycled chips, and c) decreasing supply of bioenergy chips, simultaneously push and pull in different directions. Distinguishing between the distinct causal relations is thus complicated. However, an economic theory-based analysis can help us separate and evaluate the major effects on roundwood harvest:
a) Increased supply of reused and remanufactured sawnwood reduces demand for fresh sawnwood, which also reduces the by-production of fresh wood chips, sawdust, and bark, and eventually the demand for sawlogs.
b) Increased supply of recycled chips increases particleboard production yet reduces the input from fresh wood chips. Reduced use of fresh wood chips affects the demand for wood chips emerging from both chipped pulpwood and by-production of sawnwood. Thus, an increased supply of recycled chips is expected to contribute to reduced demand for both pulpwood and sawlogs.
c) Decreased supply of bioenergy chips leads to increased demand for all wood-based substitutes suited for bioheat production: harvest residues, fresh wood chips, sawdust, bark, and pellets. Increased demand for such substitutes is partly covered by pulpwood-based production, sawlog-based by-production, and harvest residues, respectively.
By evaluating the results (Table 6), we can conclude that the increased demand for pulpwood resulting from c) roughly offsets the reduced demand for pulpwood caused by b). However, the reduced demand for fresh sawlogs caused by a) and b) outweighs the opposite effect from c). As the processing of sawlogs is reduced, the by-production of fresh wood chips, sawdust, bark, and pellets is reduced consequently. Reduced roundwood harvests also cause reduced availability of harvest residues. However, as most harvest residues are currently left unutilized at the logging site, the increased demand for them is, as expected, met with relatively few constraints.
The results show that a Norwegian unilateral reutilization target is an inefficient instrument for achieving reduced domestic roundwood harvest. Due to leakage effects, between 83 and 88 percent of the reduced roundwood harvest is allocated to foreign regions. Between 56 and 79 percent of the reduction is allocated to Sweden, and between 18 and 29 percent to Finland, while the Baltics tend to increase roundwood harvest. It should be noted that the NFSM is regularly calibrated against empirical data, and that its leakage effects have been shown to be consistent with findings from studies using other forest sector models. Market efficiency and high leakage effects are two sides of the same coin, signaling that a relatively transparent market with relatively homogeneous products, relatively low transport costs, and manageable trade barriers in general, like the Nordic-Baltic market for forest products, efficiently distribute goods from low-price markets to high-price markets. However, one should be cautious about drawing general conclusions based on a special case such as Norway.
There are several conditions that can help explain why Norway’s forest sector responds differently from other Nordic-Baltic countries. High labor costs result in high production and reutilization costs. Demanding topography, fragmented and unevenly distributed forest areas, and scattered settlements yield high transport costs, and excessive costs for extraction of roundwood and harvest residues. Large hydropower resources have kept Norwegian electricity costs remarkably low compared to the rest of Europe and thus limited the demand for alternative energy sources. Thus, although Norway generates more post-consumer wood per capita, other Nordic and Baltic countries produce five to ten times as much forest-based district heat. This explains why harvest residues are left unutilized at domestic logging sites and why major proportions of Norwegian post-consumer wood are exported to Swedish bioheat plants. Moreover, most of the Norwegian forest resources are in regions without coastlines, but with road connections to a dominant Swedish wood industry, while exports to other countries depend almost entirely on shipping. Therefore, the Norwegian forest sector is particularly interlinked with the Swedish forest sector.
In the baseline scenario (0), Norway exports 1.1 million cubic meters of post-consumer wood, corresponding to one-eighth of the total Nordic-Baltic volume, to meet the driving demand from Swedish bioheat producers. Both unilateral and multilateral policies lead to a strict decline in these exports as reutilization levels increase. Simultaneously, Norwegian exports of recycled chips are increasing by almost identical volumes. This shift profoundly disrupts the Nordic-Baltic forest value chains in two ways. Increased availability of recycled chips promotes increased particleboard production primarily in Sweden or Lithuania, depending on policy alternative, while reduced availability of bioenergy chips promotes increased use of harvest residues in Sweden, Finland, and the Baltics.
Another key factor is understanding how relative cost changes can affect the comparative advantage of regions and thereby trigger chain reactions or reach tipping points that result in unforeseen or counterintuitive effects. When moving from M50 to M70, 0.9 million cubic meters of particleboard production based on fresh wood chips is shut down in Latvia, counteracted by a production increase of 0.6 million cubic meters in Sweden, 0.2 million cubic meters in Denmark, and less than 0.1 million cubic meters in Norway, stimulated by a concurrent increase in production of recycled chips of 0.6 million cubic meters in Sweden and 0.3 million cubic meters in Finland. In the same interval, Norway’s bioheat producers incinerate 0.2 million cubic meters more of fresh wood chips in contrast to all other countries that increase their utilization of harvest residues. The Norwegian average price of fresh wood chips thus leaps from a 1 to a 5 percent increase. In forest-rich regions in Central Norway where the price is initially low and the increased incineration of fresh wood chips for bioheat occurs, this price effect is more pronounced. As increased wood chip prices increase the net sawmilling revenues, ceteris paribus, the production of fresh sawnwood also increases by substantial volumes in Central Norway. In the same interval, moving from M50 to M70, Finland, Sweden, and Norway increase their reuse and remanufacture of sawnwood by a total of 1.0 million cubic meters. The total Norwegian supply of freshly produced, reused, and remanufactured sawnwood thus shifts from a 7 percent decline to an 8 percent increase. As domestic consumption is stable, Norway reduces its net import of sawnwood from Sweden by 0.4 million cubic meters. Swedish sawnwood production declines accordingly, while sawlog harvest is reduced by 0.6 million cubic meters, and pulpwood harvest is increased by 0.2 million cubic meters.
This walkthrough attempts to make counterintuitive results more credible, while demonstrating how the model integrates different components of economic theory. First, it features a long chain reaction launched by increased reutilization which reduces the supply of bioenergy chips and thus increases the demand for fresh wood chips in Norway. Thus, the wood chip price increases and further stimulates domestic sawnwood production, and consequently the sawlog harvest. Second, it shows that particleboard producers are exposed to tipping points, where the production either shuts down when the end-price is too low to ensure profitability, or it doubles to increase profits when the supply of recycled chips shifts to a certain point. Although we expect similar tipping point mechanisms in the real world, one should interpret such sudden momentous changes with caution. Third, it shows that the model allows for efficient cross-border trade responses, yet neighboring regions are more exposed to each other. Fourth, when changes in relative income between Norwegian and Swedish sawmills cause the relative production ratio of sawnwood to shift, this demonstrates how the model incorporates the fundamental connection between trade and comparative advantages. Last, it shows how the lack of domestic incentives to utilize harvest residues is key to understanding why Norway’s unilateral reutilization policies primarily lead to reduced sawlog harvest in Sweden.
While the NFSM’s objective is to maximize social welfare within the forest sector, forcing reutilization that is initially unprofitable necessarily leads to reduced welfare estimates. The results show a decline in the overall Nordic-Baltic welfare of between 0.0001 and 0.0008 percent for all reutilization scenarios except M70 which has an associated decline of 0.0021 percent. Besides that, the measured welfare effects are negligible; there are at least two reasons why these should not be emphasized. First, the real cost of reutilization of wood is associated with great uncertainty. The model’s cost functions are thus pragmatically designed to ensure a plausible distribution between the different reutilization alternatives, as explained in section 2.2. Second, even though the Nordic-Baltic market’s willingness to pay for reutilized post-consumer wood apparently does not cover the associated costs, it is hasty to conclude that increased reutilization reduces social welfare. The implementation of the EU’s Green Deal is justified precisely by the necessity to correct the market failure from lacking valuation of ecosystems, sustainable use of resources, and human health (European Commission 2019). Incorporating adequate mechanisms into the NFSM to correct these deficient valuations is unfortunately far beyond the scope of this study.
4.2 Modeling choices
Depending on the policy alternative, the generated post-consumer wood is distributed and converted to reused sawnwood, remanufactured sawnwood, recycled chips, and bioenergy chips (Fig. 3, Fig. 4). This relative distribution is essentially a product of the modeling choices made, depending on highly uncertain reutilization costs, and should therefore be subject to critical evaluation. Recycled chips consistently make up most of the total reutilization, reused sawnwood makes up a larger share than remanufactured sawnwood, and that all end products in the Nordic region strictly increase when reutilization rates increase (Fig. 4, Table 6). The distribution also reflects the assumed potential, complexity, and maturity of the related technologies. The underlying assumption that economic incentives pull in the direction of post-consumer wood first being converted to recycled chips, then reused sawnwood, then remanufactured sawnwood is supported by our knowledge about European wood reutilization to date. Particleboard production in West Germany utilized recycled chips four decades ago (Kramer et al. 1985), and this is by far the most common reutilization method in Europe today (Vis et al. 2016; Cristóbal García et al. 2023). Although we have evident examples of how wood materials can be reused in practice (Pettersen 2005), the commercial supply of reused sawnwood is still limited to smaller enterprises in the start-up phase. Several prototypes for remanufactured sawnwood exist (Irle et al. 2015, 2019; Stolze et al. 2023), but to our knowledge, there are no commercial suppliers today.
In contrast to basic economic theory where negative shifts in supply are associated with reduced consumption, the model assumes that bioheat production from woody biomass will be maintained at a fixed level even if the supply of bioenergy chips is reduced. Moreover, bioheat from several alternative waste types can replace bioheat from wood. However, the district heating plants are generally built and adapted for incineration of given waste categories. Once a district heating plant has been built, heat production is assumed to primarily depend on the production capacity and exogenously given variables such as electricity price and outdoor temperature. If we assume that bioheat production from woody biomass will be reduced when reutilization of post-consumer wood increases, this will generally weaken the model’s effects, but primarily the utilization of harvest residues.
Even if all other Nordic and Baltic countries substantially increase the utilization of harvest residues when wood reutilization increases, Norwegian harvest residues remain unexploited. Several studies have estimated that Norway’s available harvest residues could annually produce between 5 and 10 TWh of bioheat (Bergseng et al. 2012, 2013), which would roughly double today’s forest-based bioheat production. Historically, low electricity prices have favored heat pumps (Mustapha et al. 2019) and thus reduced the demand for bioheat in Norway (Trømborg et al. 2011). As mentioned, Norway has distinctive cost drivers for utilization of harvest residues related to topography, distance to forest roads, and labor costs. Due to the lack of data the modeled Norwegian cost curve for utilization of harvest residues may be overestimated. If it turns out that increased reutilization of wood will trigger actual development of such value chains in Norway, we can expect the domestic impacts to be more similar to the model estimates for the other countries.
The NFSM assumes competitive markets across borders where producers disregard price effects from changing investment costs and production levels. Even if this simplification seems rather consistent with the relatively uniform nature of Nordic and Baltic wood products markets, the model may underplay local preferences and market variations, and thus overestimate leakage effects. Hu et al. (2024) recently used the NFSM to estimate the leakage effects from single Nordic countries and found leakage rates for roundwood within the range of 59 to 106 percent, where more than 70 percent of the leakage was absorbed by non-Nordic countries. The advantage of using a model with global coverage is that leakage effects towards regions outside the Nordic or European countries can be estimated. There is, however, a trade-off between coverage and accuracy in local analysis. The current model version requires that the Nordic-Baltic import and export volumes to the rest of the world are fixed to the 2021 level, and related leakage effects are consequently excluded from this study. By using the EFI-GTM, Kallio et al. (2018) and Päivinen et al. (2022) estimated leakage rates for roundwood to the rest of the world at 79 and 64 percent respectively as a response to reduced harvest in Europe. Schier et al. (2022) used the Global Forest Products Model (GFPM) and found that increased protection of European forests resulted in roundwood leakage rates of 50 or 63 percent depending on scenario. Based on these external estimates, large proportions of the change in production and harvest would have been absorbed by the rest of the world, if export and import rates had been flexible. Thus, current results most likely overestimate the Nordic-Baltic increase in particleboard production, increased use of harvest residues, and reduced sawlog harvest. As recycled chips are dedicated to the Nordic-Baltic particleboard production, which is also exposed to decisive tipping point mechanisms, this production increase may be particularly overestimated.
As mentioned in section 2.3, to avoid several uncertainties related to reutilization alternatives, it was decided to run the model in “shock effect mode” to produce hypothetical single-year results rather than making a dynamic time series forecast. As policy and technology developments are identified as sources of considerable and accelerating uncertainty in a five- to twenty-year perspective, comparing a hypothetical single-year scenario with a base year, was expected to provide more accurate and relevant information. A dynamic forecast, on the other hand, would have provided some supplementary insights about temporal allocations of production and harvest. As the effect of climate action critically depends on temporal allocation, it would be particularly appropriate to run a dynamic forecast when studying the carbon effects from reutilization of wood. The accuracy of a dynamic forecast would furthermore improve from better knowledge about how to estimate future quantities and quality distribution of post-consumer wood, as a predefinition of these values is required.
The model ignores the need for policy instruments to achieve reutilization targets. In reality, measures may be required to overcome several important barriers. Developing applicable product standards is vital to ensure that consumers and companies have confidence that it is safe to build with reused and remanufactured sawnwood (Harte et al. 2020). To utilize the post-consumer wood at its highest potential quality level, it may be necessary to carefully dismantle buildings rather than demolish, and to improve sorting at the source of waste (Altgen et al. 2025; Gedde et al. 2025). However, the main challenge is to ensure that the willingness to pay for reutilized wood products covers the related costs (Vis et al. 2016; Harte et al. 2020). Some stakeholders may be convinced to pay a premium for reutilized wood, for instance to achieve a supreme BREEAM certification (n.d.). However, to sufficiently strengthen the demand side, a broader requirement for the inclusion of reutilized materials in new construction projects is needed. Introducing requirements for a minimum content of recycled chips in particleboards would have an immediate effect. Alternatively, a subsidy on either the demand side or the supply side would help develop the market for reutilized wood. For instance, support for new technology and development of new value chains could direct investments into reuse, remanufacture, and recycling capacities. Governments could try encouraging cooperation between stakeholders to avoid conflicting interests and reduce uncertainty. A key point is that the Government, one way or another, contributes to reducing the risk of investments in reutilization of wood. A country that takes the lead may benefit from developing domestic value chains for wood reutilization on its own terms, which in turn may create favorable path dependencies.
5 Conclusions
We estimate that multilateral wood reutilization policies in the Nordic-Baltic area would prevent the harvest of 0.42 to 0.73 cubic meters of roundwood for every cubic meter of reutilized wood, and correspondingly 0.26 to 0.36 in Norway. Due to leakage effects, foremost towards Sweden, unilateral Norwegian policies would be less efficient and domestically save as little as 0.03 to 0.05 cubic meters of roundwood per cubic meter of reutilized wood, and between 0.19 and 0.34 in the aggregate Nordic-Baltic area. Unilateral reutilization policies provide noticeable harvest reductions if effects abroad are recognized. However, if the policy objective is to reduce domestic harvest, it is crucial to coordinate reutilization policies with adjacent countries. Under multilateral policies, we estimate that the utilization of harvest residues increases between 0.90 and 1.11 cubic meters for every cubic meter reutilized. A holistic policy framework should therefore also consider the climate and ecosystem effects from leaving less harvest residues at logging sites.
As trade in the Nordic-Baltic forest sector is highly integrated, we see a wide range of spillover effects between countries when implementing wood reutilization policies. Forest sector stakeholders in nonadjacent countries can be substantially affected by a single country’s intervention through extensive leakage effects and complex chain reactions. Particleboard production, which is dominated by a few large manufacturers, seems particularly sensitive to tipping point effects that may accelerate this market concentration. The results imply that, regardless of whether unilateral or multilateral wood reutilization policies are adopted, Norway’s low-hanging fruit is to prepare recycled chips for particleboards while reducing its extensive export of unrefined post-consumer wood to Swedish bioheat producers. A rapid scale-up of the supply of recycled chips strongly promotes particleboard production in the Baltics or Sweden. The Nordic-Baltic particleboard production increases by 13 to 18 percent in response to unilateral Norwegian reutilization policies, and by 21 to 25 percent in response to multilateral policies. As a result of reduced access to bioenergy chips, Sweden and Finland in particular substantially increase their utilization of available harvest residues to maintain bioheat production at fixed levels. Measured in solid cubic meters, the combined Nordic and Baltic use of harvest residues increases by one to five times the reduction in roundwood removals, depending on the policy option imposed. In response to unilateral Norwegian policies, the aggregate utilization of harvest residues increases by 5 to 11 percent, while it increases by 17 to 30 percent in response to multilateral Nordic-Baltic policies.
This study highlights the need for more comprehensive data on available volumes and qualities of post-consumer wood, as well as the cost of reutilization and investment costs of required technologies. Future research should furthermore explore the environmental impacts of wood reutilization, such as production and transportation emissions, biomass substitution in district heating, and reduced logging. Additionally, policy measures should consider both supply- and demand-side interventions, such as subsidies and mandatory recycling content, to accelerate the transition to a circular forest bioeconomy.
Declaration of openness, of research materials, data, and code
Input data and the model structure of the Nordic Forest Sector Model (NFSM) are described in Jåstad (2020) and Mustapha (2016). As described in chapter 2, the novel extension of NFSM is based on openly available data from the respective national statistical authorities and FAOSTAT data (FAO 2025). For further details on the applied data, please contact the corresponding author.
Authors’ contributions
Conceptualization: T.E.T.; E.O.J.; P.K.R.; E.T., data collection and analysis: T.E.T.; E.O.J., modeling: E.O.J., writing – original draft preparation: T.E.T.; E.O.J.; P.K.R.; E.T., writing – review and editing: T.E.T.; E.O.J.; P.K.R.; E.T., project administration: E.T.
Declaration of the use of generative artificial intelligence and AI-assisted technologies in the writing process
During this work’s preparation, the authors used ChatGPT and built-in writing tools in Word to improve the article’s readability and language. After using these tools, the authors have reviewed and edited the content. The AI service available through ki.sikt.no (model: GPT-5.4) was used to assist in organizing and formatting the reference list and to improve Highlights. Apart from this, AI tools have not been used in this study. The authors take full responsibility for this publication’s content.
Funding
Funding for this study was provided by the Research Council of Norway, grant number 328698: CircWOOD.
References
Alhanaqtah O (2023) Forecasting of the waste generation in Jordan: alternative econometric approaches. Int J Econ Fin 16: 35–50. https://doi.org/10.5539/ijef.v16n2p35.
Altgen M, Gedde KB, Ross L, Larnøy E (2025) Physical and chemical characterization of post-consumer wood chips for recycling. Waste Manag 200, article id 114762. https://doi.org/10.1016/j.wasman.2025.114762.
Azambuja RdR, de Castro VG, Trianoski R, Iwakiri S (2018) Utilization of construction and demolition waste for particleboard production. J Build Eng 20: 488–492. https://doi.org/10.1016/j.jobe.2018.07.019.
Belbo H, Gjølsjø S (2008) Trevirke – brennverdier og energitetthet. [Wood – calorific values and energy density]. Viten fra Skog og landskap 1/08. Norsk institutt for skog og landskap, Ås.
Bergseng E, Eid T, Trømborg E, Rørstad PK (2012) Bioenergiressurser i skog: kartlegging av økonomisk potensial. [Bioenergy resources in forests: mapping economic potential]. Rapport 32/2012. Norges vassdrags- og energidirektorat, Oslo.
Bergseng E, Eid T, Løken Ø, Astrup R (2013) Harvest residue potential in Norway – a bio-economic model appraisal. Scand J For Res 28: 470–480. https://doi.org/10.1080/02827581.2013.766259.
Bolkesjø TF (2004) Modeling supply, demand and trade in the Norwegian forest sector. Doctoral thesis. Department of Ecology and Natural Resource Management, Agricultural University of Norway, Ås.
BREEAM (n.d.) BREEAM. https://breeam.com/. Accessed 15 June 2026.
Carrasco EVM, Pizzol VD, Smits MA, Alves RC, Oliveira ALC, Mantilla JNR (2023) CLT from recycled wood: fabrication, influence of glue pressure and lamina quality on structural performance. Constr Build Mater 378, article id 131048. https://doi.org/10.1016/j.conbuildmat.2023.131048.
Cristóbal García J, Caro D, Foster G, Pristerà G, Gallo F, Tonini D (2024) Techno-economic and environmental assessment of construction and demolition waste management in the European Union. Publications Office of the European Union, Luxembourg. JRC135470. https://doi.org/10.2760/721895.
Directive (EU) 2018/851 (2018) Directive (EU) 2018/851 of the European Parliament and of the Council of 30 May 2018 amending Directive 2008/98/EC on waste. Official Journal of the European Union L 150: 109–140. http://data.europa.eu/eli/dir/2018/851/oj.
Directive (EU) 2018/852 (2018) Directive (EU) 2018/852 of the European Parliament and of the Council of 30 May 2018 amending Directive 94/62/EC on packaging and packaging waste. Official Journal of the European Union L 150: 141–154. http://data.europa.eu/eli/dir/2018/852/oj.
Dong W, Rose CM, Stegemann JA (2024) Cross-laminated secondary timber: validation of non-destructive assessment of structural properties by full-scale bending tests. Eng Struct 298, article id 117029. https://doi.org/10.1016/j.engstruct.2023.117029.
Döring P, Gieseking L, Mantau U (2021) Holzwerkstoffindustrie 2020. Entwicklung der Produktionskapazität und Holzrohstoffnutzung. [Development of production capacity and use of wood raw materials]. INFRO, Hamburg.
European Commission (2019) The European Green Deal. Communication from the Commission to the European Parliament, the European Council, the Council, the European Economic and Social Committee and the Committee of the Regions. COM(2019) 640 final. Publications Office of the European Union, Brussels.
European Commission (2020) A new Circular Economy Action Plan for a cleaner and more competitive Europe. Communication from the Commission to the European Parliament, the Council, the European Economic and Social Committee and the Committee of the Regions. COM(2020) 98 final. Publications Office of the European Union, Brussels.
European Commission (2023) European Green Deal: new EU-Norway Green Alliance to deepen cooperation on climate, environment, energy and clean industry. https://ec.europa.eu/commission/presscorner/detail/en/ip_23_2391. Accessed 15 June 2025.
European Paper Recycling Council (2023) Monitoring Report 2022 – European Declaration on Paper Recycling 2021–2030. European Paper Recycling Council, Brussels. https://www.paperforrecycling.eu/publications. Accessed 15 June 2025.
FAO (2024) The State of the World’s Forests 2024 – Forest-sector innovations towards a more sustainable future. FAO, Rome. https://doi.org/10.4060/cd1211en.
FAO (2025) FAOSTAT: forestry production and trade. Food and Agriculture Organization of the United Nations. https://www.fao.org/faostat/en/#data/FO. Accessed 15 March 2025.
Faraca G, Boldrin A, Astrup T (2019a) Resource quality of wood waste: the importance of physical and chemical impurities in wood waste for recycling. Waste Manag 87: 135–147. https://doi.org/10.1016/j.wasman.2019.02.005.
Faraca G, Tonini D, Astrup TF (2019b) Dynamic accounting of greenhouse gas emissions from cascading utilisation of wood waste. Sci Total Environ 651: 2689–2700. https://doi.org/10.1016/j.scitotenv.2018.10.136.
Fischer R, Zhunusova E, Günter S, Iost S, Schier F, Schweinle J, Weimar H, Dieter M (2024) Leakage of biodiversity risks under the European Union Biodiversity Strategy 2030. Conserv Biol 38, article id e14235. https://doi.org/10.1111/cobi.14235.
Forster EJ, Healey JR, Newman G, Styles D (2023) Circular wood use can accelerate global decarbonisation but requires cross-sectoral coordination. Nat Commun 14, article id 6766. https://doi.org/10.1038/s41467-023-42499-6.
Fraanje PJ (1997) Cascading of pine wood. Resour Conserv Recycl 19: 21–28. https://doi.org/10.1016/S0921-3449(96)01159-7.
Friedrich K, Koinig G, Pomberger R, Vollprecht D (2022) Qualitative analysis of post-consumer and post-industrial waste via near-infrared, visual and induction identification with experimental sensor-based sorting setup. MethodsX 9, article id 101686. https://doi.org/10.1016/j.mex.2022.101686.
GAMS Development Corporation (n.d.) GAMS Documentation Center. https://www.gams.com/latest/docs/. Accessed 5 May 2024.
Gedde KB, Larnøy E, Stenstad A, Müller D, Ross L (2025) Post-consumer wood in Norway: composition analysis and potential for reuse and recycling. J Mater Cycles Waste Manag 27: 3905–3918. https://doi.org/10.1007/s10163-025-02306-4.
GOV.UK (2024) UK statistics on waste. Department for Environment, Food & Rural Affairs. https://www.gov.uk/government/statistics/uk-waste-data/uk-statistics-on-waste#packaging-waste. Accessed 28 November 2024.
Harte AM, Uí Chúláin C, Nasiri B, Hughes M, Llana DF, Íñiguez-González G, de Arana-Fernández M, Shotton E, Walsh SJ, Ridley-Ellis D, Cramer M, Risse M, Ivanica R, Cristescu C, Sandberg K, Sandin Y, Turk G, Plos M, Šuligoj T, Hogan P (2020) Recovered timber in Europe – sources, classification, existing and potential reuse and recycling. National University of Ireland Galway, Galway. https://doi.org/10.13025/r2dt-jp43.
He R, Sandoval-Reyes M, Scott I, Semeano R, Ferrão P, Matthews S, Small MJ (2022) Global knowledge base for municipal solid waste management: framework development and application in waste generation prediction. J Clean Prod 377, article id 134501. https://doi.org/10.1016/j.jclepro.2022.134501.
Höglmeier K, Weber-Blaschke G, Richter K (2017) Potentials for cascading of recovered wood from building deconstruction – a case study for south-east Germany. Resour Conserv Recycl 117: 304–314. https://doi.org/10.1016/j.resconrec.2015.10.030.
Hong M-K, Lubis MAR, Park B-D, Sohn CH, Roh J (2020) Effects of surface laminate type and recycled fiber content on properties of three-layer medium density fiberboard. Wood Mater Sci Eng 15: 163–171. https://doi.org/10.1080/17480272.2018.1528479.
Hu J, Jåstad EO, Bolkesjø TF, Rørstad PK (2024) The quantification and tracing of leakage in the forest sector in Nordic countries. Forests 15, article id 254. https://doi.org/10.3390/f15020254.
Husgafvel R, Linkosalmi L, Hughes M, Kanerva J, Dahl O (2018) Forest sector circular economy development in Finland: a regional study on sustainability driven competitive advantage and an assessment of the potential for cascading recovered solid wood. J Clean Prod 181: 483–497. https://doi.org/10.1016/j.jclepro.2017.12.176.
Irle M, Privat F, Déroubaix G, Belloncle C (2015) Intelligent recycling of solid wood. Pro Ligno 11: 14–20.
Irle M, Privat F, Couret L, Belloncle C, Déroubaix G, Bonnin E, Cathala B (2019) Advanced recycling of post-consumer solid wood and MDF. Wood Mater Sci Eng 14: 19–23. https://doi.org/10.1080/17480272.2018.1427144.
Irle M, Lebreton F, Lagarde H (2023) Wood recycling in the circular bioeconomy. Pro Ligno 19: 3–11.
Jåstad EO (2020) Assessments of the future role of bioenergy in the Nordic energy and forest sectors. Doctoral thesis 2020:64. Norwegian University of Life Sciences, Ås. https://hdl.handle.net/11250/3053968.
Jåstad EO, Bolkesjø TF, Trømborg E, Rørstad PK (2019) Large-scale forest-based biofuel production in the Nordic forest sector: effects on the economics of forestry and forest industries. Energy Convers Manag 184: 374–388. https://doi.org/10.1016/j.enconman.2019.01.065.
Jåstad EO, Bolkesjø TF, Trømborg E, Rørstad PK (2021) Integration of forest and energy sector models – new insights in the bioenergy markets. Energy Convers Manag 227, article id 113626. https://doi.org/10.1016/j.enconman.2020.113626.
Kallio AMI, Solberg B, Käär L, Päivinen R (2018) Economic impacts of setting reference levels for the forest carbon sinks in the EU on the European forest sector. For Policy Econ 92: 193–201. https://doi.org/10.1016/j.forpol.2018.04.010.
Kallio M, Dykstra DP, Binkley CS (1987) The global forest sector: an analytical perspective. John Wiley & Sons, Chichester.
Kaza S, Yao L, Bhada-Tata P, Van Woerden F (2018) What a waste 2.0: a global snapshot of solid waste management to 2050. World Bank Publications. https://doi.org/10.1596/978-1-4648-1329-0.
Konstantinidis FK, Sifnaios S, Arvanitakis G, Tsimiklis G, Mouroutsos SG, Amditis A, Gasteratos A (2023) Multi-modal sorting in plastic and wood waste streams. Resour Conserv Recycl 199, article id 107244. https://doi.org/10.1016/j.resconrec.2023.107244.
Kramer JE, Lustenhouwer JWA, van Weenen JC (1985) Afvalhout: van misbruik naar hergebruik. [Waste wood: from misuse to reuse]. Energiekroniek 3532: 1170–1172. https://esb.nu/wp-content/uploads/2022/11/editie_pdfs_1985_0335_tcm445-256710.pdf. Accessed 28 November 2024.
Kunming-Montreal Global Biodiversity Framework (2022) Decision adopted by the Conference of the Parties to the Convention on Biological Diversity. CBD/COP/DEC/15/4.
Lähtinen K, Häyrinen L, Roos A, Toppinen A, Aguilar Cabezas FX, Thorsen BJ, Hujala T, Nyrud AQ, Hoen HF (2021) Consumer housing values and prejudices against living in wooden homes in the Nordic region. Silva Fenn 55, article id 10503. https://doi.org/10.14214/sf.10503.
Lesar B, Humar M, Hora G (2018) Quality assessment of recycled wood with and without non-wooden materials from selected recycling companies in Europe. Waste Manag 79: 362–373. https://doi.org/10.1016/j.wasman.2018.08.002.
Lima MDR, Ramalho FMG, Trugilho PF, Bufalino L, Dias Júnior AF, Protásio TdP, Hein PRG (2022) Classifying waste wood from Amazonian species by near-infrared spectroscopy (NIRS) to improve charcoal production. Renew Energy 193: 584–594. https://doi.org/10.1016/j.renene.2022.05.048.
Llana DF, Íñiguez-González G, de Arana-Fernández M, Uí Chúláin C, Harte AM (2020) Recovered wood as raw material for structural timber products: characteristics, situation and study cases: Ireland and Spain. In: Proceedings of the 2020 Society of Wood Science and Technology International Convention “Renewable Resources for a Sustainable and Healthy Future”, 12–15 July 2020, virtual conference. Society of Wood Science and Technology (SWST), pp 117–123.
Llana DF, González-Alegre V, Portela M, Íñiguez-González G (2022) Cross laminated timber (CLT) manufactured with European oak recovered from demolition: structural properties and non-destructive evaluation. Constr Build Mater 339, article id 127635. https://doi.org/10.1016/j.conbuildmat.2022.127635.
Lorang E, Lobianco A, Delacote P (2023) Increasing paper and cardboard recycling: impacts on the forest sector and carbon emissions. Environ Model Assess 28: 189–200. https://doi.org/10.1007/s10666-022-09850-5.
Lubis MAR, Hong M-K, Park B-D, Lee S-M (2018) Effects of recycled fiber content on the properties of medium density fiberboard. Eur J Wood Wood Prod 76: 1515–1526. https://doi.org/10.1007/s00107-018-1326-8.
Mancini M, Rinnan Å, Pizzi A, Mengarelli C, Rossini G, Duca D, Toscano G (2018) Near infrared spectroscopy for the discrimination between different residues of the wood processing industry in the pellet sector. Fuel 217: 650–655. https://doi.org/10.1016/j.fuel.2018.01.008.
Mancini M, Taavitsainen V-M, Rinnan Å (2024) Comparison of classification methods performance for defining the best reuse of waste wood material using NIR spectroscopy. Waste Manag 178: 321–330. https://doi.org/10.1016/j.wasman.2024.02.033.
Mehr J, Vadenbo C, Steubing B, Hellweg S (2018) Environmentally optimal wood use in Switzerland – investigating the relevance of material cascades. Resour Conserv. Recycl 131: 181–191. https://doi.org/10.1016/j.resconrec.2017.12.026.
Miljødirektoratet (2021) Analyse av tiltak og virkemidler for økt forberedelse til ombruk og materialgjenvinning av husholdningsavfall og lignende næringsavfall. [Analysis of measures and policy instruments for increased preparation for reuse and material recycling of household waste and similar commercial waste]. M-2021. Miljødirektoratet. https://www.miljodirektoratet.no/publikasjoner/2021/april-2021/m2021.pdf. Accessed 28 November 2024.
Mustapha W (2016) The Nordic Forest Sector Model (NFSM): data and model structure. INA fagrapport 38. Norwegian University of Life Sciences, Ås.
Mustapha WF, Kirkerud JG, Bolkesjø TF, Trømborg E (2019) Large-scale forest-based biofuels production: impacts on the Nordic energy sector. Energy Convers Manag 187: 93–102. https://doi.org/10.1016/j.enconman.2019.03.016.
Navare K, Arts W, Faraca G, Van den Bossche G, Sels B, Van Acker K (2022) Environmental impact assessment of cascading use of wood in bio-fuels and bio-chemicals. Resour Conserv Recycl 186, article id 106588. https://doi.org/10.1016/j.resconrec.2022.106588.
Nguyen DL, Luedtke J, Nopens M, Krause A (2023) Production of wood-based panel from recycled wood resource: a literature review. Eur J Wood Wood Prod 81: 557–570. https://doi.org/10.1007/s00107-023-01937-4.
Niemz P, Sandberg D (2022) Critical wood-particle properties in the production of particleboard. Wood Mater Sci Eng 17: 386–387. https://doi.org/10.1080/17480272.2022.2054726.
Niu Y, Rasi K, Hughes M, Halme M, Fink G (2021) Prolonging life cycles of construction materials and combating climate change by cascading: the case of reusing timber in Finland. Resour Conserv Recycl 170, article id 105555. https://doi.org/10.1016/j.resconrec.2021.105555.
Official Statistics Portal (2024a) Population at the beginning of year, population change and key vital statistics 1920–2024. Official Statistics Portal – Official Statistics of Latvia. https://data.stat.gov.lv/pxweb/en/OSP_PUB/START__POP__IR__IRS/IRS010/?loadedQueryId=1604&timeType=from&timeValue=1946. Accessed 5 July 2024.
Official Statistics Portal (2024b) Resident population at the beginning of the year. State Data Agency. https://osp.stat.gov.lt/statistiniu-rodikliu-analize?hash=5b7fa09d-7ace-4909-89d9-b8a8897da5ba#/. Accessed 5 July 2024.
Päivinen R, Kallio AMI, Solberg B, Käär L (2022) EU forest reference levels: the compatible harvest volumes compiled and assessed in terms of forest sector market development. For Policy Econ 140, article id 102748. https://doi.org/10.1016/j.forpol.2022.102748.
Pettersen N (2005) Pilotprosjektet Gjenbrukshus i Trondheim: en bro fra destruksjon til konstruksjon. [The recycled house in Trondheim: a bridge between destruction and construction]. Rapport TM 2004/02. Trondheim kommune, Miljøenheten, Trondheim.
Potting J, Hekkert MP, Worrell E, Hanemaaijer A (2017) Circular economy: measuring innovation in the product chain. Report 2544. Planbureau voor de Leefomgeving, The Hague.
Risse M, Weber-Blaschke G, Richter K (2017) Resource efficiency of multifunctional wood cascade chains using LCA and exergy analysis, exemplified by a case study for Germany. Resour Conserv Recycl 126: 141–152. https://doi.org/10.1016/j.resconrec.2017.07.045.
Sakaguchi D, Takano A, Hughes M (2016) The potential for cascading wood from demolished buildings: the condition of recovered wood through a case study in Finland. Int Wood Prod J 7: 137–143. https://doi.org/10.1080/20426445.2016.1180495.
Samuelson PA (1952) Spatial price equilibrium and linear programming. The American Economic Review 42: 283–303.
Schier F, Iost S, Seintsch B, Weimar H, Dieter M (2022) Assessment of possible production leakage from implementing the EU Biodiversity Strategy on forest product markets. Forests 13, article id 1225. https://doi.org/10.3390/f13081225.
Sirkin T, ten Houten M (1994) The cascade chain: a theory and tool for achieving resource sustainability with applications for product design. Resour Conserv Recycl 10: 213–276. https://doi.org/10.1016/0921-3449(94)90016-7.
Standard Norge (2025) Norsk Standard for evaluering av returtre – NS 3691. [Norwegian Standard for evaluation of recycled wood – NS 3691]. https://standard.no/fagomrader/byggevarer/evaluering-av-returtre--ns-3691/. Accessed 22 June 2025.
Statistics Denmark (2024) BEFOLK2: Population 1 January by sex and age. Statistics Denmark. https://www.statbank.dk/statbank5a/selectvarval/define.asp?PLanguage=1&subword=tabsel&MainTable=BEFOLK2&PXSId=236244&tablestyle=&ST=SD&buttons=0. Accessed 5 July 2024.
Statistics Estonia (2024) RV021: population by sex and age group, 1 January. Statistics Estonia. https://andmed.stat.ee/en/stat/rahvastik__rahvastikunaitajad-ja-koosseis__rahvaarv-ja-rahvastiku-koosseis/RV021. Accessed 5 July 2024.
Statistics Finland (2024) 11s3 – Population according to urban-rural classification by age and sex, 2000–2023. Statistics Finland. https://stat.fi/en/publication/cln1hx2mi45ec0bw1qnpxmxfv. Accessed 5 July 2024.
Statistics Norway (2017) 08604: Waste in the manufacturing industries, by industry (SIC2007), material and treatment (1 000 tonnes) 2008–2015. Statistics Norway. https://www.ssb.no/en/statbank/table/08604/. Accessed 4 June 2024.
Statistics Norway (2024a) 06913: Population and population changes, by contents and year. Statistics Norway. https://www.ssb.no/en/statbank/table/06913. Accessed 5 July 2024.
Statistics Norway (2024b) 09781: Treatment of waste from construction, rehabilitation and demolition of buildings (tonnes), by treatment, contents and year. Statistics Norway. https://www.ssb.no/en/statbank/table/09781/. Accessed 17 June 2024.
Statistics Norway (2024c) 10514: Waste account for Norway (1 000 tonnes), by material, year and source of origin. Statistics Norway. https://www.ssb.no/en/statbank/table/10514/. Accessed 21 March 2024.
Statistics Sweden (2022) Population and population changes in Sweden by sex. Year 1749–2023. Statistics Sweden. https://www.statistikdatabasen.scb.se/pxweb/en/ssd/START__BE__BE0101__BE0101G/BefUtvKon1749/. Accessed 5 July 2024.
Stolze H, Gedde K, Militz H (2023) Finger-jointing of recycled wood – potential technology for improved circular use of wood. Conference presentation. 19th Annual Meeting of the Northern European Network for Wood Science and Engineering, 11–12 October 2023, Ås, Norway.
Szichta P, Risse M, Weber-Blaschke G, Richter K (2022) Potentials for wood cascading: a model for the prediction of the recovery of timber in Germany. Resour Conserv Recycl 178 article id 106101. https://doi.org/10.1016/j.resconrec.2021.106101.
Taskhiri MS, Jeswani H, Geldermann J, Azapagic A (2019) Optimising cascaded utilisation of wood resources considering economic and environmental aspects. Comput Chem Eng 124: 302–316. https://doi.org/10.1016/j.compchemeng.2019.01.004.
Trømborg E, Sjølie HK (2011) Data applied in the forest sector models NorFor and NTMIII. INA fagrapport 17. Norwegian University of Life Sciences, Ås.
Trømborg E, Solberg B (1995) Beskrivelse av en partiell likevektsmodell anvendt i prosjektet “Modellanalyse av norsk skogsektor”. [Description of a partial equilibrium model applied in the project “Modelling the Norwegian forest sector”]. Rapport 14/95. Skogforsk, Ås.
Trømborg E, Havskjold M, Lislebø O, Rørstad PK (2011) Projecting demand and supply of forest biomass for heating in Norway. Energ Policy 39: 7049–7058. https://doi.org/10.1016/j.enpol.2011.08.009.
United Nations Environment Programme, International Resource Panel (2024) Global Resources Outlook 2024 – bend the trend: pathways to a liveable planet as resource use spikes. UNEP, Nairobi. https://wedocs.unep.org/handle/20.500.11822/44901.
Vis M, Mantau U, Allen B, Essel R, Reichenbach J (2016) CASCADES: study on the optimised cascading use of wood. Publications Office of the European Union, Luxembourg. https://doi.org/10.2873/827106.
Whittaker MJ, Grigoriadis K, Soutsos M, Sha W, Klinge A, Paganoni S, Casado M, Brander L, Mousavi M, Scullin M, Correia R, Zerbi T, Staiano G, Merli I, Ingrosso I, Attanasio A, Largo A (2021) Novel construction and demolition waste (CDW) treatment and uses to maximize reuse and recycling. Adv Build Energy Res 15: 253–269. https://doi.org/10.1080/17512549.2019.1702586.
Total of 92 references.

