Tuomas Niinistö  ,
Perttu Anttila,
Janne Kaseva,
Lauri Sikanen,
Kalle Kärhä,
Johanna Routa
,
Perttu Anttila,
Janne Kaseva,
Lauri Sikanen,
Kalle Kärhä,
Johanna Routa
Energy wood flows and the operational environment of supply chains in finland: insights from a supplier survey
Niinistö T., Anttila P., Kaseva J., Sikanen L., Kärhä K., Routa J. (2025). Energy wood flows and the operational environment of supply chains in finland: insights from a supplier survey. Silva Fennica vol. 59 no. 3 article id 25011. https://doi.org/10.14214/sf.25011
Highlights
- Most of the consumed energy wood is sourced within 100 km of the plant
- Energy wood transport distance increases with the higher consumption level of plant
- Industrial roundwood could cover 25–33% of roundwood burned
- Most of the stumps are sourced from land-use change areas
- Economic viability of harvesting small-diameter trees should be increased to divert energy wood harvesting to young forests.
Abstract
Energy wood supply has faced significant challenges in Finland in recent years. While forest chip consumption has increased, the cessation of wood imports from Russia has added pressure on the use of domestic forest resources. This study examined the status of energy wood supply to heat-only and combined heat and power (CHP) plants from the perspective of energy wood suppliers. The survey-based study particularly focused on energy wood transport distances, the origin of delivered energy wood, and the proportion of various assortments. The operational environment, including wood fuel storage capacity and policy impacts, was also investigated. The results indicate that most energy wood consumed as forest chips was sourced less than 100 km from the consumer plant. However, these transport distances depended on annual forest chip consumption at the delivery point plant. Notably, energy wood was supplemented by roundwood that otherwise would have been suitable for processing in the forest industry; the proportion of that was 25–33% of all roundwood delivered. The results of this study also highlighted the visible role of land-use change areas, especially for stump sourcing, while imported wood accounted for only a small fraction of the supply. In conclusion, to reduce the burning of industrial roundwood and to divert energy wood harvesting to young commercial forests, policy should place greater emphasis on the economic viability of harvesting small-diameter trees for energy production. Furthermore, uncertainty in the operational environment, caused by policy changes, should be mitigated.
Keywords
bioenergy;
forest chips;
energy transition;
energy wood procurement;
wood fuel supply
-
Niinistö,
Natural Resources Institute Finland (Luke), Latokartanonkaari 9, FI-00790 Helsinki, Finland
 https://orcid.org/0009-0006-2645-0095
E-mail
tuomas.niinisto@luke.fi
https://orcid.org/0009-0006-2645-0095
E-mail
tuomas.niinisto@luke.fi
-
Anttila,
Natural Resources Institute Finland (Luke), Latokartanonkaari 9, FI-00790 Helsinki, Finland
https://orcid.org/0000-0002-6131-392X
E-mail
perttu.anttila@luke.fi
-
Kaseva,
Natural Resources Institute Finland (Luke), Tietotie 4, FI-31600 Jokioinen, Finland
https://orcid.org/0000-0002-8167-5434
E-mail
janne.kaseva@luke.fi
-
Sikanen,
Natural Resources Institute Finland (Luke), Yliopistokatu 6b, FI-80100 Joensuu, Finland
https://orcid.org/0000-0001-6368-2879
E-mail
lauri.sikanen@luke.fi
- Kärhä, School of Forest Sciences, University of Eastern Finland, Yliopistokatu 7, FI-80101 Joensuu, Finland E-mail kalle.karha@uef.fi
-
Routa,
Natural Resources Institute Finland (Luke), Latokartanonkaari 9, FI-00790 Helsinki, Finland
https://orcid.org/0000-0001-7225-1798
E-mail
johanna.routa@luke.fi
Received 30 April 2025 Accepted 9 November 2025 Published 18 November 2025
Views 22709
Available at https://doi.org/10.14214/sf.25011 | Download PDF

Supplementary Files
1 Introduction
Wood energy constitutes a significant component of the energy system and serves as an important source of renewable energy in Europe. In Finland, however, wood fuel consumption has been particularly high compared to many other countries (United Nations 2018; Eurostat 2024). Since the early 2000s, the use of forest chips has increased notably in Finnish heat-only and combined heat and power (CHP) plants, driven by targets to expand the share of renewable energy (Finnish Council of State 2008). While these plants consumed 0.8 million m3 of forest chips in 2000, consumption totalled 11.0 million m3 in 2023. Of forest chips consumed in 2023, 7.7 million m3 originated from roundwood, 3.0 million m3 from logging residues, and the remaining volume from stumps (Official Statistics of Finland 2024a). Therefore, the forest chips used in heat-only and CHP plants represent a substantial share of Finland’s total wood consumption, which reached 75.4 million m3 of roundwood and 23.8 million m3 of forest industry by-products and wood residues in 2023 (Official Statistics of Finland 2024b).
Before the Russian invasion of Ukraine in 2022, Russian wood was an important source of raw material for the EU, and especially for Finland. In 2021, approximately three-quarters of the fuelwood and roundwood imported from Russia into the EU were delivered to Finland. (United Nations 2025). Consequently, the cessation of Russian wood imports has posed a significant challenge for both the Finnish forest industry and energy production. Compared to the forest industry, the situation has proven even more difficult for energy producers and suppliers of energy wood. Approximately 20% of forest chips consumed in heat-only and CHP plants in 2021 were imported, and 78% of all woodchip imports came from Russia (Official Statistics of Finland 2022a, 2022b). In 2023, imported chips accounted for only 7% of the forest chips consumed in heat-only and CHP plants (Official Statistics of Finland 2024a). Simultaneously, as competition for wood has intensified following the end of imports, the consumption of energy wood in the form of forest chips has increased significantly (Viitanen et al. 2023).
In response to difficulties in wood procurement, efforts were made in 2022 to promote the supply of domestic wood and secure wood supply through urgent policy measures, including support for the development of the terminal network (Ministerial Working Group on Preparedness 2022). As noted by Niinistö et al. (2025), the importance of terminals may increase as the development of alternative energy sources concentrates on the use of wood fuels during cold periods, thereby raising the demand for intermediate storage.
These changes in wood markets have had an impact on energy wood prices. According to official energy wood trade statistics, the average energy wood prices in standing sales in 2023 were more than double those in 2021 (Official Statistics of Finland 2024c). The corresponding difference for delivery sales was 49%. Furthermore, the plant price of forest chips rose substantially between 2019 and 2023 (Official Statistics of Finland 2024d). The rise in wood prices has been reflected in higher district heating costs (Finnish Energy Association 2024a).
In addition to prices, wood procurement areas and the regional use of forest resources have been undergoing change. Until recently, particularly in eastern Finland, Russian wood was a significant source of raw material for both the forest industry and energy generation for many decades. The increased demand for domestic wood has increased pressure on wood procurement and has shifted the regional balance between wood supply and consumption (Viitanen et al. 2023). Over the past few years, total harvesting volumes have been high. Indeed, in some regions, the total drain of wood has already exceeded the estimated maximum sustainable yield (Official Statistics of Finland 2024e). Particularly due to price and logistical considerations there have been limited opportunities to replace Russian wood with imports from other countries (Viitanen et al. 2023). This has been especially pertinent for energy wood, which is less expensive than industrial wood, and for which logistics costs can easily exceed the price of the raw material.
Despite the cessation of Russian wood imports and increased consumption, the prospects for sourcing energy wood in Finland are estimated to remain reasonable. In Finnish silviculture, the tending of young commercial forests has posed a longstanding challenge. These forests have been recognised as potential sources of energy wood and forest chip consumption has significantly increased, yet, the problem has persisted and the proportion of forests with good silvicultural quality has remained relatively low. According to the 13th, latest National Forest Inventory (NFI) results, silvicultural quality was good in only 25% of young thinning stands (National Forest Inventories 2024).
Efforts to address the challenge of managing reserves have particularly focused on supporting silvicultural thinning in young commercial forests and small wood collection for energy purposes (Ministry of Agriculture and Forestry in Finland 2015). These subsidies were designed to encourage forest owners and compensate for the higher harvesting costs of small-diameter wood, which can otherwise become an obstacle to forest management activities. Lately, the costs of wood harvesting and transport have risen. From an economic perspective, this makes thinning sites with a small-diameter wood less attractive, because the stem size of removal in the stand (m3 stem–1) is small and hectare-based removals (m3 ha–1) are low (Kärhä 2011b; Petty and Kärhä 2014; Viitanen et al. 2023; Strandström 2024). Meanwhile, as part of the government’s austerity measures, subsidies for small wood collection has been reduced by Government Decree 871/2024 of amending the government decree on the temporary incentive scheme for forestry. That reduction would further decrease the competitiveness of these sites in the wood market.
Increased consumption of domestic forest chips has partly been met by roundwood that would otherwise have been suitable for processing by the forest industry, i.e., industrial roundwood (Viitanen et al. 2023). This switch stems from factors related to harvesting costs and removals as well as the end of Russian imports of high-quality forest chips, mainly from large-sized roundwood. Conversely, the increase in energy wood prices has increased liquidity and narrowed the price gap between energy wood and industrial roundwood (Official Statistics of Finland 2024c, 2024f). This has resulted in the energy and forestry industries competing for some of the same wood resources (Viitanen et al. 2023).
Due to the absence of legal obligations to precisely monitor wood fuel consumption, the exact amount of industrial roundwood burned remains unknown. The political aim is to divert wood to the highest possible level of processing. The recently updated renewable energy directive (RED III) (European Parliament and Council 2023a) prohibits national subsidies for energy use of industrial roundwood as being contrary to the cascade principle. However, RED III contains no prohibition of the burning of industrial wood or limitation of its classification as renewable energy. Based on wood consumption and harvesting statistics, the use of industrial roundwood for energy is around 2–3 million m3 per year (Viitanen et al. 2023). In 2023, this amount would have represented approximately 20–40% of the forest chips produced from roundwood (Official Statistics of Finland 2024a). This roundwood has most likely been pulpwood, given significant price differences between energy wood and sawlogs (Official Statistics of Finland 2024c, 2024f).
The present study aimed to examine the current state of energy wood supply. Although forest chips are an important energy source in Finland, there is only limited previous research on the operational environment of energy wood supply chains. However, this study focused solely on the energy wood procurement of heat-only and CHP plants, and small-scale usage of forest chips, for example on farms, was excluded from the analysis. The most recent study of energy wood supply is from 2012 by Kurki et al. (2012). Since then, forest chip consumption volumes have increased significantly while energy wood imports have decreased. Nevertheless, up-to-date knowledge of the current operational environment would be essential as a basis for political actions and regulations affecting the use and supply of forest chips.
Against this background, we wanted to investigate the quality and origin of delivered energy wood in 2023. Specifically, we wanted to identify the volumes of industrial roundwood burned as forest chips. We also wanted to identify current energy wood transport distances. To investigate this, we wanted to know the distances from which energy wood is sourced for each plant, and based on these data, create a statistical model for energy wood procurement areas. This model aims to estimate the distribution of distances over which energy wood is procured for an individual plant, in relation to the plant’s geographical location. We also aimed to investigate the available terminal capacity of energy wood suppliers and its current utilization rate. As political regulation concerning the procurement of energy wood has increased, we also wanted to investigate the opinions of energy wood suppliers on the impact of policy regulations related to the supply of energy wood.
2 Material and methods
2.1 Research survey of energy wood and forest chip deliveries
The present study is based on a questionnaire regarding energy wood deliveries to heat-only and CHP plants (Supplementary file S1). Both energy wood suppliers and energy wood consumers with their own energy wood procurement operations from forest to end use, were posed a number of questions related to their operations and the operating environment.
The companies and respondents were selected from public data sources, such as advertisements to purchase energy wood. As the total number of suppliers remained unknown, we strived to collect as comprehensive a sample of energy wood suppliers as possible. This process resulted in a total of 158 supplier.
First, we asked respondents to identify the delivery volume of ready-made forest chips or wood used as raw material for forest chips in 2023. The respondents also allocated volumes by delivery point to the end-user’s plants or wood terminals. We excluded brokerage sales of energy wood, where wood is sold to other than end consumer, from the study. This definition allowed the accurate determination of the total transport distances.
Respondents identified the proportion of different energy wood assortments in the total volume of energy wood and forest chips supplied. The energy wood assortment classification was based on Official Wood Energy Statistics Survey (2024g), which also distinguishes industrial roundwood – defined as wood that, based on its dimensions and quality, could otherwise have been suitable for processing by the forest industry. Similarly, other roundwood included all roundwood except industrial. Although accurate data for deliveries of industrial roundwood may have been unavailable, we considered energy wood suppliers to be the most reliable source of information for estimating quantities.
Additionally, in the survey, respondents identified the volume of delivered imported forest chips and energy wood, and other potential imported solid wood fuels. In relation to the origin of the supplied energy wood, it was also necessary to determine the volume of wood sourced from land-use change areas, for example, construction sites where forest is converted to other use.
To study energy wood procurement areas and transport distance distributions, the respondents divided the delivery volumes for each plant or terminal into seven transport distance categories, expressed as a proportion of the total volume. We designed this classification to capture transport distance differences with sufficient accuracy, while still enabling data to be reported by as many energy wood supplier companies as possible, even if accurate data were not available. For the same reason, we requested the proportions of the distance categories to be reported as percentages rather than as exact delivery volumes. In cases where accurate data on transport distances were unavailable, it was possible to provide the best estimate. These transport distance data concerned only domestic wood from the harvesting site to the end user’s plant or terminal, although the total delivery volumes may also include imported wood. This restriction to analyse the regional pressure on domestic forest resources was caused by forest chip usage.
We also asked energy wood suppliers about terminal capacity and its usage. Terminals in the survey were defined as permanent storage areas of at least 0.5 hectares. To obtain relevant data, we asked the respondents to specify terminal capacity in terms of area (in hectares), wood volumes, or both, with the proportion of the capacity that was asphalted to be reported separately. Furthermore, the respondents divided the terminal capacity into seven transport distance categories, expressed as percentage proportions of the total capacity. These proportions were based on the locations of the plants to which the energy wood or forest chips are delivered from the terminal. As well as this, we investigated the importance and usage of terminals in energy wood procurement. For this purpose, the survey asked participants about the volume of energy wood, forest chips, and other solid wood fuels stored in terminals in autumn 2023, before the start of the heating season.
The survey also included questions related to EU legislation and its potential effects on silviculture and energy wood supply. In recent years, the EU has developed and set new legislation and restrictions to meet the political climate and environmental objectives. For this reason, we sought to understand how companies themselves perceive the potential impacts. Thus, we asked energy wood suppliers to share their preparedness for the changes brought about by recently imposed RED III (European Parliament and Council 2023a) and Regulation of Deforestation-free Products EUDR (European Parliament and Council 2023b), and how these regulations are relevant to energy wood procurement. We selected these policy measures for survey because they are the most important current policy measures related to the use of forest resources from the perspective of energy wood procurement.
Before the data collection phase, we tested the survey questions with one energy wood supplier company and collected feedback from several experts in the field. The data collection for the survey took place between April and May in 2024, and was conducted by the researchers of this study, who gave respondents two weeks to complete the survey. The data collection phase ensured that enough data was gathered for the analysis. After the response period ended, data collection was supplemented with telephone interviews. These interviews were targeted based on the perceived importance of the respondents as energy wood suppliers.
2.2 Analysis
We excluded responses from companies that did not supply energy wood in 2023 from the analysis, as these respondents fell outside the scope of this study. Similarly, some responses included volumes delivered to other end consumers than heat-only and CHP plants; these volumes were also excluded from the data. Additionally, some answers were incomplete for certain questions. However, if the company had energy wood deliveries in 2023, we accepted these incomplete responses for analysis, and they were used solely in analyses where the available data were useful. Consequently, the coverage of the data analysed varied across the questions. The representativeness of the data was assessed by comparing the volume of energy wood delivered by the suppliers included in the data with the recorded volume of forest chips consumed in heat-only and CHP plants in 2023. In the study, wood volumes were allowed to be provided in cubic metres, loose cubic metres, or megawatt-hours. Based on conversion factors from the report by Alakangas et al. (2016), all volumes were converted to solid cubic metres (m3). Based on the conversion factors used, 1.0 solid cubic metre was equivalent to 0.4 loose cubic metre or 2.0 megawatt-hours.
The respondents and organisations they represented were divided into three classes: energy wood harvesters and traders, and energy companies and heat entrepreneurs, and forest industry companies. The first group, energy wood harvesters and traders, focus on energy wood deliveries but do not consume wood fuels themselves. The second group, energy companies and heating entrepreneurs, are energy wood consumers and operate their own procurement companies. The third group, forest industry companies, mainly focus on the production of forest industry products.
The share of different energy wood assortments, as well as the proportion of imported wood and wood from land-use change areas, were analysed in relation to the total amount of energy wood delivered to both plants and terminals from the responses, based on the responses where this data was provided. Conversely, we analysed the procurement areas and supply distances of energy wood only for the quantities of energy wood and forest products delivered directly to the plants; terminal deliveries were excluded from this analysis. This exclusion was due to the fact that, in many cases, the exact location of the terminal was unknown. Additionally, it was unclear which plant the wood was delivered to from the terminal, information that would have been necessary to analyse the total transport distances. However, consignments delivered to the end-user terminal were included if it was known that the terminal was located within 15 km of the plant for which it primarily supplies fuel. Some consignments delivered to individual plants or terminals, for which the location was not known, were excluded from the analysis.
The analysis of the procurement areas and transport distance distributions aimed to determine the exact location of the delivery points in order to identify potential regional differences in the size of procurement areas. According to Wood in Energy Generation statistics (2024a), the consumption of forest chips varied in different parts of Finland. This is influenced by factors such as population density, the location of forest industry plants and the availability of by-product wood from the forest industry for energy generation. As a result, the analysis considered delivery distances by region. To ensure sufficient observations from each region, Finland was divided into four major areas (Fig. 1). This regional classification is similar to the one used in the study by Niinistö et al. (2025).
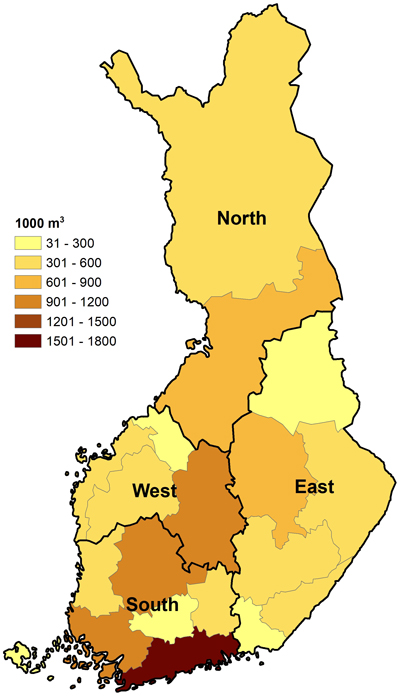
Fig. 1. Forest chip consumption (solid cubic metres) in 2023 by region and by the four major area classifications used in this study, in Finnish heat-only and combined heat and power (CHP) plants (Official Statistics of Finland 2024a).
Additionally, it was important to classify the delivery points according to their annual consumption of forest chips, as the consumption was assumed to influence the supply area. This classification was based on fuel consumption data from public data sources, such as district heating statistics by Finnish Energy Association (2024b) and companies’ public annual- and sustainability reports. In the present study, we created three consumption categories: <5000, 5000–20 000, and >20 000 m3 of forest chips consumed per year. The design of these categories was influenced by the accuracy of the available consumption data and the assumption that these volume ranges, along with the differences between them, sufficiently reflect the differences in the scale of activity at the plants, thereby capturing variations in procurement areas.
Transport distance distributions and were analysed using generalized linear mixed models (GLMM). Given the proportional nature of the response variable (the proportion of energy wood deliveries), a beta distribution with logit link was employed. This choice was appropriate because the response variable is bounded between 0and 1, and the beta distribution accommodates this constraint better than the normal distribution assumed by a standard linear model (LM). The forest chip consumption (<5000, 5000–20 000, >20 000 m3), transport distance (0–24.9, 25–49.9, 50–74.9, 75–99.9, 100–150, >150 km) and their interaction were used as fixed effects. To account for correlation among repeated observations from the same plant across distance classes, we specified a residual-side compound symmetry (CS) covariance structure. The GLMM framework also enabled us to test spatial grouping variables (municipality, region, and four major areas) as random effects, although these were omitted from the model due to non-significance. The general form of the model was:
![]()
where μijk is the expected proportion of deliveries for plant i in distance category j and chip consumption category k; β0 is the intercept; β1, β2, β3 are fixed-effect coefficients for distance category, chip consumption class and their interaction; and εijk is the residual error term with CS covariance structure as described above.
The default GLM parameterization was used, where one level per factor is omitted due to linear dependency. Parameter estimates are expressed relative to the overall intercept under GLM constraints. Inference and interpretation were based on LS-means on the response scale, which are invariant to coding. The model used residual pseudo-likelihood (RSPL) estimation, with degrees of freedom calculated via the Kenward-Roger method (Kenward and Roger 2009). Residuals normality was assessed using residual plots. Tukey’s method was applied for pairwise comparisons of means with a significance level of 0.05. Analyses were conducted using the GLIMMIX procedure in the SAS Enterprise Guide 8.3 (SAS Institute Inc., Cary, NC, USA).
Terminal network and its usage were investigated from the perspective of whether it is sufficient to support the functioning of energy wood supply chains in the event of increased intermediate storage and longer storage times in the future. The capacity of terminals was analysed for those energy wood suppliers who provided this information. The questionnaire allowed terminal capacity to be reported in hectares, as a volume of wood in storage, or both. If a respondent reported having terminal capacity but only one unit of measurement was provided, the other measurement was estimated by using the average figures from those respondents who provided both units of measurement.
Our study also examined the operational environment of the energy wood procurement by analysing open questions related to current EU policies. These questions were used to assess how many companies have considered the potential impacts of RED III and EUDR and how the responding companies have reacted to these policies.
3 Results
3.1 Respondents of the survey
A total of 82 respondents completed the research survey questionnaire, consisting of companies and forestry associations. For the analysis of the quality of delivered energy wood, we excluded 17 responses from organisations that had not delivered energy wood in 2023 and one response with data too incomplete for analysis. The final analysis was based on the responses of 65 operators. The total delivery volume from these respondents was 6.058 million m3, of which 4.553 million m3 was delivered to plants and 1.506 million m3 to end consumers’ terminal. This amount included both ready-made forest chips and different kinds of energy wood assortments as raw materials of forest chips.
Energy wood harvesters and traders was the largest group by number (Table 1). Correspondingly, energy companies and heating entrepreneurs was the smallest group both in terms of quantity and delivery volume. The third group, forest industry companies, had the largest supply volume among the respondents. According to the results, most energy wood suppliers are relatively small compared to the largest operators in the sector. In terms of number, more than half of the respondent suppliers were focused on harvesting and trading energy wood. Despite representing a smaller number of respondents, forest industry companies supplied the largest volume of energy wood compared to the other two groups of suppliers. Their average delivery volume per company was nearly three times higher than that of companies focused solely on the trade of energy wood. Additionally, a third group of suppliers consisted of energy companies and heating entrepreneurs, including independent energy wood procurement firms owned by energy wood consumers.
| Table 1. Finnish energy wood suppliers and their total, average, and median supply volumes in 2023 by type of company in the analysed survey data of energy wood deliveries. | ||||
| Type of supplier | Number of suppliers | Annual supply volume, 1000 m3 | Average supply volume by supplier, 1000 m3 | Median supply volume by supplier, 1000 m3 |
| Energy wood harvesters and traders | 36 | 1984 | 55 | 39 |
| Energy companies and heat entrepreneurs | 14 | 1824 | 130 | 12 |
| Forest industry companies | 15 | 2251 | 150 | 22 |
| Total | 65 | 6058 | 93 | 30 |
3.2 Delivered energy wood
The amount of energy wood and forest chips delivered by respondents consisted of industrial roundwood (976 000 m3), other roundwood (3.003 million m3), logging residues (2.048 million m3), and stumps (32 000 m3). Overall, roundwood, including both industrial and other roundwood, was the most significant type of energy wood delivered, accounting for 66% of the total. It was supplied by all respondents. The proportions of different energy wood assortments, however, varied between different types of respondent suppliers (Fig. 2).
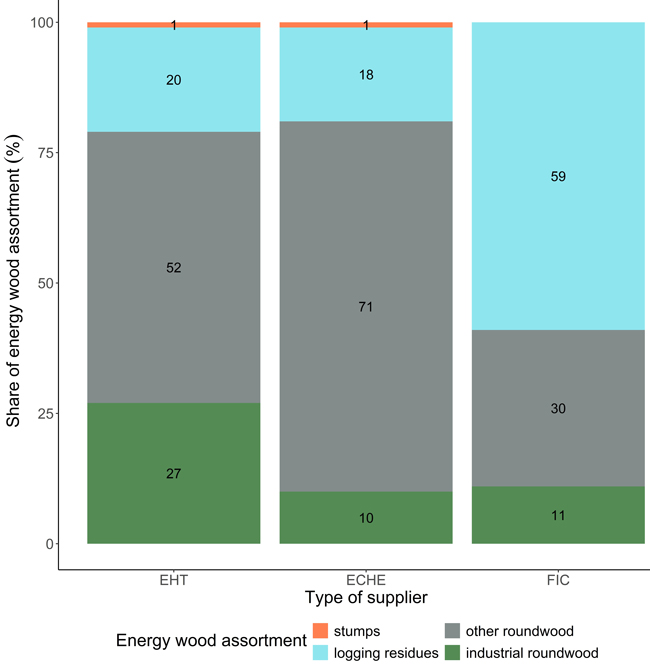
Fig. 2. The proportion of energy wood assortments varied by supplier type in the data of survey for energy wood deliveries in Finland in 2023. The total delivery volume of energy wood harvesters and traders (EHT) was 1.984 million m3, energy companies and heat entrepreneurs (ECHE) presented a total of 1.824 million m3 and forest industry companies (FIC) totalled 2.251 million m3. In total, the data included information from 65 Finnish energy wood suppliers. The EHT supplier group included 36 operators, ECHE 14 operators and FIC 15 operators.
The proportion of assortments varied significantly between respondents, which also depended on the type of supplier. Among energy wood harvesters and traders, the share of industrial roundwood was considerably higher. These suppliers, together with the energy companies and heat entrepreneurs, delivered 77% of the total roundwood volume. In contrast, forest industry companies, which carry out most of the annual regeneration felling in Finland, delivered 65% of logging residues in the analysed data. The volume and proportion of other roundwood, additionally, were notably lower among forest industry companies compared to the other two supplier types.
Of the total volume of roundwood, 25% could have been suitable for processing in forest industry as pulpwood or sawlogs. According to the results, 42 out of 65 respondents had supplied industrial roundwood for energy purposes. For those respondents who supplied industrial roundwood, this accounted for 33% of the total roundwood supplied.
The volume of imported wood delivered was minimal, with only four respondents providing the volume. Of these, three had imported forest chips or energy wood to be used as raw material for forest chips (Table 2). The volume of imported other solid wood fuels was 51 thousand m3, 99% of which was bark, with the remainder consisting of recycled wood. The country of origin of the imported wood remained unknown.
| Table 2. A total of three Finnish energy wood suppliers who responded to the survey indicated that they have supplied imported energy wood and forest chips and provided the corresponding volumes. The supply volumes reported by these three suppliers are presented by energy wood assortment, expressed in solid cubic metres. | ||||||
| Respondents, pcs | Supply by energy wood assortment | |||||
| Total | Industrial roundwood | Other roundwood | Logging residues | Stumps | ||
| Total supply volume, 1000 m3 | 3 | 1909 | 121 | 885 | 897 | 6 |
| Imported wood supply, 1000 m3 | 3 | 94 | - | 79 | 15 | - |
| Share of imported wood, % | 3 | 5 | - | 9 | 2 | - |
The respondents also reported the deliveries of wood sourced from land-use change areas (Table 3). However, many of the survey respondents either left the question blank or indicated that the amount could not be reported. For this reason, the table only presents data for those 16 respondents who provided information. For these respondents, the volume of energy wood from land-use change areas was significant, particularly for assortments such as industrial roundwood and stumps. Additionally, deliveries of stumps from these 16 respondents accounted for 73% of the total delivery volume of stumps in the survey data.
| Table 3. A total of 16 Finnish energy wood suppliers who responded to the survey indicated that they have sourced wood from land-use change areas and provided the corresponding volumes. The supply volumes reported by these 16 suppliers are presented by energy wood assortment, expressed in solid cubic metres. | ||||||
| Respondents, pcs | Supply amount by energy wood assortment | |||||
| Total | Industrial roundwood | Other roundwood | Logging residues | Stumps | ||
| Total supply volume, 1000 m3 | 16 | 1816 | 210 | 901 | 690 | 15 |
| Supply of wood sourced from land-use change areas, 1000 m3 | 16 | 148 | 30 | 75 | 36 | 8 |
| Share of wood sourced from land-use change areas, % | 16 | 8 | 14 | 8 | 5 | 52 |
3.3 The transport distances of energy wood
The data on transport distances covered a total of 4.216 million m3 of energy wood or wood chips delivered to the end-user’s plant or terminals, which were located 15 km or less from the presumed consumer plant. Additionally, the data included information from 47 energy wood suppliers, and these volumes had been transported to 153 different delivery points. Although the analysed data included multiple delivery points and data from each of the four major regions, the number of delivery points varied by region (Table 4).
| Table 4. The number of delivery points, and the total number of deliveries in the dataset used for the transport distance analysis in this study, and total consumption. The data are based on a 2023 survey of energy wood deliveries in Finland. The table also shows the consumption of forest chips in 2023, according to the Wood in Energy Generation statistics (Official Statistics of Finland 2024a). The volumes are expressed in solid cubic metres. | |||
| Region | Number of delivery points, pcs. | Total delivery volume in data, 1000 m3 | Recorded forest chip consumption in 2023, 1000 m3 |
| South | 57 | 1537 | 5142 |
| East | 57 | 1577 | 2434 |
| West | 23 | 380 | 2152 |
| North | 16 | 722 | 1301 |
| Total | 153 | 4216 | 11 028 |
The results also indicate a variation in the transport distances across different supplier types, with the shortest distance category being more common among energy wood harvesters and traders (Fig. 3). Similarly, the two largest distance categories were more universal for forest industry companies and energy companies and heat entrepreneurs.
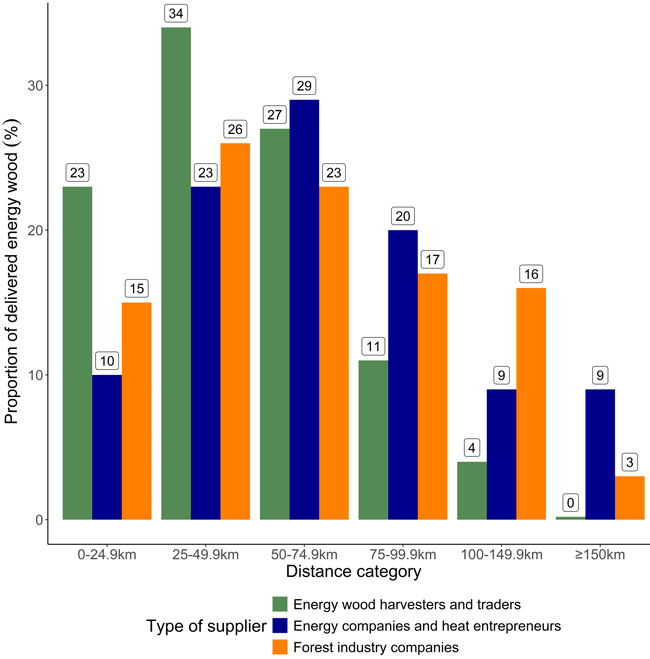
Fig. 3. The proportion of the six transport distance categories in relation to the amount of energy wood delivered, split into three categories by supplier type, based on the analysed survey data of energy wood deliveries in Finland in 2023.
The data of total deliveries by transport distances were also divided into three forest chip consumption categories based on the consumption by delivery point plant. The data indicates that as the annual plant-specific forest chip consumption increases, the proportions of longer distance categories become larger. In two smaller consumption categories, over 70% of the energy wood was delivered within 50 kilometres of the end consumer plant, while in the category of the largest plants, the proportion of longer distances increased, and the proportion of energy wood transported from a distance of less than 50 km was 38%. Similarly, the proportion of energy wood delivered farther than 50 km from the delivery point was 22–28% for plants consuming less than 20 000 m3, compared to 62% for the largest plants. However, in the analysed data, the amount of delivered energy wood for larger plants was greater compared to the other two categories.
The created delivery distance model predicts the proportion of each of the six distance categories in the total amount of energy wood delivered to the plant (Fig. 4; Suppl. file S2). In addition to the data-based actual transportation distance proportions specific to each plant, the explanatory variable in the model is the annual amount of forest chips used by the plant divided into three consumption categories. The explanatory power of the developed model was 37%.
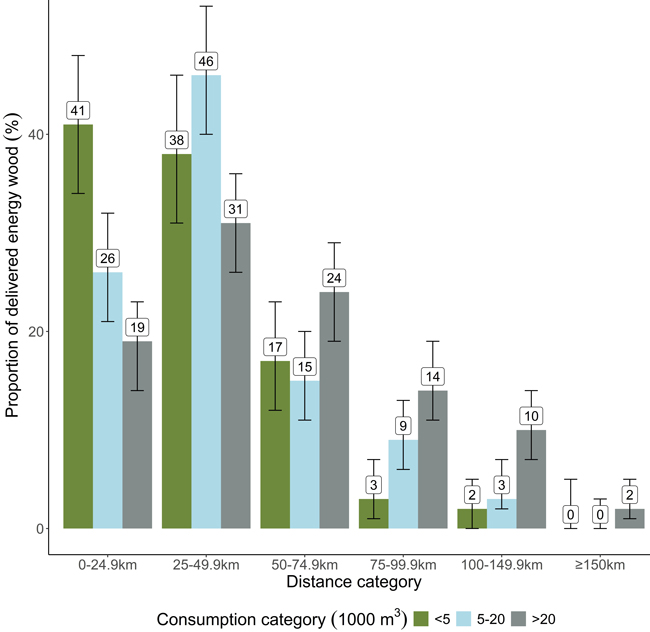
Fig. 4. Estimated proportions for each distance and consumption category based on the developed energy wood transport model of Finland. The model is based on survey data of energy wood deliveries in Finland in 2023. The figure presents the 95% confidence interval for each estimate. Full parameter estimates for fixed effects (logit scale) are provided in Supplementary file S2.
We found significant differences between forest chip consumption categories (F2,891 = 9.4, p < 0.001), transport distance categories (F5,767 = 52.2, p < 0.001), and their interaction (F10,765 = 7.6, p < 0.001). To explore these effects in more detail, we conducted pairwise comparisons of forest chip consumption categories within each transport distance category. These comparisons revealed multiple statistically significant differences across all distance categories (Table 5). However, the smallest differences were observed between the lowest consumption categories.
| Table 5. p-values of the Tukey-Kramer multiple comparison test, which examined the statistical significance of the combined effect of forest chip consumption and transport distance category on the proportion of energy wood delivered for each transport distance category. Statistically significant p-values (p ≤ 0.05) are bolded. | |||
| Distance category | p-values for comparisons of consumption categories of forest chips | ||
| <5 vs. 5–20 | <5 vs. >20 | 5–20 vs. >20 | |
| 0–24.9 km | 0.006 | <0.001 | 0.098 |
| 25–49.9 km | 0.241 | 0.227 | 0.001 |
| 50–74.9 km | 0.903 | 0.138 | 0.030 |
| 75–99.9 km | 0.040 | 0.001 | 0.144 |
| 100–149.9 km | 0.484 | 0.006 | 0.015 |
| ≥150 km | 0.977 | 0.348 | 0.263 |
3.4 Terminal network of energy wood suppliers
Information on terminal capacity was provided by a total of 60 respondents. A total delivery volume for these respondents was 5.535 million m3 of energy wood and forest chips, with an average delivery amount of 92 000 m3 and a median of 30 000 m3. Of the deliveries from these suppliers, 4.487 million m3 was delivered directly to the plant, and the remainder was delivered to end consumers’ terminals. However, only 36 of these respondent suppliers reported their own terminal capacity. These suppliers were larger suppliers, and the total delivery amount of these was 4.801 million m3 of which 4.133 million m3 was delivered to the plants of end users. The average supply volume per company was 133 000 m3 and median 42 000 m3.
The total terminal capacity of 36 companies was 312 hectares, of which 78 hectares were asphalted. Most of this capacity was located close to the plants. Approximately 60% of the capacity was situated within 25 km of the plant to which the wood fuels are delivered (Table 6).
| Table 6. A total of 36 Finnish energy wood suppliers who responded to the survey indicated that they have their own terminal capacity and provided corresponding figures. A terminal was defined as permanent storage areas of at least 0.5 hectares, where suppliers can store energy wood or wood fuels during the supply chain. The terminal capacity reported by these 37 suppliers is presented in hectares, broken down by distance category. The distance refers to the location of the terminal capacity in relation to the location of the plants to which these suppliers deliver energy wood. | ||
| Distance category | Area, ha | Share of total capacity, % |
| 0 km | 44 | 14 |
| 0.1–24.9 km | 143 | 46 |
| 25–74.9 km | 86 | 27 |
| 75–99.9 km | 32 | 10 |
| 100–149.9 km | 7 | 2 |
| Total | 312 | 100 |
The amount of solid wood fuels in the terminals was 1.124 million m3 in autumn 2023, prior to the start of the winter heating season. Of this amount, 849 000 m3 consisted of forest chips or energy wood used as raw material for forest chips, while the remaining 275 000 m3 comprised other solid wood fuels, such as bark. This means that, compared to the total capacity of the respondents, the utilisation rate of terminals was 44% on average.
3.5 Political operating environment of energy wood procurement
A total of 48 respondents answered the question on the impact of RED III on energy wood procurement. Most of these respondents mentioned that no preparations had been made for the changes introduced by the Directive. However, a total of 13 respondents were informed about the content of the directive and had at least some level of assessment of its impact on the activities of these companies. Six of these respondents estimated that the potential impact would be minor. Many respondents also mentioned that information on the practical application of the Directive in Finland is still lacking, as the Directive is still in the process of being transposed into national law and more detailed information on its application is awaited.
The question related to the EUDR was answered by 49 respondents. Fourteen respondents indicated that they were prepared for the impact of the EUDR. However, as in the question related to RED III, many respondents mentioned that there was insufficient information on the regulation. Five respondents still estimated that the potential impact of the EUDR would be minor. Additionally, five respondents criticised increasing regulation and the bureaucracy it creates.
4 Discussion
4.1 The prospects for wood energy consumption and energy wood markets
Despite the sharp increase in energy wood prices, demand has remained strong. In addition to renewable energy targets and emission trade, the policy objective to phase down energy peat consumption, emphasized by Prime Minister Sanna Marin’s government, has increased pressure to use forest chips in recent years (Finnish Government 2019; Niinistö et al. 2025).
However, in the future, persistently high energy wood prices are likely to encourage investments in alternative energy generation technologies (Niinistö et al. 2025). Moreover, increasing production volumes in the forest industry are also expected to contribute to maintaining high wood prices (Viitanen et al. 2024). A significant increase in wood imports from the Baltic Sea region is unlikely, and the wood consumed is likely to be mainly domestic in the coming years. The findings of Jonsson and Sotirov (2025) suggest that the balance between forest resources and wood demand in Europe may become increasingly strained by the 2030s, particularly due to the pressures imposed by renewable energy targets.
The Russian invasion of Ukraine and the resulting decline in energy imports have further emphasized the importance of domestic energy sources in ensuring the functioning of society. Nevertheless, forest chips and wood fuels in general currently play a significant role in the Finnish energy system and are expected to remain important for at least the next decade (Koljonen et al. 2024; Niinistö et al. 2025). It is therefore important to ensure the operational capability of energy wood supply chains for national supply security.
4.2 Industrial roundwood usage in energy generation
The results of the present study indicate that industrial roundwood use for energy has increased due to the increased consumption of forest chips. Due to significant price differences between energy wood and saw logs, this roundwood is most likely pulpwood (Official Statistics of Finland 2024c, 2024f). The volume of imported wood has been low, and compared to energy wood harvested, the consumption has been higher (Official Statistics of Finland 2024a, 2024e, 2024h). Therefore, roundwood volume consumed for energy most likely is partly comprised of wood harvested and recorded as pulpwood but then converted into energy wood and used as a raw material for forest chips (Viitanen et al. 2023). This conclusion is further supported by two facts. Since 2021, compared to domestic commercial fellings of sawlogs and pulpwood, combined exports of domestic logs and pulpwood, as well as consumption in forest industry production, have been low (Official Statistics of Finland 2024e, 2024h, 2024i).
According to the results of our research, the increase in the proportion of industrial roundwood delivered for burning was less significant than expected. According to Kurki et al. (2012), in Finland in 2011, industrial roundwood accounted for 17% of the total energy wood volume sold. In our results, this proportion was 16%. Additionally, in our study, when precise information was unavailable, we asked respondents to provide their best data estimate, which may have introduced inaccuracies. Furthermore, in the case of some respondents, the burning of industrial roundwood may have been underreported or completely unreported due to the lack of data or the social debate surrounding the issue.
Based on our study, industrial roundwood accounted for 25% of the roundwood delivery volume. For those respondents who reported delivering industrial roundwood, this proportion constituted 33% of the roundwood supplied. Finnish heat-only and CHP plants consumed 7.7 million m3 of forest chips produced from roundwood in 2023 (Official Statistics of Finland 2024a). To this amount, when we generalise the 25% share of industrial roundwood delivered observed in this study, we estimate industrial roundwood burned to be 1.9 million m3. When we apply the 33% highlighted by those who reported industrial roundwood deliveries, this amount would be 2.6 million m3. Both of these estimated amounts align with previous estimates, which have suggested that the annual burning volume of industrial roundwood is typically 2–3 million m3 in Finland (Viitanen et al. 2023).
Even though the share of industrial roundwood was smaller than expected, the amount was still significant. This energy use of industrial roundwood also helps explain why, compared to the increase in forest chip usage in heat-only and CHP plants, the management areas for young commercial forests, identified by the NFI (2024), have decreased less. According to Petty and Kärhä (2011), to encourage energy wood supply from management areas of small-diameter trees, subsidies are an important tool. However, to encourage forest owners to sell wood and manage these young-stand forests, current subsidies may be insufficient. Compared to larger-sized industrial roundwood, small-sized wood involves higher harvesting costs, which these subsidies may fail to cover. On the other hand, Petty and Kärhä (2011) also demonstrated that energy wood procurement cannot rely solely on subsidies. Excessive subsidies could, for example, reduce the natural development of energy wood harvesting practices and supply chains. Furthermore, the increased demand for domestic energy wood and forest chips appears to have raised the price of energy wood sufficiently to make harvesting profitable in all logging sites. On the other hand, the anticipated growth in wood use in the forest industry in the coming years and the possible rise in wood prices due to demand may also help to curb the burning of wood for energy.
In addition to emission reductions, the importance of forest carbon sequestration, in particular, has been highlighted in national climate policy. The burning of roundwood has been viewed as problematic due to its contribution to increased harvesting volumes of roundwood (Kallio et al. 2013; Soimakallio et al. 2016; Kunttu et al. 2021). Based on the latest data, forests of Finland have been a source of emissions since 2021, primarily due to increased soil emissions and increased logging volumes (Natural Resources Institute Finland 2025). On the other hand, in the short term, there are few alternatives to replace fossil fuels and peat, which, for example, accounted for 22% of the fuels consumed in district heating production in 2024 (Finnish Energy Association 2025).
4.3 Energy wood import and supply from land-use change areas
In Finland, the energy wood supply is supplemented by imports, but based on this survey, imported forest chips and energy wood accounted for only 1.6% of the total supply, and were supplied by only three respondents. Furthermore, the results of this study indicated that 2% of delivered energy wood was sourced from land-use change areas. However, the volume of wood sourced from land-use change areas varied significantly between companies and regions, and the data does not necessarily allow for general conclusions about the size of these shares at the national level. Additionally, though some respondents reported sourcing wood from land-use change areas, the quantities were unknown and, therefore, not provided.
In the volumes of wood sourced from land-use change areas, the proportion of industrial wood was higher than in total delivery volumes. This can be attributed to logistical reasons, as it is not economically viable to transport small payloads of pulpwood or sawlogs separately for processing by the forest industry (Tahvanainen and Anttila 2011). In addition, the results of this study indicate that land-use change areas are a significant source of stumps used for energy generation, with 37% of the stumps in the analysed data to having originated from such areas. For respondents who provided information on the quantities of wood supplied from land-use change areas, the proportion was 52%. Based on these proportions, it can be estimated that in 2023, of the 281 000 m3 of stumps consumed in heat-only and CHP plants, between 100 000–150 000 m3 would have come from land-use change areas.
4.4 Energy wood transport distances
The results by Kärhä et al. (2024) demonstrated that higher wood consumption and transport volumes increase transport distances, which in turn increases wood procurement costs. However, it is challenging to evaluate the changes in energy wood transport distances arising from our study due to the increased use of energy wood, as there is a lack of previous comparable research. According to Kurki et al. (2012), energy wood end consumers most commonly sourced their energy wood from within 100 km from the plant. For other operators, such as energy wood traders, the corresponding figure was 60 km. However, these results only present the maximum transport distances and do not indicate the proportions of the different distances as reported in our study.
4.5 Terminal network
Although the results by Kärhä (2011a) indicated that terminal-based forest chip supply chains increase the overall supply costs, the use of terminals is likely to expand as wood increasingly serves as a balancing power source and consumption volumes become more variable (Niinistö et al. 2025). Terminal-based supply chains have the potential to improve the security of forest chip deliveries (Kärhä 2011a). Because logistical costs and biomass losses are typically lower for roundwood than logging residues and small-sized whole trees, the increasing terminal usage may contribute to the burning of industrial roundwood (Laitila and Väätäinen 2011; Tahvanainen and Anttila 2011; Routa et al. 2015). However, the increase in terminal storage is unlikely to pose significant problems at the national level, as the findings of this study indicate that the respondents did not fully utilise the available capacity. This may be due to earlier preparations, as the use of terminals and the share of terminal chipping in energy wood supply chains have already increased in the past (Strandström 2021). Nonetheless, the situation may vary between regions and suppliers. Additionally, some terminals are under the control of energy wood consumers rather than suppliers.
4.6 Policy implications on energy wood supply chain
National and EU-level political attitudes toward bioenergy have become more critical. Recent legislation, such as RED III and EUDR, set new restrictions on its sustainable use (European Parliament and Council 2023a, 2023b). From this perspective, considerable uncertainty surrounds the future use of wood energy, which also affects the operational environment of energy wood suppliers. In light of this questionnaire energy producers do not seem too concerned about the potential effects of the RED III or EUDR in their operating environment. One important reason for this is probably that RED III only prohibits support for the combustion of industrial roundwood as part of national support schemes but does not impose any other restrictions on the use of industrial wood for energy purposes. The total amount of wood obtained from land use change areas, whose use could be restricted by the EUDR, was also relatively small. However, from a Finnish perspective, policy measures such as EUDR can still cause significant costs for companies by increasing bureaucracy (Laturi et al. 2025).
Nonetheless, scenario-based assessments have shown that the effect of the regulation on wood availability and procurement costs depends to a large extent on the level of implementation and varies from insignificant to remarkable (Kniivilä et al. 2022; Ahtikoski et al. 2024). The EU’s biodiversity strategy for 2030 and related activities could significantly hamper wood procurement. If protected areas or restrictions on forest use are increased, these measures may critically reduce the availability of wood, particularly in southern Finland where logging volumes are high in relation to the maximum sustained yield (Kniivilä et al. 2022).
5 Conclusion
The results of this study confirm that the increased consumption of domestic forest chips has been partly achieved by burning industrial roundwood. The annual volume was estimated to be between 1.9 and 2.6 million m3 in the absence of accurate information. Particularly, the burning of industrial roundwood has contributed to enabling most of the energy wood to be sourced from within 75 km of the consumer plant. Additionally, the results also indicate that the supply of energy wood is supplemented by areas of land-use change, which play an important role, particularly in the supply of stumps. In comparison, the importance of imported wood was found to have decreased significantly. However, if the aim is to prevent the burning of industrial roundwood, this should be taken into account in policy-making. Furthermore, policy-making should aim to reduce uncertainty in the operational environment. The availability of energy wood is critical for Finland’s energy security, particularly as the importance of forest chips is expected to remain strong for at least the next decade.
Funding
The authors gratefully acknowledge financial support from the European Union REPowerEU funding (Council of the European Union, implementing decision 15836/23).
Authors’ contributions
Conceptualization (TN, PA, LS, KK, JR), methodology (TN, PA, JK, LS, KK, JR), validation (TN), formal analysis (TN, PA, JK), investigation (TN, PA, JK), resources (LS, JR), data curation (TN), writing – original draft (TN, PA, JK), writing – review & editing (TN, PA, JK, LS, KK, JR), visualization (TN, PA), supervision (LS, KK, JR), project administration (JR). All authors have agreed the published manuscript.
Acknowledgments
The authors are grateful to Ms. Leena Vuorinen for her contribution to the data collection of the survey.
Declaration of competing interest
The authors declare that they have no affiliations or other personal relationships which might have affected this study and its results.
Data availability
The data on which this study and its results are based are confidential. The publication of the data is prohibited.
References
Ahtikoski A, Väätäinen K, Anttila P, Laitila J, Mutanen A, Lindblad J, Sikanen L, Routa J (2024) The effects of the EU’s forest-related policies on harvesting costs in Finland. Silva Fenn 58, article id 23018. https://doi.org/10.14214/sf.23018.
Alakangas E, Hurskainen M, Laatikainen-Luntama J, Korhonen J (2016) Suomessa käytettävien polttoaineiden ominaisuuksia. [Characteristics of fuels used in Finland]. VTT Technology 258. https://publications.vtt.fi/pdf/technology/2016/T258.pdf. Accessed 3 August 2025.
European Parliament and Council (2023a) Directive (EU) 2023/2413 amending Directive (EU) 2018/2001, Regulation (EU) 2018/1999 and Directive 98/70/EC as regards the promotion of energy from renewable sources, and repealing Council Directive (EU) 2015/652. http://data.europa.eu/eli/dir/2023/2413/oj.
European Parliament and Council (2023b) Regulation (EU) 2023/1115 of the European Parliament and of the Council of 31 May 2023 on the making available on the Union market and the export from the Union of certain commodities and products associated with deforestation and forest degradation and repealing Regulation (EU) No 995/2010. http://data.europa.eu/eli/reg/2023/1115/oj.
Eurostat (2024) Production of electricity and derived heat by type of fuel. https://doi.org/10.2908/NRG_BAL_PEH.
Finnish Council of State (2008) Pitkän aikavälin ilmasto- ja energiastrategia – Valtioneuvoston selonteko eduskunnalle 6. päivänä marraskuuta 2008. [A long-term climate and energy strategy – Government report to Parliament of 6 November 2008]. https://www.eduskunta.fi/FI/vaski/Selonteko/Documents/vns_6+2008.pdf. Accessed 9 October 2024.
Finnish Energy Association (2024a) Kaukolämmön hintatilasto 2023. [District heating price statistics]. https://energia.fi/tilastot/kaukolammon-hintatilasto/. Accessed 21 November 2024.
Finnish Energy Association (2024b) District heating statistics 2023. https://energia.fi/tilastot/kaukolampotilasto/. Accessed 9 October 2024.
Finnish Energy Association (2025) District heating statistics 2024, provisional. https://energia.fi/en/statistics/district-heating-statistics/. Accessed 31 January 2025
Finnish Government (2019) Programme of Prime Minister Sanna Marin’s Government 10 December 2019. Inclusive and competent Finland – a socially, economically and ecologically sustainable society. https://urn.fi/URN:ISBN:978-952-287-811-3.
Government of Finland (2024) Valtioneuvoston asetus 871/2024 metsätalouden määräaikaisesta kannustejärjestelmästä annetun valtioneuvoston asetuksen muuttamisesta. [Government degree 871/2024 of amending the government decree on the temporary incentive scheme for forestry]. https://www.finlex.fi/fi/lainsaadanto/saadoskokoelma/2024/871#OT0.
Jonsson R, Sotirov M (2025) Future wood availability in europe in light of climate and energy policy and geopolitical developments – a wood resource balance-based assessment. Sustainability 17, article id 1291. https://doi.org/10.3390/su17031291.
Kallio AMI, Salminen O, Sievänen R (2013) Sequester or substitute – consequences of increased production of wood based energy on the carbon balance in Finland. J For Econ 19: 402–415. https://doi.org/10.1016/j.jfe.2013.05.001.
Kärhä K (2011a) Industrial supply chains and production machinery of forest chips in Finland. Biomass Bioenergy 35: 3404–3413. https://doi.org/10.1016/j.biombioe.2010.11.016.
Kärhä K (2011b) Integrated harvesting of energy wood and pulpwood in first thinnings using the two-pile cutting method. Biomass Bioenergy 35: 3397–3403. https://doi.org/10.1016/j.biombioe.2010.10.029.
Kärhä K, Seuri M, Mac Donagh PM, Acuna M, Kanzian C, Petković V, Gonçalves Robert RC, Suppi Costa LH, Coelho Da Cruz R, Krumov T, Bradley A, Röser D, Pinto C, Dian W, Pandur Z, Dvořák J, Torbjørn Jørgensen M, Muiste P, Irdla M, Ginet C, Purfürst T, Dietz H-U, Spinelli R, Suzuki Y, Shirasawa H, Lazdiņš A, Visser R, Harvey C, Skjølaas D, Moskalik T, Trzciński G, Borz SA, Muşat EC, Triplat M, Oberholzer F, Talbot B, Tolosana E, Von Hofsten H, Akay AO, Bakay B, Conrad Iv JL, Olivera A (2024) Overview of global long-distance road transportation of industrial roundwood. Croat J For Eng 45: 217–236. https://doi.org/10.5552/crojfe.2024.2286.
Kenward MG, Roger JH. (2009) An improved approximation to the precision of fixed effects from restricted maximum likelihood. Comput Stat Data Anal 53: 2583–2595. https://doi.org/10.1016/j.csda.2008.12.013.
Kniivilä M, Hirvelä H, Lintunen J, Mutanen A, Vatanen E, Viitanen J, Kurttila M (2022) Metsien tiukan lisäsuojelun hakkuumahdollisuus-, arvonlisäys- ja työllisyysvaikutusten arviointi: skenaariotarkastelu EU:n biodiversiteettistrategiasta Suomessa. [Assessment of the impact of stricter additional protection of forests on logging opportunities, value-added, and employment effects: A scenario analysis of the EU Biodiversity Strategy in Finland]. Luonnonvara- ja biotalouden tutkimus 64, Natural Resources Institute Finland. http://urn.fi/URN:ISBN:978-952-380-480-7.
Koljonen T, Silfver T, Soimakallio S, Koreneff G, Lehtilä A, Markkanen J, Vainio T, Aakkula J, Haakana M, Hirvelä H (2024) Perusskenaariot energia- ja ilmastotoimien kokonaisuudelle kohti päästöttömyyttä (PEIKKO). [Baseline scenarios for energy and climate policy package towards zero emissions]. Valtioneuvoston selvitys- ja tutkimustoiminnan julkaisusarja 24. http://urn.fi/URN:ISBN:978-952-383-219-0.
Kunttu J, Hurmekoski E, Myllyviita T, Wallius V, Kilpeläinen A, Hujala T, Leskinen P, Hetemäki L, Heräjärvi H (2021) Targeting net climate benefits by wood utilization in Finland: participatory backcasting combined with quantitative scenario exploration. Futures 134, article id 102833. https://doi.org/10.1016/j.futures.2021.102833.
Kurki P, Mutanen A, Anttila P (2012) Energiapuumarkkinat – käytännön kokemukset ja tilastointimahdollisuudet. [Energy wood markets – practical experience and statistical possibilities]. Working Papers of the Finnish Forest Research Institute 228. http://urn.fi/URN:ISBN:978-951-40-2358-3.
Laturi J, Haimonen R, Norkio A (2025) Selvitys EU:n metsäkatoasetuksen taloudellisista vaikutuksista suomalaisille yrityksille. [An Assessment of the Economic Impacts of the EU Deforestation Regulation on Finnish Companies]. PTT reports 298. https://www.ptt.fi/wp-content/uploads/2025/04/PTT_raportteja298.pdf.
Laitila J, Väätäinen K (2011) Kokopuun ja rangan autokuljetus ja haketustuottavuus. [Road transportation and chipping productivity of pruned and unpruned stemwood]. Metsätieteen Aikakauskirja 2/2011: 107–126. https://doi.org/10.14214/ma.6635.
Ministerial Working Group on Preparedness (2022) Vihreä siirtymä ja investointien vauhdittaminen – omavaraisuuden vahvistaminen ja huoltovarmuuden varmistaminen tilapäisin toimenpitein. [Green transition and boosting investment – strengthening self-sufficiency and ensuring security of supply through temporary measures]. https://valtioneuvosto.fi/documents/10623/101263033/Energian+saatavuuden+varmistaminen+ja+vihre%C3%A4+siirtym%C3%A4_Varautumisen+ministerity%C3%B6ryhm%C3%A4+7.4.2022.pdf/1d5a9ffc-644d-538e-f003-b22024e28aa7/Energian+saatavuuden+varmistaminen+ja+vihre%C3%A4+siirtym%C3%A4_Varautumisen+ministerity%C3%B6ryhm%C3%A4+7.4.2022.pdf?t=1649324058475. Accessed 11 November 2024.
Ministry of Agriculture and Forestry in Finland (2015) National Forest Strategy 2025. http://urn.fi/URN:ISBN:978-952-366-006-9.
National Forest Inventories (2024) Forest resources by region. https://www.luke.fi/en/statistics/forest-resources/forest-resources-by-region-6. Natural Resources Institute Finland. Accessed 11 November 2024.
Natural Resources Institute Finland (2025) Preliminary greenhouse gas inventory results for 2023: forest land has turned into an emission source because the carbon sink of trees no longer cover emissions from forest soil. https://www.luke.fi/en/news/preliminary-greenhouse-gas-inventory-results-for-2023-forest-land-has-turned-into-an-emission-source-because-the-carbon-sink-of-trees-no-longer-cover-emissions-from-forest-soil. Accessed 21 January 2025.
Niinistö T, Anttila P, Sikanen L, Kärhä K, Routa J (2025) Estimating future consumption of forest chips based on insights from energy producers: a case study for Finland. Scand J For Res 40: 95–106. https://doi.org/10.1080/02827581.2025.2491450.
Official Statistics of Finland (2022a) Foreign trade in roundwood and forest industry products by country 2021. https://www.luke.fi/en/statistics/foreign-trade-in-roundwood-and-forest-industry-products/foreign-trade-in-roundwood-and-forest-industry-products-by-country-2021. Accessed 5 February 2025.
Official Statistics of Finland (2022b) Wood in energy generation 2021. https://www.luke.fi/en/statistics/wood-consumption/wood-in-energy-generation-2021. Accessed 5 February 2025.
Official Statistics of Finland (2024a) Wood in energy generation 2023. https://www.luke.fi/en/statistics/wood-consumption/wood-in-energy-generation-2023. Accessed 20 November 2024.
Official Statistics of Finland (2024b) Wood consumption 2023. https://www.luke.fi/en/statistics/wood-consumption/wood-consumption-2023. Accessed 4 August 2024.
Official Statistics of Finland (2024c) Trade of energywood, 4td quarter and year 2023. https://www.luke.fi/en/statistics/volumes-and-prices-in-energywood-trade/trade-of-energywood-4th-quarter-and-year-2023. Accessed 30 January 2025.
Official Statistics of Finland (2024d) Prices of domestic fuels the second quarter of 2024. https://stat.fi/en/publication/cln30x4ls4x7j0bvzybfmml3i. Accessed 21 November 2024.
Official Statistics of Finland (2024e) Total roundwood removals and drain by region 2023. https://www.luke.fi/en/statistics/total-roundwood-removals-and-drain/total-roundwood-removals-and-drain-by-region-2023. Accessed 20 November 2024.
Official Statistics of Finland (2024f) Volumes and prices in roundwood trade 2023. https://www.luke.fi/en/statistics/volumes-and-prices-in-industrial-roundwood-trade/volumes-and-prices-in-roundwood-trade-2023. Accessed 27 February 2025.
Official Statistics of Finland (2024g) Documentation of statistics wood consumption. https://www.luke.fi/en/statistics/wood-consumption/documentation-of-statistics-wood-consumption-15-03-24. Accessed 14 January 2025.
Official Statistics of Finland (2024h) Foreign trade in roundwood and forest industry products by country 2023. https://www.luke.fi/en/statistics/foreign-trade-in-roundwood-and-forest-industry-products/foreign-trade-in-roundwood-and-forest-industry-products-by-country-2023. Accessed 20 November 2024.
Official Statistics of Finland (2024i) Forest industries’ wood consumption 2023. https://www.luke.fi/en/statistics/wood-consumption/forest-industries-wood-consumption-2023. Accessed 20 November 2024.
Petty A, Kärhä K (2011) Effects of subsidies on the profitability of energy wood production of wood chips from early thinnings in Finland. For Policy Econ13: 575–581. https://doi.org/10.1016/j.forpol.2011.07.003.
Petty A, Kärhä K (2014) Productivity and cost evaluations of energy-wood and pulpwood harvesting systems in first thinnings. Int J For Eng 25: 37–50. https://doi.org/10.1080/14942119.2014.893129.
Routa J, Kolström M, Ruotsalainen J, Sikanen L (2015) Precision measurement of forest harvesting residue moisture change and dry matter losses by constant weight monitoring. Int J For Eng 26: 71–83. https://doi.org/10.1080/14942119.2015.1012900.
Soimakallio S, Saikku L, Valsta L, Pingoud K (2016) Climate change mitigation challenge for wood utilization– the case of Finland. Environ Sci Technol 50: 5127–5134. https://doi.org/10.1021/acs.est.6b00122.
Strandström M (2021) Metsähakkeen tuotantoketjut Suomessa vuonna 2020. [Forest chips production chains in Finland 2020]. Metsäteho Oy. https://www.metsateho.fi/wp-content/uploads/Tuloskalvosarja-2022-04-EN-Timber-harvesting-and-long-distance-transportation-of-roundwood-2020.pdf.
Strandström M (2024) Timber harvesting and long-distance transportation of roundwood 2023. Metsäteho Oy. https://www.metsateho.fi/wp-content/uploads/Tuloskalvosarja-2024-02-EN-Timber-harvesting-and-long-distance-transportation-of-roundwood-2023.pdf.
Tahvanainen T, Anttila P (2011) Supply chain cost analysis of long-distance transportation of energy wood in Finland. Biomass Bioenergy 35: 3360–3375. https://doi.org/10.1016/j.biombioe.2010.11.014.
United Nations (2018) Wood energy in the ECE region. https://unece.org/fileadmin/DAM/timber/publications/SP-42-Interactive.pdf.
United Nations (2025) Global trade data. UN Comtrade Database. https://comtradeplus.un.org/TradeFlow. Accessed 4 August 2025.
Viitanen J, Mutanen A, Karvinen S, Härkönen K, Kallioniemi M, Kniivilä M, Leppänen J, Niinistö T, Routa J, Uotila E, Viitala E-J, Galkin M, Jortikka S, Lindroos M (2023) Finnish Forest Sector Economic Outlook 2023–2024. Luonnonvara- ja biotalouden tutkimus 93, Natural Resources Institute Finland. http://urn.fi/URN:ISBN:978-952-380-795-2.
Viitanen J, Mutanen A, Karvinen S, Haltia E, Kallioniemi M, Kilpeläinen H, Kniivilä M, Leppänen J, Niinistö T, Routa J, Toikka M, Viitala E-J (2024) Finnish Forest Sector Economic Outlook 2024–2025. Luonnonvara- ja biotalouden tutkimus 73, Natural Resources Institute Finland. https://urn.fi/URN:ISBN:978-952-380-955-0.
Total of 50 references.
