Elisa Männistö  ,
Johanna Jetsonen,
Heli Peltola,
Teemu Rouvinen,
Samuli Launiainen,
Annamari Laurén,
Marjo Palviainen
,
Johanna Jetsonen,
Heli Peltola,
Teemu Rouvinen,
Samuli Launiainen,
Annamari Laurén,
Marjo Palviainen
Short-term impacts of nitrogen fertilization on the cover of vascular plant and bryophyte species in boreal Scots pine and Norway spruce stands
Männistö E., Jetsonen J., Peltola H., Rouvinen T., Launiainen S., Laurén A., Palviainen M. (2026). Short-term impacts of nitrogen fertilization on the cover of vascular plant and bryophyte species in boreal Scots pine and Norway spruce stands. Silva Fennica vol. 60 no. 2 article id 25052. https://doi.org/10.14214/sf.25052
Highlights
- Nitrogen fertilization had no significant impact on the cover of any vascular plant or bryophyte species in the boreal forest stands studied
- The cover of many species decreased over the years, regardless of fertilization treatment
- The exceptionally warm and dry summer of 2021 may have contributed to the decrease in the cover of many species.
Abstract
Nitrogen (N) fertilization increases carbon sequestration and wood production in boreal upland forests and thus supports climate change mitigation. Excess N may, however, alter the cover, biomass and biodiversity of the ground vegetation. But little is known about how the species composition and cover are affected by the different intensities of N fertilization. Here, we evaluated the short-term impacts of N fertilization on the cover of vascular plant and bryophyte species in two Scots pine (Pinus sylvestris L.) -dominated and two Norway spruce (Picea abies (L.) H. Karst.) -dominated stands in Eastern Finland. The fertilization was done using a forwarder in the Scots pine stands and a helicopter in the Norway spruce stands, which are typical vehicles for this work in practical forestry. Funnel traps were used to measure the applied N doses at the plot level. Each study site also included unfertilized control plots. The percentage cover of vascular plant and bryophyte species was estimated at the beginning of the experiment, and then twice within 2–4 years after the fertilization. Overall, N fertilization had no significant impact on the cover of any vascular plant or bryophyte species. The cover of many species also decreased over the years, both in the fertilized and unfertilized plots. The exceptionally warm and dry summer of 2021 may have contributed to this result. However, further studies are needed to evaluate long-term responses in the ground cover and species composition to the N fertilizer doses used in practical forestry.
Keywords
herbs;
understorey vegetation;
shrubs;
grasses;
bottom layer vegetation;
field layer vegetation
-
Männistö,
School of Forest Sciences, Faculty of Science, Forestry and Technology, University of Eastern Finland, PO Box 111, 80101 Joensuu, Finland
 https://orcid.org/0000-0003-3869-6739
E-mail
elisa.mannisto@uef.fi
https://orcid.org/0000-0003-3869-6739
E-mail
elisa.mannisto@uef.fi
-
Jetsonen,
Department of Forest Sciences, University of Helsinki, PO Box 27, 00014 University of Helsinki, Finland
https://orcid.org/0009-0006-4878-8951
E-mail
johanna.jetsonen@helsinki.fi
-
Peltola,
School of Forest Sciences, Faculty of Science, Forestry and Technology, University of Eastern Finland, PO Box 111, 80101 Joensuu, Finland
https://orcid.org/0000-0003-1384-9153
E-mail
heli.peltola@uef.fi
- Rouvinen, School of Forest Sciences, Faculty of Science, Forestry and Technology, University of Eastern Finland, PO Box 111, 80101 Joensuu, Finland E-mail teemu.rouvinen2@outlook.com
-
Launiainen,
Natural Resources Institute Finland, Bioeconomy and Environment, Latokartanonkaari 9, 000790 Helsinki, Finland
https://orcid.org/0000-0001-6611-6573
E-mail
samuli.launiainen@luke.fi
-
Laurén,
Department of Forest Sciences, University of Helsinki, PO Box 27, 00014 University of Helsinki, Finland
https://orcid.org/0000-0002-6835-9568
E-mail
annamari.lauren@helsinki.fi
-
Palviainen,
Department of Forest Sciences, University of Helsinki, PO Box 27, 00014 University of Helsinki, Finland
https://orcid.org/0000-0001-9963-4748
E-mail
marjo.palviainen@helsinki.fi
Received 13 October 2025 Accepted 27 May 2026 Published 18 June 2026
Views 6417
Available at https://doi.org/10.14214/sf.25052 | Download PDF

Supplementary Files
1 Introduction
Boreal forests can sequester and store large amounts of carbon (C) in tree biomass, ground vegetation and soil (Mäkipää 1995; Ilvesniemi et al. 2002), having thus an important role in climate change mitigation (Lecocq et al. 2022). Nitrogen (N) fertilization is a rapid and resource-efficient method for increasing wood production in upland boreal forests on sub-xeric and mesic sites (Gustavsen and Lipas 1975; Kellomäki et al. 1982; Sikström et al. 1998; Pettersson and Högbom 2004; Pukkala 2017; Jetsonen et al. 2025), where forest growth may be limited by nitrogen availability (Tamm 1991). Nitrogen fertilization can also increase C sequestration and C stocks in soil (Johnson 1992; Mäkipää 1995; Jörgensen et al. 2021) as a result of enhanced litter production and slower organic-matter decomposition rates (Carreiro et al. 2000; Marshall et al. 2021). However, N fertilization may also impact the coverage, biomass and biodiversity of ground vegetation, although these effects remain poorly understood (Saarsalmi and Mälkönen 2001; Hedwall et al. 2014).
In boreal forests, ground vegetation consists of a relatively small number of species and low biomass, but ground vegetation plays an important role in C and nutrient cycling (Helmisaari 1995; Finér et al. 2003; Palviainen 2005). This is because ground vegetation nutrient uptake, nutrient concentrations, and the turnover rates of biomass are high compared to trees (Mälkönen 1974; Helmisaari 1995). Several ground vegetation species are annual, and a significant proportion of the biomass is renewed annually leading to a high rate of nutrient uptake. Ground vegetation nutrient uptake can also buffer the nutrient export to water courses (Palviainen et al. 2005a, 2005b) after fertilization.
Nitrogen fertilization can impact the ground vegetation both directly and indirectly by altering overstory canopy and near-ground microclimate, and thus also the competition between plant groups and species. These impacts can be both short term or last for decades (Strengbom et al. 2001). By adding available N into the ecosystem, N fertilization can increase plant growth and shift the species community composition towards species favouring more fertile sites (Kellner 1993; Rajaniemi 2002; Ukonmaanaho et al. 2008). At the plant-group level, N fertilization has increased the cover of grasses, herbs and some pteridophytes (van Dobben et al. 1999; Strengbom and Nordin 2008; Hedwall et al. 2013), whereas the bryophyte cover including mosses and liverworts has often decreased (Olsson and Kellner 2006; Jacobson et al. 2020; Jetsonen et al. 2024). However, N fertilization has also increased the cover of some bryophytes in litter habitats, such as Brachythecium spp. mosses (Strengbom and Nordin 2008; Hedwall et al. 2010). Similarly, the shrub cover can either increase or decrease after N fertilization (Mäkipää 1994; Strengbom and Nordin 2008; Hedwall et al. 2010; Jacobson et al. 2020). At the species-level, the cover of Trientalis europaea L., Rubus idaeus L. and Brachythecium spp. has increased after fertilization, while the cover of other species has decreased (Hedwall et al. 2010). Nitrogen fertilization decreases the presence of Vaccinium myrtillus L. and Vaccinium vitis-idaea L., which are important in commercial and recreational berry picking in the Nordic countries (Strengbom et al. 2001, 2002; Strengbom and Nordin 2008; Jetsonen et al. 2024). V. myrtillus also provides food resources for forest fauna and is therefore considered as a keystone species in boreal forest ecosystems (Dahlgren et al. 2007; Hegland et al. 2010). Deschampsia flexuosa (L.) Trin., a common grass species in boreal forests, has either increased (Kellner and Redbo-Torstensson 1995) or decreased after N fertilization (Hedwall et al. 2010). Moreover, fertilization can cause species replacement in bryophytes (Dirkse and Martakis 1992). Due to opposite effects on the different species in plant groups, the impacts of N fertilisation on the ground vegetation cannot be generalised. Still, the direct impacts of the N fertilization on the cover or abundance of different ground vegetation species remain relatively poorly studied.
Nitrogen fertilization increases the overstorey leaf mass and enhances canopy closure, inducing changes in the near-ground light conditions, temperature and humidity. These changes indirectly alter the growing conditions for the ground vegetation (Skrindo and Økland 2002; Majasalmi and Rautiainen 2020). However, the magnitude of indirect impacts can differ depending on the tree species and the growing stock (Skrindo and Økland 2002; Majasalmi and Rautiainen 2020). This was reported in hemiboreal forests where N fertilization significantly altered the species richness and diversity of the ground vegetation in Scots pine (Pinus sylvestris L.) stands, but not in Norway spruce (Picea abies (L.) H. Karst.) stands (Petaja et al. 2025). Furthermore, N fertilization indirectly impacts the growing conditions by increasing the litterfall that forms the mor humus layer, which is the growth medium for ground vegetation.
The aim of this study was to evaluate the short-term species-level responses of the ground vegetation to N fertilization in Scots pine- and Norway spruce-dominated upland boreal forest stands. Fertilizations with target levels of 150 and 200 kg N ha–1 were set based on Finnish forest management recommendations and each research site also included control plots that received no N fertilization. To assess the changes in species abundances and community composition as responses to realised N fertilizer dose, the percentage cover of each plant species was estimated visually at every site at the beginning of the experiment and then twice within 2–4 years after the fertilization. We expected the N fertilization to increase the abundance of grass species, such as D. flexuosa, and decrease the cover of shrub species, like V. myrtillus, and bryophyte species. We expected to see short-term changes in the species composition already during the first years after the fertilization. This study is a follow-up to that of Jetsonen et al. (2024), which evaluated changes in the ground vegetation cover at the plant-group level based on the same dataset as used here.
2 Materials and methods
2.1 Study sites and experimental design
We conducted the study at four research sites in Eastern Finland, two of which were dominated by Scots pine and two by Norway spruce (Table 1 and Fig. 1). The stands were thinned 4–8 years before the fertilization. All the stands were located on medium fertile, mesic Myrtillus-type (MT) site type (Cajander 1949) in upland mineral soils, with a mor humus organic layer. The long-term (1990–2020) mean annual air temperature was 2.8–3.5 °C and the mean annual precipitation was 640–670 mm at the study sites (Table 1). During the experimental period (2018–2022 for the Scots pine stands, 2019–2022 for the Norway spruce stands), the mean annual air temperature was, on average, 0.8 °C higher, whereas the mean annual precipitation (592–667 mm) was somewhat lower than the 30-year average (Finnish Meteorological Institute 2023). In particular, June and July were exceptionally warm and dry in the years 2018 and 2021 (Supplementary file S1).
| Table 1. Location and key characteristics of the four research sites in Eastern Finland where the nitrogen (N) fertilization experiments were conducted. The mean annual air temperature and precipitation are shown as 30-year averages from 1990–2020 (Finnish Meteorological Institute, 2023). Table adapted from Jetsonen et al. (2024). | ||||
| Location/key characteristic | Liperi | Ilomantsi | Juuka | Savonranta |
| Latitude | 62,55846 N | 62,85543 N | 63,066199 N | 62,139028 N |
| Longitude | 29,06265 E | 30,67705 E | 28,874640 E | 29,149086 E |
| Altitude (m a.s.l.) | 160 | 180 | 170–200 | 120–140 |
| Dominant tree species | Pinus sylvestris | Pinus sylvestris | Picea abies | Picea abies |
| Mean annual air temperature (°C) | 3.5 | 3.0 | 2.8 | 3.4 |
| Effective temperature sum (d.d.) | 1200–1300 | 1100–1200 | 1100–1200 | 1200–1300 |
| Annual precipitation (mm) | 640 | 644 | 661 | 670 |
| Date of N application | 27/06/2018 | 20/07/2020 | 25–27/07/2019 | 10/08/2101 |
| Means of application | Forwarder | Forwarder | Helicopter | Helicopter |
| Range of the realised N fertilizer dose (kg N ha–1) (> 0 in plots*) | 110–288 | 109–369 | 48–441 | 50–426 |
| Stand density (stems ha–1) | 513 | 687 | 619 | 455 |
| Mean diameter at breast height (cm) | 23 | 18 | 21 | 21 |
| Initial volume (m3 ha–1) | 167 | 170 | 187 | 159 |
| *In one plot at Ilomantsi and two plots at Savonranta that were intended to be fertilized, the amount of funnel-trap-observed fertilizer was zero due to problems with the fertilization procedure, and so these values were excluded from the range values. | ||||
Our study contained four hierarchical levels: research sites, blocks, circular plots, and circular subplots. Each research site involved a randomised-block design (Fig. 1) with nine 1-ha-sized blocks. Each block contained three circular plots (radius 7.98 m, area 200 m2) and within each circular plot there were three circular subplots (radius 0.4 m, area 0.5 m2) placed systematically at 6 m distances from the centre of each plot. The tree attributes were measured from the circular plots with radius (Jetsonen et al. 2024; Muhonen et al. 2025) and the ground vegetation measurements were conducted in the circular subplots
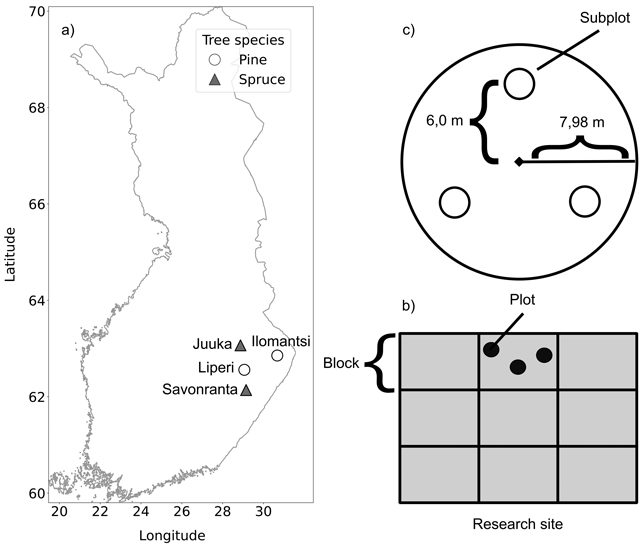
Fig. 1. Location of the study sites and the experimental setup. The circles in (a) represent the Scots pine-dominated research sites and the triangles the Norway spruce-dominated research sites. Each research site (b) had three blocks (of 1 ha) per treatment (0, 150 and 200 kg N ha–1), giving nine blocks in total. Each block contained three circular plots (200 m2) from which the fertilization evenness and tree attributes were derived. Each plot (c) contained three smaller subplots (0.5 m2) for determining the ground vegetation cover and species composition.
The blocks were fertilized with three target doses (0, 150 and 200 kg N ha–1) and each fertilization treatment had three replicates (Fig. 1). The target fertilizer doses for each block were based on the practical forestry recommendations (Äijälä et al. 2019). The Scots pine stands were fertilized in June 2018 using a forwarder and a centrifugal spreader and YaraBela Metsäsalpietari (NPK 27-0-1, indicating 27% N by mass) fertilizer. The Norway spruce stands were fertilized in July 2019 using a helicopter and YaraMila Metsän NP (NPK 25-2-0, indicating 25% N by mass) fertilizer. The realised N fertilization dose was measured inside each plot using funnel traps (Muhonen et al. 2025).
Overall, the target fertilizer amounts were better reached at the block and treatment level (based on used fertilizer amount), than at the plot level based on the funnel measurements according to Muhonen et al. (2025). The variation in spatial evenness in fertilization was also substantially larger based on aerial spreading in the Norway spruce stands, than based on ground spreading in the Scots pine stands. However, differences in how many fertilizer particles are collected by the textile funnels are affected by the spreading method (e.g. different direction (horizontal versus vertical) in ground versus aerial spreading), stand structure, and topography. The large variation in observed realised fertilizer doses between plots made our unique study setup possible, where realised fertilizer doses are used instead of a categorical target dose.
2.2 Ground vegetation cover and species composition
The projective cover (%) of each vascular plant and bryophyte (mosses and liverworts) species in the subplots was visually estimated three times during the study period. The vegetation cover was estimated in all subplots (unfertilized and fertilized) shortly after the fertilization in the Scots pine stands in August 2018, and in the Norway spruce stands in August–September 2019 to count for the initial covers before any possible impacts from the fertilization. The second and third inventories were conducted in July 2021 and July 2022. Because plants can grow on top of each other, the total plant cover in a subplot can be greater than 100% and having thus no upper limit the covers were considered as count-like abundances in the statistical analyses. The species considered in this study represented four plant groups: grasses, shrubs, bryophytes and herbs that also included pteridophytes (Table 2). We excluded the species that were observed only three times or less (including five species in the Scots pine stands and 11 species in the Norway spruce stands) from the statistical data analyses.
| Table 2. Ground vegetation species represented in the different vascular plant and bryophyte species groups under the Scots pine and Norway spruce stands. | |
| Tree species / ground vegetation group | Ground vegetation / vascular plant and bryophyte species |
| Pine stands / Grasses | Agrostis sp., Calamagrostis arundinacea, Calamagrostis phragmitoides, Deschampsia flexuosa, Poa nemoralis |
| Pine stands / Herbs | Athyrium filix-femina (L.) Roth, Carex brunnescens, Carex digitata, Carex globularis, Carex ovalis L., Convallaria majalis, Dryopteris carthusiana, Epilobium angustifolium L., Equisetum sylvaticum L., Fragaria vesca, Goodyera repens (L.) R. Br., Gymnocarpium dryopteris, Hierachium sp., Juncus effusus, Luzula pilosa, Lycopodium clavatum L., Maianthemum bifolium, Melampyrum pratense, Orthilia secunda, Oxalis acetosella., Potentilla erecta, Pteridium aquilinum, Rubus idaeus L., Rubus saxatilis L., Solidago virgaurea, Stellaria media, Trientalis europaea L., Veronica officinalis, Viola palustris L. |
| Pine stands / Shrubs | Calluna vulgaris (L.) Hull, Linnaea borealis, Salix sp., Vaccinium myrtillus L., Vaccinium vitis-idaea |
| Pine stands / Byophytes | Aulacomnium palustre, Brachythecium sp., Bryum sp., Dicranum sp., Hylocomium splendens, Marchantiophyta sp., Pleurozium schreberi, Pohlia nutans, Polytrichum sp., Ptilium crista-castrensis, Rhodobryum roseum (Hedw.) Limpr., Sphagnum sp. |
| Spruce stands / Grasses | Agrostis sp., C. arundinacea, Calamagrostis phragmitoides Hartm. Calamagrostis sp., D. flexuosa, Melica nutans L., P. nemoralis |
| Spruce stands / Herbs | Angelica sylvestris L., C. brunnescens, C. digitata, C. globularis, Carex sp., C. majalis, D. carthusiana, E. angustifolium, F. vesca, G. repens, G. dryopteris, Hieracium sp., Lathyrus pratensis L., L. pilosa, M. bifolium, M. pratense, Melampyrum sylvaticum L., O. acetosella, O. secunda, Platanthera bifolia (L.) Rich., P. aquilinum, Pyrola minor L., R. idaeus, R. saxatilis, S. virgaurea, T. europea, Viola canina L., Viola riviniana Rchb., Viola sp. |
| Spruce stands / Shrubs | C. vulgaris, L borealis, V. myrtillus, V. vitis-idaea |
| Spruce stands / Bryophytes | A. palustre, Brachythecium sp., Bryum sp., Dicranum sp., H. splendens, Marchantiophyta sp., Plagiomnium cuspidatum (Hedw.) T.J. Kop., P. schreberi, P. nutans, Polytrichum sp., P. crista-castrensis., R. roseum, Rhytidiadelphus triquetrus, Sphagnum sp. |
2.3 Statistical analyses
Statistical analyses were performed separately for the Scots pine- and Norway spruce-dominated stands using R version 4.5.3. We used the realised fertilizer dose measured using the funnel traps as a continuous variable instead of a categorical target dose (treatment) in the statistical analyses because the spatial distribution of the fertilizer was found to be uneven across the plots (Muhonen et al. 2025). To assess the changes in species abundances as response to the fertilization and differences between the research sites we tested the effects of measured fertilizer dose, year and site, as well as their interactions on the relative abundance (cover) of the vascular plant and bryophyte species useing multivariate generalised linear models (mvabund package, version 4.2.8; Wang et al. 2012). Because the full interaction of the fertilizer (N) dose × Year × Site was not statistically significant, it was excluded from the final model.
The multivariate models were fitted to the vegetation cover data, assuming a negative binomial distribution using 999 bootstrap iterations, and reported with log-likelihood ratio statistics. To consider the nested study design with repeated measurements, we set the variable plot with a unique code containing information about the research site and block as a stratification variable (strata) for the permutation tests. The multivariate generalised linear models were followed by univariate tests that report the p values for the species as adjusted for multiple testing. To elaborate on the direction of changes a linear mixed-effects model with the same fixed model design was conducted on the species showing significant (p < 0.05) interaction terms using the nlme package (version 3.1-160; Pinheiro et al. 2014) and the impact of year on species cover at each research site was tested using Tukey’s pairwise comparison. The nested data structure was factored in the mixed models by setting the variable subplot within the variable plot as random effects.
The species composition between the fertilized and unfertilized subplots as well as over the three years were visualised with non-metric multidimensional scaling (NMDS) using the vegan package (version 2.6-4) and the Bray–Curtis dissimilarity based on cover data that was logarithmically transformed (Eq. 1) with the function decostand following Anderson et al. (2006):
![]()
where b is the base of the logarithm, x is each non-zero value, and zeros are left as zeros.
The NMDS was conducted for all the species in the Scots pine and Norway spruce stands, as well as separately for the species divided into grasses, herbs, shrubs and bryophytes. The effects of fertilization and measurement year on all species communities in the Scots pine and Norway spruce stands, i.e., do the centroids of fertilized and unfertilized species communities in the NMDS ordination differ significantly between the years, were tested using a permutational multivariate analysis of variance (PERMANOVA, adonis2 function) and the Bray–Curtis distance and 999 permutations. In addition, the multivariate homogeneity of species community dispersions, i.e., the spread of the envelopes around the centroids in the NMDS ordination indicating the variability in species composition (total number of species), was tested using the betadispr function to assess similarity or dissimilarity between the fertilized and unfertilized plant communities over the years (beta-diversity). Further data visualisation was performed using the ggplot2 package (version 3.4.0).
3 Results
3.1 Changes in the species cover in the Scots pine stands
Fertilizer dose had no significant effect on the cover of any species in the Scots pine stands as demonstrated by the multivariate generalized linear model and univariate tests (statistically insignificant interaction term of N dose × Year in the Suppl. files S2 and S3). The NMDS analysis also indicated that the observations in the fertilized subplots were not distinctly separated from the observations in the unfertilized subplots over the years and towards the increasing N dose (Fig. 2). The two research sites had initially different ground vegetation compositions (Fig. 2 and statistically significant effect of Site in the Suppl. files S2 and S3). Altogether 47 species were found at the Liperi site, which was dominated by grasses and herbs, whereas the Ilomantsi site was dominated by shrubs and had only 30 species. Poa nemoralis L., Marchantiophyta sp., Carex brunnescens (Pers.) Poir, Carex globularis L., Juncus effusus L., Orthilia secunda (L.) House, Oxalis acetosella L., Potentilla erecta (L.) Raeusch., Veronica officinalis L. and Pteridium aquilinum (L.) Kuhn were only found at Liperi, which also had a greater cover of Calamagrostis arundinacea (L.) Roth and Sphagnum sp. mosses than Ilomantsi (Suppl. files S3–S5). Linnea borealis L. was only present at Ilomantsi, whereas Solidago virgaurea L. cover was significantly greater at Liperi (Suppl. files S3–S5).
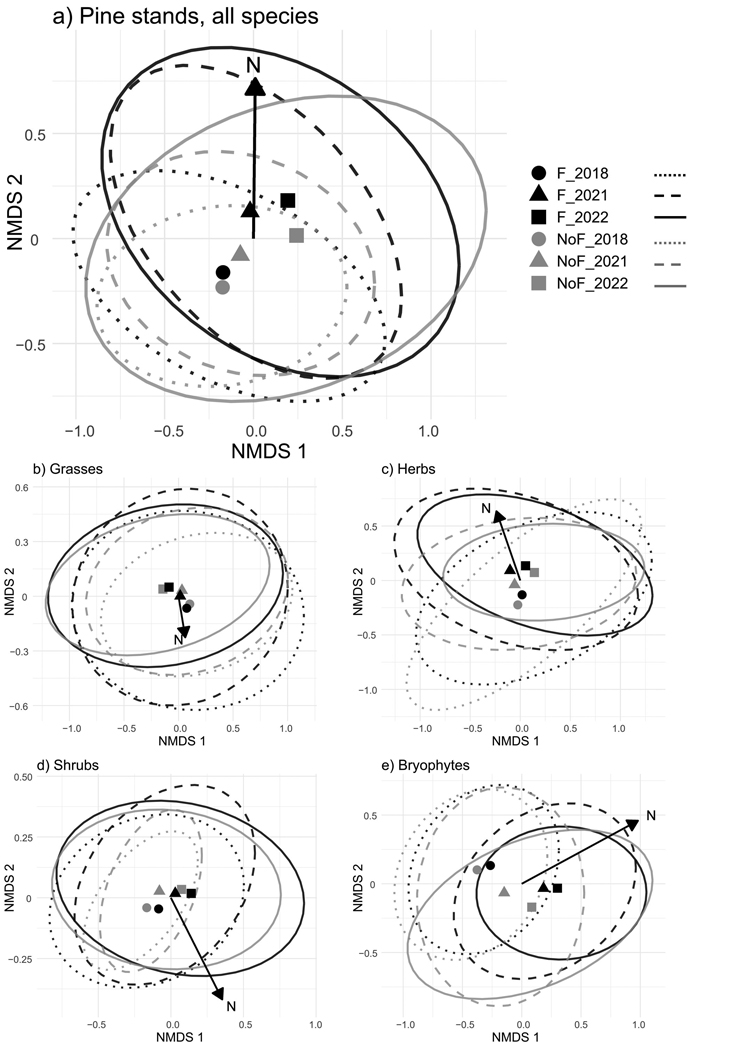
Fig. 2. Non-metric multidimensional scaling (NMDS) for (a) all, (b) grass, (c) herb, (d) shrub and (e) bryophyte species in the Scots pine stands. Instead of showing each observation as a separate point, the figure shows centroids (the mean value) of all observations in each group, and envelopes (the ellipses) that represent the region of all observations around each centroid. The centroids and envelopes are shown separately for all the observations from the fertilized (F) and unfertilized (NoF) subplots for each year (2018 with solid circles and dotted lines, 2021 with triangles and dashed lines, and 2022 with squares and solid lines). The axes display the main dimensions of relative dissimilarity of the data, so that the closer the observations are to each other the more similar they are. The funnel trap-based fertilizer dose (N) is marked with a black arrow that shows the direction of increasing fertilizer dose in the ordination space.
Some species had initially different covers between the unfertilized and fertilized subplots at one or both research sites (statistically significant impact of N dose or interaction term of N dose × Site in the Suppl. file S3). Cover of V. vitis-idaea decreased after 2018 at both research sites, but the decrease was more pronounced at Liperi in the subplots with a higher fertilizer dose than in the unfertilized subplots (Suppl. files S3–S5). The cover of Convallaria majalis L. showed a decreasing trend in all subplots at Ilomantsi, whereas at Liperi, only very small covers were reported in the unfertilized subplots throughout the study and in the fertilized subplots after 2018 (Suppl. files S3–S5). The cover of the moss Ptilium crista-castrensis (Hedw.) De Not. decreased to close to zero after 2018 in all subplots at Ilomantsi, while at Liperi, it was found only in the unfertilized subplots except for two fertilized subplots in 2018 (Suppl. files S3–S5). Apart from one subplot at Ilomantsi, Dryopteris carthusiana (Vill.) H.P. Fuchs was only found at Liperi where it showed consistently greater cover in the fertilized than the unfertilized subplots, and no trends over the study years (Suppl. files S3–S5). Furthermore, at Liperi, P. nemoralis was present only in the fertilized subplots and Fragaria vesca L. and the moss Pohlia nutans (Hedw.) Lindb. were only found in the unfertilized subplots, while R. idaeus showed consistently greater cover in the fertilized than the unfertilized subplots. Melampyrum pratense L. and the moss Hylocomium splendens (Hedw.) Schimp., which were found at both sites, were less common throughout the study years in the subplots with the highest fertilizer dose compared to the other subplots (this was especially the case for H. splendens at Ilomantsi and M. pratense at Liperi).
The cover of some species differed between the study years, regardless of the fertilizer dose (Fig. 2 and statistically significant impact of Year or interaction term of Year × Site in the Suppl. files S2 and S3). This was also clearly visible in the NMDS, where the unfertilized observations moved in the same direction in the ordination space as the fertilized observations over the years, despite the direction of the increasing N dose (Fig. 2). The covers of Luzula pilosa (L.) Willd., D. flexuosa as well as the mosses H. splendens, Pleurozium schreberi (Willd. ex Brid.) Mitt.and of genus Dicranum decreased at both sites during the study years (Suppl. files S3–S5). Similarly, the covers of C. vulgaris as well as L. borealis and Marchantiophyta sp., which were only found at Liperi, decreased or completely disappeared after 2018 (Suppl. files S3 and S5). The cover of T. europea decreased at both sites and almost disappeared after 2018. Additionally, the covers of some species showed different changes over the years between the two Scots pine stands (Suppl. files S2–S5). The covers of C. arundinacea (L.) Roth and M. pratense decreased at Ilomantsi (Suppl. files S3 and S4). Also, the cover of Maianthemum bifolium (L.) F.W. Schmidt decreased at Ilomantsi, but showed an increasing trend at Liperi (Suppl. files S3–S5). Moss genus Brachythecium almost disappeared from Ilomantsi after 2018 and also decreased during the study years at Liperi. The moss Aulacomnium palustre (Hedw.) Schwägr. appeared at Ilomantsi in 2021 and remained going forward, whereas at Liperi, its cover was small throughout the study years. Another obscure species – Stellaria media (L.) Vill. – appeared at Liperi in 2021 and remained. A small cover of S. media was observed at Ilomantsi in 2021, but it disappeared thereafter (Suppl. files S3 and S5). Small covers of Calamagrostis phragmitoides Hartm. appeared and then disappeared over the study years with no clear pattern at Liperi (Suppl. files S3 and S5), and it was also found in only three fertilized subplots at Ilomantsi in 2022.
3.2 Changes in the species cover in the Norway spruce stands
The N fertilizer dose had no significant effect on the cover of any species in the Norway spruce stands based on the univariate tests (statistically insignificant interaction term of N dose × year in the Suppl. files S2 and S6). This was visible in the NMDS, where observations of the fertilized subplots were not separated by a large distance from the observations from the unfertilized subplots over the years (Fig. 3). Both stands had initially relatively similar ground vegetation, but there were still several species that were only found, or showed significantly higher covers, at one of the research sites (see the test results for the impact of Site in the Suppl. files S2 and S6). Overall, 45 different species were found at Savonranta, whereas 34 species were found at Juuka. O. acetosella, P. aquilinum, L. borealis and Carex sp. were only found at Savonranta (Suppl. files S6–S8). Also, C. arundinacea, Carex digitata L., C. majalis, L. pilosa, M. pratensis, Agrostis sp. and A. palustris had larger covers at Savonranta than at Juuka, while the covers of Gymnocarpium dryopteris (L.) Newman, D. carthusiana, and Dicranum sp. were higher at Juuka than Savonranta (Suppl. files S6–S8).
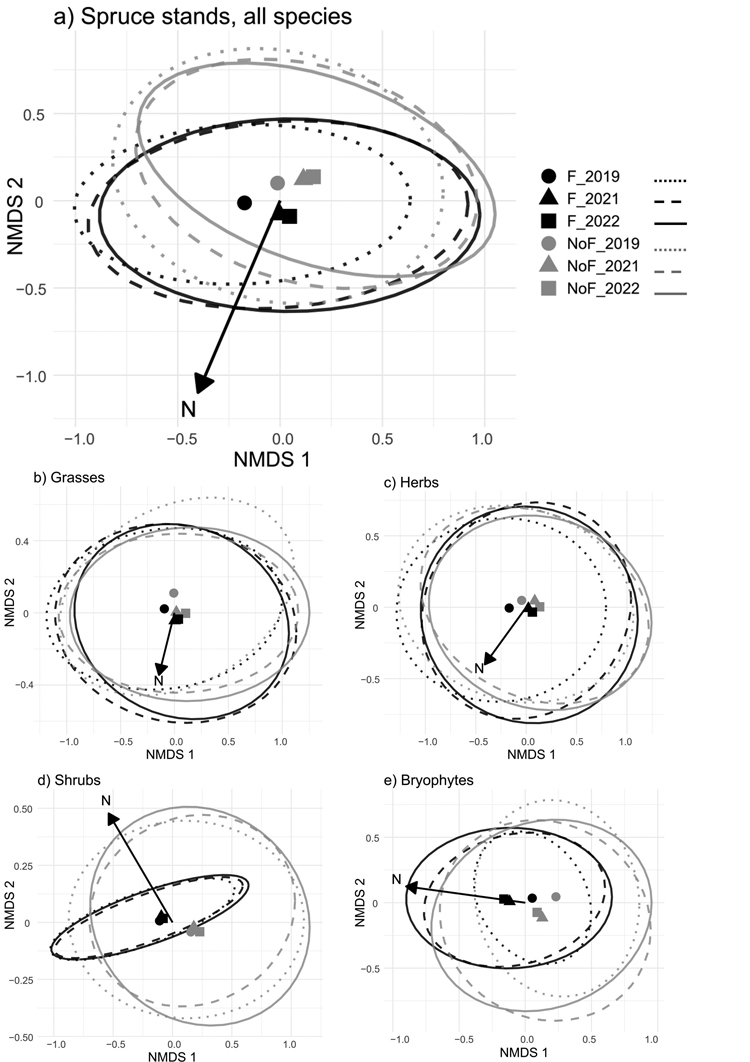
Fig. 3. Non-metric multidimensional scaling (NMDS) for (a) all, (b) grass, (c) herb, (d) shrub and (e) bryophyte species in the Norway spruce stands. Instead of showing each observation as a separate point, the figure shows centroids (the mean value) of all observations in each group, and envelopes (the ellipses) that represent the region of all observations around each centroid. The centroids and envelopes are shown separately for all the observations from the fertilized (F) and unfertilized (NoF) subplots for each year (2019 with solid circles and dotted lines, 2021 with triangles and dashed lines, and 2022 with squares and solid lines). The axes display the main dimensions of relative dissimilarity of the data, so that the closer the observations are to each other the more similar they are. The funnel trap-based fertilizer dose (N) is marked with a black arrow that shows the direction of increasing fertilizer dose in the ordination space.
We observed a significant effect of fertilization dose alone or in interaction with site on the covers of some species that was due to initially different covers between the unfertilized and fertilized subplots (statistically significant impact of N dose or interaction term N dose × Site in the Suppl. files S2 and S6). At Juuka, D. carthusiana was more abundant and S. virgaurea was only found in the unfertilized subplots (Suppl. files S6 and S7). L. borealis and Viola canina L. were found only in the unfertilized subplots at Savonranta (Suppl. files S6 and S8). Furthermore, the covers were consistently higher in the unfertilized than fertilized subplots at both sites for Hieracium sp. and M. bifolium as well as for mosses H. splendens, Plagiomnium cuspidatum (Hedw.) T.J.Kop., and Rhodobryum roseum (Hedw.) Limpr. especially at Juuka and for Polytrichum sp. at Savonranta (Suppl. files S6–S8).
The cover of several species changed significantly between the study years, regardless of the fertilizer dose according to multivariate and univariate tests (statistically significant impact of Year or interaction term of Year × Site in the Suppl. files S2 and S6). This was visible in the NMDS, with the observations of both the fertilized and unfertilized subplots shifting in the same direction in the ordination space (Fig. 3). The covers of P. nemoralis and M. pratense generally increased during the study years, as did the cover of M. bifolium after 2019 (Suppl. files S6–S8). Following the common trend of the bryophytes, the covers of Dicranum sp. and P. schreberi decreased across both sites over the years, and also the abundance of Brachythecium sp. mosses decreased after 2019 (Suppl. files S6–S8). Similarly, the A. palustre cover decreased during the study years at Savonranta, while at Juuka it was observed only in 2021 (Suppl. files S6–S8). The Marchantiophyta sp. cover also showed a decreasing overall trend, but it was observed mostly in the unfertilized subplots and only in 2021 in the fertilized subplots (Suppl. files S6–S8). The Agrostis sp. cover decreased after 2019 at Juuka, where it was mainly found only in the unfertilized subplots (Suppl. files S6 and S7). At Savonranta, Agrostis sp. cover increased in 2021 but decreased in 2022 (Suppl. files S6 and S8).
3.3 Changes in species community compositions and dispersions
In the Scots pine stands, the species composition changed in the fertilized subplots significantly during the study period as shown by the pairwise comparisons of the multivariate homogeneity of species community dispersions (Suppl. file S9 and Fig. 2). The species composition in the unfertilized subplots was also significantly different in 2022 compared to the earlier study years (Suppl. file S9 and Fig. 2). The unfertilized and fertilized subplots had initially similar species compositions, but these differed from each other in 2021 (Suppl. files S9 and S10 and Fig. 2). However, in 2022, the species compositions between the unfertilized and fertilized subplots were no longer significantly different (Suppl. files S9 and S10 and Fig. 2), with the unfertilized plant community dispersion (variability in species composition) shifting to the same direction as the fertilized plant community dispersion according to the PERMANOVA results (Suppl. file S10). In the Norway spruce stands, the variability in species composition changed significantly in the fertilized subplots after the fertilization, whereas the species compositions in the unfertilized subplots did not significantly differ between the study years (see statistically significant interaction term of N dose × Year in the Suppl. file S2, pairwise comparisons of the multivariate homogeneity of species community dispersions in the Suppl. file S11 and Fig. 3). Species community composition in the fertilized subplots was significantly different from the community composition in unfertilized subplots throughout the study years (Suppl. files S11 and S12 and Fig. 3).
4 Discussion
In our study, use of N fertilization did not significantly change the cover of any ground vegetation species within the 2–4 year period after the fertilization in the Scots pine and Norway spruce stands. This was despite the realised fertilizer dose varied greatly and, in many plots, was substantially higher than recommended in practical forestry (Äijälä et al. 2019; Muhonen et al. 2025). The lack of change in the ground vegetation species cover after N fertilization was unexpected because most previous studies have reported changes in both the vegetation cover and species composition (Kellner 1993; Turkington et al. 1998; van Dobben et al. 1999; Olsson and Kellner 2006; Sullivan and Sullivan 2018). In boreal forests, the abundance of herbs has generally increased after N fertilization, whereas bryophytes and shrubs have declined or shown a mixed response (Sullivan and Sullivan 2018). However, most previous studies have reported on the long-term effects (6–30 years) of repeated N fertilizations or have emulated atmospheric N deposition.
Only a few previous studies have reported ground vegetation response to N fertilization doses of similar magnitude and range as used in this study (Strengbom and Nordin 2008; Jacobson et al. 2020; Økland et al. 2022; Jetsonen et al. 2024). In previous studies, an increase in the covers of grass and herb species has been observed with lower fertilization intensities (Strengbom and Nordin 2008; Jetsonen et al. 2024), along with mixed responses in dwarf shrub and bryophyte species covers (Jacobson et al. 2020; Jetsonen et al. 2024). In our study, the cover of several bryophyte species tended to be lower in the fertilized subplots than in the unfertilized control subplots, but similar decreasing trends in bryophyte species covers were observed both in fertilized and unfertilized subplots and thus could not be linked to the fertilization. The decreasing response of bryophyte cover to N fertilization has previously been attributed to the slow growth rate and weak competitive ability of bryophytes compared to other plant groups, and to the lack of cuticle, which makes bryophytes sensitive to direct toxic effects from the fertilizer (Hedwall et al. 2010).
Although none of the species’ covers showed a significant response to the N fertilization, the changes we observed in the whole species community composition could be attributed to fertilization in the Norway spruce stands, where the community composition changed after the fertilization in 2019 as indicated by the multivariate and PERMANOVA analyses, but this was not the case in the Scots pine stands. The variability in species composition in the fertilized subplots at the Scots pine stands momentarily shifted apart from the unfertilized subplots’ species composition that changed to the similar direction with the fertilized subplots the following year. In some studies, N fertilization has been observed to change the species composition of the ground vegetation community (Strengbom and Nordin 2008). However, contradictory findings have also been reported (Sullivan and Sullivan 2018). In our study, the different community responses between the research sites with different dominant tree species could have been affected by the larger variation in the magnitude and unevenness of the N fertilization dose between the plots, which was observed especially in the Norway spruce stands (Muhonen et al. 2025). Even though we considered unevenness by using fertilizer dose as a continuous variable in the data analyses, it may still have accounted for different responses between the Scots pine and Norway spruce stands. In addition, the inherently different growing conditions and therefore different plant communities in the Scots pine and Norway spruce stands (Ukonmaanaho et al. 2008; Petersson et al. 2019; Majasalmi and Rautiainen 2020) could have resulted in different responses to the N fertilization at the community level. The growth response in Scots pine with a lower number of needle-age cohorts starts faster after N fertilization than in Norway spruce (Kukkola and Saramäki 1983; Jalkanen et al. 1995; Niinemets and Lukjanova 2003). Therefore, immediately after N fertilization, there could have been more N available in the Norway spruce stands for use by the ground vegetation compared to the Scots pine stands. Furthermore, the stand volume in Norway spruce stands was on average lower in unfertilized versus fertilized plots, especially in Juuka but also to some degree in Savonranta, which affects ground vegetation growing conditions and could have contributed to the change in species community composition that we observed in the fertilized plots but not in the unfertilized ones. It is also noteworthy that some species covers differed already before the fertilization between fertilized and unfertilized subplots in both Norway spruce and Scots pine stands, which may have played a part in different species community composition responses among the research sites and treatments.
We found that the cover of many species often changed similarly in both the fertilized and unfertilized subplots during the study years, which suggests that environmental factors likely had a stronger impact than fertilization. In our study, the decline of several bryophyte species in particular was notable across all research sites. An exceptionally warm and dry June and July in 2021 could partly explain the observed changes in the species’ covers. Bryophytes are particularly susceptible to drought (He et al. 2016; Koelemeijer et al. 2024; Zhang et al. 2025), which could explain the steep decline in the bryophyte covers in our study. Also, the mean growing season temperature in 2018 was even higher than in 2021 compared to the 30-year average. The previous hot and dry growing seasons may have already contributed to the changes in the species covers, and therefore the changes were more visible and enhanced in 2021, with the new drought. It is possible that the weather conditions also hampered the detection of fertilization impact on species covers. Drought and heatwaves are predicted to become more frequent in the future in the boreal region due to climate change (IPCC 2023) and will likely cause changes in the species covers and their compositions (Archaux and Wolters 2006; Braziunas et al. 2024).
In addition to weather conditions, the forest management history could partly explain the uniform changes in ground vegetation species covers between plots with different fertilizer doses, all the research sites having been thinned 4–8 years before the N fertilization. Overall, thinning could be expected to increase the growth resources both for the trees and ground vegetation (Lieffers et al. 1999). Also, Jetsonen et al. (2024) did not find any effect of growing stock competition on the cover and plant-type composition of the ground vegetation in the same fertilized or unfertilized plots used in this study.
The initial differences observed in the species compositions and diversity of the ground vegetation between and within the research sites highlight the influence that variations in the microclimate and nutrient and water availability had (De Frenne et al. 2021; Buness et al. 2025). Because of these small-scale variations, there is a need to conduct longitudinal experiments involving vegetation inventories made before and after fertilization and emphasising the limitations of studies that report only comparisons between fertilized and unfertilized stands after fertilization.
To conclude, use of N fertilization had no significant short-term effects on the cover of vascular plant or bryophyte species in our study. The cover of many species decreased over the years in both the fertilized and unfertilized plots. The exceptionally warm and dry summer of 2021 may have contributed to these changes. Further studies are needed to evaluate long-term responses in the ground cover and species composition to the N fertilization doses used in practical forestry. This is needed because the annual weather conditions, forest stand structure, and past management (e.g. recent thinnings) may have in addition to fertilization large impacts on the ground vegetation. If the harmful effects of N fertilization (despite spatial variation in evenness) on the ground vegetation remain minor, this would improve the viability of using N fertilization in practical forestry to sustainably enhance carbon sequestration and wood production, supporting climate change mitigation.
Declaration of openness of research materials, data, and code
Data and code are openly available at the Zenodo data repository: https://doi.org/10.5281/zenodo.20258171.
Authors’ contributions
Conceptualisation (Elisa Männistö, Heli Peltola)
Data curation (Johanna Jetsonen, Elisa Männistö)
Formal analysis (Elisa Männistö, Teemu Rouvinen, Johanna Jetsonen)
Funding acquisition (Heli Peltola, Marjo Palviainen, Samuli Launiainen)
Investigation (Elisa Männistö, Johanna Jetsonen, Teemu Rouvinen, Heli Peltola)
Methodology (Elisa Männistö, Johanna Jetsonen, Teemu Rouvinen, Heli Peltola)
Project administration (Heli Peltola, Marjo Palviainen)
Resources (Heli Peltola, Marjo Palviainen, Samuli Launiainen)
Visualisation (Elisa Männistö, Johanna Jetsonen)
Writing – original draft (Elisa Männistö, Johanna Jetsonen, Heli Peltola, Annamari Laurén, Marjo Palviainen)
Writing – review and editing (All)
Declaration of the use of generative artificial intelligence and AI-assisted technologies
During the preparation of this work the author(s) used OpenAI’s ChatGPT in order to assist with R coding of the statistical analyses and the figures. After using this tool/service, the author(s) reviewed and edited the content as needed and take(s) full responsibility for the content of the publication.
Acknowledgements
We are grateful to Jarmo Pennala, Risto Ikonen, Anna Laine-Petäjäkangas, Nicola Kokkonen, Joni-Matti Kusmin and Petro Penttinen for their help with the field measurements and Eeva-Stiina Tuittila for discussions on formal data analyses. Tornator Oyj, Yara Suomi, ForestVital Oy, the University of Eastern Finland and the Research Council of Finland are acknowledged for their support in establishing these fertilization experiments.
Funding
This research was funded by the Strategic Research Council of the Academy of Finland through the SRC FORBIO project (decision number 314224), and by the Research Council of Finland (formerly Academy of Finland) through the PREFER project (decision numbers 348096, 348103 and 348102) and the UNITE flagship (decision numbers 337127, 357906, and 359172).
References
Äijälä O, Koistinen A, Sved J, Vanhatalo K, Väisänen P (eds) (٢٠١٩) Metsänhoidon suositukset. [Forest management recommendations]. Tapion julkaisuja.
Anderson MJ, Ellingsen KE, McArdle BH (2006) Multivariate dispersion as a measure of beta diversity. Ecol Lett 9: 683–693. https://doi.org/10.1111/j.1461-0248.2006.00926.x.
Archaux F, Wolters V (2006) Impact of summer drought on forest biodiversity: what do we know? Ann Forest Sci 63: 645–652. https://doi.org/10.1051/forest:2006041.
Braziunas KH, Geres L, Richter T, Glasmann F, Senf C, Thom D, Seibold S, Seidl R (2024) Projected climate and canopy change lead to thermophilization and homogenization of forest floor vegetation in a hotspot of plant species richness. Glob Change Biol 30, article id e17121. https://doi.org/10.1111/gcb.17121.
Buness V, Sundqvist MK, Tuhin Ali S, Annighöfer P, Miguel Aragon C, Lanzrein I, Metcalfe DB, Nilsson MC, Gundale MJ (2025) Resource quantity and heterogeneity drive successional plant diversity in managed and unmanaged boreal forests. Ecography 2025, article id e07676. https://doi.org/10.1111/ecog.07676.
Cajander AK (1949) Forest types and their significance. Acta For Fenn 56, article id 7396. https://doi.org/10.14214/aff.7396.
Carreiro M, Sinsabaugh R, Repert D, Parkhurst D (2000) Microbial enzyme shifts explain litter decay responses to simulated nitrogen deposition. Ecology 81: 2359–2365. https://doi.org/10.2307/177459.
Dahlgren J, Oksanen L, Sjödin M, Olofsson J (2007) Interactions between gray-sided voles (Clethrionomys rufucanus) and bilberry (Vaccinium myrtillus), their main winter food plant. Oecologia 152: 525–532. https://doi.org/10.1007/s00442-007-0664-8.
De Frenne P, Lenoir J, Luoto M, Scheffers BR, Zellweger F, Aalto J, Ashcroft MB, Christiansen DM, Decocq G, De Pauw K, Govaert S (2021) Forest microclimates and climate change: importance, drivers and future research agenda. Glob Change Biol 27: 2279–2297. https://doi.org/10.1111/gcb.15569.
Dirkse G, Martakis G (1992) Effects of fertilizer on bryophytes in Swedish experiments on forest fertilization. Biol Conserv 59: 155–161. https://doi.org/10.1016/0006-3207(92)90576-9.
Finér L, Mannerkoski H, Piirainen S, Starr M (2003) Carbon and nitrogen pools in an old-growth, Norway spruce mixed forest in Eastern Finland and changes associated with clear-cutting. For Ecol Manag 174: 51–63. https://doi.org/10.1016/S0378-1127(02)00019-1.
Finnish Meteorological Institute (2023) Open data – Finnish Meteorological Institute. https://en.ilmatieteenlaitos.fi/open-data. Accessed 27 February 2023.
Gustavsen HG, Lipas E (1975) Lannoituksella saatavan kasvunlisäyksen riippuvuus annetusta typpimäärästä. [Effect of nitrogen dosage on fertilizer response]. Folia For 246. http://urn.fi/URN:ISBN:951-40-0188-5.
He X, He KS, Hyvönen J (2016) Will bryophytes survive in a warming world? Perspect Plant Ecol 19: 49–60. https://doi.org/10.1016/j.ppees.2016.02.005.
Hedwall PO, Nordin A, Brunet J, Bergh J (2010) Compositional changes of forest-floor vegetation in young stands of Norway spruce as an effect of repeated fertilisation. For Ecol Manag 259: 2418–2425. https://doi.org/10.1016/j.foreco.2010.03.018.
Hedwall PO, Strengbom J, Nordin A (2013) Can thinning alleviate negative effects of fertilization on boreal forest floor vegetation? For Ecol Manag 310: 382–392. https://doi.org/10.1016/j.foreco.2013.08.040.
Hedwall PO, Gong P, Ingerslev M, Bergh J (2014) Fertilization in northern forests – biological, economic and environmental constraints and possibilities. Scand J For Res 29: 301–311. https://doi.org/10.1080/02827581.2014.926096.
Hegland SJ, Jongejans E, Rydgren K (2010) Investigating the interaction between ungulate grazing and resource effects on Vaccinium myrtillus populations with integral projection models. Oecologia 163: 695–706. https://doi.org/10.1007/s00442-010-1616-2.
Helmisaari H-S (1995) Nutrient cycling in Pinus sylvestris stands in Eastern Finland. Plant Soil 168: 327–336. https://doi.org/10.1007/BF00029345.
Ilvesniemi H, Forsius M, Finér L, Holmberg M, Kareinen T, Lepistö A, Piirainen S, Pumpanen J, Rankinen K, Starr M, Tamminen P, Ukonmaanaho L, Vanhala P (2002) Carbon and nitrogen storages and fluxes in Finnish forest ecosystems. In: Käyhkö J, Talve L (eds) Understanding the global system. The Finnish perspective. Finnish Global Change Programme FIGARE, Painosalama, Turku, pp 69–82. ISBN 951-29-2407-2.
IPCC (2023) Core Writing Team. Climate change 2023: synthesis report. Contribution of Working Groups I, II and III to the Sixth Assessment Report (AR6). In: Lee H, Romero J (eds) IPCC, Geneva, pp 35–115. https://www.ipcc.ch/report/ar6/syr/downloads/report/IPCC_AR6_SYR_LongerReport.pdf. Accessed 27 February 2025.
Jacobson S, Högbom L, Ring E (2020) Long-term responses of understory vegetation in boreal Scots pine stands after nitrogen fertilization. Scand J For Res 35: 139–146. https://doi.org/10.1080/02827581.2020.1761996.
Jalkanen R, Aalto T, Kurkela T (1995) Development of needle retention in Scots pine (Pinus sylvestris) in 1957–1991 in northern and southern Finland. Trees 10: 125–133. https://doi.org/10.1007/BF00192193.
Jetsonen J, Laurén A, Peltola H, Muhonen O, Nevalainen J, Ikonen V-P, Kilpeläinen A, Tuittila E-S, Männistö E, Kokkonen N, Palviainen M (2024) Effects of nitrogen fertilization on the ground vegetation cover and soil chemical properties in Scots pine and Norway spruce stands. Silva Fenn 58, article id 23058. https://doi.org/10.14214/sf.23058.
Jetsonen J, Laurén A, Peltola H, Laurén K, Launiainen S, Palviainen M (2025) Volume growth responses of Scots pine and Norway spruce to nitrogen fertilization: quantitative synthesis of fertilization experiments in Finland. Silva Fenn 59, article id 24041. https://doi.org/10.14214/sf.24041.
Johnson DW (1992) Effects of forest management on soil carbon storage. Water Air Soil Poll 64: 83–120. https://doi.org/10.1007/BF00477097.
Jörgensen K, Granath G, Lindahl BD, Strengbom J (2021) Forest management to increase carbon sequestration in boreal Pinus sylvestris forests. Plant Soil 466: 165–178. https://doi.org/10.1007/s11104-021-05038-0.
Kellner O (1993) Effects on associated flora of silvicultural nitrogen fertilization repeated at long. J Appl Ecol 30: 563–574. https://doi.org/10.2307/2404195.
Kellner O, Redbo-Torstensson P (1995) Effects of elevated nitrogen deposition on the field-layer vegetation in coniferous forests. Ecol Bull 44: 227–237. https://www.jstor.org/stable/20113165.
Kellomäki S, Puttonen P, Tamminen H, Westman CJ (1982) Effect of nitrogen fertilization on photosynthesis and growth in young Scots pine – preliminary results. Silva Fenn 16: 363–371. https://doi.org/10.14214/sf.a15084.
Koelemeijer IA, Severholt I, Ehrlen J, De Frenne P, Jönsson M, Hylander K (2024) Canopy cover and soil moisture influence forest understory plant responses to experimental summer drought. Glob Change Biol 30, article id e17424. https://doi.org/10.1111/gcb.17424.
Kukkola M, Saramäki J (1983) Growth response in repeatedly fertilized pine and spruce stands on mineral soils. Commun Inst For Fenn 114. http://urn.fi/URN:ISBN:951-40-0622-4.
Lecocq F, Winkler H, Daka JP, Fu S, Gerber JS, Kartha S, Krey V, Lofgren H, Masui T, Mathur R, Portugal-Pereira J, Sovacool BK, Vilariño MV, Zhou N (2022) Mitigation and development pathways in the near- to mid-term. In: Shukla PR, Skea J, Slade R, Al Khourdajie A, van Diemen R, McCollum D, Pathak M, Some S, Vyas P, Fradera R, Belkacemi M, Hasija A, Lisboa G, Luz S, Malley J (eds) IPCC 2022: Climate change 2022: mitigation of climate change. Contribution of Working Group III to the Sixth Assessment Report of the Intergovernmental Panel on Climate Change. Cambridge University Press, Cambridge, pp 409–502. https://doi.org/10.1017/9781009157926.006.
Lieffers VJ, Messier C, Stadt KJ, Gendron F, Comeau PG (1999) Predicting and managing light in the understory of boreal forests. Can J For Res 29: 796–811. https://doi.org/10.1139/x98-165.
Majasalmi T, Rautiainen M (2020) The impact of tree canopy structure on understory variation in a boreal forest. For Ecol Manag 466, article id 118100. https://doi.org/10.1016/j.foreco.2020.118100.
Mäkipää R (1994) Effects of nitrogen fertilization on the humus layer and ground vegetation under closed canopy in boreal coniferous stands. Silva Fenn 28: 81–94. https://doi.org/10.14214/sf.a9164.
Mäkipää R (1995) Effect of nitrogen input on carbon accumulation of boreal forest soils and ground vegetation. For Ecol Manag 79: 217–226. https://doi.org/10.1016/0378-1127(95)03601-6.
Mälkönen E (1974) Annual primary production and nutrient cycle in some Scots pine stands. Commun Inst For Fenn 84: 1–87. http://urn.fi/URN:NBN:fi-metla-201207171117.
Marshall J, Peichl M, Tarvainen L, Lim H, Lundmark T, Näsholm T, Öquist M, Linder S (2021) A carbon-budget approach shows that reduced decomposition causes the nitrogen-induced increase in soil carbon in a boreal forest. For Ecol Manag 502, article id 119750. https://doi.org/10.1016/j.foreco.2021.119750.
Muhonen O, Peltola H, Laurén A, Ikonen V-P, Nevalainen J, Pikkarainen L, Kilpeläinen A, Launiainen S, Palvinainen M (2025) Spatial evenness of fertilization and short-term volume growth responses of Scots pine and Norway spruce to fertilization intensity. Silva Fenn 59, article id 24026. https://doi.org/10.14214/sf.24026.
Niinemets Ü, Lukjanova A (2003) Total foliar area and average leaf age may be more strongly associated with branching frequency than with leaf longevity in temperate conifers. New Phytol 158: 75–89. https://doi.org/10.1046/j.1469-8137.2003.00712.x.
Økland T, Nordbakken JF, Clarke N, Holt Hanssen K (2022) Short-term effects of hardened wood ash and nitrogen fertilisation on understory vegetation in a Norway spruce forest in south-east Norway. Scand J For Res 37: 320–329. https://doi.org/10.1080/02827581.2022.2104365.
Olsson BA, Kellner O (2006) Long-term effects of nitrogen fertilization on ground vegetation in coniferous forests. For Ecol Manag 237: 458–470. https://doi.org/10.1016/j.foreco.2006.09.068.
Palviainen M (2005) Logging residues and ground vegetation in nutrient dynamics of a clear-cut boreal forest. Diss For 12. https://doi.org/10.14214/df.12.
Palviainen M, Finér L, Mannerkoski H, Piirainen S, Starr M (2005a) Changes in the above- and below-ground biomass and nutrient pools of ground vegetation after clear-cutting of a mixed boreal forest. Plant Soil 275: 157–167. https://doi.org/10.1007/s11104-005-1256-1.
Palviainen M, Finér L, Mannerkoski H, Piirainen S, Starr M (2005b) Responses of ground vegetation species to clear-cutting in a boreal forest: aboveground biomass and nutrient contents during the first 7 years. Ecol Res 20: 652–660. https://doi.org/10.1007/s11284-005-0078-1.
Petaja G, Elferts D, Bārdule A, Zvaigzne ZA, Purviņa D, Skranda I (2025) Short-term ground vegetation responses to fertilization in Latvian forests: effects on species richness and diversity. Environments 12, article id 47. https://doi.org/10.3390/environments12020047.
Petersson L, Holmström E, Lindbladh M, Felton A (2019) Tree species impact on understory vegetation: vascular plant communities of Scots pine and Norway spruce managed stands in northern Europe. For Ecol Manag 448: 330–345. https://doi.org/10.1016/j.foreco.2019.06.011.
Pettersson F, Högbom L (2004) Long-term growth effects following forest nitrogen fertilization in Pinus sylvestris and Picea abies stands in Sweden. Scand J For Res 19: 339–347. https://doi.org/10.1080/02827580410030136.
Pinheiro J, Bates D, DebRoy S, Sarkar D, R Core Team (2014) nlme: linear and nonlinear mixed effects models. R package version 3. http://cran.r-project.org/package=nlme.
Pukkala T (2017) Optimal nitrogen fertilization of boreal conifer forest. For Ecosyst 4, article id 3. https://doi.org/10.1186/s40663-017-0090-2.
Rajaniemi TK (2002) Why does fertilization reduce plant species diversity? Testing three competition-based hypotheses. J Ecol 90: 316–324. https://doi.org/10.1046/j.1365-2745.2001.00662.x.
Saarsalmi A, Mälkönen E (2001) Forest fertilization research in Finland: a literature review. Scand J For Res 16: 514–535. https://doi.org/10.1080/02827580152699358.
Sikström U, Nohrstedt HÖ, Pettersson F, Jacobson S (1998) Stem-growth response of Pinus sylvestris and Picea abies to nitrogen fertilization as related to needle nitrogen concentration. Trees 12: 208–214. https://doi.org/10.1007/PL00009712.
Skrindo A, Økland RH (2002) Effects of fertilization on understorey vegetation in a Norwegian Pinus sylvestris forest. Appl Veg Sci 5: 167–172. https://doi.org/10.1111/j.1654-109X.2002.tb00546.x.
Strengbom J, Nordin A (2008) Commercial forest fertilization causes long-term residual effects in ground vegetation of boreal forests. For Ecol Manag 256: 2175–2181. https://doi.org/10.1016/j.foreco.2008.08.009.629.x.
Strengbom J, Nordin A, Näsholm T, Ericson L (2001) Slow recovery of boreal forest ecosystem following decreased nitrogen input. Funct Ecol 15: 451–457. https://doi.org/10.1046/j.0269-8463.2001.00538.x.
Strengbom J, Nordin A, Näsholm T, Ericson L (2002) Parasitic fungus mediates change in nitrogen-exposed boreal forest vegetation. J Ecol 90: 61–67. https://doi.org/10.1046/j.0022-0477.2001.00629.x.
Sullivan TP, Sullivan DS (2018) Influence of nitrogen fertilization on abundance and diversity of plants and animals in temperate and boreal forests. Environ Rev 26: 26–42. https://doi.org/10.1139/er-2017-0026.
Tamm CO (1991) Nitrogen in terrestrial ecosystems questions of productivity, vegetational changes, and ecosystem stability. Springer, Berlin.
Turkington R, John E, Krebs CJ, Dale MRT, Nams VO, Boonstra R, Boutin S, Martin K, Sinclair ARE, Smith JNM (1998) The effects of NPK fertilization for nine years on boreal forest vegetation in northwestern Canada. J Veg Sci 9: 333–346. https://doi.org/10.2307/3237098.
Ukonmaanaho L, Merilä P, Nöjd P, Nieminen TM (2008) Litterfall production and nutrient return to the forest floor in Scots pine and Norway spruce stands in Finland. Boreal Environ Res 13: 67–91. http://hdl.handle.net/10138/235267.
van Dobben HF, ter Braak CJF, Dirkse GM (1999) Undergrowth as a biomonitor for deposition of nitrogen and acidity in pine forest. For Ecol Manag 114: 83–95. https://doi.org/10.1016/S0378-1127(98)00383-1.
Wang Y, Naumann U, Wright ST, Warton DI (2012) Mvabund – an R package for model based analysis of multivariate abundance data. Methods Ecol Evol 3: 461–474. https://doi.org/10.1111/j.2041-210X.2012.00190.x.
Zhang S, Sjögren J, Hylander K, Koelemeijer IA, Jönsson M (2025) Retention forestry enhances the resilience of the moss Hylocomium splendens to extreme drought in boreal forests. J Appl Ecol 62: 899–910. https://doi.org/10.1111/1365-2664.70016.
Total of 65 references.
