Roberts Matisons  ,
Guntars Šņepsts,
Līga Puriņa,
Jānis Donis,
Āris Jansons
,
Guntars Šņepsts,
Līga Puriņa,
Jānis Donis,
Āris Jansons
Dominant height growth of European beech at the northeasternmost stands in Europe
Matisons R., Šņepsts G., Puriņa L., Donis J., Jansons Ā. (2018). Dominant height growth of European beech at the northeasternmost stands in Europe. Silva Fennica vol. 52 no. 1 article id 7818. https://doi.org/10.14214/sf.7818
Highlights
- The dominant height growth of the introduced European beech was modelled using the generalised algebraic difference approach
- The Chapman-Richards and Sloboda models showed the best fit to the data
- Height growth of the second generation trees exceeded the first generation trees
- In the western part of Latvia, height growth of beech exceeded that in southern Sweden.
Abstract
The height growth of trees influences the productivity of stands and the competitiveness of species, shaping the range of their distribution. Dominant height growth was assessed for European beech (Fagus sylvatica L.), growing outside of its natural distribution range in the western part of Latvia. In 10 neighbouring experimental stands, 20 dominant trees were felled for stem analysis. Height growth was modelled using the generalised algebraic difference approach, applying several non-linear equations and mixed procedures. The Chapman-Richards and Sloboda models showed the best fit to the data. Height growth of the second generation (younger) trees exceeded that of the first generation, and followed curve for a higher site index, suggesting sufficient adaptation and improving conditions. Height growth of the studied beech exceeded predictions for beech in southern Sweden, which is considered to be the northern limit of the species range, yet the growth pattern differed. In Latvia, slower height growth was estimated for site indices < 32 m (in 100 years) during the first 60 years, yet larger maximal height was predicted, suggesting a longer establishment period. Nevertheless, the improving height growth indicated increasing potential for the application of the species in commercial forestry, and an expansion of the species within the region even during the 21th century.
Keywords
site index;
Fagus sylvatica;
generalized algebraic difference approach;
height models
-
Matisons,
Latvian State Forest Research Institute “Silava”, Rīgas str. 111, Salaspils, Latvia, LV2169
E-mail
robism@inbox.lv
- Šņepsts, Latvian State Forest Research Institute “Silava”, Rīgas str. 111, Salaspils, Latvia, LV2169 E-mail guntars.snepsts@silava.lv
- Puriņa, Latvian State Forest Research Institute “Silava”, Rīgas str. 111, Salaspils, Latvia, LV2169 E-mail liga.purina@silava.lv
- Donis, Latvian State Forest Research Institute “Silava”, Rīgas str. 111, Salaspils, Latvia, LV2169 E-mail janis.donis@silava.lv
- Jansons, Latvian State Forest Research Institute “Silava”, Rīgas str. 111, Salaspils, Latvia, LV2169 E-mail aris.jansons@silava.lv
Received 5 October 2017 Accepted 16 January 2018 Published 18 January 2018
Views 69917
Available at https://doi.org/10.14214/sf.7818 | Download PDF

1 Introduction
Bioclimatic models predict that conditions in the Baltic States would become suitable for European beech (Fagus sylvatica L.) by the end of the 21st century; accordingly, shifts in the geographic distribution of the species are expected (Kramer et al. 2010; Hickler et al. 2012). Improved growth of beech has been observed in southern Sweden (cf. Falkengren-Grerup and Eriksson 1990). The distribution limits of trees have been related to primary growth rate (Loehle 1998); hence, the spread of a species is influenced by the success of height increment and competition (Seynave et al. 2008). Height increment is also among the main parameters that influence the productivity of stands (Burton 2012); and such information is valuable for the prediction of growth under current and future climates. In this regard, experimental plantations outside the natural range serve as useful indicators for the adaptive capacity of the species, particularly in the context of climatic change (Seynave et al. 2008; Kreyling et al. 2014).
At present, the northeasternmost stands of beech occur in the western part of Latvia (Bolte et al. 2007), providing an opportunity to study their growth under a harsher climate, outside of its natural range (Kramer et al. 2010). Nevertheless, good survival (Puriņa et al. 2016) and productivity (Dreimanis 1995) indicate that conditions in Latvia are already satisfactory for growth of the introduced beech. Still, height growth of beech near its northern distribution limit has been scarcely studied (cf. Carbonnier 1971). The aim of this study was to assess dominant height growth of beech in the western part of Latvia. We hypothesised that, due to climate warming, height growth of beech in the western part of Latvia is comparable to the northern parts of its natural distribution.
2 Material and methods
2.1 Study site and sampling
The studied stands were located in the western part of Latvia (57°15´N, 22°38´E), within 5 km distance of each other. The stands were growing in similar lowland conditions (80–105 m a.s.l.), in a flat topography. The soil was fertile and silty, yet well drained. The climate was mild; the mean annual temperature ± standard deviation during 1914–2014 was 6.1 ± 1.0 °C; the mean monthly temperature ranged from –3.8 ± 3.7 in February to 16.6 ± 1.5 °C in July (Harris et al. 2014). The mean annual precipitation was 658 ± 102 mm; the highest monthly precipitation occurred during the summer months (June–August; 72 ± 36 mm). Climatic changes were expressed as a warming of winters and springs (Lizuma et al. 2007) and an extension of precipitation-free periods in the summers (Avotniece et al. 2010).
In 2017, 20 dominant sample trees, growing in 10 unthinned stands of different ages (ca. 70, 110 and 140 years), were felled for stem analysis. The dominant trees were selected to avoid the effects of competition (Brunner and Nigh 2000). Stem disks were taken at 0.2 (stump), 1.3, and every 2 m above the base heights. The surface of the stem disks was grinded and the number of tree-rings was counted under a microscope. The cambial age of the trees at each height was determined. Tree height was corrected for ‘hidden tops’ using the Carmean (1972) correction. The oldest trees (age > 100 years) originated from seed material transferred from northern Germany (exact provenance unknown); the younger trees were propagated from local seed material, representing the second generation. The initial spacing of the plantations was 2 × 2 m.
2.2 Data analysis
Dominant height growth was modelled using non-linear Chapman-Richards, Hossfeld, King-Prodan, log-logistic, Sloboda, and Strand equations (Table 1), transformed according to the generalised algebraic difference approach (Cieszewski and Baily 2000; Sharma et al. 2011). Such models have been applied for height growth modelling (Sharma et al. 2011), as they are polymorphic, allowing site-specific parameters, e.g., multiple asymptotes, and are base-age invariant (Cieszewski and Baily 2000). The models were developed for dominant heights above 1.3 m. Time-series of tree heights were reorganised to height difference for each observation period, where h0 was the height at age t0, and h1 was the height at age t1 (in metres and years, respectively). The mean ± standard error age, when the studied beech had reached breast height, was 4.7 ± 0.4 years.
| Table 1. The generalized algebraic difference approach models fitted to dominant height time series of beech according to Sharma et al. (2011). | |
| Base model | Generalized algebraic difference approach model |
 | |
As several measurements originated from a single tree, mixed models were applied to solve the independence problem (Bates et al. 2015), accounting for random effects of tree and stand. The models were evaluated by fit statistics, graphical analysis of residuals, and biological realism (Goelz and Burk 1992). Statistically, model fit was estimated by mean residual (MR), McNemar’s adjusted R2, root mean squared error (RMSE), and the Akaike information criterion (AIC). Yield tables for beech in southern Sweden were used for comparison (Carbonnier 1971). Data analysis was conducted in the program R v. 3.3.3, using the “lme4” package (Bates et al. 2015).
3 Results
The developed dominant height models showed a slightly differing fit to the measurements (Table 2) and conformance with the biological realism principle (Fig. 1). For most of the models, errors were similar (MR ≤ 0.53 m and RMSE ≤ 0.66, except for Hossfeld I, which showed higher errors), and the R2-values were high (>0.99, Table 2). The t-values of the parameter estimates mostly exceeded 2.0, except for the single parameters in the Chapman-Richards and log-logistic models. According to the AIC, the Sloboda and Chapman-Richards models showed the best fit, while the Hossfeld’s and log-logistic models showed the weakest fit to the data. The variance of random effects was < 2.50.
| Table 2. Parameter estimates and their t-values of the fitted models. Models fit statistics: mean absolute residual (MR), residual standard error (RSE), root mean squared error (RMSE), Akaike information criterion (AIC), adjusted R2-value (McNemar’s method), and variance components of the random effects (VAR). | |||||||
| Chapman-Richards | Hossfeld | Hossfeld I | King-Prodan | Log-logistic | Sloboda | Strand | |
| Parameter estimates | |||||||
| b1 | 0.0227 | 43.7466 | 0.0228 | 1.576 | 43.803 | 52.9402 | 0.1789 |
| b2 | –9.8636 | 121.078 | –0.0054 | 118.678 | –104.29 | 0.2502 | –0.0034 |
| b3 | 42.6561 | 1.5954 | –5281.7 | –1.6153 | 0.6489 | 2.2777 | |
| Estimate t-values | |||||||
| b1 | 16.88 | 10.36 | 11.47 | 37.15 | 11.83 | 7.8 | 8.48 |
| b2 | 1.91 | 2.65 | 4.7 | 2.17 | 0.06 | 7.57 | 2.03 |
| b3 | 2.23 | 37.81 | 2.03 | 38.12 | 12.98 | 15.7 | |
| Model statistics | |||||||
| MR (m) | 0.48 | 0.51 | 0.72 | 0.52 | 0.53 | 0.49 | 0.51 |
| RSE (m) | 0.6 | 0.65 | 0.83 | 0.65 | 0.67 | 0.63 | 0.64 |
| RMSE (m) | 0.6 | 0.64 | 0.82 | 0.65 | 0.66 | 0.62 | 0.64 |
| AIC | 660.3 | 685.3 | 835 | 686.9 | 694.3 | 656.8 | 677.7 |
| Adj. R2 | 0.9963 | 0.9956 | 0.9958 | 0.9956 | 0.9954 | 0.9959 | 0.9958 |
| VAR (tree) | 0.317 | 1.125 | 0.133 | 0.013 | 0.432 | 0.721 | 0.009 |
| VAR (stand) | 0.011 | 1.965 | 2.231 | 2.023 | 0.414 | 0.168 | 0.377 |
| VAR (residual) | 0.367 | 0.418 | 0.553 | 0.422 | 0.441 | 0.384 | 0.409 |
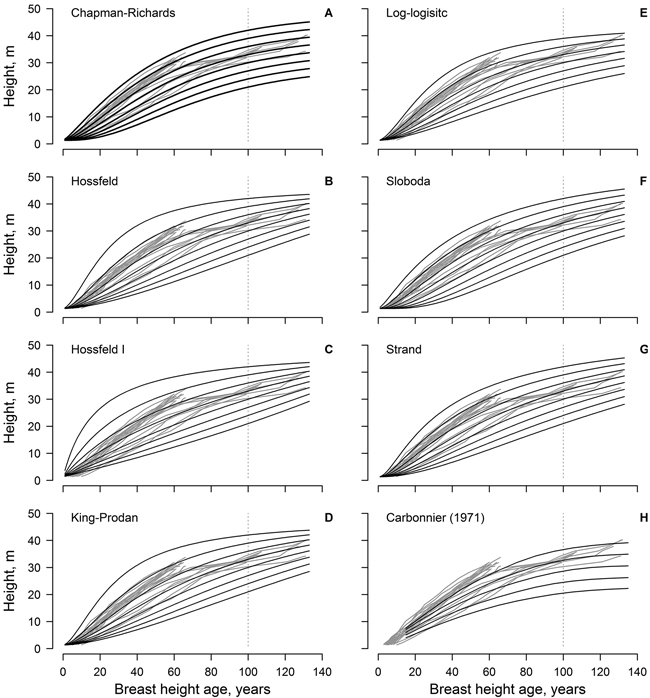
Fig. 1. The non-linear dominant height models (black lines) fitted to the observed data (grey lines, each line represent single tree); model predictions are for 3 m site index intervals for the range 21–42 m (A–G). Panel H show the height growth of beech in southern Sweden according to Carbonnier (1971); black line show site indices in 4 m intervals for the range 20–36 m.
The Sloboda and Chapman-Richards models appeared to be the most realistic, as the modelled curves followed, and encompassed, the measured time-series throughout the reference period (Fig. 1). These models (particularly the Sloboda model) predicted slow height growth in the initial stage of stand (first 20 years) for site indices ≤ 27 m in 100 years. In addition, these models showed the best conformity with the improving height growth of the younger trees (ca. 70 years old). The Strand model showed similar tendencies, yet was more optimistic regarding the highest site indices. The log-logistic model was the most conservative, predicting the lowest maximum tree heights, yet it showed lower conformance with measurements at a younger age (<20 years). The Hossfeld and King-Prodan models overestimated height increment for the site indices > 36 m during the first 60–70 years, obviously exceeding the biologically possible growth.
The dominant height models (yield tables) developed in southern Sweden (cf. Carbonnier 1971) showed weak conformity with the observed height growth of the studied beech, particularly regarding the younger trees (ca. 70 years old) and the lower site indices (Fig. 1). In addition, height growth of the younger trees exceeded the range of the yield table (cf. Carbonnier 1971) predictions. The predictions of the yield table also showed high bias, compared to the best of the developed modes (Chapman-Richards, and particularly Sloboda): overestimation at younger age (<100 years) and underestimation at the older age (Fig. 2). The bias was stronger for the lower site indices.
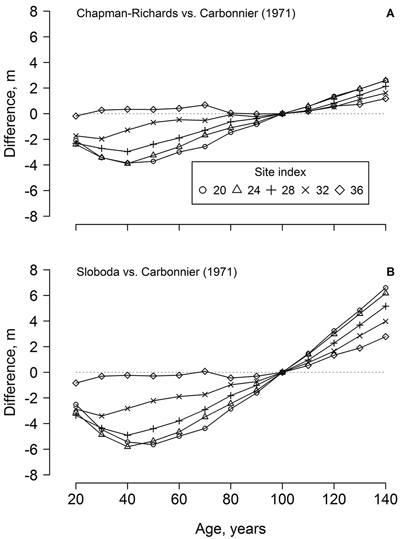
Fig. 2. The differences between beech dominant height predicted by the developed Chapman-Richards (A) and Sloboda (B) models in the western part of Latvia and yield tables for southern Sweden (cf. Carbonnier 1971) according to stand age and site index.
4 Discussion
The fit statistics (Table 2) and biological realism (Fig. 1) indicated the Chapman-Richards and, particularly, Sloboda model, which showed higher t-values of the parameters, as the best for estimating the dominant height of beech in the western part of Latvia. The differences in precision of the parameter estimates of these models (Table 2) were likely caused by the limited dataset (Sharma et al. 2011). Although the dominant height models are often region-specific (Sharma et al. 2011), wider verification of the developed models within the region was impossible, due to an absence of beech stands. The models were developed based on even-aged plantation (Fig. 1), and their predictions might be biased for stands with extreme density (Brunner and Nigh 2000; Sharma et al. 2011).
Considering that climatic changes appear beneficial for beech growth in the Northern Europe (Falkengren-Grerup and Eriksson 1990; Kramer et al. 2010), improved height growth, following the curve for a better site, was observed for the younger (second generation) trees (Fig. 1). This relates to the climatic component of site quality for species growing in marginal populations (Sharma et al. 2012; Kreyling et al. 2014). Improved tree growth has also been related to eutrophication (Pretzsch et al. 2014). Alternatively, improved growth of the second generation trees might be related to the natural and anthropogenic selection of the best adapted genotypes (Matisons et al. 2017).
The dominant height models from southern Sweden (Carbonnier 1971) showed rather poor conformity with the height growth of beech in the western part of Latvia, particularly for site indices < 32 m (Fig. 2), which, however, were not represented by the measurements (Fig. 1). Under harsher climatic conditions in Latvia (compared to southern Sweden), a longer time appeared necessary for beech to establish, explaining the deviations from the yield tables (Fig. 2). Slower establishment (extended “lag” phase of growth), which is ordinarily for shade-tolerant species (Seynave et al. 2008; Sharma et al. 2011), was predicted by the Chapman-Richards and, particularly, the Sloboda models (Fig. 1). The yield tables (cf. Carbonnier 1971) also underestimated height growth in longer term (>100 years, Fig. 2), indicating improving growing conditions for beech in the western part of Latvia. Still, the Carbonnier (1971) model might be outdated, due to warming and eutrophication (Falkengren-Grerup and Eriksson 1990; Sharma et al. 2012). Nevertheless, height growth of the younger trees exceeded the predictions of the yield table (Fig. 1 H), indicating improving growing conditions (cf. Carbonnier 1971) and, hence, a rising potential for wider distribution of beech in the Baltics.
5 Conclusions
The developed dominant height models indicated high forestry potential of European beech in the western part of Latvia, particularly for the planting material propagated from local plantations. Accordingly, beech could be approbated for wider application in commercial forestry within the region in the near future. Still, verification of these models on a larger dataset, containing a wider spectrum of site indices, would be necessary to increase the accuracy of the estimates.
Acknowledgements
The study was funded by the research program “The value and dynamic of Latvia’s ecosystems under changing climate – EVIDEnT”. We acknowledge Andis Adamovičs and Juris Katrevičs, who helped during sampling.
References
Avotniece Z., Rodinov V., Lizuma L., Briede A., Kļaviņš M. (2010). Trends in the frequency of extreme climate events in Latvia. Baltica 23: 135–148.
Bates D., Maechler M., Bolker B., Walker S. (2015). Fitting linear mixed-effects models using lme4. Journal of Statistical Software 67(1): 1–48. https://doi.org/10.18637/jss.v067.i01.
Bolte A., Czajkowski T., Kompa T. (2007). The north-eastern distribution range of European beech – a review. Forestry 80(4): 413–429. https://doi.org/10.1093/forestry/cpm028.
Brunner A., Nigh G. (2000). Light absorption and bole volume growth of individual Douglas-fir trees. Tree Physiology 20(5–6): 323–332. https://doi.org/10.1093/treephys/20.5-6.323.
Burton L. (2012). Introduction to Forestry Science, 3rd edition. Cengage Learning, New York. 554 p.
Carbonnier C. (1971). Yield of beech in southern Sweden. Studia Forestalia Suecica 91: 1–89.
Carmean W.H. (1972). Site index curves for upland oaks in the Central States. Forest Science 18: 109–120.
Cieszewski C., Bailey R.L. (2000). Generalized algebraic difference approach: theory based derivation of dynamic site q with polymorphism and variable asymptotes. Forest Science 46: 116–126.
Dreimanis A. (1995). The beech and the larch-tree in Shkede forestry. Proceedings of 75th Conference of Latvia University of Agriculture 5: 94–97.
Falkengren-Grerup U., Eriksson H. (1990). Changes in soil, vegetation and forest yield between 1947 and 1988 in beech and oak sites of southern Sweden. Forest Ecology and Management 38(1–2): 37–53. https://doi.org/10.1016/0378-1127(90)90084-O.
Goelz J.C.G., Burk T.E. (1992). Development of a well-behaved site index equation – jack pine in North-central Ontario. Canadian Journal of Forest Research 22(6): 776–784. https://doi.org/10.1139/x92-106.
Harris I.P., Jones P.D., Osborn T.J., Lister D.H. (2014). Updated high‐resolution grids of monthly climatic observations – the CRU TS3. 10 dataset. International Journal of Climatology 34: 623–642. https://doi.org/10.1002/joc.3711.
Hickler T., Vohland K., Feehan J., Miller P., Smith B., Costa L., Giesecke T., Fronzek S., Carter T., Cramer W., Kühn I., Sykes M. (2012). Projecting the future distribution of European potential natural vegetation zones with a generalized, tree species-based dynamic vegetation model. Global Ecology and Biogeography 21(1): 50–63. https://doi.org/10.1111/j.1466-8238.2010.00613.x.
Kramer K., Degen B., Buschbom J., Hickler T., Thuiller W., Sykes M., de Winter W. (2010). Modelling exploration of the future of European beech (Fagus sylvatica L.) under climate change – range, abundance, genetic diversity and adaptive response. Forest Ecology and Management 259(11): 2213–2222. https://doi.org/10.1016/j.foreco.2009.12.023.
Kreyling J., Buhk C., Backhaus S., Hallinger M., Huber G., Huber L., Jentsch A., Konnert M., Thiel., Wilmking M., Beierkuhnlein C. (2014). Local adaptations to frost in marginal and central populations of the dominant forest tree Fagus sylvatica L. as affected by temperature and extreme drought in common garden experiments. Ecology and Evolution 4: 594–605. https://doi.org/10.1002/ece3.971.
Lizuma L., Kļaviņš M., Briede A., Rodinovs V. (2007). Long-term changes of air temperature in Latvia. In: Kļaviņš M. (ed.). Climate change in Latvia. University of Latvia, Riga, Latvia. p. 11–20.
Loehle C. (1998). Height growth rate tradeoffs determine northern and southern range limits for trees. Journal of Biogeography 25: 735–742. https://doi.org/10.1046/j.1365-2699.1998.2540735.x.
Matisons R., Puriņa L., Adamovičs A., Robalte L., Jansons A. (2017). European beech in its northeasternmost stands in Europe: varying climate-growth relationships among generations and diameter classes. Dendrochronologia 45: 123–133. https://doi.org/10.1016/j.dendro.2017.08.004.
Pretzsch H., Biber P., Schütze G., Bielak K. (2014). Changes of forest stand dynamics in Europe. Facts from long-term observational plots and their relevance for forest ecology and management. Forest Ecology and Management 316: 65–77. https://doi.org/10.1016/j.foreco.2013.07.050.
Puriņa L., Matisons R., Jansons Ā., Šēnhofa S. (2016). Survival of European beech in the central part of Latvia 33 years since the plantation. Silva Fennica 50(4) article 1656. https://doi.org/10.14214/sf.1656.
Seynave I., Gegout J.C., Herve J.C., Dhote J.F. (2008). Is the spatial distribution of European beech (Fagus sylvatica L.) limited by its potential height growth? Journal of Biogeography 35: 1851–1862. https://doi.org/10.1111/j.1365-2699.2008.01930.x.
Sharma R.P., Brunner A., Eid T., Øyen B.H. (2011). Modelling dominant height growth from national forest inventory individual tree data with short time series and large age errors. Forest Ecology and Management 262(12): 2162–2175. https://doi.org/10.1016/j.foreco.2011.07.037.
Sharma R.P., Brunner A., Eid T. (2012). Site index prediction from site and climate variables for Norway spruce and Scots pine in Norway. Scandinavian Journal of Forest Research 27(7): 619–636. https://doi.org/10.1080/02827581.2012.685749.
Total of 23 references.
