Jari Lindblad  ,
Johanna Routa,
Johanna Ruotsalainen,
Marja Kolström,
Ari Isokangas,
Lauri Sikanen
,
Johanna Routa,
Johanna Ruotsalainen,
Marja Kolström,
Ari Isokangas,
Lauri Sikanen
Weather based moisture content modelling of harvesting residues in the stand
Lindblad J., Routa J., Ruotsalainen J., Kolström M., Isokangas A., Sikanen L. (2018). Weather based moisture content modelling of harvesting residues in the stand. Silva Fennica vol. 52 no. 2 article id 7830. https://doi.org/10.14214/sf.7830
Highlights
- Weather data used for estimating the moisture content of energy wood
- The validation of the weather based models performed based on the field data.
Abstract
Harvesting residues collected from the final cuttings of boreal forests are an important source of solid biofuel for energy production in Finland and Sweden. In the Finnish supply chain, the measurement of residues is performed by scales integrated in forwarders. The mass of residues is converted to volume by conversion factors. In this study, weather based models for defining the moisture content of residues were developed and validated. Models were also compared with the currently used fixed tables of conversion factors. The change of the moisture content of residues is complex, and an exact estimation was challenging. However, the model predicting moisture change for three hour periods was found to be the most accurate. The main improvement compared to fixed tables was the lack of a systematic error. It can be assumed that weather based models will give more reliable estimates for the moisture in varying climate conditions and the further development of models should be focused on obtaining more appropriate data from varying drying conditions in different geographical and microclimatological locations.
Keywords
logging residues;
harvesting residues;
energy wood measurement;
conversion factor
-
Lindblad,
Natural Resources Institute Finland (Luke), Production systems, Yliopistokatu 6, FI-80100 Joensuu, Finland
E-mail
jari.lindblad@luke.fi
- Routa, Natural Resources Institute Finland (Luke), Production systems, Yliopistokatu 6, FI-80100 Joensuu, Finland E-mail johanna.routa@luke.fi
- Ruotsalainen, Finnish Meteorological Institute, Aviation and Military Weather Services, P.O. Box 1627, FI-70211 Kuopio, Finland E-mail johanna.ruotsalainen@fmi.fi
- Kolström, University of Eastern Finland, School of Forest Sciences, P.O. Box 111, FI-80101 Joensuu, Finland E-mail marja.kolstrom@uef.fi
- Isokangas, University of Oulu, Control Engineering, P.O. Box 8000, FI-90014 University of Oulu, Finland E-mail ari.isokangas@oulu.fi
- Sikanen, Natural Resources Institute Finland (Luke), Production systems, Yliopistokatu 6, FI-80100 Joensuu, Finland E-mail lauri.sikanen@luke.fi
Received 31 October 2017 Published 27 April 2018
Views 72129
Available at https://doi.org/10.14214/sf.7830 | Download PDF

1 Introduction
Harvesting residues (branches and treetops) collected from the final cuttings of boreal forests are an important source of solid biofuel for energy production. In 2016, 2.5 Mm3 harvesting residues were collected in Finland, which is equivalent to 1.2% of total energy consumption (Official Statistics 2017). Harvesting residues are a side product of the final cuttings of mature coniferous forest and a major part of the residues is generated during the main cutting period in the winter. Before forwarding, the residues are dried in the stand in the spring and early summer. The weight of the residue biomass is measured by scales mounted on forwarder grapples and then converted into volume by fixed conversion factors. The most important feature affecting the conversion factor is the moisture content of the biomass. The current conversion factors are based on long-term average values and they are fixed for seasons and geographical areas. Therefore, they do not take into account the micro-climatic and in-year and between year variability of climate and drying speed of the biomass. As displayed in (Fig. 1) cumulative precipitation amount and distribution between 1 April and 31 August can vary considerably between years. However, the same conversion factor is applied for areas as large as 300 km × 400 km. Furthermore, fixed conversion factors are insensitive to short-term effects, e.g. rainfall immediately before forwarding.
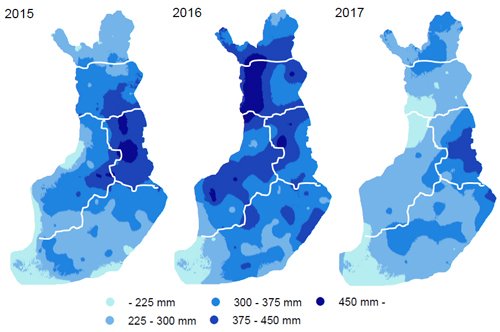
Fig. 1. Cumulative precipitation in Finland from 1 April to 31 August 2015–2017.
Meteorological data based models for estimating the drying of energy wood stored on the roadside have been employed earlier (Jahkonen et al. 2012; Routa et al. 2012; Routa et al. 2015a,b; Routa et al. 2016). The aim was to integrate these models into Enterprise Resource Planning (ERP) systems and help operators in their decision making and resource allocation. Contrarily, conversion factors for harvesting residues are used in legal transactions, such as paying stumpage fees for forest owners and transportation fees for contractors. Therefore, a higher level of precision is required. However, the straightforward approach, namely the sampling of residues during forwarding has been tested and found to be too laborious and expensive.
This study aimed to develop a weather based model for defining the conversion factor from mass to volume for harvesting residues. In the model, the moisture content of harvesting residue should respond to periods of high precipitation or drought, when residues are lying on the cutting area. The model will be built with the help of drying experiments and validated with data from the field.
2 Material and methods
Data collected at the Mekrijärvi Research Station of University of Eastern Finland (62°46´N, 30°59´E) forms the base for the developed models. The data was collected between 2013 and 2015 by employing customised platforms based on load cells (“continuous weighing approach”) and loaded with residues. The weight of each pile is continuously measured, recorded and can be monitored online. The initial moisture content of each pile was determined from samples (mainly spruce branches), which were taken from harvesting residues when the pile was loaded on the platform. The branches were chipped and samples were taken from chipped material for the determination of the moisture content by the oven-dry method. By translating the weight alteration into moisture content change, the actual moisture content was estimated (Routa et al. 2015a, 2016).
The mean annual precipitation in this area is 668 mm and mean annual temperature 2.1 °C. The storage area at the research station is an open area, next to a lake and its elevation is 155 m above sea level. The drying of the energy wood can easily be linked to weather phenomena because there is a well-equipped meteorological station at the Mekrijärvi Research Station. The meteorological station of Finnish Meteorological Institute (FMI) provided data on relative air humidity (%), air temperature (°C), wind speed (m s−1), wind direction (°), solar radiation (W m−2), rainfall (mm), air pressure (hPa), ground temperature (°C), rainfall intensity (mm h−1), visible distance (m), height of clouds (m) and snow depth (cm). A data logger collects all the meteorological data. Alternatively, the weather data can also be obtained from grid data. The FMI provides gridded weather data for all over Finland. This data set consists of weather observations (e.g. temperature, humidity, precipitation), which have been interpolated to a 10 × 10 km grid by the Kriging interpolation method (Venäläinen and Heikinheimo 2002).
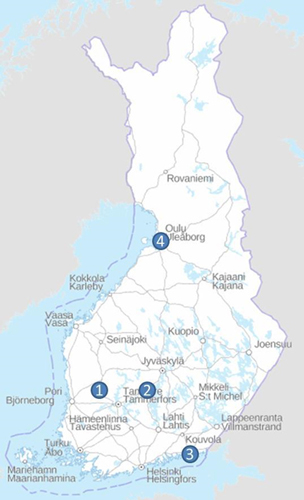
Fig. 2. Location of the validation data sampling points (1 = Hämeenkyrö, 2 = Kaipola, 3 = Kotka and 4 = Oulu).
The data for validation was collected exclusively for this study at Hämeenkyrö, Kaipola, Kotka and Oulu (Fig. 2). The harvesting areas were selected from the information systems of timber harvesting companies. They represent typical sites for residue harvesting (final cut of spruce (Picea abies (L.) Karst.)). The prerequisite was that at least a 100 cubic metre loose volume had to be chipped at the location. The harvesting areas (Table 1) in each location were divided into the following 3 classes:
Class 1: Timber harvested in the autumn or winter, stored over winter (5–10 months), and forwarded in the spring or early summer.
Class 2: Timber harvested in the spring or early summer, stored 1–4 months, and forwarded in the summer.
Class 3: Timber harvested in the summer, stored 0.5–2.5 months, and forwarded in the late summer or autumn.
| Table 1. Harvesting areas in each location classified by the harvesting and forwarding time. | |||||
| Class | Hämeenkyrö | Kaipola | Kotka | Oulu | Total |
| 1 | 6 | 4 | 5 | 3 | 18 |
| 2 | 5 | 4 | 5 | 0 | 14 |
| 3 | 6 | 6 | 4 | 1 | 17 |
| Total | 17 | 14 | 14 | 4 | 49 |
The moisture content for each harvesting area was determined by moisture content sampling of chipped residues. The exception was Kaipola, where the moisture content was measured by an X-ray measurement device. The lot was typically defined as one truck container of chips from each harvesting area. Sampling was carried out manually during the unloading of the containers. The number of samples, sized a minimum of three litres, was fifteen for harvesting areas in class 1 and ten each for the harvesting areas in classes 2 and 3. The samples were combined into one combined sample. From each combined sample, two laboratory samples, sized a minimum of three litres, were taken. The moisture content of the laboratory samples was determined by using the oven dry method.
The measurement uncertainty of the measured moisture contents was approximately 3.5% for the spring and summer harvested sites and approximately 4.5% for the autumn and winter harvested sites. The measurement uncertainties are based on the statistical analysis of a type A uncertainty evaluation. The estimates for standard deviations were determined using study material described Routa et al. (2016). The measurement uncertainty of the measured moisture content was determined as expanded measurement uncertainty using a coverage factor of 2. In the statistical concept, expanded measurement uncertainty means a level of confidence interval of approximately 95% (ISO/IEC GUIDE 99/2007, JCGM 100:2008).
Models were validated against field data. Models 1 and 2 used harvesting site parameters (harvesting and forwarding date) and meteorological parameters from the closest grid point offered by FMI. Model 3, the currently employed method, used fixed tables and harvesting and forwarding dates as input parameters. The moisture content changes estimated by the models were compared to the observed moisture content changes in the three different harvesting site classes. If the estimated moisture content did not deviate more than ±5% from the observed one, the estimation was considered successful.
3 Moisture content estimation models
Model 1
Model 1 is based on the data collected at Mekrijärvi Research Station in 2013–2015. The moisture content change was determined for periods of three hours, as the meteorological grid data was already available at this resolution. In addition, the observations were classified as follows:
Class A: Periods (3 h) when precipitation > 0 mm
Class B: Periods (3 h) between just after rainfall and until the moisture content before rainfall has been reached
Class C: Periods (3 h) before rain periods and not Class B
Class B constitutes the drying of the material surface, while Class C describes the drying of the inner parts of the material. This classification aims to depict the processes of moisture content change in harvesting residues. It is reasonable to assume that the changes in the inner moisture content are slow and drying requires more energy compared to the changes on the surface.
Model 1 estimates the moisture change for each three hour period. The actual moisture content calculation starts from the estimated initial moisture content (MC0) at the beginning of the storage period. The beginning of the storage period corresponds to the time of harvesting. The moisture content change for each three hour period is calculated based on the 10 km × 10 km gridded meteorological data. Potential evaporation [mm] and precipitation [mm] are the independent variables in the model.
As depicted in Figs. 3–5, the relationship between the moisture content change and potential evaporation or precipitation appears to be non-linear. LOESS models were chosen for this assessment, as they are very flexible and excellently take account of a large random variation of observations. However, non-linear models also follow the LOESS models fairly well.
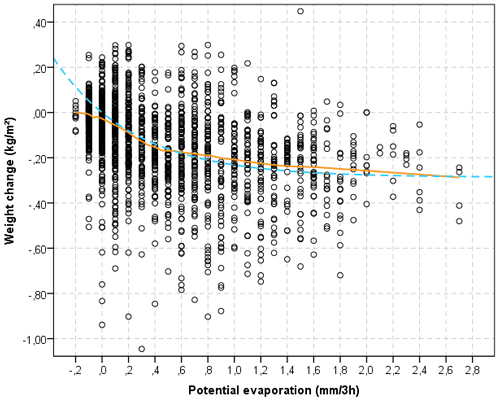
Fig. 3. Relation between the potential evaporation alteration and material weight alteration (Class B and C) (orange, continuous line = LOESS model; blue, dashed line = non-linear model).
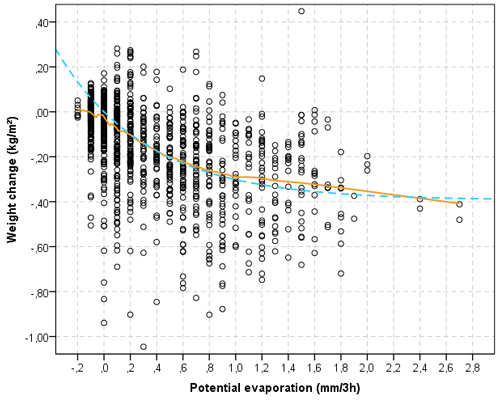
Fig. 4. Relation between the potential evaporation alteration and material weight alteration after rainfall periods (Class B) (orange, continuous line = LOESS model; blue, dashed line = non-linear model).
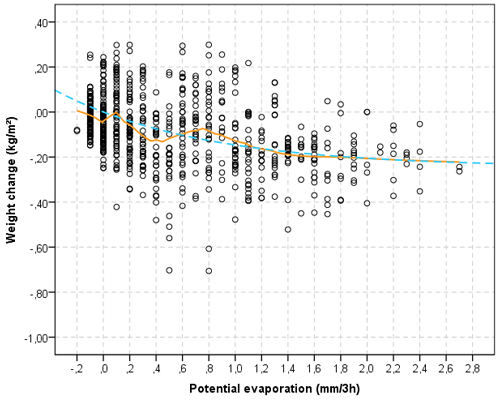
Fig. 5. Relation between the potential evaporation alteration and material weight alteration before rain periods (Class C) (orange, continuous line = LOESS model; blue, dashed line = non-linear model).
Evidently, actual evaporation must be less than the potential evaporation. As shown in Fig. 3, the actual evaporation appears to be not more than about half of the potential evaporation. The rate of actual evaporation increases until the potential evaporation has reached the level of approx. 1.5 mm. The drying progresses faster in periods just after rainfall (Class B) than in periods before rainfall (Class C) (Figs. 4 and 5).
Fig. 6 shows the absolute moisture content change in relation to the precipitation amount during three hour periods. It showed that the weight alteration was about half of the precipitation amount when rainfall was less than about 3 mm within three hours. Again, there is no linear relationship between the change in moisture content and precipitation amount, as the amount of surplus water run-off increases with the amount of rainfall.
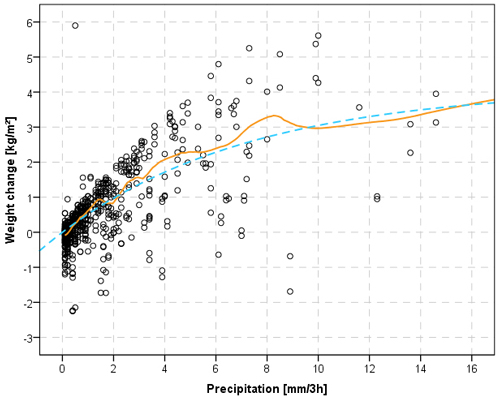
Fig. 6. Relation between the precipitation amount and material weight alteration (Class A) (orange, continuous line = LOESS model; blue, dashed line = non-linear model).
The non-linearity of moisture change in relation to both the precipitation amount and potential evaporation has been taken into account in model 1 by the determining factors PR and ER (Eqs. 3 and 5). The factors have been determined by an exponential function (Figs. 3 and 6). The same form of function is used in the operational fire danger rating method when estimating the moisture content change in the surface layer (Vajda et al. 2014).
The actual drying rate of harvesting residues subjected to the same meteorological conditions varies with respect to its moisture content. The lower the moisture content of wood, the more energy is needed to remove the same amount of water (e.g. Kärkkäinen 2007). This change of the drying rate in relation material moisture content has been taken into account by determining parameters a and b (Eqs. 2 and 4). In practice, the parameter a determines the lowest moisture content level accepted by model 1 (approx. 17%, estimated by Eq. 4). Similarly, the parameter b determines the highest moisture content level accepted by the model, (approx. 65%, estimated by Eq. 2), and comparable to the maximum theoretical moisture content when basic density of wood is 400 kg m–3.
![]()
where
MCdryi+1 = moisture content on dry basis [kg/kg] at time i+1
MCdryi = moisture content on dry basis [kg/kg] at time i
Si+1 = (1, 0) → snow conditions; 1 when no snow cover, 0when snow cover
![]()
![]()
where
Pi+1 is precipitation t(i+1) – t(i) [mm/3 h]
![]()
![]()
where
Ei+1 is evaporation during period t(i+1) – t(i) [mm/3 h]
Moisture content on dry basis (MCdry) can be converted to moisture content on wet basis by Eq. 6. The values for parameters a11…a22 and b11 …b22 are given in Table 2.
![]()
| Table 2. Parameters a11…a22 and b11 …b22 in Eqs. 2–5, Model 1. | ||||
| Eq. | b11 | b12 | b21 | b22 |
| 2 | 0.01 | 1.90 | ||
| 3 | 4.10 | –7.40 | ||
| Eq. | a11 | a12 | a21 | a22 |
| 4 | –0.04 | –0.20 | ||
| 5 | 0.30 | –0.70 | ||
For validation, the moisture content calculation was started from the moisture content of fresh harvesting residues. Moisture content at the beginning of the storage period is 0.90 (in dry basis, [kg/kg]), which is equivalent to a moisture content of 47.4% on a wet basis. This moisture content of fresh harvesting residues is based on the study material collected at Finnish Forest Research Institute in 2012 (Lindblad et al. 2013) and the moisture content level that is employed in the current method to determine for determining the green density factors for harvesting residues.
Model 2
Model 2 is based on the data from Mekrijärvi Research Station and has been described in detail in Routa et al. (2016).
![]()

where
MCwetm = moisture content [%] at the end of storage period (forwarding)
MCwet0 = moisture content [%] at the beginning of storage period (harvesting)
∆MCwet = moisture content change during storage period
Pi = rainfall amount [mm]
Ei = evaporation [mm]
m = sum index, forwarding → rain (Pi) and evaporation (Ei) sum during storage period, in cases when volumetric moisture content of surface layer, Wvol [m3 m–3] < 0.5
To use this model, the moisture content of the fresh material has to be determined. For that reason, the average moisture of fresh logging residues (spruce and pine), depending on the harvesting month, is shown in Table 3, which is formed from data from the literature and data from an unpublished study (Gislerud 1974; Kärkkäinen 1976; Nisula 1980; Nurmi 1999; Nurmi and Hillebrand 2001; Hillebrand and Nurmi 2001; Nurmi and Hillebrand 2007; Nurmi and Lehtimäki 2011; Lindblad et al. 2013; Routa 2018). The moisture content of the fresh logging residues changes with the season, climatic conditions and site fertility, and the fresh wood moisture content is typically higher during the winter period (Hakkila 1962; Hakkila et al. 1995; Andersson et al. 2002; Kärkkäinen 2007). The drying season starts in the spring when the snow has melted and the ground surface starts to dry (when the surface moisture content reaches a value below 0.5).
| Table 3. Moisture content of fresh logging residues depending on the harvesting month in Finland. | ||||||||||||
| Moisture content of fresh harvesting residues, monthly, % | ||||||||||||
| Jan | Feb | Mar | Apr | May | Jun | Jul | Aug | Sep | Oct | Nov | Dec | |
| Pine | 55 | 55 | 55 | 54 | 54 | 54 | 54 | 53 | 54 | 54 | 55 | 54 |
| Spruce | 52 | 52 | 51 | 51 | 50 | 50 | 50 | 50 | 51 | 51 | 51 | 52 |
Model 3
When employing the current method for determining the conversion factors, the harvesting residues are weighed during forwarding by the scales integrated in the forwarder’s grapples. During loading or unloading, each grapple load is weighed and cumulated by forwarder load and parcel. This weight is then converted to solid volume by green density factors documented in the regulations based on the Finnish timber measurement legislation. Separated by region, species and assortment as well as classified for five or six moisture content levels and four seasons, different fixed green density are used (Tables 4 and 5). Reading the table starts with the column of the harvesting date. As soon as the displayed number of storage days in the topmost weight class is reached, reading progresses to the next weight class. The respective green density factor is determined by the weight class that is reached on the date of the reading. Factors are divided into two large regions, containing several sub-regions (Fig. 7). Region one is formed by Southern Finland and Ostrobothnia, region two by Kainuu, Lapland and Northern Lapland. In the latter, the drying season starts at a later date and ends earlier and the drying progresses slower than in the southern region.
| Table 4. Green density factors for logging residues in Southern Finland and Ostrobothnia (Luonnonvarakeskuksen määräys 1/2017). | ||||||
| Weight class | Moisture content | Time period | Green density factor | |||
| % | 1/4–30/4 | 1/5–15/8 | 16/8–30/9 | 1/10–31/3 | kg m–3 | |
| 1 | > 50 | Non-seasoned or wet residues, with snow and ice | 950 | |||
| 2 | 45–50 | fresh, 20 days ↓ | fresh, 10 days ↓ | fresh, 20 days ↓ | fresh | 840 |
| 3 | 40–44 | ≥ 20 days | → 15 days ↓ | ≥ 20 days | ≥ 20 days | 770 |
| 4 | 35–39 | - | 20 days ↓ | 20 days ↑ | 20 days ↑ | 700 |
| 5 | 30–34 | - | 35 days ↓ | 20 days ↑ | - | 650 |
| 6 | < 30 | - | ≥ 80 days | 20 days ↑ | - | 600 |
| Table 5. Green density factors for logging residues in Kainuu, Lapland and Northern Lapland (Luonnonvarakeskuksen määräys 1/2017). | ||||||
| Weight class | Moisture content | Time period | Green density factor | |||
| % | 16/4–15/5 | 16/5–31/7 | 1/8–15/9 | 16/9–15/4 | kg m–3 | |
| 1 | > 50 | Non-seasoned or wet residues, with snow and ice | 950 | |||
| 2 | 45–50 | fresh, 20 days ↓ | fresh, 15 days ↓ | fresh, 20 days ↓ | fresh | 840 |
| 3 | 40–44 | ≥ 20 days | → 20 days ↓ | ≥ 20 days | ≥ 20 days | 770 |
| 4 | 35–39 | - | 30 days ↓ | 20 days ↑ | 20 days ↑ | 700 |
| 5 | < 35 | - | ≥ 65 days | 20 days ↑ | - | 650 |
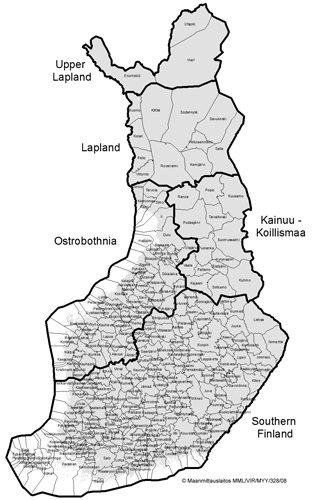
Fig. 7. Geographical region allocation of green density factors (Luonnonvarakeskuksen määräys 1/2017).
The green density factors (Tables 4 and 5) are based on a meteorological data based model and long-term meteorological observations of geographic regions. The model and green density tables have been developed by the Finnish Forest Research Institute (Lindblad et al. 2013). The underlying modelling data has also been described in Routa et al. 2016.
![]()
where
MCwetm = moisture content in wet basis [%] at the end of storage period
Ei = evaporation [mm]
Pi = precipitation [mm]
4 Results
Fig. 8 shows the difference in the deviation of the estimated moisture content from the observation. Negative values indicate that the model underestimated the observed moisture content. The median difference indicates the measurement trueness, which is inversely related to the systematic measurement errors of the measurement results. Fig. 9 shows that there is no remarkable measurement bias (systematic error) between models 1 and 2. The median difference between model 3 and measured moisture was about minus three percentage units, while the median differences to models 1 and 2 were close to zero. The median differences differed notably from zero when classified by harvesting and forwarding time (Table 6). In the late summer and autumn (Class 3), the median differences were clearly below zero. Contrarily, in early summer (Class 2), the moisture contents determined by the models were too high. It can be assumed that the measurement trueness strongly depends on the climatic conditions of the storage period.
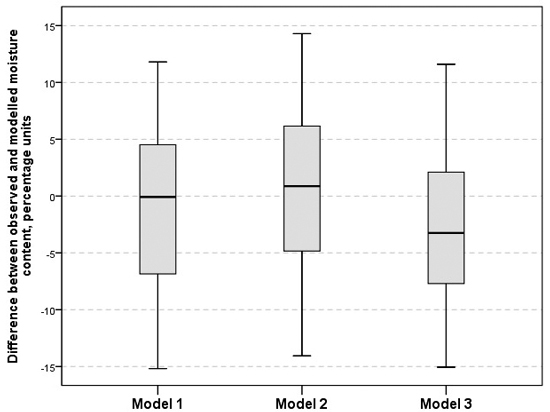
Fig. 8. Difference between observed and modelled moisture content for Models 1–3.
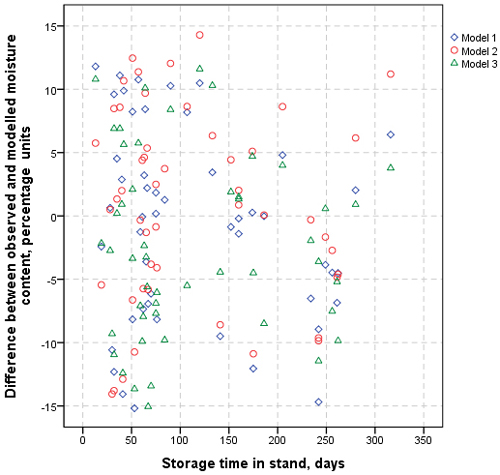
Fig. 9. Difference between the observed and modelled moisture for individual harvesting sites in relation to the storage time.
| Table 6. Accuracy of the models by harvesting sites class. Number and percentage of the sites where the estimated moisture content was within the targeted ±5% accuracy range. | ||||
| Harvesting Class | Number of Sites | Model 1 | Model 2 | Model 3 |
| 1 | 18 | 11 (61%) | 9 (50%) | 12 (67%) |
| 2 | 14 | 8 (57%) | 7 (50%) | 4 (29%) |
| 3 | 17 | 4 (24%) | 5 (29%) | 4 (24%) |
| Total | 49 | 23 (47%) | 21 (43%) | 20 (41%) |
The range of deviations and the individual deviations of what was modelled from the observed moisture content indicates the estimation precision. Both the individual deviation and the range were large (later within approx. ±15%) (Figs. 8–9). Table 6 shows the number and relative share of harvesting sites where the estimated and measured moisture content differed by less than five percentage points. Models 1 and 2 were slightly more accurate than the current method during the whole period. In the late summer and autumn (Class 3), only a quarter of harvesting sites were within the five per cent requirement.
The storage periods ranged from 13 to 316 days. Fig. 9 shows the difference between the observed and modelled moisture content for individual harvesting sites in relation to the storage days. The measurement bias does not change in relation to the storage period, while the range of individual deviations decreases with the increasing length of storage.
5 Discussion
The models were evaluated by the data which was not used for the construction of the models collected during one summer (2016). This may explain some of the systematic errors in the estimate by the fixed tables (average of model 3, Fig. 8.). Summer 2016 did not represent an average summer in all of the areas where data was collected. Especially in the Oulu area, the precipitation amount was above the long-term averages and July was warmer than on average. Moreover, in Kotka, the precipitation in July and August was above average. All the factors affecting the moisture content change are not yet known because the variation of the estimated from the measured moisture content remained relatively large for all the models.
Fig. 9 shows the average deviation of the measured moisture content from models 1, 2 and 3 to be close to zero. Contrarily, the deviation of the models from the reference is rather large. A detailed model comparison shows that there are apparent differences between harvesting classes (Table 6). The models worked the best for harvesting Class 1 and the worst for 3. Weather based model 1 provided the best estimate for the moisture content of harvesting residue piles drying on the harvesting site before forwarding.
The initial moisture content affects the predicted moisture content in different ways. Model 1 used a fixed start moisture content of 47% in every season. Model 2 uses the initial moisture content values from Table 3, where the moisture content varies depending of the harvesting month. The initial moisture content has a great significance in model 2, as all changes in the moisture are calculated as a change of the initial moisture. Thus, any error in the initial moisture affects the estimation throughout the whole storage period. The importance of the initial moisture content in model 1 decreases as the storage time increases. After about two weeks of storage time, the initial moisture content is no longer relevant in model 1. Model 3 utilises the average seasonal meteorological data and thus may lead to systematic errors if the actual weather data differs from the average. It can be assumed that the actual meteorological data based models provide more reliable estimates, especially in cases of exceptional weather periods.
There are several further potential error sources related to models. First of all, there are remarkable moisture content alterations even within a single tree. The moisture content at the harvesting sites was determined by moisture content sampling before and after the experiments, where the representativeness of samples affects the reliability of the reference values. The size of the individual residue piles might be one of the key factors in the drying rate, as the ratio of the total surface area to the volume decreases as the pile volume increases. The drying rate increases when the ratio of the total surface area to volume is large and vice versa (Gautam et al. 2012). However, the effect of precipitation is not unambiguous. The lower the precipitation is per unit of volume, the bigger or higher the residue piles are. On the other hand, during heavy rainfall, lots of water remains inside large piles, while it drains directly to the ground in case of small piles. However, the dimensions of the residue piles were not taken into account in the models. While this does not prevent the use of the model, accuracy would increase if the effect of the pile dimension would be included.
In future studies, more emphasise has to be placed on reference value reliability. More samples must be taken and analysed as a part of normal operations to improve the functionality of the models. The accuracy in the moisture content measurement affect the accuracy of the study result, depending on what kind of samples has been taken and how well the moisture samples represent the whole pile (Routa et al. 2018). In addition, the effect of pile dimensions needs to be investigated, as it could provide extra information about the optimal storage pile dimensions. Future applications should focus on meteorological data from smaller geographical grids to get a better grip on local climate. However, any such application can be considered more accurate than fixed tables. What’s more, several moisture content estimation models could be combined to reduce estimation uncertainties.
Acknowledgements
Financial contribution and support of Metsäteho ltd., Stora Enso ltd, UPM-Kymmene ltd., Metsä-Group, Tekes, MTK, Koneyrittäjät, The Bioenergy Association of Finland and Ministry of Agriculture and Forestry is gratefully acknowledged.
References
Andersson G., Asikainen A., Björheden R., Hall P.W., Hudson J.B., Jirjis R., Mead D.J., Nurmi J., Weetman G.F. (2002). Production of forest energy. In: Richardson J., Björheden R., Hakkila P., ALowe A.T., Smith C.T. (eds.). Bioenergy from sustainable forestry, guoding principles and practices. Kluwer Academic Publishers. p. 49–123. https://doi.org/10.1007/0-306-47519-7_3.
Gautam S., Pulkki R., Shahi C., Leitch M. (2012) Fuel quality changes in full tree logging residue during storage in roadside slash piles in Northwestern Ontario. Biomass and Bioenergy 42: 43–50. https://doi.org/10.1016/j.biombioe.2012.03.015.
Gislerud O. (1974). Helttreutnyttelse. II. Biomasse og biomasseegenskaper hos tynnigsvirke av gran, furu, bjork og or. [Biomass characteristics of thinnings of spruce, pine, birch and alder]. Norsk Institutt for skogforskning, Rapport 6. 59 p. [In Norwegian].
Hakkila P. (1962). Polttohakepuun kuivuminen metsässä. Summary: Forest seasoning of wood intended for fuel chips. Communicationes Instituti Forestalis Fenniae 54(4). 82 p. [In Finnish]. http://urn.fi/URN:NBN:fi-metla-201207171086.
Hakkila P., Kalaja H., Saranpää P. (1995). Etelä-Suomen ensiharvennusmänniköt kuitu- ja energialähteenä. [First thinning stands of Scots pine in Southern Finland as a source of wood fiber and energy]. Finnish Forest Research Institute, Research Papers 582. 99 p. [In Finnish]. http://urn.fi/URN:ISBN:951-40-1489-8.
Hillebrand K., Nurmi J. (2001). Hakkuutähteen laadunhallinta. [Quality management of logging residues]. VTT Energian raportteja 2/2001. 51 p. [In Finnish].
ISO/IEC GUIDE 99/2007. International vocabulary of metrology. Basics and general concept and associated terms (VIM).
Jahkonen M., Lindblad J., Sirkiä S., Lauren A. (2012). Energiapuun kosteuden ennustaminen. [Predicting the moisture of energy wood]. Working Reports of Finnish Forest Research Institute 241. 35 p. [In Finnish]. http://urn.fi/URN:ISBN:978-951-40-2379-8.
JCGM 100:2008. Evaluation of measurement data – guide to the experession of uncertainty in measurement. GUM 1995 with minor corrections. BIPM.
Kärkkäinen M. (1976). Puun ja kuorentiheys ja kosteus sekä kuoren osuus koivun, kuusen ja männyn oksissa. [Density and moisture content of wood and bark, and bark percentage in the branches of birch, Norway spruce and Scots pine]. Silva Fennica 10(3): 212–236. [In Finnish]. https://doi.org/10.14214/sf.a14794.
Kärkkäinen M. (2007). Puun rakenne ja ominaisuudet. [Wood structure and properties]. Metsäkustannus Oy. 468 p. [In Finnish]. ISBN 9789525694109.
Lindblad J., Jahkonen M., Sirkiä S. (2013). Latvusmassan tuoretiheyslukujen uudistaminen. [Renewal of conversion factors of logging residues]. Report for the committee of energy wood measurement. 16 p. [In Finnish].
Luonnonvarakeskuksen määräys puutavaran mittaukseen liittyvistä yleisistä muuntoluvuista annetun Metsäntutkimuslaitoksen määräyksen liitteen muuttamisesta. [Natural Resources Institute Finland’s regulation on amending the appendix of the regulation related to the currently used conversion factors of timber measurements issued by the Finnish Forest Research Institute.] Määräys nro 1/2017. 21.12.2017. Viranomaisten määräyskokoelmat. [Regulation number 1/2017. On 21 December 2017. Authority regulations]. [In Finnish].
Nisula P. (1980). Näkökohtia polttohakkeen kuivaamisesta. [Aspects of the drying of fuel chips]. Folia Forestalia 440. 14 p. [In Finnish]. http://urn.fi/URN:ISBN:951-40-0458-2.
Nurmi J. (1999). The storage of logging residue for fuel. Biomass and Bioenergy 17(1): 41–47. https://doi.org/10.1016/S0961-9534(99)00023-9.
Nurmi J., Hillebrand K. (2001). Storage alternatives affect fuelwood properties of Norway spruce logging residues. New Zealand Journal of Forestry Science 31(3): 289–297.
Nurmi J., Hillebrand K. (2007). The characteristics of whole-tree fuel stocks from silvicultural cleanings and thinnings. Biomass and Bioenergy 31(6): 381–392. https://doi.org/10.1016/j.biombioe.2007.01.010.
Nurmi J., Lehtimäki J. (2011). Debarking and drying of downy birch (Betula pubescens) and Scots pine (Pinus sylvestris) fuelwood in conjunction with multitree harvesting. Biomass and Bioenergy 35(8): 3376–3382. https://doi.org/10.1016/j.biombioe.2010.08.065.
Official Statistics of Finland (2016). Wood in energy generation. Natural Resources Institute Finland. https://www.stat.fi/til/ppaet/index_en.html. [Cited 30 Aug 2017].
Routa J., Kolström M., Ruotsalainen J., Sikanen L. (2012). Forecasting moisture changes of energy wood as a part of logistic management. In: Special issue. Abstracts for international conferences organized by LSFRI Silava in cooperation with SNS and IUFRO. Mezzinatne 25: 33–35.
Routa J., Kolström M., Ruotsalainen J., Sikanen L. (2015a). Precision measurement of forest harvesting residue moisture change and dry matter losses by constant weight monitoring. International Journal of Forest Engineering 26(1): 71–83. https://doi.org/10.1080/14942119.2015.1012900.
Routa J., Kolström M., Ruotsalainen J., Sikanen L. (2015b). Validation of prediction models for estimating the moisture content of small diameter stem wood. Croatian Journal of Forest Engineering 36(2): 283–291.
Routa J., Kolström M., Ruotsalainen J., Sikanen L. (2016). Validation of prediction models for estimating the moisture content of logging residues during storage. Biomass and bioenergy 94: 85–93. https://doi.org/10.1016/j.biombioe.2016.08.019.
Routa J., Kolström M., Sikanen L. (2018). Dry matter losses and their economic significance in forest energy procurement. International Journal of Forest Engineering 29(1): 53–62. https://doi.org/10.1080/14942119.2018.1421332.
Vajda A., Venäläinen A., Suomi I., Junila P., Mäkelä H.M. (2014). Assessment of forest fire danger in a boreal forest environment: description and evaluation of the operational system applied in Finland. Meteorological Applications 21(4): 879–887. https://doi.org/10.1002/met.1425.
Venäläinen A., Heikinheimo M. (2002). Meteorological data for agricultural applications. Physics and Chemistry of the Earth, Parts A/B/C 27(23–24): 1045–1050. https://doi.org/10.1016/S1474-7065(02)00140-7.
Total of 26 references.
Send to email
