Lars Lundqvist  ,
Susanne Spreer,
Christer Karlsson
,
Susanne Spreer,
Christer Karlsson
Volume production in different silvicultural systems for 85 years in a mixed Picea abies–Pinus sylvestris forest in central Sweden
Lundqvist L., Spreer S., Karlsson C. (2013). Volume production in different silvicultural systems for 85 years in a mixed Picea abies–Pinus sylvestris forest in central Sweden. Silva Fennica vol. 47 no. 1 article id 897. https://doi.org/10.14214/sf.897
Abstract
A long-term comparison of different silvicultural systems was established in 1923 in central Sweden, in an uneven-aged mixed Norway spruce–Scots pine forest (Picea abies (L.) Karst. – Pinus sylvestris L.) with about 85% spruce and 15% pine. The five treatments consisted of two examples of even-aged management 1) clear-cutting followed by planting, and 2) seed tree regeneration, one uneven-aged management 3) selection system, one exploiting treatment 4) diameter limit cut, and 5) one untreated control plot. Each treatment plot was 1 ha, 100 m × 100 m. The plots were measured and managed at irregular intervals, ranging from 7 to 15 years. In 2007–2008 the even-aged treatments and the diameter limit cut were repeated and a new rotation started. Mean annual volume increment during the whole observation period differed widely between the treatments, partly because of differences in species composition over time, with treatment clear-cutting followed by planting at the top, and the control at the bottom. Treatment selection system gave only about 60% of planting, but this was probably largely an effect of too small growing stock during the first roughly 50 years. When the growing stock was increased, periodic annual volume increment increased to about 80% of the mean annual volume increment in the even-aged, planted plot.
Keywords
plantation;
growth and yield;
clear-cutting;
silvicultural systems;
seed trees;
selection system;
single-tree selection;
diameter limit harvest
-
Lundqvist,
Deparment of Forest Ecology and Management, Swedish University of Agricultural Sciences, SE-901 83 Umeå, Sweden
E-mail
lars.lundqvist@slu.se
- Spreer, Sveaskog Förvaltnings AB, Ljusdal, Sweden E-mail susanne.spreer@sveaskog.se
- Karlsson, Field Research Unit, Swedish University of Agricultural Sciences, Siljansfors, Sweden E-mail christer.karlsson@slu.se
Received 22 March 2012 Accepted 12 February 2013 Published 11 June 2013
Views 80557
Available at https://doi.org/10.14214/sf.897 | Download PDF

1 Introduction
The level of growth and yield to expect from different silvicultural systems has been debated by foresters and scientists for as long as there has been organized forestry and forest research. The scientific literature is full of growth and yield studies, but there are quite few in which even-aged and uneven-aged forestry have been compared directly with each other. There are basically two ways to do this: Compare the systems side-by-side in long term field trials, simulate growth and yield of different stand types using growth models, and a combination of the two.
Hladík (1975) compared average stand and growth data from 191 plots in 25–120 yr old even-aged mixed fir-beech stands in Czechoslovakia, with model data for comparable selection forests in the same region and in other countries, and concluded that there was no marked difference in total production between the two systems. Shavnin (1979) compared Picea abies stands of different structure and concluded that total yield was higher for the uneven-aged stands. Hasse and Ek (1981) made simulations for northern hardwoods and concluded that uneven-aged management can be significantly more productive than even-aged management for merchantable volume, that total yield of stemwood was similar, but that even-aged stands had higher basal area growth. They also concluded that uneven-aged stands are more sensitive to management. Lähde et al. (2002) reported data from field studies in Picea abies stands, and concluded that thinning from above in uneven-aged stands gave higher periodic increment than thinning from below. However, the field trials had only run for 11 years and they did not really compare stands managed with two different systems from the start. Elfving (2006) simulated Picea abies stands of different structure and concluded that uneven-aged stands could yield about 85 per cent of the long term yield of even-aged stands. O’Hara and Nagel (2006) formulated a theoretical framework, and compared the theories with different studies on Ponderosa pine. They concluded that multi-aged Pinus ponderosa stands should have higher long-term yield than even-aged stands.
In the early 1920s, a number of experimental forests were established in Sweden, to celebrate the newly established Swedish Institute of Forest Research. One of these forests was located at Siljansfors, 18 km SW Mora in west-central Sweden. A number of long-term field trials were established the same year. One of them was a long-term comparison of different silvicultural systems. The field trial was re-measured and managed repeatedly over the years, and in 2006–2008 it was decided to make a final measurement and then to restart the treatments. In this article we report changes in composition and stand structure and development of the standing volume, and compare growth and yield during the first rotation, i.e. the first 83–85 years.
2 Material and methods
The experimental plots were established in 1923 at the top of Leksberget, within the Siljansfors experimental forest, 18 km SW Mora, in Dalecarlia in west central Sweden (60°54′N, 14°23′E, altitude 395–410 m a.s.l.). The forest was an uneven-aged mixed Norway spruce – Scots pine forest (Picea abies (L.) Karst. – Pinus sylvestris L.), with about 85% spruce and 15% pine. In 1923 the forest was considered to be virtually untouched by harvests. The largest spruces were estimated to be 250–300 years old. Standing volume within the individual plots varied between 174 and 204 m3 ha–1 (Table 1). The climate in the area is more continental than maritime, i.e. summers are warmer and winters colder than the average values for Sweden around these latitudes. Mean annual temperature is +3° C, annual temperature sum is 1050 degree-days, and mean annual precipitation is 674 mm. The soil is a mesic till. Ground vegetation was dominated by Vaccinium myrtillus and mosses like Pleurozium schreberi and Hylocomium splendens. Dominant height at 100 years was estimated from site characteristics to 22 m for both spruce and pine, which corresponds to about 5.1–5.3 m3 ha–1 year–1 (Hägglund and Lundmark 1981).
| Table 1. Stand characteristics at plot establishment. | |||
| Treatment | Standing volume a) (m3 ha–1) | Stem number a) (stems ha–1) | Basal area a) (m2 ha–1) |
| 1 Clear-cutting and planting | 202 | 1162 | 27.0 |
| 2 Seed tree regeneration | 204 | 1100 | 26.6 |
| 3 Selection system | 180 | 1526 | 25.8 |
| 4 Diameter limit harvest | 200 | 784 | 22.9 b) |
| 5 Control | 174 | 1815 | 25.1 |
| a) Only trees with dbh ≥ 4.5 cm included b) Only trees with dbh ≥ 10 cm included | |||
The five treatments consisted of two examples of even-aged management 1) clear-cutting followed by planting, and 2) seed tree regeneration, one uneven-aged management 3) selection system, one exploiting treatment 4) diameter limit cut, and 5) one untreated control plot. Each treatment plot was 1 ha, 100 m × 100 m (Fig. 1).
- Clear-cutting and planting (abbreviated Planting): Clear-cutting in 1923. Standing volume before harvest was 202 m3 ha–1. The plot was split in 4 square sub-plots. In 1925, three sub-plots were planted with Pinus sylvestris and one with Picea abies. No scarification was done before planting. Pre-commercial thinning in 1950. Thinnings performed in 1956, 1965 and 1975. Advance regeneration cleared in 1965. Final measurement in 2008, before clearcutting the stand.
- Seed tree regeneration (abbreviated Seed trees): The plot was clear cut in 1923, except for 49 pines left as seed trees. Standing volume before harvest was 204 m3 ha–1. Soil scarification was done with a small plow and advance regeneration was cleared. Seed trees gradually removed in 1934, 1942 and 1949. Pre-commercial thinning in 1949. Clearing of advance regeneration in 1956. Thinnings performed in 1956 and 1975. Final measurement in 2008, before harvesting the stand.
- Selection system (abbreviated Selection): The plot was treated with the first single-tree selection in 1923. Standing volume before harvest was 180 m3 ha–1. Additional single-tree selection harvests performed in 1931, 1939, 1949, 1956, 1965, 1975, 1990, and final measurement before the 2006 harvest. Before 1975, large proportions of the small and medium size trees were removed at the harvests, but since 1975 harvests have focused more on the larger third of the trees (Fig. 2).
- Diameter limit harvest (abbreviated Diameter limit): In 1923, all trees with dbh 10 cm or larger were harvested, except ten large pines. Standing volume before harvest was 200 m3 ha–1. In 1934 and 1949 some trees with damage or of low quality were removed. In 1956 the large pines were harvested. Final measurement in 2007, before repeating the diameter limit harvest.
- Control: Standing volume in 1923 was 174 m3 ha–1. The plot was re-measured in 1923, 1931, 1939, 1949, 1956, 1970, 1975, 1985, and in 2007.
Fig. 1. Map over the experimental area. Equidistance 5 m.
On plots Selection and Control, all trees higher than 1.3 m were permanently numbered (numbers painted on the stems) and diameter was measured in two perpendicular directions at a marked point at breast height (1.3 m), i.e. dbh, at plot establishment. Species and special observations, like damage or double stems, were noted. Height and height to living crown was measured on sample trees, and also bark thickness on pine sample trees. On following inventories all numbered trees were re-measured, and noted as living, dead or harvested. Ingrowth, i.e. trees that had grown up past 1.3 m, were measured and numbered. On the other three plots only the trees harvested were recorded in 1923, except for pine seed trees left on plots Seed trees and Diameter limit. In 1956 all five plots were inventoried in the same way as the Selection and Control plots, with permanently numbered trees.
Fig. 2. Percentage of trees harvested in treatment Selection, in three relative diameter classes at each cutting, representing the lower (open), middle (hatched) and upper (filled) third of the dbh range 8.5 cm – current maximum dbh.
In 1965 the inventory procedures were changed on all plots, such that the individual identification of all trees was abandoned. All plots but the control were split in four sub-quadrates and trees with dbh > 4.5 cm were callipered and counted in 2-cm dbh classes within each sub-quadrate. From 1985 and onward all trees with dbh > 0.5 cm were counted.
During the winter 1988–1989 a small tornado hit the area, and caused severe damage on two sub-quadrates within treatments Planting, and Seed trees, and also within the Control plot. The damaged sub-quadrates in treatments Planting and Seed trees were excluded from the analyses from 1965 and onward.
Stem volume was calculated for all sample trees using Näslund’s (1940) volume equation using dbh, height and height to living crown, and for pine also bark thickness. Standing volume was then calculated for each 2 cm dbh class as:
vi = ni * vp * da / ds
where vi is standing volume in dbh class i, n is number of trees in the dbh class. vp is sample tree stem volume, and d is mean dbh of all trees (a) and of the sample trees (s) in the dbh class. When inventory procedures were changed in 1965, da was interpreted as the class midpoint of each 2-cm dbh class.
On plot Diameter limit the small trees that remained after harvest, i.e. all trees with dbh less than 10 cm, were not measured, resulting in an under-estimation of standing volume in 1923 and corresponding over-estimation of volume increment onward. To compensate for this, the stem number, basal area and volume of the remaining small trees was assumed to be equal to the volume for the same dbh classes on plot Selection.
The yield during the observation period was calculated for each plot as the difference between the total standing volume at each inventory minus the standing volume after the first treatment, plus the volume lost through harvest or mortality during the period. Mean annual increment from time of establishment to time of each inventory was calculated as the yield during this time period divided by the length of the time period. Periodic annual increment between inventories was calculated correspondingly, but for each inventory interval.
In the early field documents, trees lost through self thinning were sometimes noted as harvested, if the dead trees were salvaged. Therefore, the data on mean stem volume of trees harvested in the different treatments also include dead trees for some of the plots.
Stand records for each treatment are summarized in Appendix 1.
3 Results
Although pine seed trees were left and soil scarification performed, Seed trees ended up with about 60% Norway spruce, whereas Planting had about 90% Scots pine throughout the rotation. On the other three plots the proportion of Norway spruce increased so that these plots were totally dominated by Norway spruce at the end of the observation period.
Before treatment all plots had inversely J-shaped diameter distributions, and plot Selection maintained this structure during the whole observation period (Fig. 3).
Fig. 3. Diameter distribution for the treatment Selection before (dotted line) and after (dashed line) the initial harvest in 1923, and before harvest in 2006 (solid line).
For both treatment Planting, and treatment Seed trees, standing volume followed the expected development over time (Fig. 4). Treatment Selection had a large reduction of the standing volume at the first two harvests, and then remained around 50–70 m3 ha–1 until the early 1980s, where after the standing volume was allowed to increase up to about the same level as it had before the first harvest. The treatment Diameter limit followed the same pattern as Seed trees, but ended up at a lower final volume. The standing volume of the Control slowly increased during most of the observation period and the natural mortality was low, except at the inventory in 2007. At the last inventory the standing volume had returned to about the same level as when the plot was established. The development of each treatment is presented in more detail in Appendix 1.
Fig. 4. Development of standing volume during the period 1923 to 2008 for all treatments. The dotted line for the control shows volume including dead trees. For plots Planting, Seed trees, and Diameter limit, only harvested trees were recorded during the first decades. After the initial harvest, standing volume was not recorded until 1956.
Mean annual increment (MAI) during the observation period differed widely between the treatments, with treatment Planting at the top, and the Control at the bottom (Fig. 5). Treatment Selection only gave about 60% of Planting. Note that the periodic annual increment (PAI), between harvests and(or) measurements, was still above MAI for treatment Planting, but had dropped to the MAI level for treatment Seed trees, indicating that the difference between planting and natural regeneration would have increased even more if the experiment had been followed for another decade or so (Fig. 5). For treatment Selection, MAI increased throughout the period, and PAI was well above the MAI level most of the time. For treatment Diameter limit, PAI was still slightly higher than MAI when the final inventory was performed. The Control had a slowly increasing growth level during the first roughly 60 years, and PAI then markedly dropped to about the same level as when the plot was established. MAI increased slowly during the observation period, but was only about half of the level of treatment Planting.
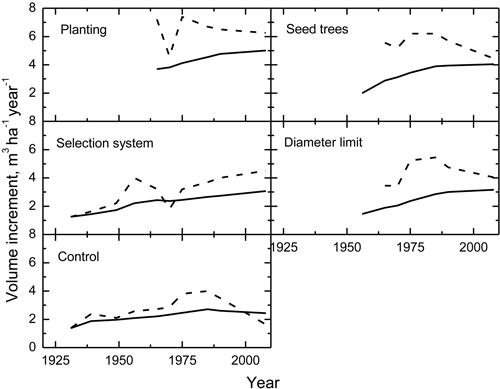
Fig. 5. Periodic (PAI, dashed line) and mean (MAI, solid line) annual volume increment for all treatments from 1923 until the final measurement in 2006–2008 (see Material and methods for details). For plots Planting, Seed trees, and Diameter limit, volume increment could not be calculated until after 1956, because only harvested trees were recorded during the first decades and not the standing volume.
Mean stem volume of trees harvested was highest for Seed trees, but there were only small differences between treatments (Table 2).
| Table 2. Mean volume of trees harvested and lost through self thinning. | |
| Treatment | Stem volume, m3 tree–1 |
| 1 Clear-cutting and planting | 0.17 |
| 2 Seed tree regeneration | 0.20 |
| 3 Selection system | 0.17 |
| 4 Diameter limit harvest | 0.18 |
| 5 Control | 0.13 |
| a) In treatments 1–4 most self-thinned trees were extracted and treated as trees harvested, whereas treatment 5 only has self-thinning. | |
4 Discussion
Comparing silvicultural systems is difficult. Simulations require models that are equally well adapted to handle even-aged and uneven-aged forests. Field trials require forest stands with an acceptable stand structure, and the field plots should be monitored for a long time. During the observation period management objectives and guide lines may change, mistakes can be made, unexpected events may occur, etc. The silvicultural systems furthermore have different time frames, i.e. the length of a complete cycle differs between systems, and both the length of the cycle and the total yield are affected by management.
Although there are problems connected to both simulations and field trials, attempts to compare the methods should be made, keeping the limitations and weaknesses in mind when evaluating and interpreting the results.
The site of the field trial in this study was not an ideal site. Treatment 4 was located at the top of the hill, treatment 3 and 5 in the upper part of the slope, while 1 and 2 were situated further down the slope (Fig. 1). As a result there could be differences in site productivity between the plots, and this may have affected the results. The reason for choosing the site back in the 1920s was probably that this was one of the few sites available with an uneven-aged forest large enough to give room for several treatments. Finding good stands is always a problem when establishing field trials, and especially when looking for well managed, well structured uneven-aged stands in Sweden. The field trial evaluated in this study was unique for Swedish conditions, and is still the only of its kind.
At the time of plot establishment it was thought that large plots would be an advantage, as it would reduce the risk of the results being affected by e.g. variations in site characteristics. Therefore 1 ha plots were chosen. Today we know that it probably would have been better from a statistical point of view if the area had been split in several blocks, with smaller plots per treatment within blocks. However, when the field trial was established in 1923 there was very limited knowledge about how to design field trials from a statistical viewpoint. The first of R. A. Fisher’s publications on statistical methods and experimental design, which would later revolutionize forest research, was not published until 1925 (Fisher 1925).
The change in inventory procedures in 1965 resulted in difficulties comparing the data from 1965 and later with the earlier inventories, because it was not documented which sub-quadrate each tree belonged to. As a result the damaged sub-plots, which were excluded from 1965 and onward, were included in the earlier data. The exact effects of this on the results cannot be established, but we do not think it affected the relations between the different treatments.
A comparison of expected growth levels for pine and spruce, based on estimated site productivity, indicate that long-term MAI should be slightly higher for spruce than for pine (Hägglund and Lundmark 1981). However, the observed data indicated that the spruce grew less than the pine. As mentioned, treatment Planting was planted with 75 per cent pine and 25 per cent spruce. Exactly how this mixture was done, i.e. which part of the plot that was planted with spruce, could not be established, so it was not possible to exclude the spruce from the yield comparisons. With a pure Scots pine stand, MAI could have been even higher, accentuating the difference in MAI between Planting, and the other treatments.
In treatment Planting no soil scarification was done, so the seedlings were planted directly in the ground vegetation, which caused mortality among the planted seedlings, and probably reduced their early growth. Today soil scarification is a standard procedure on this kind of site (Hallsby 2009), so MAI can be expected to be higher for the next rotation.
In treatment Seed trees, the number of seed trees was low, and the method and timing of scarification different compared to what is recommended today (Karlsson 2000; Karlsson and Örlander 2000). The regeneration was damaged by browsing, and the seed trees were left for over 30 years, thereby suppressing the regeneration for a long time. Combined with the extensive regeneration of Norway spruce, this resulted in a spruce dominated stand and thus lower MAI than if the stand had been pine dominated. Using today’s knowledge about natural regeneration, it should be possible to attain a pine dominated stand for the next rotation.
In treatment Selection, there was no predefined plan for how harvests should be performed. Standing volume was kept low because this was expected to promote regeneration, and abundant regeneration was seen as a major goal in itself. The small standing volume left after harvest during the first roughly 40 years, caused a substantial reduction in PAI. Previous studies (e.g. Lundqvist et al. 2007) indicate a rather strong dependence of PAI on standing volume for selection system as well as for even-aged stands (e.g. Nilsson et al. 2010), so the large difference in yield between the even-aged treatments (Planting and Seed trees) and Selection, was probably to a large degree an effect of the initial large reduction of the growing stock for treatment 3. When the growing stock was increased, after 1975, PAI increased as well. Keeping the standing volume at about 200 m3 ha–1 should insure that PAI can be maintained as high as 4.5 m3 ha–1 year–1, i.e. only about 10–15% below the result for the Planting. This is in accordance with Elfving’s (2006) simulations. Previous studies have shown that ingrowth can be maintained at a sufficiently high level in stands with standing volume around 200 m3 ha–1 (e.g. Lundqvist 1993)
Kuuluvainen and Aakala (2011) suggested that there are four major types of forest stand dynamics: stand-replacing, cohort, patch and and gap, where the spatial scale of the smallest type (gaps) would be less than 200 m2. For Norway spruce gaps and patches would be the most common type of stand dynamics. The Control in this study had remained more or less the same throughout the observation period, with a small increase in standing volume followed by an equal reduction towards the end. Single trees had died but there were no obvious gaps or patches in the stand where the old stand was replaced by regeneration, indicating that the stand dynamics were characterized by what is sometimes called “internal stand dynamics” (e.g. Hörnberg et al. 2009), i.e. individual trees die but there is no obvious connection between the death of trees and the emergence of regeneration.
Development of PAI and MAI in Diameter limit, mostly resembled the treatment Seed trees, but at a lower level. Because the stand was uneven-aged before the first harvest, one could have expected stand development to resemble treatment Selection, but harvesting all large trees apparently resulted in a stand that behaved more like an irregular single-storied stand with low stand density. The large difference in MAI between Diameter limit and Planting, was not unexpected. Analyses of stand development after heavy partial cuttings has shown that PAI remains at a low level for several decades (Lundqvist 2004).
Although the Control plot stood in the way for the tornado that passed the area in 1988, the total loss of stem wood was rather low. Also treatments Selection and Diameter limit were almost unscathed. It thus appeared as if the plots with uneven-aged stand structure were less prone to damage from wind, which is in accordance with Gardiner (1995) and Indermühle et al. (2005).
The observed difference between the even-aged treatments (Planting, and Seed trees) and the uneven-aged treatment Selection in mean volume of stems harvested, is probably an overestimation of the general difference between the two systems. When the standing volume was drastically reduced for Selection, maximum diameter was reduced as well. At the end of the observation period, when the standing volume was allowed to increase, mean volume of stems harvested increased as well.
Because of the design of the field experiment statistical comparisons between treatments cannot be made – there are no replications. Still there are things to be learnt from the observations made during the roughly 85 years.
The first is the impact on the species composition. It has been assumed that continuous cover forestry change the species composition from light demanding pioneer species to shade tolerant secondary species. This was confirmed by all treatments. Although there was a substantial proportion of Scots pine in the original stand, the proportion of Norway spruce increased in both Selection, Diameter limit and Control. Only Planting maintained a Scots pine dominated stand.
A second lesson is the difference in the robustness of the silvicultural systems from a timber production point of view. None of the treatments were managed optimally, so the results do not give a correct picture of the growth potential of the different systems in relation to each other. However, the results do highlight one of the problems with selection system and other continuous cover forestry systems: the long lasting effects of too heavy harvests. In both Selection and Diameter limit the heavy harvests in the beginning of the observation period resulted in low volume increment for several decades. Towards the end of the period increments increased, but nothing in the data suggest that the volume increment will exceed the maximum MAI of Planting, i.e. production lost during periods with small standing volume cannot be compensated for even if the standing volume is allowed to increase later on. For Selection it was not the first harvest that caused the large reduction in growth, but the second, so one misjudgment in 1931 affected the stand development for several decades. For Planting the result was the opposite. Although no scarification was done, a sufficient number of seedlings were established and survived during the initial years, resulting in a high MAI that was roughly twice that of Selection and Diameter limit.
The knowledge about silviculture increases all the time. Today we have better knowledge about how different kinds of soil scarification affect seedling survival and growth. We have a better understanding of how standing volume affects the growth levels in stands managed with selection system. And we know more about how choice of tree species affects long-term growth and yield. Because treatment Selection had reached a reasonable standing volume, expected to give a high future growth level, and MAI had culminated for treatment Seed trees, the decision was made to restart the field trial. So the plots of treatments Planting and Seed trees were clear-cut, with seed trees left on half of the sub-quadrates. Treatment Diameter limit was also repeated, but with the diameter limit set so that the residual stand would be about 50 m3 ha–1 after harvest, i.e. about the same level that treatment Selection had during the first decades. This level has also been used in other field trials with similar treatments (Lundqvist 1990). If all goes well, it will be possible to evaluate the results of a second rotation before the end of this century.
References
Elfving B. (2006). Produktion vid byte från trakthygge till blädning [Forest production on change from even-aged stand system to selective harvesting]. In: Karlsson B. (ed.). Trakthyggesbruk och kontinuitetsskogsbruk med gran, en jämförande studie [Even-aged stand system for Norway spruce vs continuous-cover forestry – a comparative study]. Redogörelse från Skogforsk 5.
Fisher R.A. (1925). Statistical methods for research workers. Oliver and Boyd, Edinburgh.
Gardiner B.A. (1995). The interactions of wind and tree movement in forest canopies. In: Coutts M.P., Grace J. (eds.). Wind and trees. Cambridge University Press. p. 41–59.
Hägglund B., Lundmark, J-E. (1981). Handledning i bonitering med Skogshögskolans boniteringssystem. Del 2 Diagram och tabeller [Manual for site productivity estimation with the College of Forestry method]. Skogsstyrelsen, Jönköping.
Hallsby G. (2009). Plantering av barrträd [Planting of conifers]. Skogsstyrelsen, Jönköping, Skogsskötselserien 3. http://www.skogsstyrelsen.se/Aga-och-bruka/Skogsbruk/Skogsskotselserien/Plantering-av-barrtrad/. [Cited 8 Feb 2013].
Hasse W.D., Ek A.R. (1981). A simulated comparison of yields for even- versus uneven-aged management of northern hardwood stands. Journal of Environmental Management 12: 235–246.
Hladík M. (1975). Die holzproduktion im gemischten Tannen-Buchenwald bei einer Kahlschlag- und Plenterwirtschaft [Production of timber in mixed fir-beech forest at clear-felling and selection systems]. Zbornik vedeckych Prac Lesnickej fakulty VSLD Zvolene 17: 55–72.
Hörnberg G., Ohlsson M., Zackrisson O. (2009). Stand dynamics, regeneration patterns and long-term continuity in boreal old-growth Picea abies swamp-forests. Journal of Vegetation Science 6: 291–298.
Indermühle M., Raetz P., Volz R. (2005). LOTHAR Ursächliche Zusammenhänge und Risikoentwicklung. Synthese des Teilprogramms 6. Umwelt-Materialien 184. Bundesamt für Umwelt, Wald und Landschaft (BUWAL). Bern. 145 p.
Karlsson C. (2000). Seed production of Pinus sylvestris after release cutting. Canadian Journal of Forest Research 30: 982–989.
Karlsson C., Örlander G. (2000). Soil scarification shortly before a rich seed fall improves seedling establishment in seed tree stands of Pinus sylvestris. Scandinavian Journal of Forest Research 15: 256–266
Kuuluvainen T., Aakala T. (2011). Natural forest dynamics in Boreal Fennoscandia: a review and classification. Silva Fennica 45(5): 823–841.
Lähde E., Laiho O., Norokorpi Y., Saksa T. (2002). Development of Norway spruce dominated stands after single-tree selection and low thinning. Canadian Journal of Forest Research 32: 1577–1584.
Lundqvist L. (1990). Bielite – ett försök med alternativa skogsskötselmetoder i fjällnära granskog [Bielite – a field trial with alternative silvicultural methods in sub-alpine Norway spruce forests]. Institutionen för skogsskötsel, Sveriges Lantbruksuniversitet, Umeå, Arbetsrapporter 48. 25 p.
Lundqvist L. (1993). Changes in the stand structure on permanent Picea abies plots managed with single-tree selection. Scandinavian Journal of Forest Research 8: 510–517.
Lundqvist L. (2004). Stand development in uneven-aged sub-alpine Picea abies stands after partial harvest estimated from repeated surveys. Forestry 77: 119–129.
Lundqvist L., Chrimes D., Elfving B., Mörling T., Valinger E. (2007). Stand development after different thinning in two uneven-aged Picea abies forests in Sweden. Forest Ecology and Management 238: 141–146.
Näslund M. (1940). Funktioner och tabeller för kubering av stående träd [Volume equations and tables for standing trees]. Meddelanden från statens skogsförsöksanstalt 32: 87–142.
Nilsson U., Agestam E., Ekö, P-M., Elfving B., Fahlvik N., Johansson U. Karlsson K., Lundmark T., Wallentin C. (2010). Thinning of Scots pine and Norway spruce monocultures in Sweden – effects of different thinning programmes on stand level gross- and net stem volume production. Studia Forestalia Suecica 219: 1–47.
O’Hara K.L., Nagel L.M. (2006). A functional comparison of productivity in even-aged and multiaged stands: a synthesis for Pinus ponderosa. Forest Science 52: 290–303.
Shavnin A.G. (1979). Sravnitel’naya otsenka produktivnosti odnovozrastnykh i raznovozrastnykh el’nikov [Comparative evaluation of the yield of even-aged and uneven-aged spruce forests]. Lesnoe Khozyaistvo 5: 54–55.
Total of 21 references
Appendix 1
Below are the complete records for each plot (treatment) in the field trial. Stem no. is stems ha–1, basal area is m2 ha–1, and volume is m3 ha–1. Years indicate the year of the latest ended growing season, i.e. if measurements were done in spring or early summer the year was changed to the previous year.
| Clear-cutting and planting | |||||||
| Year | Species | Standing after treatment | Harvest + mortality | ||||
| Stem no. | Basal area | Volume | Stem no. | Basal area | Volume | ||
| 1923 | Pine | 53 | 2.6 | 23.0 | |||
| Spruce | 1109 | 24.4 | 179.0 | ||||
| 1950 | Pine | 145 | 0.7 | 3.0 | |||
| Spruce | 323 | 1.3 | 5.0 | ||||
| 1956 | Pine | 615 | 7.7 | 38.0 | 49 | 0.4 | 2.0 |
| Spruce | 1230 | 8.1 | 37.0 | 199 | 1.2 | 5.0 | |
| 1965 | Pine | 445 | 8.2 | 50.0 | 173 | 2.7 | 16.0 |
| Spruce | 968 | 9.0 | 50.0 | 617 | 4.4 | 22.0 | |
| 1970 | Pine | 400 | 8.9 | 58.0 | 45 | 0.5 | 3.0 |
| Spruce | 947 | 10.6 | 62.0 | 21 | 0.1 | 0.0 | |
| 1975 | Pine | 309 | 8.9 | 63.9 | 89 | 1.8 | 12.7 |
| Spruce | 764 | 10.2 | 65.5 | 180 | 2.2 | 13.9 | |
| 1985 | Pine | 306 | 11.9 | 96.6 | 3 | 0.1 | 0.4 |
| Spruce | 757 | 13.6 | 99.2 | 7 | 0.1 | 0.3 | |
| 2008 | Pine | 258 | 15.4 | 144.4 | 108 | 4.1 | 36.7 |
| Spruce | 548 | 15.6 | 135.8 | 140 | 2.9 | 22.9 | |
| Seed tree regeneration | |||||||
| Year | Species | Standing after treatment | Harvest + mortality | ||||
| Stem no. | Basal area | Volume | Stem no. | Basal area | Volume | ||
| 1923 | Pine | 49 | 3.4 | 31.0 | 181 | 6.8 | 56.0 |
| Spruce | 870 | 16.4 | 116.0 | ||||
| 1934 | Pine | 19 | 1.6 | 15.0 | |||
| 1942 | Pine | 16 | 1.6 | 15.0 | |||
| 1949 | Pine | 7 | 0.7 | 6.0 | |||
| 1956 | Pine | 482 | 3.9 | 19.0 | 96 | 1.2 | 9.0 |
| Spruce | 971 | 6.6 | 30.0 | 240 | 1.7 | 8.0 | |
| 1965 | Pine | 596 | 6.5 | 36.0 | 11 | 0.1 | 0.0 |
| Spruce | 1299 | 11.0 | 60.0 | 11 | 0.1 | 0.0 | |
| 1970 | Pine | 572 | 7.4 | 45.0 | 24 | 0.1 | 1.0 |
| Spruce | 1283 | 13.0 | 77.0 | 16 | 0.1 | 0.0 | |
| 1975 | Pine | 395 | 7.3 | 50.0 | 177 | 1.6 | 9.9 |
| Spruce | 781 | 11.0 | 71.5 | 493 | 3.8 | 21.6 | |
| 1985 | Pine | 386 | 9.9 | 76.2 | 9 | 0.1 | 0.9 |
| Spruce | 773 | 13.9 | 104.7 | 8 | 0.2 | 1.4 | |
| 2008 | Pine | 168 | 8.3 | 75.4 | 52 | 1.2 | 8.9 |
| Spruce | 688 | 18.2 | 152.7 | 204 | 3.8 | 29.7 | |
| Birch | 8 | 0.2 | 1.7 | 0 | 0.0 | 0.0 | |
| Selection system | |||||||
| Year | Species | Standing after treatment | Harvest + mortality | ||||
| Stem no. | Basal area | Volume | Stem no. | Basal area | Volume | ||
| 1923 | Pine | 20 | 0.9 | 7.0 | 5 | 0.3 | 2.0 |
| Spruce | 785 | 12.6 | 90.0 | 716 | 12.1 | 81.0 | |
| 1931 | Pine | 13 | 0.6 | 5.0 | 7 | 0.4 | 3.0 |
| Spruce | 436 | 7.1 | 50.0 | 440 | 7.5 | 50.0 | |
| 1939 | Pine | 12 | 0.7 | 5.0 | 1 | 0.1 | 1.0 |
| Spruce | 427 | 6.9 | 44.0 | 111 | 2.5 | 18.0 | |
| 1949 | Pine | 10 | 0.7 | 5.0 | 2 | 0.2 | 1.0 |
| Spruce | 362 | 6.7 | 40.0 | 105 | 3.2 | 23.0 | |
| 1956 | Pine | 10 | 0.8 | 6.0 | - | - | - |
| Spruce | 281 | 6.6 | 42.0 | 85 | 2.0 | 13.0 | |
| 1965 | Pine | 35 | 0.8 | 5.0 | 8 | 0.6 | 5.0 |
| Spruce | 579 | 6.7 | 38.0 | 215 | 5.8 | 40.0 | |
| 1970 | Pine | 46 | 1.0 | 6.0 | 1 | 0.0 | 0.0 |
| Spruce | 581 | 8.0 | 46.0 | 7 | 0.0 | 0.0 | |
| 1975 | Pine | 72 | 1.2 | 8.0 | 4 | 0.2 | 1.0 |
| Spruce | 603 | 8.1 | 47.0 | 44 | 1.7 | 12.0 | |
| 1985 | Pine | 136 | 2.1 | 12.8 | 0 | 0.0 | 0.0 |
| Spruce | 786 | 12.7 | 79.5 | 3 | 0.1 | 0.5 | |
| 1990 | Pine | 139 | 2.4 | 15.9 | 7 | 0.2 | 1.4 |
| Spruce | 800 | 13.2 | 87.7 | 37 | 1.0 | 6.4 | |
| 2006 | Pine | 110 | 3.5 | 27.3 | 6 | 0.5 | 4.0 |
| Spruce | 1412 | 18.3 | 132.3 | 68 | 1.9 | 13.0 | |
| Diameter limit harvest | |||||||
| Year | Species | Standing after treatment | Harvest + mortality | ||||
| Stem no. | Basal area | Volume | Stem no. | Basal area | Volume | ||
| 1923 | Pine | 10 | 6.0 | 13 | 0.9 | 12.0 | |
| Spruce | 1400 | - | 12.0 | 761 | 22.0 | 170.0 | |
| 1934 | Pine | - | - | - | - | - | - |
| Spruce | - | - | - | 252 | 2.0 | 11.0 | |
| 1949 | Pine | 63 | - | - | - | - | - |
| Spruce | 702 | - | - | 107 | 2.6 | 14.0 | |
| 1956 | Pine | 95 | 0.8 | 3.0 | 10 | 1.0 | 8.0 |
| Spruce | 794 | 6.0 | 25.0 | 126 | 2.2 | 11.0 | |
| 1965 | Pine | 100 | 1.5 | 8.0 | 2 | 0.0 | 0.0 |
| Spruce | 1002 | 10.4 | 52.0 | 6 | 0.0 | 0.0 | |
| 1970 | Pine | 101 | 1.9 | 11.0 | 6 | 0.0 | 0.0 |
| Spruce | 1100 | 12.7 | 66.0 | 6 | 0.0 | 0.0 | |
| 1975 | Pine | 111 | 2.4 | 15.0 | - | - | - |
| Spruce | 1203 | 15.4 | 88.0 | 2 | 0.0 | 0.0 | |
| 1985 | Pine | 128 | 3.4 | 23.8 | 2 | 0.0 | 0.0 |
| Spruce | 1282 | 20.4 | 133.8 | 11 | 0.1 | 0.5 | |
| 2006 | Pine | 13 | 0.2 | 1.5 | 92 | 4.7 | 40.7 |
| Spruce | 959 | 7.3 | 47.5 | 740 | 19.0 | 148.1 | |
| Control | |||||||
| Year | Species | Standing after treatment | Harvest + mortality | ||||
| Stem no. | Basal area | Volume | Stem no. | Basal area | Volume | ||
| 1923 | Pine | 41 | 2.5 | 22.0 | 1 | 0.0 | 0.0 |
| Spruce | 1774 | 22.5 | 142.0 | 112 | 1.6 | 10.0 | |
| 1931 | Pine | 41 | 2.7 | 20.0 | - | - | - |
| Spruce | 1513 | 19.7 | 127.0 | 315 | 4.4 | 28.0 | |
| 1939 | Pine | 41 | 3.0 | 23.0 | - | - | - |
| Spruce | 1381 | 19.6 | 128.0 | 180 | 2.2 | 14.0 | |
| 1949 | Pine | 40 | 3.2 | 25.0 | 1 | 0.1 | 1.0 |
| Spruce | 1196 | 18.6 | 125.0 | 235 | 3.2 | 21.0 | |
| 1956 | Pine | 39 | 3.4 | 28.0 | 1 | 0.1 | 0.0 |
| Spruce | 1105 | 19.2 | 133.0 | 133 | 1.3 | 8.0 | |
| 1970 | Pine | 56 | 3.7 | 31.0 | 5 | 0.7 | 6.0 |
| Spruce | 1117 | 20.7 | 146.0 | 197 | 2.8 | 18.0 | |
| 1975 | Pine | 57 | 4.0 | 34.0 | - | - | - |
| Spruce | 1142 | 21.8 | 158.0 | 31 | 0.6 | 4.0 | |
| 1985 | Pine | 56 | 4.4 | 38.0 | 0 | 0.0 | 0.0 |
| Spruce | 1099 | 22.8 | 178.0 | 74 | 1.8 | 14.0 | |
| 2006 | Pine | 35 | 3.1 | 28.0 | 25 | 1.9 | 17.3 |
| Spruce | 1721 | 20.0 | 155.3 | 262 | 6.6 | 54.6 | |
