Loice M. A. Omoro,
Mike Starr  ,
Petri K. E. Pellikka
,
Petri K. E. Pellikka
Tree biomass and soil carbon stocks in indigenous forests in comparison to plantations of exotic species in the Taita Hills of Kenya
Omoro L. M. A., Starr M., Pellikka P. K. E. (2013). Tree biomass and soil carbon stocks in indigenous forests in comparison to plantations of exotic species in the Taita Hills of Kenya. Silva Fennica vol. 47 no. 2 article id 935. https://doi.org/10.14214/sf.935
Abstract
Carbon (C) densities of the tree biomass and soil (0–50 cm) in indigenous forest and plantations of eucalyptus, cypress and pine in the Taita Hills, Kenya were determined and compared. The cypress and pine plantations were about 30-years-old and eucalyptus plantations about 50-years-old. Biomass C densities were estimated from breast height diameter and wood density using allometric functions developed for tropical species and an assumed C content of 50%. Belowground biomass C densities were estimated using root:shoot biomass ratios. Soil organic C (SOC) densities were calculated from measured organic carbon contents (0–20 and 20–50 cm layers) and modelled bulk density values. Mean total biomass C and SOC densities for indigenous forest were greater than those of the plantations, and the difference was significant (p < 0.05) in the cases of cypress and pine biomass and pine SOC. The correlation between biomass C and SOC densities was nearly significant in the case of indigenous forest, but negative. Biomass C densities were not significantly correlated with mean annual precipitation, mean annual temperature or potential evapotranspiration, but pine biomass C densities were significantly correlated to actual evapotranspiration. SOC densities were more strongly correlated to mean annual precipitation than biomass C densities, but only significantly so in the case of pine. Neither biomass C nor SOC densities were correlated to plant available water capacity of the soil. Indigenous forest SOC densities were significantly correlated to soil clay contents, but negatively. Indigenous forests sequester more C in biomass and soil than do 30 to 50-year-old plantations of exotics, but it remains unclear if this is an intrinsic difference between indigenous forest and plantations of exotics or because of insufficient time for SOC levels in plantations to recover after clearance of original indigenous forest.
Keywords
biomass;
carbon stocks;
soil carbon;
Eastern Arc Montane forest;
exotic tree species;
indigenous forest
- Omoro, Viikki Tropical Resources Institute, Department of Forest Sciences, P.O. Box 27 (Latokartanonkaari 7), FI-00014 University of Helsinki, Finland E-mail loice.omoro@helsinki.fi
-
Starr,
Department of Forest Sciences, P. O. Box 27 (Latokartanonkaari 7), FI-00014 University of Helsinki, Finland
E-mail
mike.starr@helsinki.fi
- Pellikka, Department of Geosciences and Geography, P. O. Box 64 (Gustaf Hällströminkatu 2), FI-00014 University of Helsinki, Finland E-mail petri.pellikka@helsinki.fi
Received 8 November 2012 Accepted 8 April 2013 Published 19 June 2013
Views 271542
Available at https://doi.org/10.14214/sf.935 | Download PDF

1 Introduction
The deforestation of tropical forests is the second largest human induced source of global carbon dioxide (IPCC 2001, 2007). Global instruments to reward countries that reduce the rates of deforestation and degradation (REDD) and application of sustainable forest management (REDD+) activities to enhance carbon (C) sequestration and maintain in situ C stocks underline the importance of indigenous tropical forest in mitigating the effects of climate change (Irawan and Tacconi 2009; UNFCC 2007, 2009, 2010). While on a global basis the soil C pool is greater than that of the vegetation pool (Schlesinger 1997), there are considerable differences in the allocation of C between living biomass and soil pools, both within and between biomes. For example, Brown and Lugo (1982) calculated that while tropical forests accounted for 46% of the world’s living terrestrial C pool, tropical soils accounted for only 11% of the world’s soil C pool. Sombroek et al., (1993) showed that the size of biomass C and soil C stocks tend to be more similar to each other in forest biomes than in the case of non-forest biomes. Dixon (1994) showed that the allocation of C between the forest biomass and soil differs with latitude, with the biomass to soil C ratio being low (c. 0.1) in high latitudes and high (c. 1.0) in low latitudes. However, others (Post et al. 1982; Jobbágy and Jackson 2000) have shown that soil C densities in tropical forests can be similar to or greater than those in boreal forests. Thus, the distribution of C between biomass and soil is variable.
At the global and regional scale, potential forest biomass production and carbon density are largely determined by climatic conditions, primarily temperature and water availability (Lieth 1975). At the local scale, site (topography) and soil factors become important. However, the actual biomass and carbon density are, to a greater or lesser degree, determined by human activity and management (Brown and Lugo 1982; Brown and Gaston 1995). Soil C densities are determined by the balance between litterfall inputs, decomposition and leaching losses; ecosystem processes that are largely controlled by the same environmental factors controlling biomass production (Brown and Lugo 1982; Post et al. 1982). At the local scale, the quality of the organic matter, which is related to species and therefore forest type, soil type and texture, are significant factors (Jobbágy and Jackson 2000). For example, the turnover rates of deciduous forest litter are generally greater than those of coniferous forest litter (Cole and Rapp 1981) and soil C contents increase with clay content (Schimel et al. 1994; Kaiser and Gugenberger 2003).
Meta analysis studies have shown that replacing native forest with agricultural crops or plantations (at least when less than 40 years of age) generally reduces soil C stocks (Guo and Gifford 2002; Liao et al. 2010) and conversely the establishment of forest after agricultural use generally increases soil C stocks (Post and Kwon 2000; Lemma et al. 2006). However, Glenday (2006) in a study carried in the Kakamega National Forest of Kenya, the easternmost relic of Guineo-Congolian rainforest, showed that tree biomass and soil C densities in indigenous forest were not consistently greater than in plantations of exotics, but depended on plantation age and species.
The Taita Hills in Kenya are home to the northernmost location of the remaining Eastern Arc Montane (EAM) forest biome (Myers et al. 2002; Burgess et al. 2007). These forests are included among the thirty-four “biodiversity hotspots” of the world because of the high number of endemic plant and vertebrate species (Myers et al. 2002; Conservation International 2005). However, the area of indigenous forest has declined, and become fragmented and degraded as a result of deforestation and planting exotic tree species (Beentje 1988; Rogo and Oguge 2000; Pellikka et al. 2009). Deforestation of the indigenous forests has been halted and forest conservation and other activities have been introduced in the wake of participatory forest management (Himberg et al. 2009). While the tree biodiversity of the indigenous forests has been studied (Rogers 1996; Omoro et al. 2010), little is known about their biomass and soil C densities, how they compare with those of plantations and how they relate to environmental factors controlling biomass production and soil organic matter contents.
In this study we: 1) determined the living tree biomass C and soil organic carbon (SOC) densities of indigenous forest remnants in the Taita Hills, 2) compared them to C densities in plantations of exotic tree species, and 3) examined the relationship between biomass C and SOC densities in the different forest types, and their relationship with climate, site and soil factors. We hypothesized that current tree biomass C and SOC densities would be greater in indigenous forests than in plantations of exotics. We also hypothesized that biomass C and SOC densities would be more strongly correlated to each other and to environmental factors in the case of indigenous forest than in the case of the plantations because indigenous forests are closer to equilibrium with their environment than plantations.
2 Material and methods
2.1 The study area, forest areas and forest types
The study was carried out in high elevation forested areas of the Taita Hills in south-eastern Kenya (3°25´S, 38°20´E) (Fig. 1). The Taita Hills are strongly influenced by the Indian Ocean, forming a barrier to moisture-laden winds (Salminen 2004). As a result, the area has two rainy seasons, one occurring during March-May and a shorter one during November-December. The mean annual rainfall ranges from 1332 to 1910 mm, with the southern and eastern slopes receiving more rainfall than western and northern slopes (EAWL 2001; Salminen 2004). In addition, some parts of the Taita Hills receive cloud precipitation (Jaetzold and Schmidt 1983). The amount of additional rainfall due to cloud precipitation (sometimes referred to as occult or horizontal precipitation) is unknown and difficult to quantify. Stadmüller (1987) reported relative values for cloud forest in the humid tropics ranging from 7 to 159% of annual rainfall while Bruijnzeel et al. (2010) reports that throughfall exceeds annual rainfall in upper montane cloud forests by about 20% on average. The mean annual temperatures in the Taita Hills range from 16 to 18 °C, but temperatures are moderated by both altitude and aspect (Jaetzold and Schmidt 1983).
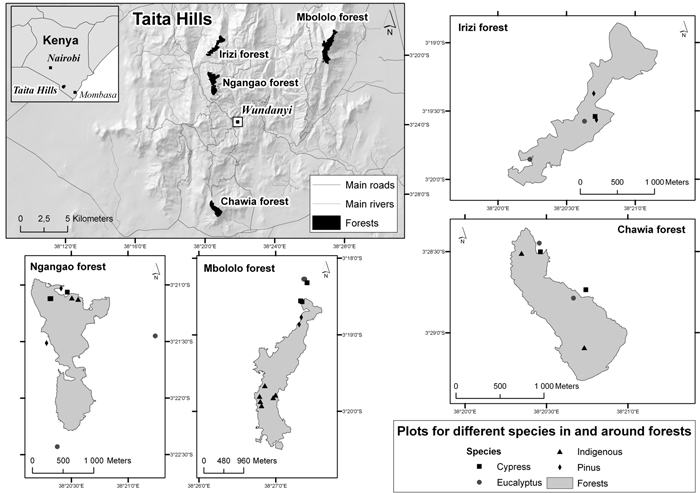
Fig. 1. Location of the four forest areas and study plots in the Taita Hills, Kenya (maps drawn by Mika Siljander, Dept. of Geosciences and Geography, University of Helsinki).
The geology of the Taita Hills consists of heavily metamorphosed Precambrian crystalline basement rocks (Bauernhofer et al. 2008) with outcrops of Cretaceous and Jurassic sedimentary rocks of shale, sandstones, conglomerates and some limestones (Newark 2002). The soils are varied, but on the mountain tops and major scarps, where our study was carried out, they are mainly humic Cambisols (FAO) and developed in sandy clay loam material (Jaetzold and Schmidt 1983). In the Irizi area there are also some areas of calcic Cambisols.
The EAM forests have a high number of endemics including tree taxa and species. The northern EAM forest, which includes the Taita Hills, is the richest in endemic large trees (Lovett 1998). In the Taita Hills the endemic large tree Macaranga conglomerate is commonly found and Coffea fadenii and Ocotea usambarensis less so. Other commonly occurring tree species include: Tabernamontana stapfiana, Albizia gummifera, Phoenix reclinata, Syzygium guineese, Maesa lanceolata, Newtonia bucchananii, Strombosia scheffleri, and Cola greenwayi (Beentje 1988; Madoffe et al. 2005; Rogers et al. 2008). The remaining indigenous forest is fragmented but now subject to conservation and protection (Chege and Byteibier 2005).
In the 1960s the Kenyan Forest Service planted eucalyptus (Eucalyptus saligna) and cypress (Cuppressus lusitanica) and various pines (Pinus patula, P. elliottii, P. caribaea) in the 1980s throughout the Taita Hills. The eucalypt plantations are now about 50 years old and the cypress and pine plantations about 30 years old. These exotic species were mainly planted on land that had been cleared of indigenous forest. The purposes of the plantations were for timber production, to serve as buffers to protect the remaining indigenous forest, and to mitigate against soil erosion (Pellikka et al. 2009). The plantations have not have been utilized by local communities with the exception of the eucalypt plantations in Ngangao, which are close to settlement.
We determined the biomass C and SOC densities in four forest types and in four forest areas in the Taita Hills. The four forest types were indigenous forest and plantations of cypress (Cuppressus lusitanica), eucalyptus (Eucalyptus saligna), and pine (Pinus patula) and the four areas were Ngangao, Chawia, Irizi and Mbololo. The locations of the areas are shown in Fig. 1 and some characteristics are presented in Table 1. Indigenous forest is now absent from the Irizi area. The indigenous forest in Chawia has been the most heavily degraded and that in Mbololo has been the least degraded while the degradation in Ngangao is intermediate (Byteibier 2001).
| Table 1. Characteristics of the four forest areas and number of study plots. | ||||
| Characteristic | Forest area | |||
| Ngangao | Chawia | Irizi | Mbololo | |
| Latitude (S) | 03°21′55″ | 03°28′48″ | 03°19′40″ | 03°18′15″ |
| Longitude (E) | 38°20′33″ | 38°20′31″ | 38°20′45″ | 38°29′45″ |
| Elevation (m a.s.l.) | 1700–1952 | 1470–1600 | 1640–1705 | 1000–1779 |
| Slope (%) | 6–27 | 1–13 | 3–25 | 4–44 |
| Area (ha) | 206 | 111 | 47 | 185 |
| MAT (°C) a) | 17.8 | 18.9 | 18.5 | 18.6 |
| MAP (mm) b) | 1773 c) | 1285 c) | 1450 | 1716 c) |
| No. of plots d) | 9 (2, 3, 2, 2) | 6 (2, 2, 2, -) | 9 (-, 1, 4, 4) | 14 (4, 4, 2, 4) |
| a) Mean annual temperature, New LocClim (see text) values. b) Mean annual precipitation, New LocClim (see text) values. c) Value includes occult precipitation (+ 20% of annual precipitation). d) Values in parentheses are the number of plots by forest type: Indigenous, Cypress, Eucalyptus, Pine. | ||||
2.2 Study plots
A network of sample plots has been established in the indigenous forests of Ngangao and Chawia and inventoried for health status (Madoffe et al. 2006; Rogers et al. 2008). We utilized these plots in our study and established new plots in the indigenous forest in Mbololo and the plantations in all four areas.
The design and arrangement of the plots in Ngangao and Chawia follows that of the US Forest service (USDA Forest Service 2007; Roger et al. 2008). Each plot consists of four circular subplots (0.017 ha) a central subplot surrounded by three subplots forming an equilateral triangle. The distance from the central subplot to each of the three surrounding subplots is 36.6 m. The plots are distributed randomly throughout the forest. For our purposes, we randomly selected plots in each forest type and forest area and then randomly selected two of the subplots in each plot as replicates, with the exception of one plot in Ngangao where three subplots were selected. In Mbololo indigenous forest and plantations in all four forest areas we established replicate pairs of subplots of the same as in the forest health inventory and located 36.6 m distance from each other. In total there were 38 plots in our study. The distribution of plots among forest areas and forest types is given in Table 1, the number of plots in each forest type being broadly proportional to its area. The geographic coordinates of the plots were recorded using GPS (hand held Magellan GPS receiver) and elevation, slope and aspect estimated from a digital elevation model of the Taita Hills (Clark and Pellikka 2005).
2.3 Tree measurements and calculation of biomass C density
All live trees having a diameter at breast height (dbh) of >5cm in each of the selected subplots were inventoried. The indigenous tree species were identified by use of a field instruction manual (USDA Forest Service 2007) and assistance of a local para-taxonomist. The taxonomy used for naming the species follows that of the African Plants Database (version 3.4.0). The dbh of the trees was measured (±0.1 cm) using a dbh tape and recorded by species.
To estimate the aboveground biomass of each tree (dry weight, kg) we used the allometric function developed by Chave et al. (2005):
Biomass = ρ*exp (–1.499 + 2.148 ln(dbh) +0.207 ln(dbh)2 –0.0281 ln(dbh)3)
where ρ is the specific wood density (g cm–3) and dbh is the diameter at breast height (cm). The biomass function developed by Chave et al. (2005) was chosen because it was developed for moist tropical forest trees and, unlike the other widely used functions (e.g. Brown 1997), uses wood density and so better differentiates between species. Specific wood density values for the indigenous species were obtained from Reyes et al. (1992) and the global wood density database developed by Zanne et al. (2009). In cases where the wood density for a species was not listed, an average value of 0.5 was used, as recommended by Chave et al. (2005) for trees from tropical areas. The wood densities for cypress and pine were taken from those listed in tables in Brown (1997). Belowground biomass was estimated using a root:shoot ratio approach (Cairns et al. 1997). For indigenous trees a root:shoot ratio of 0.25 was used (Dean et al. 1996), for cypress and pine a ratio of 0.24 was used (Körner 1994) and for eucalypts a ratio of 0.33 was used (IPCC 2003).
The C content of each tree was calculated as the product of the dry weight biomass and an assumed C content of 50% (IPCC 2003) with appropriate correction for units. The tree C contents were then summed and divided by the area of the plot to give aboveground and belowground C density values for each plot expressed in Mg C ha–1.
2.4 Soil sampling, analyses and calculation of SOC density
Within each subplot a spot was randomly selected and soil samples taken of the 0–20, 20–50 and 50–100 cm layers using a 10 cm diameter soil auger after first removing surface vegetation and litter. The soil samples were pretreated by oven drying at 105 °C for 24 hours then crushed and sieved through a 2 mm sieve. The sieved soil was then analyzed for organic C content using a Walkley-Black method (Walkley and Black 1943), particle size distribution determined using the hydrometer method (Bouyoucos 1962), and soil pH in a soil:distilled water suspension (1:2.5) after stirring and letting stand for 30 minutes.The analyses were carried out at the Department of Soil Science, University of Nairobi, using procedures described by Okalebo et al. (2000).
Subplot SOC density was calculated as the product of C content, bulk density, and layer thickness with appropriate correction for units and expressed in Mg C ha–1, and then averaged for each plot. In some subplots, the soil depth was less than 100 cm and the 50–100 cm layer could not be fully sampled. SOC densities have therefore been calculated for the 0–50 cm layer. Bulk density values were estimated using several pedotransfer functions and our measured particle size, depth and organic matter (SOC) content data. The pedotransfer function developed by Balland et al. (2008) for Inceptisols (Eqn. 18 fitted with parameters for Inceptisols, exceptions), which correspond to Cambisols in the FAO soil classification and the major soil type in our study, was considered to give the most reliable estimates.
The plant available water capacity (PAWC, mm) of the soil was calculated as the difference between the amount of water in the soil at field capacity and at permanent wilting point. Field capacity and permanent wilting point values were estimated from particle size data for the 0–20, 20–50, 50–100 cm layers using the pedotransfer function developed by Saxton et al (1986). We calculated PAWC for the 0–50 cm layer and for the 0–100 cm layer. PAWC values for the 0–50 cm layer were used to correlate with biomass C and SOC densities for 0–50 cm layer and PAWC values for the 0–100 cm layer were calculated for use in the water balance model to estimate actual evaporation (see below), as it was assumed that this layer corresponds to the rooting zone.
Soil property values for the subplots were averaged to give mean values for each plot, which were subsequently used in the statistical analysis.
2.5 Climate and evapotranspiration
The long-term mean monthly temperatures and rainfall were generated for each plot using New LocClim, a local climate estimator software tool that estimates long-term monthly climate data for any location using various interpolation methods (FAO 2005; Grieser et al. 2006). The program was used in the single point mode (plot coordinates) and interpolation done using Shepard’s inverse distance weighting method with data from eleven nearest weather stations corrected for vertical and horizontal gradients (for further details, see FAO 2005). Plot mean annual temperatures (MAT) were calculated by averaging the monthly temperature values and mean annual precipitation (MAP) was calculated by summing the monthly rainfall values. Except for the plots from the Irizi area we multiplied plot MAP values by 1.2 in order to include additional inputs of water via cloud precipitation. The value of 1.2 was based on the value suggested by Bruijnzeel et al. (2010) for montane cloud forests. The Irizi area, which is in the rain shadow, does not receive significant amounts of cloud precipitation.
Annual potential evapotranspiration (PET) and actual evapotranspiration (AET) values for each plot were estimated using WATBAL, a simple monthly water balance model (Starr 1999). In this model, monthly PET is calculated using the Jensen-Haise alfalfa-reference crop evapotranspiration equation (Allen et al. 1998), which is based on incoming global radiation. Monthly global radiation is calculated from solar (extraterrestrial) radiation and cloud cover (in tenths) using the empirical equation developed by Black (1956). Monthly solar radiation values are calculated from latitude and day of the year using the Milanovitch equation (Allen et al. 1998) and cloud cover data that is either reported or then derived from sunshine fraction data. The Jensen-Haise alfalfa- reference crop PET values are then converted into PET values for the particular vegetation cover of interest (forest) using a crop coefficient (Kc) approach (Allen et al. 1998). Crop coefficient values integrate the effects of height, albedo, canopy resistance, and evaporation from soil and are mainly dependent on the characteristics of the vegetation (Allen et al. 1998). While Kc values are available for low crops and fruit trees, they are not available for forests. However, because forest canopies can intercept significant amounts of rainfall compared to low crops, Kc values for forests are considered to be >1, at least for forests having a high degree of canopy cover. To reflect the effect of interception we used measured plot biomass density values to linearly scale Kc values to vary between 0.7 and 1.3. These limits were chosen after trying out several values and evaluation of the resulting modelled monthly soil moisture and drainage values in relation to local knowledge about soil moisture and runoff conditions.
2.6 Statistical analyses
Descriptive statistics were calculated to describe the plot biomass and soil C densities by forest type and forest area. Differences in biomass and soil C densities between forest types across forest areas were determined using univariate analysis of variance (ANOVA) and Tukey multiple comparison post-hoc tests. There were too few plots to reliably test for differences between forest types within forest area. The difference between biomass C and SOC densities within each forest type was tested for using the paired t-test. Spearman correlation coefficients were calculated to describe the dependence of C densities on climate, site and soil factors. Spearman correlations were used to avoid assuming normality of the data and because of the relatively small sample size. The statistical analyses were performed using GraphPad Prism version 5.03 for Windows (GraphPad Software).
3 Results
3.1 Stand characteristics and soil properties
The range in characteristics of the indigenous forests and plantations of exotic species along with selected soil properties for the four forest areas are shown in Table 2. Of the indigenous forest plots, those having the largest diameter trees and stand basal area were associated with the Chawia area. The indigenous forest stem densities in Mbololo were considerably higher than in the other forest areas and also compared to the plantations in all forest areas. The largest diameter eucalypt trees were associated with the plantations in Chawia and the largest pine trees associated with the plantations in Mbololo. There was little difference in the mean diameter of the trees in the cypress plantations among the four forest areas.
| Table 2. Stand and soil characteristics of study plots (stand by forest type and soil by layer) for the four study areas in the Taita Hills. View in new window/tab. |
The highest soil pH values were associated with Irizi, reflecting the calcic nature of the soils in the area (Table 2). Ngangao and Mbololo areas have higher C contents than the Chawia and Irizi. The soils in all areas have varying clay contents (plot clay contents ranging from 6 to 48%) resulting in textural classes ranging from clay to loamy sand, but most have a sandy clay loam texture.
3.2 Biomass and soil C densities
The mean biomass C and SOC densities for each forest type are shown in Table 3. The mean C density of the aboveground biomass ranged from 158 to 360 Mg C ha–1, from 39 to 90 Mg C ha–1 for belowground biomass and from 197 to 450 Mg C ha–1 for total biomass pools. Calculated across forest areas, the indigenous forest had higher biomass C densities than the plantations. However, the difference was only significant (p < 0.05) in the case of the cypress and pine plantations.
Forest type mean SOC density in the 0–20 cm layer ranged from 78 to 146 Mg C ha–1, from 91 to 158 Mg C ha–1 in the 20–50 cm layer and from 168 to 305 Mg C ha–1 in the 0–50 cm layer (Table 3). SOC densities were generally higher in the indigenous forest than in the plantations, but the differences were only significant in the case of the eucalyptus and pine and plantations.
| Table 3. Mean (± standard deviation) carbon densities (Mg C ha–1) in tree biomass and soil of the four forest types in the Taita Hills. Within each carbon stock, forest type mean values followed by different letters indicate a significant difference (Tukey’s test, p < 0.05). | ||||
| Stock | Indigenous (n = 8) | Cypress (n = 10) | Eucalyptus (n = 10) | Pine (n = 10) |
| Tree biomass C | ||||
| Aboveground | 360 ± 148.1a | 158 ± 66.6b | 221 ± 143.2ab | 195 ± 87.8b |
| Belowground | 90 ± 37.0a | 39 ± 17.8b | 72 ± 46.0ab | 47 ± 21.0b |
| Total | 450 ± 185.1a | 197 ± 84.3b | 292 ± 189.5ab | 242 ± 108.8b |
| SOC | ||||
| 0–20 cm | 146 ± 27.6a | 115 ± 23.3ab | 94 ± 33.7bc | 78 ± 31.2c |
| 20–50 cm | 158 ± 35.9a | 137 ± 27.8ab | 116 ± 45.1ab | 91 ± 43.5b |
| 0–50 cm | 305 ± 58.1a | 252 ± 48.0ab | 209 ± 77.4bc | 168 ± 72.5c |
Testing for differences between total biomass C density and SOC density (0–50 cm) within each forest revealed no significant difference (paired t-test results not shown). The dependence of SOC density on total biomass C density is shown in Fig. 2. Only the indigenous forest type showed a nearly significant relationship between biomass C and SOC densities, but contrary to expectations, this relationship was negative.
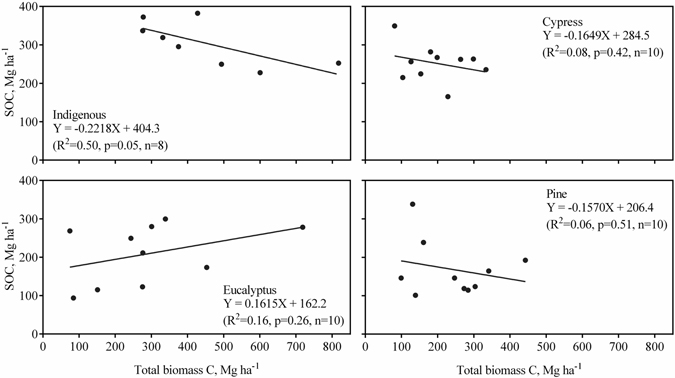
Fig. 2. Relationship between plot soil organic carbon (SOC, 0–50 cm) and total biomass carbon densities for each of the four forest types. Lines are linear regression lines.
3.3 Correlation of C densities to climate, site and soil factors
The correlations (Spearman) between plot mean biomass C and SOC densities and a number of climate, site and soil factors are shown by forest type in Table 4. Biomass C densities were only significantly (p < 0.05) correlated with AET (pine plantations) and SOC densities were only significantly correlated with mean annual rainfall (pine plantations), potential evapotranspiration (eucalyptus and pine plantations), elevation (pine plantations), and clay content (indigenous forest). Thus, the C densities of the indigenous forest did not depend on climate and environmental factors any better than did the C densities of the plantations, as we had hypothesized.
| Table 4. Correlations (Spearman) between plot mean carbon densities (Mg ha–1) for tree biomass (total) and soil (0–50 cm) and various climate and site variables by forest type. Values in bold denote significant correlation coefficients (p < 0.05). | ||||||||||
| Forest type | n | MAP a) | MAT a) | PET b) | AET c) | Elevation | Slope | Clay d) | PAWC e) | |
| Biomass (total) | Indigenous | 8 | –0.24 | 0.28 | 0.14 | 0.33 | –0.36 | –0.02 | 0.40 | –0.49 |
| Cypress | 10 | –0.35 | –0.25 | 0.02 | 0.44 | 0.19 | –0.38 | 0.16 | –0.19 | |
| Eucalyptus | 10 | –0.07 | 0.48 | –0.25 | 0.52 | –0.49 | 0.05 | 0.42 | 0.22 | |
| Pine | 10 | 0.10 | 0.52 | –0.03 | 0.84 | –0.53 | 0.48 | –0.09 | 0.14 | |
| Soil (0–50 cm) | Indigenous | 8 | 0.52 | –0.30 | –0.36 | 0.24 | 0.62 | 0.10 | –0.83 | 0.00 |
| Cypress | 10 | 0.55 | –0.55 | –0.56 | –0.31 | 0.58 | –0.44 | –0.52 | –0.49 | |
| Eucalyptus | 10 | 0.41 | 0.22 | –0.64 | 0.15 | –0.31 | –0.03 | –0.02 | –0.04 | |
| Pine | 10 | 0.68 | –0.34 | –0.67 | –0.32 | 0.67 | 0.35 | –0.31 | –0.45 | |
| a) Mean annual precipitation (including 20% cloud precipitation, except for Irizi) and mean annual temperature. b) Mean annual potential (Jensen-Haise alfalfa reference crop) evapotranspiration. c) Mean annual actual evapotranspiration. d) Clay (<0.002 mm) content (%) of 0–50 cm soil layer. e) Plant available water capacity (mm) of 0–50 cm soil layer calculated using method of Saxton et al. (1986). | ||||||||||
4 Discussion
4.1 Biomass C density
We have assumed that the observed differences in C stocks between forest types are primarily due to the replacement of indigenous forest with exotics. As is the case with most such comparative studies, there is no baseline biomass or soil carbon data available against which to compare our current carbon density values. However, from local knowledge it is known that most of the plantations in the Taita Hills are on land that had been cleared of indigenous forest and that the plantations, with the exception of the eucalypt plantations in Ngangao, have been protected and largely remained unutilized. Thus there has not been major disturbance in any of the forests.
The biomass C density of indigenous forest was, as hypothesized, higher than that of the plantations, although not significantly so in the case of the eucalyptus plantations. Glenday (2006) in her study of the Kakamega forest, a relic Guineo-Congolian rainforest in western Kenya, reported a mean biomass C densities of 360 Mg C ha–1 for indigenous forest, of 290 to 370 Mg C ha–1 for old (20–50 years) plantations of exotics (same species as in our study) and of 210 to 240 Mg C ha–1for young (< 20 years) plantations. Our values for the EAM indigenous forest in the Taita Hills are within the range reported by Munishi and Shear (2004) for indigenous EAM forests in Tanzania (388 Mg C ha–1 in the Uluguru Mountains and 517 Mg C ha–1 in the Usambara Mountains). The difference in biomass C densities amongst these cited studies may partly be related to the use of different allometric biomass functions, differences in wood density values used, and to differences in tree size included in the calculations. For example, Glenday (2006) only included trees with a dbh > 20 cm in her study and Munishi and Shear (2004) included trees with a dbh > 6 cm. In addition, Glenday (2006) also reduced dbh for the effect of stem buttresses, which decreased biomass by 14–17%. The widely used general allometric biomass function by Brown (1997) does not use wood density while that of Chave et al. (2005), which was used in this study, does. The variation in wood density values within and between hardwoods and softwoods (Reyes et al. 1992) would thus be a source of variability in the C density estimates (Mahli et al. 1999).
Biomass C densities of the plantations may be expected to increase with plantation age (Guo and Gifford 2002). The eucalyptus plantations in the study area are older than those of the cypress and pine plantations, and this may partly explain why the biomass C densities of the eucalyptus plantations are greater, although not significantly so, than those of the cypress and pine plantations. The C densities of the eucalyptus plantations in Ngangao were the lowest of the eucalyptus plantations (data not shown), which can be attributed to a greater degree of utilization of the eucalyptus plantations in Ngangao, as indicated by the lower dbh and basal area values (Table 2). The biomass C density of the cypress plantations in Chawia were similar to those of the indigenous forest there (data not shown), but this can be attributed to the relatively high proportion of species other than cypress, particularly indigenous, present in the cypress plantations (Table 2).
4.2 SOC density
Batjes (1996) reported mean SOC densities for Cambisols around the world ranging from 43 to 161 Mg C ha–1 for the upper 50 cm layer and Sombroek et al. (1993) reported a median SOC density value of 117 Mg C ha–1 for the upper 1 m soil layer of Cambisols. Cambisols in the agroecological zones of Kenya have a reported mean SOC mean density of 75 Mg C ha–1 for the 0–50 cm layer (Batjes 2004). The greater SOC densities for the 0–50 cm layer in our study are probably due to the presence of trees and greater litter production than crops. Post et al. (1982) reported mean SOC densities for the upper 1 m soil for tropical moist forest of 115 Mg C ha–1 and for tropical wet forest of 210 Mg C ha–1 and Jobbágy and Jackson (2000) reported a mean value of 186 Mg C ha–1 for upper 1 m for tropical evergreen forest. However, Brown and Lugo (1982) report SOC densities for tropical forests that are generally lower than our values.
SOC densities were generally lower in the plantations than the indigenous forest. This may reflect insufficient time for recovery of SOC stocks after an initial decline following clearance of the indigenous forest and replacement by the plantation (Guo and Gifford 2002). Kasel and Bennet (2007) found native eucalypt forest in south-eastern Australia to have higher SOC contents (0–10 cm) than 37-year-old plantations of exotic pines, but no difference with plantations of 75 years age. From a meta-analysis study by Guo and Gifford (2002), 40 years may be needed before SOC densities in conifer plantations return to the levels of the indigenous forest they replaced. Glenday (2006) did not find SOC densities (0–60 cm) to differ between indigenous Guineo-Congolian rainforest and plantations of exotics ranging in age from less than 20-years-old to 50-years-old in western Kenya. The age of the eucalyptus plantations in our study was 50 years and that of the cypress and pine plantations 30 years, suggesting that SOC levels in our plantations should be approaching those of the indigenous forest. However, Liao et al. (2010) in another meta-analysis study found that ecosystem (biomass plus soil) C stocks of plantations relative to natural forest were significantly lower independent of biome, geographic region, age of plantation, and species, indicating that plantation C stocks are intrinsically lower than indigenous forest.
The decomposition of litter from broadleaved species tends to be faster than that of coniferous species (Prescott et al. 2000), which often results in the accumulation of a litter layer in coniferous forests. The relatively low SOC contents and densities in our pine plantations may therefore be related to the removal of the litter layer before taking the soil samples. Using the same argument one may have expected SOC densities in the cypress plantations to also be relatively low. However, some of the cypress plots were not pure but contained other species, mainly indigenous trees, and this may have resulted in the higher than expected SOC densities. The mixing of broadleaved species within conifer plantations has been shown to have an effect on litterfall production and decomposition compared to pure stands (Wang et al. 2007). Even though the decomposition rate of indigenous tree litter may be relatively high because it is of more favorable quality than that of conifers (Lugo 1992), litter production may also be expected to be higher and outweigh the effect of faster decomposition rates on soil carbon contents. As discussed above, the indigenous forests had the highest biomasses amongst the forest types and this would be expected to result in greater litter production and so SOC contents.
Glenday (2006) found aboveground biomass C densities to be greater than 0–60 cm SOC densities in indigenous Guineo-Congolian rainforest and plantations of exotics, except for young (< 20 year-old) softwood (pine and cypress) plantations, in western Kenya. In our study, there was no significant differences between both aboveground or total biomass C densities and SOC 0–50 cm densities except in the case of the cypress plantations, which had significantly lower aboveground biomass C densities than SOC 0–50 cm densities (paired t-test results not shown). Only the plots from the indigenous forest showed a nearly significant correlation between biomass C and SOC densities; however, the correlation, contrary to expectations, was negative. There have not been any significant forest fires or other forms of disturbance in the indigenous forests that would explain this negative correlation. The lack of significant correlations between biomass C and SOC densities for the three plantation forest types may be suggest that SOC levels in the plantations are not in equilibrium with inputs of organic matter.
SOC densities in Irizi (plot mean 136 Mg C ha–1) were considerably lower than in the other three areas (Ngangao 302, Chawia 253 and Mbololo 234 Mg C ha–1). Calcic material is present in Irizi, as indicated by higher soil pH values (Table 2), and this may have resulted in conditions favouring the decomposition of soil organic matter. SOC densities at Ngangao were higher than those at the other three forest areas, which may be related to lower temperatures in this area and resulting lower rates of soil organic matter decomposition.
4.3 Dependence of C density on climate and site factors
Net primary production around the world has been shown to be positively correlated with MAT and MAP (Leith 1975; O’Neill and DeAngelis 1981). Raich et al. (2006) found aboveground biomass in mature moist tropical forests to significantly increase with MAT but did not study the relationship with MAP. Of the forest type biomass C densities only those of the pine plantations had a significant correlation with climate factors, and that was only with AET (rs = 0.84). This might suggest that water availability is limiting biomass production in the pine plantations; however, pine biomass C density was not correlated with the plant available water capacity of the soil. The overall lack of significant correlations between biomass C density and climate factors in our study is probably due to the limited range in the values of the climate factors within and between forest areas. For example, the range in MAT in our study was only from 17 to 20°C while that in the study by Raich et al. (2006) was from 10 to 30°C. The lack of a significant correlation between biomass C density and the plant available water capacity of the soil for all the forest types may be because of the uptake of cloud precipitation besides soil water (Burgess and Dawson 2004).
Jobbágy and Jackson (2000) found non-agricultural SOC densities from around the world to significantly increase with MAP and to significantly decrease with MAT. Post et al. (1982) also showed that global SOC densities are strongly related to climate factors, with the density generally increasing with precipitation and decreasing with temperature for any particular level of precipitation, and reflecting the importance of evapotranspiration and availability of water as factors controlling SOC levels. While our SOC density values increased with MAP and decreased with MAT (except eucalyptus), only the correlation between SOC density and MAP for pine was significant.
Brown and Lugo (1982) found a significant negative exponential relationship between SOC density and the MAT/MAP ratio, an index of potential water availability, in tropical forests. We too found negative correlations between SOC and PET, but the correlation was only significant in the case of the eucalyptus and pine forest types. SOC densities were not significantly correlated to either AET or to the plant available water capacity (PAWC) of the soil for any of the four forest types. The significant positive correlation between SOC density and elevation for the pine plantations can be attributed to the effect of elevation on precipitation and temperature and thereby on soil organic matter decomposition rates (Raich et al. 2006). The lack of a significant effect of slope (steepness) on SOC density suggests that the differences in slope were insufficient to influence climate conditions at the sites.
Soil clay contents have been shown to be positively correlated to SOC contents, at least in grasslands where the clay particles adsorb dissolved organic matter, stabilize it and protect it from decomposition through the formation of soil aggregates (Parton et al. 1987). However, this relationship may not be universal. Jobbágy and Jackson (2000) found non-agricultural SOC densities from around the world to significantly increase with clay content, but the correlations were weak, and McLauchlan (2006) found clay contents not to be significantly correlated with SOC densities in former agricultural soils. The negative correlations between SOC density and clay content in our study, which was significant in the case of the indigenous forests, is however difficult to explain, especially given the relatively high clay contents in our soils, and deserves further study.
5 Conclusions
The EAM indigenous forest of the Taita Hills generally had higher biomass C and SOC densities than plantations of exotic species, although the differences were not always significant. Biomass C and SOC densities were not correlated to each other, although nearly (and negatively) so in the case of indigenous forests, and there was no significant difference between biomass C and SOC densities, except for cypress aboveground biomass C and SOC. Biomass C densities were not dependent on MAT (except pine plantations) or MAP, which may be attributed to the limited range in the values of these climate factors in the study area. The biomass C densities increased with AET (pine plantations significantly so), which may indicate that biomass production is limited by water availability. SOC densities of all forest types increased with MAP (significantly so for pine plantations), but the relationships with MAT were inconsistent and non-significant. SOC densities decreased with PET, significantly in the case of the eucalyptus and pine plantations, and, contrary to expectations, SOC densities decreased with soil clay contents (significantly so for indigenous forest). Neither biomass C nor SOC densities were significantly correlated with the plant available water capacity of the soil.
It was concluded that EAM indigenous forests sequester more C in to biomass and soil than do 30 to 50-year-old plantations of exotics, but it remains unclear if this is an intrinsic difference between indigenous forest and plantations of exotics or because of insufficient time for SOC levels in plantations to recover after clearance of original indigenous forest.
Acknowledgements
The authors wish to thank the staff from the Kenya Forest Service in Taita County, particularly Jonam Mwandoe, Gabriel Mwarabu and Simeon Mwambeo, for their assistance during fieldwork. We also wish to thank the staff of the Department of Soil Science, University of Nairobi, particularly Prof. C.K.K. Gachene and Martha Kimani, for the soil analysis. The GIS work and making of the map of the study area (Figure 1) was done by Dr. Mika Siljander (Department of Geosciences and Geography, University of Helsinki). The funding support from the KONE Foundation (Finland) and the TAITATOO project (Academy of Finland) for Loice Omoro during the study is gratefully acknowledged as well as the logistical support from Taita Research Station of the University of Helsinki. We also wish to acknowledge the comments made by two anonymous reviewers that improved the paper.
References
African Plants Database. Version 3.4.0. (2013). Conservatoire et Jardin botaniques de la Ville de Genève and South African National Biodiversity Institute, Pretoria. http://www.ville-ge.ch/musinfo/bd/cjb/africa/index.php. [Cited 18 Jun 2010].
Allen R.G., Pereira L.S., Raes D., Smith M. (1998). Crop evapotranspiration. Guidelines for computing crop water requirements. FAO Irrigation and Drainage Paper 56. FAO, Rome. 300 p.
Balland V., Pollacco J.A.P., Arp P.A. (2008). Modeling soil hydraulic properties for a wide range of soil conditions. Ecological Modeling 219: 300–316.
Batjes N.H. (1996). Total carbon and nitrogen in the soils of the world. European Journal of Soil Science 47(2): 151–163.
Batjes N.H. (2004). Soil carbon density and projected changes according to landuse and management: a case study for Kenya. Soil Use and Management 2: 350–356.
Bauernhofer A.H., Hauzenberger C.A., Wallbrecher E., Hoinkes G., Muhongo S., Mathu E.M. (2008). Pan-African deformation in SE Kenya and NE Tanzania geotectonic implications for the development of the North-Central Mozambique belt. African Journal of Science and Technology. Science and Engineering Series 9(1): 50–71.
Beentje H.J. (1988). An ecological and floristical study of the forests of the Taita Hills, Kenya. Utafiti 1: 23–66.
Black J.N. (1956). The distribution of solar radiation over the Earth’s surface. Archiv für Meteorologie, Geophysik und Bioklimatologie B7: 165–189.
Bouyoucos G.J. (1962). Hydrometer method improved for making particle size analysis of soils. Agronomy Journal 53: 464–465.
Brown S. (1997). Estimating biomass and biomass change of tropical forests: a primer. UN FAO Forestry Paper 134. Food and Agriculture Organization, Rome. 55 p.
Brown S., Gaston G. (1995). Use of forest inventories and geographic information systems to estimate biomass density of tropical forests: applications to Tropical Africa. Environmental Monitoring and Assessment 38: 157–168.
Brown S., Lugo A.E. (1982). The storage and production of organic matter in tropical forests and their role in the global carbon cycle. Biotropica 14: 161–187.
Bruijnzeel L.A., Kappelle M., Mulligan M., Scatena F.N. (2010). Tropical montane cloud forests: state of knowledge and sustainability perspectives in a changing world. In: Bruijnzeel L.A., Scatena F.N., Hamilton L.S. (eds.). Tropical montane cloud forests. Science for Conservation and Management. Cambridge University Press. p. 691–740.
Burgess S.S.O., Dawson T.E. (2004). The contribution of fog to the water relations of Sequoia sempervirens (D. Don): foliar uptake and prevention of dehydration. Plant, Cell and Environment 27(8): 1023–1034.
Burgess N.D., Butynski T.M., Cordeiro N.J., Doggart N.H., Fjeldså J., Howell K.M., Kilahama F.B., Loader S.P., Lovett J.C., Mbilinyi B., Menegon M., Moyer D.C., Nashanda E., Perkin A., Rovero F., Stanley W.T., Stuart S.N. (2007). The biological importance of the Eastern Arc Mountains of Tanzania and Kenya. Biological Conservation 134: 209–231.
Bytebier B. (2001). Taita Hills Biodiversity Project report. National Museums of Kenya, Nairobi. 47 p.
Cairns M.A., Brown S., Helmer E.H., Baumgardner G.A. (1997). Root biomass allocation in the world’s upland forests. Oecologia 111: 1–11.
Chave J., Andalo C., Brown S., Cairns M.A., Chambers J.Q., Eamus D., Fölster H., Fromard F., Higuchi N., Kira T., Lescure J.P., Nelson B.W., Ogawa H., Puig H., Riéra B., Yamakura T. (2005). Tree allometry and improved estimation of carbon density and balance in tropical forests. Oecologia 145: 87–99.
Chege J., Byteibier B. (2005). Vegetation structure of four small fragments in Taita Hills, Kenya. Journal of East African Natural History 94(1): 231–234.
Clark B.J.F., Pellikka P.K.E. (2005). The development of a land use change detection methodology for mapping the Taita Hills, South-East Kenya. Proceedings of the 31st International Symposium of Remote Sensing of the Environment, 20–24 June 2005, St. Petersburg, Russia. CD-Rom publication.
Cole D.W., Rapp M. (1981). Elemental cycling in forest ecosystems. In: Reichle D.E. (ed.). Dynamic properties of forest ecosystems. Cambridge University Press, London. p. 341–409.
Conservation International. (2005). Biodiversity hotspots. http://www.biodiversityhotspots.org/Pages/default.aspx. [Cited 8 Feb 2012].
Dean J.D., Moran J., Grace J. (1996). Biomass relationships for tree species in regenerating semi-deciduous tropical moist forest in Cameroon. Forest Ecology and Management 88 (3): 215–225.
Dixon R.K., Brown S., Houghton R.A., Solomon A.M., Trexler M.C., Wisniewski J. (1994). Carbon pools and flux of global forest ecosystems. Science 263: 185–190.
EAWL. (2001). The Taita Biodiversity Conservation Project. http://www.easternarc.or.tz/groups/webcontent/documents/pdf/THBP_final_report.pdf. [Cited 8 Feb 2012].
FAO. (2005). New_LocClim: local climate estimator. Version 1.10. Environmental and Natural Resources, Working Paper 20. [CD-Rom].
Glenday J. (2006). Carbon storage and emissions offset potential in an East African tropical rainforest. Forest Ecology and Management 235: 72–83.
Grieser J., Gommes R., Bernardi M. (2006). New LocClim – the local climate estimator of FAO. Geophysical Research Abstracts 8, 08305. 2 p.
Guo L.B., Gifford R.M. (2002). Soil carbon stocks and land use change: a meta analysis. Global Change Biology 8(4): 345–360.
Himberg N., Omoro L., Pellikka P., Luukkanen O. (2009). The benefits and constraints of participating in forest management. The case of Taita Hills, Kenya. Fennia 187: 61–76.
IPCC. (2001). Climate change 2001: the scientific basis. Cambridge, University Press, UK.
IPCC. (2003). IPCC good practice guidance for LULUCF. The Institute for Global Environmental Strategies (IGES). p. 3.168.
IPCC. (2007). Summary for policymakers. “Climate change 2007: mitigation”. Contribution of Working Group III to the Fourth Assessment Report of the IPCC. p. 23.
Irawan S., Tacconi L. (2009). Reducing emissions from deforestation and forest degradation (REDD) and decentralized forest management. International Forestry Review 11(4): 427–438.
Jaetzold R., Schmidt H. (1983). Farm management handbook of Kenya. Vol II. East Kenya. Ministry of Agriculture, Kenya. p. 245–285.
Jobbágy E.J., Jackson R.B. (2000). The vertical distribution of soil organic carbon and its relation to climate change and vegetation. Ecological Applications 10(2): 423– 436.
Kaiser K., Gugenberger G. (2003). Mineral surfaces and soil organic matter. European Journal of Soil Science 54: 219–236.
Kasel S., Bennet L.T. (2007). Land-use history, forest conversions and soil organic carbon in pine and native forests of south eastern Australia. Geoderma 137(3–4): 401–413
Körner C. (1994). Biomass fractionation in plants: a reconsideration of definition based on plant functions. In: Roy J., Garnier E. (eds.). A whole plant perspective on carbon-nitrogen interactions. SBP Academic Publishing, The Hague. p. 173–185.
Liao C., Luo Y., Fang C., Li B. (2010). Ecosystem carbon stock influenced by plantation practice: implications for planting forests as a measure of climate change mitigation. PLoS ONE 5(5): e10867. doi:10.1371/journal.pone.0010867.
Lieth H. (1975). Modeling the primary productivity of the world. In: Lieth H., Whittaker R.H. (eds.). Primary productivity of the biosphere. Springer-Verlag, New York. p. 237–263.
Lemma B., Kelja D.B., Nilsson I., Olsson M. (2006). Soil carbon sequestration under exotic tree species in southwestern highlands of Ethiopia. Geoderma 136(3–4): 886–898.
Lovett J.C. (1998). Importance of the Eastern Arc Mountains for vascular plants. Journal of East African Natural History 87(1): 59–74.
Lugo A.E. (1992). Comparison of tropical tree plantations with secondary forest of similar age. Ecological Monographs 62: 1–41.
Madoffe S., Hertel G.D., Rogers P., O’Connell B., Killenga R. (2006). Monitoring of selected Eastern Arc forests in Tanzania. African Journal of Ecology 44: 171–177.
Mahli Y., Baldocchi D.P., Jarvis P.G. (1999). The carbon balance of tropical, temperate and boreal forests. Plant, Cell and Environment 22: 715–740.
McLauchlan K.K. (2006). Effects of soil texture on soil carbon and nitrogen dynamics after cessation of agriculture. Geoderma 136: 289–299.
Munishi P.K.T., Shear T.H. (2004). Carbon storage in Afromontane rain forests of the Eastern Arc mountains of Tanzania: their net contribution to atmospheric carbon. Journal of Tropical Forest Science 16(1): 78–93.
Myers N., Mittermeier R.A., Mittermeier C.G., da Fonseca G.A.B., Kent J. (2000). Biodiversity hotspots for conservation priorities. Nature 403 (6772): 853−858.
Newark W.D. (2002). Conserving biodiversity in East African forests: a study of the Eastern Arc Mountain. Ecological Studies 155. Springer. 197 p.
O’Neill R.V., De Angelis D.L. (1981). Comparative productivity and biomass relations of forest ecosystems. In: Reichle D.E. (ed.). Dynamic properties of forest ecosystems. Cambridge University Press, Cambridge. p. 411–449.
Okalebo J.R, Gathua K.W., Woomer P.L. (2002). Laboratory methods of soil and plant analysis: a working manual. Second edition. TSBF-CIAT and SACRED Africa. Nairobi, Kenya.
Omoro L.M.A., Pellikka P.K.E., Rogers P.C. (2010). Tree species diversity, richness, and similarity between exotic and indigenous forests in the cloud forests of Eastern Arc Mountains, Taita Hills, Kenya. Journal of Forestry Research 21(3): 255–264.
Parton W.J., Schimel D.S., Cole C.V., Ojima D.S. (1987). Analysis of factors controlling soil organic matter levels on Great Plains grasslands. Soil Science Society of America Journal 51: 1173–1179.
Pellikka P., Lötjönen M., Siljander M., Lens L. (2009). Airborne remote sensing of spatiotemporal change (1955–2004) in indigenous and exotic forest covering the Taita Hills, Kenya. International Journal of Applied Earth Observations and Geoinformation 11(4): 221–232.
Post W.M., Kwon K.C. (2000). Soil carbon sequestration and land use changes: processes and potential. Global Change Biology 6(3): 317–327.
Post W.M., Emanuel W.R., Zinke P.J., Strangenberber A.G. (1982). Soil carbon pools and world life zones. Nature 298: 156–159.
Prescott C.E., Zabek L.M, Staley C.L., Kabzems R.K. (2000). Decomposition of broadleaf and needle litter in forests of British Columbia: influences of litter type, forest type, and litter mixtures. Canadian Journal of Forest Research 30(11): 1742–1750.
Raich J.W., Russell A.E., Kitayama K., Parton J.W., Vitousek P.M. (2006). Temperature influences carbon accumulation in moist tropical forests. Ecology 87(1): 76–87.
Reyes G., Brown S., Chapman J., Lugo A.E. (1992). Wood densities of tropical tree species. General Technical Report SO-88. USDA Forest Service, Southern Forest Experiment Station, New Orleans, LA. p. 15.
Rogers P.C. (1996). Disturbance ecology and forest management: a review of the literature. INT-GTR-336. USDA, Forest Service, Intermountain Research Station, Ogden, UT. 16 p.
Rogers P.C., O´Connell B., Mwangombe J., Madoffe S., Hertel G. (2008). Forest health monitoring in the Ngangao forest, Taita Hills, Kenya: a five year assessment of change. Journal of East African Natural History 97(1): 3–17.
Rogo L., Oguge N. (2000). The Taita Hills forest remnants: a disappearing world heritage. Ambio 29: 522–523.
Saxton K.E., Rawls W.J., Romberger J.S., Papendick R.I. (1986). Estimating generalized soil-water characteristics from texture. Soil Science Society of America Journal 50:1031–1036.
Salminen H. (2004). A geographic overview of Taita Hills, Kenya. In: Pellikka P., Ylhäisi J., Clark B. (eds.). Taita Hills and Kenya, 2004. Seminar, reports and journal of a field excursion to Kenya. Expedition reports of the Department of Geography, University of Helsinki 40: 31–38.
Schimel D.S., Braswell B.H., Holland E.A., McKeown R., Ojima D.S., Painter T.H., Parton W.J., Townsend A.R. (1994). Climatic, edaphic and biotic controls over storage and turnover of carbon in soils. Global Biogeochemical Cycles 8: 279–293.
Schlesinger W.H. (1997). Biogeochemistry: an analysis of global change. Academic Press. xiii + 588 p.
Sombroek W.G., Nachtergaele F.O., Hebel A. (1993). Amounts, dynamics and sequestering of carbon in tropical and subtropical soils. Ambio 22: 417–426.
Stadmüller T. (1987). Cloud forests in the humid tropics: a bibliographic review. CATIE, Turrialba, Costa Rica. 81 p.
Starr M. (1999). WATBAL: a model for estimating monthly water balance components, including soil water fluxes. In: Kleemola S, Forsius M. (eds.). 8th Annual report 1999 UN ECE ICP integrated monitoring. The Finnish Environment 325: 31–35.
UNFCC. (2007). Report of the conference of the parties on its thirteenth session, held in Bali platform of action. http://blogs.law.widener.edu/climatechangelaw/files /2010/02/bali-action-plan.pdf. [Cited 15 Jun 2010].
UNFCC. (2009). Report of the conferences of the Parties of its 15th Session, Copenhagen. Part 2: Actions taken by the conference of the parties at its 15th Session.
UNFCC. (2010). Report of the conferences of the Parties of its 16th Session, Cancun. Part 2: Actions taken by the conference of the parties at its 16th Session.
USDA Forest Service. (2007). Field instructions for the annual inventory of Washington, Oregon, and California 2007, based on version 3.0 of the National core procedures manual. http://www.fs.fed.us/pnw/fia/publications/fieldmanuals.shtml. [Cited 28 Jul 2009].
Walkley A., Black I.A. (1943). An examination of Degtjareff method for determining soil organic matter and proposed modification of the chromic acid titration method. Soil Science 37: 29–37.
Wang Q., Wang S., Fan B., Yu X.J. (2007). Litter production, leaf litter decomposition and nutrient return in Cunninghamia lanceolata plantations in south China: effect of planting conifers with broadleaved species. Plant and Soil 297: 201–211.
Zanne A.E., Lopez-Gonzalez G., Coomes D.A., Ilic J., Jansen S., Lewis S.L., Miller R.B., Swenson N.G., Wiemann M.C., Chave J. (2009). Global wood density database. Dryad. http://hdl.handle.net/10255/dryad.235. [Cited 4 Mar. 2011].
Total of 77 references
