Ilze Matisone  ,
Roberts Matisons,
Māris Laiviņš,
Tālis Gaitnieks
,
Roberts Matisons,
Māris Laiviņš,
Tālis Gaitnieks
Statistics of ash dieback in Latvia
Matisone I., Matisons R., Laiviņš M., Gaitnieks T. (2018). Statistics of ash dieback in Latvia. Silva Fennica vol. 52 no. 1 article id 9901. https://doi.org/10.14214/sf.9901
Highlights
- Dynamics of ash dieback during 2005–2015 were summarized
- The area of ash dominated stands decreased twofold
- The number of mature ash trees and their standing volume decreased by 53.1 and 69.9%, compared to 2005, respectively
- The mortality of trees was higher during the first part of the survey, the decrease of standing volume culminated later.
Abstract
Dieback of the common ash (Fraxinus excelsior L.) has been spreading throughout Europe since the 1990s, causing severe ecological and economical consequences; however, detailed statistics on its dynamics have been published rarely. This paper presents the dynamics of mature ash-dominated stands in Latvia for the period 2005–2015. Data from the national forest inventory and a permanent sampling plot network were summarised. According to the official statistics, the dieback has caused a twofold decrease in area of the ash stands (from 21 891 to 13 011 ha, which respectively comprised ca. 0.8 to ca. 0.4% of the total forest area). The official statistics on standing volume appeared biased, as they did not account for increased mortality. According to the permanent sampling plots, standing volume and stand density have been affected even more, having decreased by 53.1 and 69.9%, respectively, compared to 2005 (the stand density and standing volume of ash in 2015 was 77 individuals ha–1 and 151 m3 ha–1, respectively). The mortality of the trees has not been stable. Stand density decreased faster during 2005–2009 compared to 2010–2015, with mortality rates of 9.6 and 8.2% year–1, respectively. In contrast, the decrease in standing volume in 2005–2009 was slower than in 2010–2015 (mortality rates were 4.7 and 7.7% year–1, respectively) because trees with smaller dimensions were more susceptible to the dieback. Nevertheless, the observed mortality rates clearly indicate negative prospects for ash stands in Latvia.
Keywords
mortality rate;
National Forest Inventory;
Fraxinus excelsior;
permanent sampling plots
-
Matisone,
Latvian State Forest Research Institute (LSFRI) Silava, Rigas str. 111, Salaspils, Latvia, LV2169
E-mail
ilze.matisone@silava.lv
- Matisons, Latvian State Forest Research Institute (LSFRI) Silava, Rigas str. 111, Salaspils, Latvia, LV2169 E-mail robism@inbox.lv
- Laiviņš, Latvian State Forest Research Institute (LSFRI) Silava, Rigas str. 111, Salaspils, Latvia, LV2169 E-mail maris.laivins@silava.lv
- Gaitnieks, Latvian State Forest Research Institute (LSFRI) Silava, Rigas str. 111, Salaspils, Latvia, LV2169 E-mail talis.gaitnieks@silava.lv
Received 4 November 2017 Accepted 1 February 2018 Published 2 February 2018
Views 69507
Available at https://doi.org/10.14214/sf.9901 | Download PDF

1 Introduction
In Europe, the common ash (Fraxinus excelsior L.) is a widespread, economically and ecologically important tree species (Dobrowolska et al. 2011). In the late 1990s, ash dieback broke out in Poland (Kowalski 2006) and Lithuania (Juodvalkis and Vasiliauskas 2002), rapidly spreading across Europe, and, at present, more than 20 countries have been affected (Vasaitis and Enderle 2017). After the initial symptoms, e.g., wilting of leaves and shoots (Schumacher et al. 2010), the infected trees can die within a few months or years (Bakys et al. 2011; Bengtsson et al. 2014); however, some trees may show chronic symptoms, or even some signs of recovery (Schumacher et al. 2010; Bengtsson et al. 2014). The ascomycete Hymenoscyphus fraxineus (T. Kowalski) is the primary agent of the dieback (Kowalski 2006), while the secondary infection, often by Armillaria spp. that colonise root collars, causes tree death and uprooting (Skovsgaard et al. 2010; Bakys et al. 2011).
Ash dieback is usually large-scale, reducing densities of ash stands down to a few individuals per hectare (Bengtsson et al. 2014; Pliūra et al. 2015). Consequently, it has a pronounced economic impact (Thomsen and Skovsgaard 2012; Worell 2013). Still, publication of national or regional statistics concerning the dynamics of this are mostly lacking, except for some scarce reports, derived from data from national forestry information systems (cf. Worell 2013; Vasaitis and Enderle 2017), which, however, might not be quite accurate. The aim of this study was to summarise the statistics on the dynamics of ash dieback in Latvia, combining data from forest inventory (FI) and a permanent sampling plot (PSP) network for the period 2005–2015. We hypothesised that ash mortality was higher at the beginning of the dieback, decreasing afterwards.
2 Material and methods
2.1 Datasets
The FI data on standing volume (living) and area of ash-dominated stands in Latvia, (Fig. 1), were acquired from the Latvia State Forest Service database. The data for 2005–2015, and additionally for 1998, when the maximum coverage of ash forests was observed, were used.
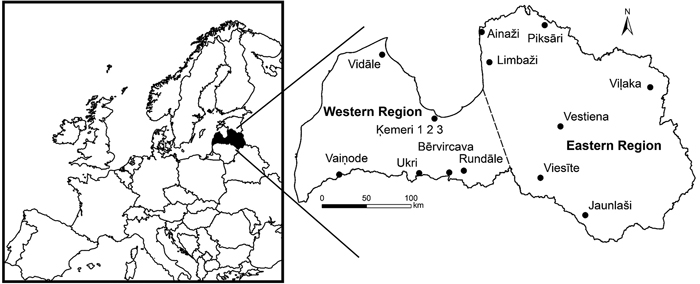
Fig. 1. Location of the studied permanent sampling plots. Broken line indicates arbitrarily division of Latvia in two regions with differing growth patterns of broadleaved trees.
Empirical data were acquired from 15 PSPs, scattered over the territory of Latvia (Fig. 1). The PSPs were established in 51- to 138-year-old, uneven-aged stands, which have been dominated by ash, yet have been subjected to different degrees of dieback. The sampled stands grow on flat terrain on fertile mineral soil. In some stands, spring waterlogging occurred. The climatic conditions were temperate, with mean annual temperature (± standard error) in the western and eastern parts of Latvia of 7.0 ± 1.4 and 6.1 ± 1.6 °C, respectively; January was the coldest (–1.8 ± 0.7 and –4.5 ± 1.0 °C, respectively) and July was the warmest (17.4 ± 0.3 and 17.9 ± 0.3 °C, respectively) month (Harris et al. 2014). The mean annual precipitation was 706 ± 67 mm; the highest monthly precipitation occurred in the summer months (June–September; 72 ± 29 mm).
Each PSP was a circle with a radius of 15 m (ca. 706 m2). Within each PSP, all trees, including deadwood, with stem diameter at breast height (DBH) of ≥ 6 cm were measured. For each tree and log/snag, DBH and height/length (H) were recorded, with an accuracy of 1 cm and 50 cm, respectively. The measurements were repeated in 2005, 2010, and 2015.
2.2 Data analysis
The standing volume of the PSPs was calculated, based on stemwood volume (V, m3 ha–1) of individual trees, according to Liepa (1996):
![]()
where ψ = 0.8530∙10–4, α = 0.73077, β = 0.0682, and φ = 1.91124 are the coefficients, H was height of tree (length of stem) and DBH was stem diameter at breast height. To assess the mortality of ash during each of the periods analysed, the mortality rate, r%, was calculated:

where N1 was the amount (number, or standing volume, of trees) of ash at the beginning of the observation period, Nt was the amount of ash at the end of the observation period, t was the length of the observation period, in years. Considering the regional diversity in growth patterns of broadleaved trees in Latvia (Matisons et al. 2012), the differences in ash mortality between the western and eastern parts of Latvia were assessed, for each period, by generalised linear mixed model, applying the binomial distribution of residuals and a “logit” link function. Sampling plot was used as a random effect. Regional differences in standing volume were assessed by t-test. Data were analysed using the program R v. 3.3.3 (R Core Team 2016), applying the “lme4” package (Bates et al. 2015).
3 Results
According to the FI data, the dieback decreased the area of ash-dominated stands in Latvia nearly twofold, from 21 891 ha (ca. 0.8% of the forest area) in 1998, when the maximum was observed, to 13 011 ha (ca. 0.4% of the forest area) in 2015 (Table 1). The decrease was slightly faster (ca. 6%) in the western part of Latvia, where the total area of ash stands was higher (not shown). Surprisingly, the official (FI) statistics indicated a gradual increase in the standing volume of the remaining ash-dominated stands in Latvia during 2005–2015 (Table 1), contradicting the dieback.
| Table 1. Statistics of ash stands in Latvia according to data from Latvia State Forest Service and permanent sampling plots for the period 2005–2015. The 95% confidence intervals are shown for the permanent sampling plot data. | |||
| Year | |||
| 2005 | 2010 | 2015 | |
| Latvia State Forest Service data | |||
| Total stand area, ha | 18 315.7 | 16 263.5 | 13 673.71 |
| Total standing stock m3 | 373 7303 | 369 8663 | 341 0624 |
| Mean standing volume, m3 ha–1 | 204.05 | 227.42 | 249.43 |
| Permanent sampling plot data | |||
| Living | |||
| Stand density, individuals ha–1 | 256 ± 55 | 136 ± 45 | 77 ± 32 |
| Standing volume, m3 ha–1 | 322 ± 89 | 246 ± 77 | 151 ± 59 |
| Deadwood | |||
| Stand density, individuals ha–1 | 74 ± 50 | 178 ± 82 | 233 ± 79 |
| Standing volume, m3 ha–1 | 18 ± 14 | 119 ± 54 | 212 ± 66 |
In the PSPs at the beginning of the survey in 2005, 340 ashes of different dimensions were accounted, of which 69 were already dead. In the second and third surveys, only 52.0%, and 30.6%, respectively, of the initially accounted trees had survived (Table 1). The survival of trees was similar between the regions (p-value > 0.10). Accordingly, in 2005–2009 and 2010–2015, r% was 9.6 and 8.2% year-1. The r% calculated for the entire period (2005–2015) was ca. 6.9% year-1. During the survey, only six new ashes with DBH ≥ 6 cm were accounted in the PSPs.
In 2005, the standing volume of living ash in the PSPs was ca. 320 m3 ha–1 (Table 1), and stand density was ca. 260 trees ha–1. The volume of ash deadwood was low, ca. 18 m3 ha–1. In the following surveys (in 2010 and 2015), the standing volume of living trees decreased to 76.4 and 46.9% of the initially accounted, respectively. The volume of deadwood increased accordingly (up to 212 m3 ha–1 in 2015). The changes in the standing volume of ash were similar for the regions (p-value ≥ 0.06). The r%, calculated based on standing volume, was lower in the first than the second observation period (4.7 and 7.7% year–1, respectively), and the r% for 2005–2015 was 5.3% year–1.
4 Discussion
In the Baltics, ash dieback has been observed for more than 15 years (Juodvalkis and Vasiliauskas 2002). Despite this, the decrease in stand area (by ca. 40% in 17 years; Table 1) in Latvia was slightly lower, compared to the neighbouring Lithuania and Central Europe, where ash forests were more common (cf. Vasaitis and Enderle 2017). A slower decrease in the area of stands (Table 1), particularly in the eastern part of Latvia, might be partly related to lower connectivity between them (Liepiņš et al. 2016), which might have limited the spread of the disease. The official statistics (FI data) on the standing volume of ash, which showed a stable increase (Table 1), were obviously biased. The bias can be explained by the growth models employed in the calculation system to extrapolate stand growth between inventories, which were based solely on site type and age, yet did not account for increased mortality due to the disease. Nevertheless, the statistics concerning the area of the stands are credible, as they are based on verified observations (inventories). On the other hand, observation data from a limited number of PSPs might not be completely representative of diverse stands across the country.
The overall mortality of affected ash in Latvia (Table 1) was lower than in Lithuania and Germany (6.9 vs. 8.7 and 10.1% year–1, respectively; cf. Lenz et al. 2016; Vasaitis and Enderle 2017), suggesting a higher resistance of the Latvian ash stands against the pathogens. Still, it was considerably higher than observed for “veteran” (i.e., long lived; ca. 1% year–1) trees in Sweden (Bengtsson 2014), which, apparently, are the most resistant. The decrease in standing volume (r% = 5.3% year–1; Table 1) was slower compared to stand density (number of ash), which might be explained by the presence of “veteran” trees in the studied population.
As hypothesised, the mortality of the affected ash, as indicated by changes in the number of trees, was higher at the beginning of dieback (Table 1), indicating that most of the population was highly sensitive to the pathogen (McKinney et al. 2014), and hence died promptly. The remaining trees, apparently, had higher resistance (Bengtsson 2014), explaining the decreased mortality (Table 1). The mortality rate calculated for the standing volume was higher in the second period of observation (Table 1), indicating that the larger, thus more vigorous, trees were able to survive longer (Skovsgaard et al. 2010; McKinney et al. 2011). Potentially, the larger trees were able to resist H. fraxineus, but the secondary agents (e.g., Armillaria spp.) likely caused their death (Bakys et al. 2011; Thomsen and Skovsgaard 2012).
Based on the decrease in stand area and the mortality rate of ash, it could be concluded that the prospects for the species in Latvia is clearly negative. Some regeneration of the affected stands was observed, as a few new trees were registered during the surveys, yet the rate of recruitment still appeared insufficient to counteract the dieback. Still, the decrease in mortality rate suggests that the most vigorous trees might survive, providing a gene source for a new generation of more resistant trees to form in the longer term (McKinney et al. 2014).
Acknowledgements
This study was supported by the Latvian State Forest project “Ash forests destruction and regeneration in Latvia” [No. 5.5.-5.1_0017_101_14_28] and by the Forest Sector Competence Centre project “Methods and technologies for increasing forest capital value” [No. L-KC-11-0004].
References
Bakys R., Vasiliauskas R., Ihrmark K., Stenlid J., Menkis A., Vasaitis R. (2011). Root rot, associated fungi and their impact on health condition of declining Fraxinus excelsior stands in Lithuania. Scandinavian Journal of Forest Research 26(2): 128–135. https://doi.org/10.1080/02827581.2010.536569.
Bates D., Maechler M., Bolker B., Walker S. (2015). Fitting linear mixed-effects models using lme4. Journal of Statistical Software 67(1): 1–48. https://doi.org/10.18637/jss.v067.i01.
Bengtsson S.B.K., Barklund P., von Brömssen C., Stenlid J. (2014). Seasonal pattern of lesion development in diseased Fraxinus excelsior infected by Hymenoscyphus pseudoalbidus. PLoS ONE 9(4): e76429. https://doi.org/10.1371/journal.pone.0076429.
Bengtsson V. (2014). Askskottsjuka – ett fortsatt hot mot våra skyddsvärda träd? [Ash dieback – a continuing threat to our veteran trees?]. Naturvårdsenheten, report N 17.
Dobrowolska D., Hein S., Oosterbaan A., Wagner S., Skovsgaard J.P. (2011). A review of European ash (Fraxinus excelsior L.): implications for silviculture. Forestry 84(2): 133–148. https://doi.org/10.1093/forestry/cpr001.
Harris I., Jones P.D., Osborn T.J., Lister D.H. (2014). Updated high-resolution grids of monthly climatic observations – the CRU TS3.10 Dataset. International Journal of Climatology 34(3): 623–642. https://doi.org/10.1002/joc.3711.
Juodvalkis A., Vasiliauskas A. (2002). Lietuvos uosynu džiuvimo apimtys ir jas lemiantys veiksniai. [The extent and possible causes of dieback of ash stands in Lithuania]. LZUU mokslo darbai, Biomedicinos mokslai 56: 17–22. [In Lithuanian].
Kowalski T. (2006). Chalara fraxinea sp. nov. associated with dieback of ash (Fraxinus excelsior) in Poland. Forest Pathology 36(4): 264–270. https://doi.org/10.1111/j.1439-0329.2006.00453.x.
Lenz H.D., Bartha B., Straßer L., Lemme H. (2016). Development of ash dieback in South-Eastern Germany and the increasing occurrence of secondary pathogens. Forests 7(2): 41. https://doi.org/10.3390/f7020041.
Liepa I. (1996). Pieauguma mācība. [Incrementology]. Latvijas Lauksaimniecības universitāte, Jelgava. 123 p. [In Latvian].
Liepiņš K., Liepiņš J., Matisons R. (2016). Growth patterns and spatial distribution of common ash (Fraxinus excelsior L.) in Latvia. Proceedings of the Latvian Academy of Sciences, Section B, 70(3): 109–115. https://doi.org/10.1515/prolas-2016-0018.
Matisons R., Elferts D., Brūmelis G. (2012). Changes in climatic signals of English oak tree-ring width and cross-section area. Forest Ecology and Management 279: 34–44. https://doi.org/10.1016/j.foreco.2012.05.029.
McKinney L.V., Nielsen L.R., Hansen J.K., Kjær E.D. (2011). Presence of natural genetic resistance in Fraxinus excelsior (Oleaceae) to Chalara fraxinea (Ascomycota): an emerging infectious disease. Heredity 106: 788–797. https://doi.org/10.1038/hdy.2010.119.
McKinney L.V., Nielsen L.R., Collinge D.B., Kjær E.D. (2014). The ash dieback crisis: genetic variation in resistance can prove a long-term solution. Plant Pathology 63(3): 485–499. https://doi.org/10.1111/ppa.12196.
Pliūra A., Lygis V., Suchockas V., Marčiulyniene D., Suchockas V., Bakys R. (2015). Genetic variation of Fraxinus excelsior half-sib families in response to ash dieback disease following simulated spring frost and summer drought treatments. iForest 9: 12–22. https://doi.org/10.3832/ifor1514-008.
R Core Team. (2016). R: a language and environment for statistical computing. R Foundation for Statistical Computing, Vienna, Austria. http://www.R-project.org/. [Cited 15 October 2017].
Schumacher J., Kehr R., Leonhard S. (2010). Mycological and histological investigations of Fraxinus excelsior nursery saplings naturally infected by Chalara fraxinea. Forest Pathology 40(5): 419–429. https://doi.org/10.1111/j.1439-0329.2009.00615.x.
Skovsgaard J.P., Thomsen I.M., Skovsgaard I.M., Martinussen T. (2010). Associations among symptoms in even-aged stands of ash (Fraxinus excelsior L.). Forest Pathology 40(1): 7–18. https://doi.org/10.1111/j.1439-0329.2009.00599.x.
Thomsen I.G., Skovsgaard J.P. (2012). Silvicultural strategies for forest stands with ash dieback. Fortschutz Aktuell 55: 18–20.
Vasaitis R., Enderle R. (eds.) (2017). Dieback of European ash (Fraxinus spp.): consequences and guidelines for sustainable management. The Report on European Cooperation in Science and Technology (COST), Action FP1103 FRAXBACK, SLU Service/Repro, Uppsala. 320 p.
Worell R. (2013). An assessment on potential impact of ash dieback in Scotland. Forestry Commission Scotland. http://scotland.forestry.gov.uk/images/corporate/pdf/chalara-impact-report-scotland.pdf. [Cited 23 October 2017].
Total of 21 references.
