Panu Halme  ,
Jenna Purhonen,
Emma-Liina Marjakangas,
Atte Komonen,
Katja Juutilainen,
Nerea Abrego
,
Jenna Purhonen,
Emma-Liina Marjakangas,
Atte Komonen,
Katja Juutilainen,
Nerea Abrego
Dead wood profile of a semi-natural boreal forest – implications for sampling
Halme P., Purhonen J., Marjakangas E.-L., Komonen A., Juutilainen K., Abrego N. (2019). Dead wood profile of a semi-natural boreal forest – implications for sampling. Silva Fennica vol. 53 no. 4 article id 10010. https://doi.org/10.14214/sf.10010
Highlights
- We constructed a full dead wood profile of a semi-natural boreal forest
- Abundance-diameter distributions were different among tree species
- Extensive sampling is needed if focus on large dead wood and rare tree species.
Abstract
Dead wood profile of a forest is a useful tool for describing forest characteristics and assessing forest disturbance history. Nevertheless, there are few studies on dead wood profiles, including both coarse and fine dead wood, and on the effect of sampling intensity on the dead wood estimates. In a semi-natural boreal forest, we measured every dead wood item over 2 cm in diameter from 80 study plots. From eight plots, we further recorded dead wood items below 2 cm in diameter. Based on these data we constructed the full dead wood profile, i.e. the overall number of dead wood items and their distribution among different tree species, volumes of different size and decay stage categories. We discovered that while the number of small dead wood items was immense, their number dropped drastically from the diameter below 1 cm to diameters 2–3 cm. Different tree species had notably different abundance-diameter distribution patterns: spruce dead wood comprised most strikingly the smallest diameter fractions, whereas aspen dead wood comprised a larger share of large-diameter items. Most of the dead wood volume constituted of large pieces (>10 cm in diameter), and 62% of volume was birch. The variation in the dead wood estimates was small for the numerically dominant tree species and smallest diameter categories, but high for the sub-dominant tree species and larger size categories. In conclusion, the more the focus is on rare tree species and large dead wood items, the more comprehensive should the sampling be.
Keywords
coarse woody debris;
coniferous forest;
forest structure;
fine woody debris;
forest disturbance dynamics;
saproxylic
-
Halme,
Department of Biological and Environmental Science, University of Jyväskylä, P.O. Box 35, FI-40014 University of Jyväskylä, Finland; School of Resource Wisdom, University of Jyväskylä, P.O. Box 35, FI-40014 University of Jyväskylä, Finland
E-mail
panu.halme@jyu.fi
- Purhonen, Department of Biological and Environmental Science, University of Jyväskylä, P.O. Box 35, FI-40014 University of Jyväskylä, Finland E-mail jenna.e.i.purhonen@jyu.fi
- Marjakangas, Centre for Biodiversity Dynamics, Department of Biology, Norwegian University of Science and Technology, N-7491 Trondheim, Norway E-mail emma-liina.marjakangas@ntnu.no
- Komonen, Department of Biological and Environmental Science, University of Jyväskylä, P.O. Box 35, FI-40014 University of Jyväskylä, Finland; School of Resource Wisdom, University of Jyväskylä, P.O. Box 35, FI-40014 University of Jyväskylä, Finland E-mail atte.komonen@jyu.fi
- Juutilainen, Department of Biological and Environmental Science, University of Jyväskylä, P.O. Box 35, FI-40014 University of Jyväskylä, Finland E-mail kjuutilainen@yahoo.com
- Abrego, Department of Agricultural Sciences, University of Helsinki, P.O. Box 27, FI-00014 University of Helsinki, Finland E-mail nerea.abrego@helsinki.fi
Received 3 June 2018 Accepted 18 September 2019 Published 14 October 2019
Views 118841
Available at https://doi.org/10.14214/sf.10010 | Download PDF

Supplementary Files
1 Introduction
Dead wood is a crucial element of all forest ecosystems and a large proportion of forest species is dependent on dead wood at some life stage (Harmon et al. 1986; Siitonen 2001; Stokland et al. 2012). In natural boreal forests, dead wood volumes are large (Esseen et al. 1997; Siitonen 2001) and typically vary between 40–170 m3 per hectare (Aakala 2010). Much larger volumes can be present after stand-replacing disturbances such as storms (Nilsson et al. 2004), fires (Spies et al. 1988), or bark beetle outbreaks (Komonen et al. 2011). In managed boreal forests, by contrast, the amount of dead wood is usually more than ten-fold smaller (Siitonen 2001; but see Eräjää et al. 2010). Due to this reduction in dead wood amount, a large number of dead wood dependent species has become threatened in boreal forest ecosystems (Rassi et al. 2001; Siitonen 2001).
The importance of dead wood for forest functioning and biodiversity is widely acknowledged. It is a common practice to monitor dead wood in national forest inventories (Woodall and Monleon 2008; Finnish Forest Research Institute 2014; Jonsson et al. 2016), in quality control of the implementation of management guidelines (Päivinen et al. 2011), and as part of forest certification systems (Forest Stewardship Council 2010). Dead wood is also measured as an explanatory variable in studies on forest disturbance dynamics (Kuuluvainen 2002), forest biodiversity (Junninen and Komonen 2011) or ecosystem functioning (Gamfeldt et al. 2013). In this paper, our focus is on stand-level measurements of dead wood, which are typical in forest biodiversity research.
Dead wood inventories have traditionally focused on coarse woody debris (CWD, base diameter ≥ 10 cm); partly because the large logs comprise most biomass, and partly because a large proportion of the threatened dead wood dependent species requires large logs (Tikkanen et al. 2006; Junninen and Komonen 2011). Fine woody debris (FWD, base diameter < 10 cm) has been rarely surveyed, although in managed landscapes a large proportion of dead wood is FWD (Eräjää et al. 2010; Abrego and Salcedo 2013). However, interest in FWD has increased with the growing pressure for forest biofuel extraction (Bouget et al. 2012) and in the USA, for example, FWD has been monitored nationwide to assess fire risk and carbon stocks (Woodall and Liknes 2008; Woodall and Monleon 2008). The effect of FWD removal is negative on many species groups such as lichens, bryophytes and fungi (Kruys and Jonsson 1999), beetles (Grove 2009), spiders (Castro and Wise 2009) and small mammals (Manning and Edge 2008). FWD also hosts unique species assemblages of beetles and fungi (Ferro et al. 2009; Bässler et al. 2010; Brin et al. 2011; Juutilainen et al. 2014) and can be an important complementary resource to CWD for wood-inhabiting fungi in managed forests (Nordén et al. 2004; Küffer et al. 2008).
Dead wood profile classifies dead wood items based on their size and decay. Dead wood profile of a forest is a useful tool to describe forest characteristics (e.g. dead wood heterogeneity) and to assess forest disturbance history (e.g. dead wood continuity over 200–500 years) (Stokland 2001). Likewise, dead wood profile may also function as biodiversity indicator. Dead wood profile can be constructed based on either tree numbers or volumes. The volume-based dead wood profiling is based on recording the volume of all – or a sample of – dead trees in relation to their diameter classes and decay stages in a given area. Thus far, dead wood profiles have been proposed and implemented only for CWD (Stokland 2001; Christensen et al. 2005; Stokland et al. 2012). Knowledge on FWD profiles of different forest types is generally very limited, and more information about FWD profiles would improve our understanding of forest structure.
To increase knowledge about dead wood profiles and related sampling methods, there is a need for empirical data on dead wood in different ecological conditions, different tree species and dead wood types. In this paper, we estimated the total number of different dead wood types – including FWD – in a semi-natural boreal forest, based on an intensive sampling. We constructed the dead wood profile to study how the number and volume of dead wood items varies along the dead wood diameters, along different decay stages and among different tree species. We also studied how increasing sampling effort improved the accuracy of the estimates of dead wood abundance for different tree species and dead wood size classes.
2 Materials and methods
2.1 Study site
The study was conducted in a protected semi-natural forest (Kuusimäki, 108 ha). The forest is located in the southern boreal zone (Ahti et al. 1968), Central Finland (WGS84, 62°80´N, 26°26´E). After slash and burn cultivation in the early 19th century the site was abandoned around 1860s and has been set aside from human action ever since (strict nature reserve since 1980s). Norway spruce (Picea abies (L.) H. Karst., henceforth spruce) is the dominant tree species (about 50% of the standing volume). Birches (Betula spp.) are also very abundant (39%), whereas Scots pine (Pinus sylvestris L., 6%, henceforth pine) and aspen (Populus tremula L., 4%) are scarcer. The forest site is mainly of the Myrtillus and Oxalis-Myrtillus type (Cajander 1949), but there are small peatland and herb-rich forest patches. Due to the high volume of dead wood and the high number of threatened wood-inhabiting species (Kunttu and Halme 2008) the forest possesses high conservation values.
2.2 Dead wood measurements
To estimate the dead wood qualities we sampled dead wood with three complementary set-ups. In all of them, only those dead wood items that had their base inside of the study plot (basal point inclusion, see Stokland et al. 2004) were considered. In some cases, the trunk had broken into separate pieces when or after grounded. If we could recognize the pieces to originate from the same item prior the breakage, we considered them as one item. Detached branches from living trees were regarded as separate items.
In set-up A, we placed 72 study plots (10 m × 10 m) in 24 triplets. In each triplet, the location of the first plot was randomly assigned, and the next two plots were placed 30 and 50 meters from the first plot toward random compass directions. We treat these plots as if they were all randomly positioned because they rather well represented the whole forest. On these plots, we surveyed every dead wood item with diameter ≥ 2 cm and recorded the tree species, dead wood type (standing, fallen, stump), length, base and top diameter and decay stage (five categories, sensu Renvall 1995). For the (relatively rare) standing dead wood items, we only measured the diameter at breast height (i.e. at 1.3 m height) and the estimated diameter at breaking point (if they were broken). The height of standing dead trees was estimated from the downed trees of equal size.
In set-up B, we used a hierarchical sampling scheme in which we delineated two randomly positioned 10 m × 10 m plots on random locations and placed one 2 m × 2 m subplot in the northwest corner. The plots were surveyed as in set-up A, and in the subplots, we additionally surveyed the dead wood items with diameters < 2 cm (excluding needles, leaves and detached pieces of bark).
In set-up C, we delineated six hierarchical plots as in study B with the exception that in this set-up the 2 m × 2 m subplot was positioned to each corner of the plots. In this set-up we only recorded the tree species, large-end diameter and decay stage category for every dead wood item. Thus, from the set-up C it is only possible to calculate the number of the different dead wood types, but not their volumes. The location of three of these plots was randomly chosen within the central area of Kuusimäki, as part of an earlier study (see Juutilainen et al. 2011), and the location of the remaining three plots was randomly assigned across the whole area (Fig. 1). Even though some of the plots were clustered, we treat each plot as an independent replicate. We acknowledge that this is somewhat incorrect but do not see it as a major problem because overall the plots are distributed throughout the site and we also tested spatial autocorrelation among the dead wood profile. The study was conducted in 2012, except for the plots surveyed by Juutilainen et al. (2011) in 2007.
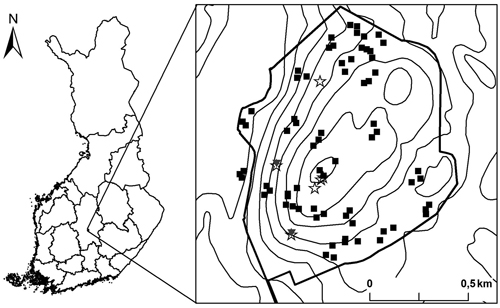
Fig. 1. Location of the study site in Central Finland and the locations of the study plots. Thick line represents the protected area border and thin lines altitude contours. The plots in the set-up A are marked with black squares, B with grey triangles and C with stars (see methods for the detailed description of the different data collection set ups). The three plots located outside the protected area are situated on a structurally similar forest adjoining the protected area.
2.3 Analyses
In a sample plot inventory, the estimator of the total number of dead wood items Y is the observed number of items divided by the fraction of the study area that has been surveyed (Ståhl et al. 2001):

where m is the number of plots, yi is the number of items in plot i, ai is the size of the plot i, and A is the area of the study site for which the estimator is to be computed. The total number of dead wood items was estimated separately for each tree species, size classes and decay stages (see below). For items with diameter ≥ 2 cm, the plots covered 0.8 ha of the 108 ha site. For the very fine woody debris (<2 cm in diameter) the plots covered 0.0104 ha, i.e. 104 m2.
To estimate dead wood volumes in the forest, we used data from the 74 plots (set-ups A and B) from which we had adequate information for volume estimation. The volumes of the dead wood items were calculated by using the formula of a truncated cone. We report the estimated mean volumes per hectare with plot level standard deviation and the number of dead wood items and plots these estimates are based on, over two different size classes (2–9 cm and >10 cm) and different tree species (or other corresponding groups).
To construct a volume-based dead wood profile for each tree species, the mean volume per hectare was divided among the five decay stages and size categories (the base diameter 2–9 cm, 10–19 cm, 20–29 cm, 30–39 cm or >40 cm).
To study the effect of sampling effort on the estimates of the number of dead wood items per hectare, we resampled our data by randomly selecting an increasing number of plots (i … m) with replacement, and estimated the number of dead wood items per hectare at every resampling step. This procedure was repeated 1000 times, separately for FWD and CWD of birch, spruce, pine and aspen.
We used Moran´s I test to study whether dead wood profiles in the plots were spatially autocorrelated.
3 Results
Altogether, we measured 23 073 dead wood items, out of which 16 145 (70%) were spruce, 1331 (6%) pine, 4675 (20%) birch, 351 (2%) aspen, and 571 (2%) other tree species (Sorbus aucuparia L., Alnus spp., Juniperus communis L., Salix caprea L. and Tilia cordata Mill.). The total number of dead wood items was estimated to be 209 006 190, i.e. 1 935 243 items per hectare. Considering only CWD, the numbers were 58 185 and 539, respectively.
The dead wood abundance distributions varied for different tree species (Fig. 2). For spruce, 99% of the dead wood items had a diameter < 1 cm, and the number of items dropped drastically for larger diameters. For aspen, 92% of the dead wood items had a diameter < 1 cm and the number of items decreased more gradually with diameter than for spruce. The abundance profiles of birch and pine were intermediate. Most of the rarer tree species were between the extremes (i.e. either very small or very large dead wood items dominating the dead wood profile), although the data are limited to analyze their profiles in detail (Table 1).
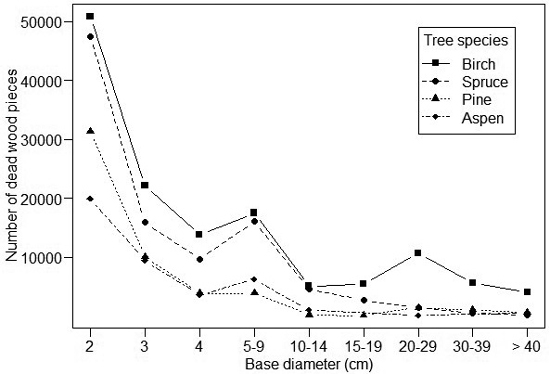
Fig. 2. The size-abundance distribution of dead wood items of different tree species. Note that size below 2 cm is not indicated due to their high number: ca. 150 million for spruce, 37 million for birch, 9 million for pine and 0.5 million for aspen.
| Table 1. The estimated mean volume (with standard error) of dead wood (m3/hectare), the total and mean number (with standard error) of dead wood items in the study plots, and the number of plots particular dead wood type was encountered. Values are given separately for the two size classes (2–9 cm and ≥10 cm). View in new window/tab. |
Even if the number of FWD items was much larger than CWD, the latter dominated in volume (FWD 3.18 vs. CWD 87.55 m3 ha–1, Table 1). Dead wood volumes varied among different tree species and size classes (Table 1). Most of the volume of FWD belonged to spruce (1.09 m3 ha–1), whereas most of the volume of CWD (>10 cm) belonged to birch (53.97 m3 ha–1).
Dead wood of different tree species were differently distributed along the size and decay stage classes. Birch was present in all sizes and decay stages, whereas large spruces were very rare, pine in advanced decay stage was largely missing, and medium-sized aspens were absent (Table 2).
| Table 2. The dead wood profile for Betula spp., Picea abies, Pinus sylvestris and Populus tremula, where the mean volume per hectare (m3 ha–1) is divided among the five size classes and decay stages. | |||||
| Betula | 2–9 cm | 10–19 cm | 20–29 cm | 30–39 cm | >40 cm |
| Decay stage 1 | 0.21 | 0.16 | 1.60 | 2.20 | 1.62 |
| 2 | 0.28 | 0.41 | 2.24 | 5.53 | 3.80 |
| 3 | 0.17 | 0.80 | 3.12 | 2.00 | 13.30 |
| 4 | 0.21 | 0.93 | 5.29 | 2.27 | 3.71 |
| 5 | 0.03 | 0.70 | 1.74 | 1.41 | 1.16 |
| Picea | 2–9 cm | 10–19 cm | 20–29 cm | 30–39 cm | >40 cm |
| Decay stage 1 | 0.62 | 1.76 | 2.04 | ||
| 2 | 0.31 | 0.46 | 1.31 | 0.72 | |
| 3 | 0.10 | 0.11 | 0.25 | 0.75 | |
| 4 | 0.04 | 0.47 | 0.02 | 0.16 | |
| 5 | 0.02 | 0.03 | 0.10 | ||
| Pinus | 2–9 cm | 10–19 cm | 20–29 cm | 30–39 cm | >40 cm |
| Decay stage 1 | 0.06 | 1.15 | 0.89 | ||
| 2 | 0.07 | 0.05 | 0.66 | 1.21 | 2.50 |
| 3 | 0.02 | 0.01 | 0.59 | 1.24 | |
| 4 | 0.01 | 0.29 | 0.06 | 0.22 | 0.26 |
| 5 | 0.02 | ||||
| Populus | 2–9 cm | 10–19 cm | 20–29 cm | 30–39 cm | >40 cm |
| Decay stage 1 | 0.08 | 0.72 | 0.01 | ||
| 2 | 0.20 | 0.17 | 10.52 | ||
| 3 | 0.06 | 0.04 | |||
| 4 | 0.01 | 0.02 | |||
| 5 | 0.01 | 0.13 | |||
The resampling simulations show that the abundance estimates of different dead wood types were very unreliable, if they were based on a small number of sample plots (Figs. 3–4). The estimates of CWD were very unreliable up to 15–20 study plots (Fig. 3). FWD estimates reached higher reliability with lower number of plots (Fig. 4).
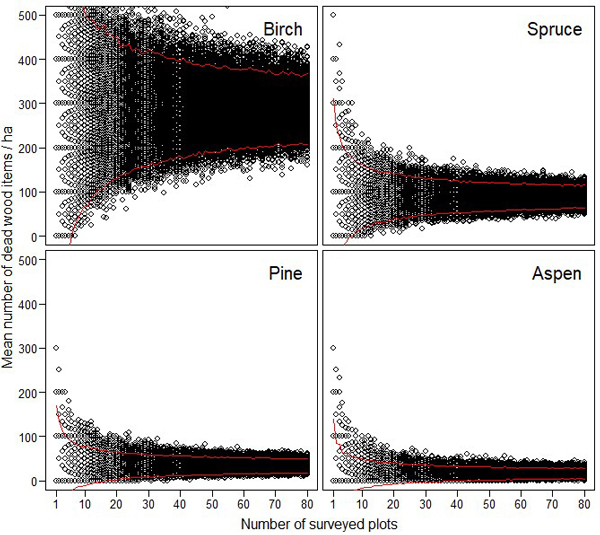
Fig. 3. The effect of sampling effort (i.e. the number of 10 m × 10 m plots) on the reliability of the estimated amount of coarse woody debris for birch, spruce, pine and aspen. The maximum estimates (= 1600) for birch is not shown to enable better comparison between the different tree species. The red lines indicate 95% confidence intervals.
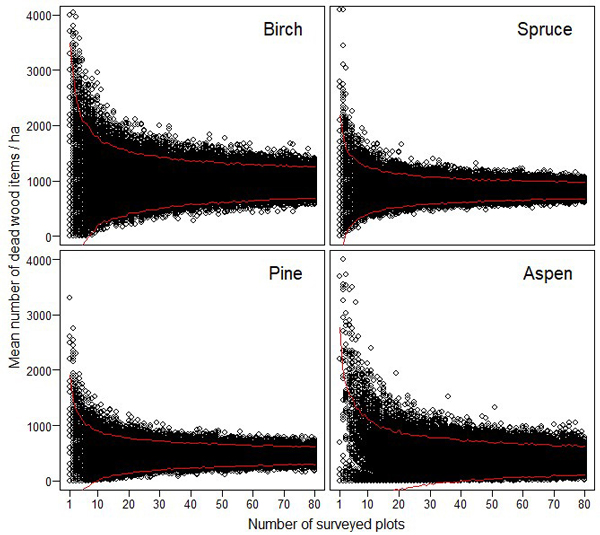
Fig. 4. The effect of sampling effort (i.e. the number of 10 m × 10 m plots) on the reliability of the estimated amount of fine woody debris for birch, spruce, pine and aspen. The maximum estimates for birch (= 5600), and for aspen (= 6900) are not shown to enable better comparison between the different tree species. The red lines indicate 95% confidence intervals.
According to the Moran´s I test, the number of aspen dead wood was spatially autocorrelated (p < 0.001 for both FWD and CWD), as well as spruce FWD (p = 0.04). Other dead wood fractions were not spatially autocorrelated (p = 0.36 for birch FWD, p = 0.16 for Birch CWD, p = 0.11 for spruce CWD, p = 0.15 for pine FWD and p = 0.5 for pine CWD).
4 Discussion
Based on an exceptionally intensive sampling, we were able to estimate the total number of different dead wood types in a semi-natural boreal forest, construct the dead wood profile for the site and evaluate how the increasing sampling effort increases the accuracy of the estimates of dead wood abundance.
4.1 Dead wood amount
We found that the overall volume of dead wood (ca. 90 m3 ha–1) was comparable to dead wood amounts in semi-natural and natural boreal forests in which gap dynamics prevail (Siitonen 2001). Volume-wise, 97% of the dead wood was CWD. This is different compared to the heavily-managed forests where larger share of the dead wood volume is FWD (Siitonen 2001; Eräjää et al. 2010). The estimated total number of dead wood items was surprisingly high: more than 200 million items and 58 185 CWD items for this relatively small forest area (108 ha). To our knowledge, the total number of dead wood items per site has not been estimated earlier.
Estimation of the number of dead wood items has important practical implications. If dead wood numbers are underestimated, also the resource availability for the dead wood dependent species is underestimated. Generalist species that require CWD as a resource, but are otherwise not specialized in any tree species (see examples in Juutilainen et al. 2017), find tens of thousands of resource units in Kuusimäki. Moreover, there are many more resource units available for species that utilize FWD. However, for species that are more specialized on rarer dead wood types (see Juutilainen et al. 2017), this 108-ha forest offers only a few resource units; thus, total dead wood amount is not always a good proxy of conservation value. Indeed, the diversity of dead wood can be much more important factor for explaining species richness than the amount (Similä et al. 2003; Hottola et al. 2009; Tikkanen et al. 2017). To estimate the population sizes of dead wood dependent species (e.g. in Red List assessment; IUCN Standard and Petition Subcommittee 2017), we should have information on both species’ habitat specialization and habitat availability. Due to the lack of data on dead wood availability, much attention is focused on species’ range size, rather than on their local population size (Komonen et al. 2008). We argue that more comprehensive and accurate dead wood inventories are needed to obtain deeper knowledge on the population sizes of dead wood dependent species.
4.2 Dead wood profile
The dead wood profile was diverse in terms of tree species, size categories and decay stages. Interestingly, birch was proportionally dominating when estimated as volume, and birch CWD made more than half of the total dead wood volume even though the forest cover of Kuusimäki is spruce-dominated. Birch was well represented in all size and decay classes. The abundance of birch can be partly explained by the slash-and-burn cultivation: the largest trees, many of which are now dead, have probably been recruited just after the slash-and-burned cultivation ceased in 1860s. Birch is a fast growing and relatively short-lived pioneer tree species and it is likely that the share of birch will decrease in the absence of stand-replacing disturbances (see Linder et al. 1997).
Our study shows that there are two clear gaps in dead wood continuity: there are very few large spruce (>40 cm dbh) and aspen logs (20–39 cm dbh). Shortage of such large, dead spruces is also likely to result from the slash-and burn cultivation: spruce is a late successional species and lives much longer than birch; thus, the share of spruce (> 40 cm dbh) of all dead wood is likely to increase. The very high number of spruce FWD and smaller fractions of CWD likely results from self-thinning, manifested as the death of lower branches of living trees and outcompeted smaller trees. It might be that spruce is rather specific considering its strong self-thinning propensity, because the late successional beech does not show a similar size pattern (see Abrego et al. 2014). The dead wood abundance-size distribution of beech forests in northern Spain also showed a dominance of very fine woody debris but not nearly as skewed as spruce in our study.
Similar to birch, aspen is a fast-growing pioneer tree species (Linder et al. 1997). Aspen logs were the largest logs in the site. The relatively high abundance of aspen dead wood items of small to intermediate size (about from 2 to 15 cm diameter) is probably explained by the falling of big branches from the living trees, which is typical for aspen. The lack of 20–39 cm aspens may result from past browsing pressure of moose, which is an abundant herbivore in Kuusimäki, as judged by feces and footprints. Indeed, moose and other large herbivores have been documented to hinder aspen regeneration severely in managed and protected forests (Kouki et al. 2004; Kauffman et al. 2010; Edenius et al. 2011).
4.3 Dead wood sampling
Dead wood is sampled in various ways. The most suitable method depends on the abundance and spatial distribution of dead wood, as well as on the target tree type (standing or downed) (Kangas et al. 2004). The method should also be cost-efficient, robust for measurement error and simple to use. We used a sample plot inventory, which is one commonly applied method. The plots can be systematically or randomly positioned, the former providing generally more precise estimates in comparison with the latter (Ståhl et al. 2001).
Based on our results, a large number of randomly placed study plots (10 m × 10 m) is needed to obtain an accurate and precise estimate of the number of dead wood items. A large number of plots is particularly crucial if the dead wood type of interest is spatially clustered or rare. The risk of overestimating dead wood amounts or failing to detect a certain tree species or other dead wood type is higher for clustered and rare items than for more evenly distributed items. For example, the dominant canopy trees – here spruce and birch – are more evenly distributed spatially and thus fewer plots are needed to obtain good estimates of their true densities. Living and dead aspen trees in turn are often spatially clustered due to clonal regeneration (Shepperd et al. 2001), and therefore, about 50 plots (10 m × 10 m) was needed to reliably estimate the abundance of aspen CWD and FWD, and to avoid the risk of false negative estimation (estimating something truly existing as not existing). Because aspen is spatially clustered, as also visible through the strong spatial autocorrelation of its abundance in this study, it may be that other methods than sample plots should be used to survey it. Furthermore, we note that due to both the rarity of aspen and its clustered distribution, our estimates based on sample plots were more uncertain than for other tree species.
To make a general description of the dead wood profile, about ten randomly distributed 10 m × 10 m plots seem to be enough, but the more the focus is on large and rare dead wood items, the larger is the required survey input. It is difficult to compare our results with the earlier studies due to different methods. For example, Harmon and Sexton (1996) give a guideline for FWD surveys in which they instruct to use at least 10 study plots of 1 m2 for sampling of FWD due to its highly variable distribution.
5 Conclusions
The number of dead wood items, especially the small ones, is very high, offering almost endless number of potential resource units for those dead wood dependent species that can utilize small-sized dead wood. However, because the abundance-size distributions of dead wood is very different for different tree species, the total dead wood amount is not a universal proxy of conservation value of forests. Detailed tree species-specific profiles are needed if one aims for estimating the population sizes of dead wood dependent species. Considering dead wood surveys one should select the method and effort based on the specific aims of the survey. The more the focus is on rare elements, the higher the sampling effort and the more specific the survey design should be.
Acknowledgements
We want to thank the editors and three anonymous reviewers for their constructive comments on the manuscript. We are grateful to Noora Vartija for assistance with the data collection. This study was funded by the Finnish Ministry of Environment (PUTTE grant to PH) and by Finnish Cultural Foundation and the Finnish Foundation for Nature Conservation (grants to JP).
References
Aakala T. (2010). Coarse woody debris in late-successional Picea abies forests in northern Europe: variability in quantities and models of decay class dynamics. Forest Ecology and Management 260(5): 770–779. https://doi.org/10.1016/j.foreco.2010.05.035.
Abrego N., Salcedo I. (2013). Variety of woody debris as the factor influencing wood-inhabiting fungal richness and assemblages: is it a question of quantity or quality? Forest Ecology and Management 291: 377–385. https://doi.org/10.1016/j.foreco.2012.11.025.
Abrego N., García-Baquero G., Halme P., Ovaskainen O., Salcedo I. (2014). Community turnover of wood-inhabiting fungi across hierarchical spatial scales. PLoS ONE 9(7): e103416. https://doi.org/10.1371/journal.pone.0103416.
Ahti T., Hämet-Ahti L., Jalas J. (1968). Vegetation zones and their sections in northwestern Europe. Annales Botanici Fennici 5: 169–211.
Bässler C., Müller J., Dziock F., Brandl R. (2010). Effects of resource availability and climate on the diversity of wood-decaying fungi. Journal of Ecology 98(4): 822–832. https://doi.org/10.1111/j.1365-2745.2010.01669.x.
Bouget C., Lassauce A., Jonsell M. (2012). Effects of fuelwood harvesting on biodiversity – a review focused on the situation in Europe 1. Canadian Journal of Forest Research 42(8): 1421–1432. https://doi.org/10.1139/x2012-078.
Brin A., Bouget C., Brustel H., Jactel H. (2011). Diameter of downed woody debris does matter for saproxylic beetle assemblages in temperate oak and pine forests. Journal of Insect Conservation 15(5): 653–669. https://doi.org/10.1007/s10841-010-9364-5.
Cajander A.K. (1949). Forest types and their significance. Acta Forestalia Fennica 56(5). 69 p. https://doi.org/10.14214/aff.7396.
Castro A., Wise D.H. (2009). Influence of fine woody debris on spider diversity and community structure in forest leaf litter. Biodiversity and Conservation 18(14): 3705–3731. https://doi.org/10.1007/s10531-009-9674-7.
Christensen M., Hahn K., Mountford E.P., Ódor P., Standovár T., Rozenbergar D., Diaci J., Wijdeven S., Meyer P., Winter S., Vrska T. (2005). Dead wood in European beech (Fagus sylvatica) forest reserves. Forest Ecology and Management 210(1–3): 267–282. https://doi.org/10.1016/j.foreco.2005.02.032.
Edenius L., Ericsson G., Kempe G., Bergström R., Danell K. (2011). The effects of changing land use and browsing on aspen abundance and regeneration: a 50-year perspective from Sweden. Journal of Applied Ecology 48(2): 301–309. https://doi.org/10.1111/j.1365-2664.2010.01923.x.
Eräjää S., Halme P., Kotiaho J.S., Markkanen A., Toivanen T. (2010). The volume and composition of dead wood on traditional and forest fuel harvested clear-cuts. Silva Fennica 44(2): 203–211. https://doi.org/10.14214/sf.150.
Esseen P.A., Ehnström B., Ericson L., Sjöberg K. (1997). Boreal forests. Ecological Bulletins 46: 16–47.
Ferro M.L., Gimmel M.L., Harms K.E., Carlton C.E. (2009). The beetle community of small oak twigs in Louisiana, with a literature review of Coleoptera from fine woody debris. Coleopterists Bulletin 63(3): 239–263. https://doi.org/10.1649/1141.1.
Finnish Forest Research Institute (2014). Finnish statistical yearbook of forestry. Vantaa. 428 p. http://urn.fi/URN:ISBN:978-951-40-2506-8.
Forest Stewardship Council (2010). Swedish FSC standard for forest certification including SLIMF indicators. Uppsala.
Gamfeldt L., Snäll T., Bagchi R., Jonsson M., Gustafsson L., Kjellander P., Ruiz-Jaen M.C., Fröberg M., Stendahl J., Philipson C.D., Mikusiński G., Andersson E., Westerlund B., Andrén H., Moberg F., Moen J., Bengtsson J. (2013). Higher levels of multiple ecosystem services are found in forests with more tree species. Nature Communications 4 article 1340. 8 p. https://doi.org/10.1038/ncomms2328.
Grove S.J. (2009). Beetles and fuelwood harvesting: a retrospective study from Tasmania’s southern forests. Tasforests 18: 77–99.
Harmon M.E., Sexton J. (1996). Guidelines for measurements of woody detritus in forest ecosystems. Publivation no. 20. U.S. LTER Network. University of Washington, Seattle.
Harmon M.E., Franklin J.F., Swanson F.J., Sollins P., Gregory S.V., Lattin J.D., Anderson N.H., Cline S.P., Aumen N.G., Sedell J.R., Lienkaemper G.W., Cromack K., Cummins K.W. (1986). Ecology of Coarse Woody Debris in Temperate Ecosystems. Advances in Ecological Research 15: 133–276. https://doi.org/10.1016/S0065-2504(08)60121-X.
Hottola J., Ovaskainen O., Hanski I. (2009). A unified measure of the number, volume and diversity of dead trees and the response of fungal communities. Journal of Ecology 97(6): 1320–1328. https://doi.org/10.1111/j.1365-2745.2009.01583.x.
IUCN Standard and Petition Subcommittee (2017). Guidelines for using the IUCN red list categories and criteria. Version 13. http://www.iucnredlist.org/documents/RedListGuidelines.pdf. [Cited 30 Oct 2017].
Jonsson B.G., Ekström M., Esseen P.A., Grafström A., Ståhl G., Westerlund B. (2016). Dead wood availability in managed Swedish forests – policy outcomes and implications for biodiversity. Forest Ecology and Management 376: 174–182. https://doi.org/10.1016/j.foreco.2016.06.017.
Junninen K., Komonen A. (2011). Conservation ecology of boreal polypores: a review. Biological Conservation 144(1): 11–20. https://doi.org/10.1016/j.biocon.2010.07.010.
Juutilainen K., Halme P., Kotiranta H., Mönkkönen M. (2011). Size matters in studies of dead wood and wood-inhabiting fungi. Fungal Ecology 4(5): 342–349. https://doi.org/10.1016/j.funeco.2011.05.004.
Juutilainen K., Mönkkönen M., Kotiranta H., Halme P. (2014). The effects of forest management on wood-inhabiting fungi occupying dead wood of different diameter fractions. Forest Ecology and Management 313: 283–291. https://doi.org/10.1016/j.foreco.2013.11.019.
Juutilainen K., Mönkkönen M., Kotiranta H., Halme P. (2017). Resource use of wood-inhabiting fungi in different boreal forest types. Fungal Ecology 27(A): 96–106. https://doi.org/10.1016/j.funeco.2017.03.003.
Kangas A., Aakala T., Alanen H., Haavisto M., Heikkilä J., Kaila A., Kankaanpää S., Kämäri H., Leino O., Mäkinen A., Nurmela E., Oksa S., Saari A., Tikkanen S.M., Wathén M. (2004). Lahopuuinventoinnin menetelmien vertailu Nuuksion ulkoilualueilla. Metsätieteen Aikakauskirja 1/2004: 43–51. https://doi.org/10.14214/ma.6080. [In Finnish].
Kauffman M.J., Brodie J.F., Jules E.S., Url S. (2010). Are wolves saving Yellowstone´s aspen? A landscape-level test of a behaviorally mediated trophic cascade. Ecology 91(9): 2742–2755. https://doi.org/10.1890/09-1949.1.
Komonen A., Jonsell M., Ranius T. (2008). Red-listing saproxylic beetles in Fennoscandia: current status and future perspectives. Endangered Species Research 6(2): 149–154. https://doi.org/10.3354/esr00074.
Komonen A., Schroeder L.M., Weslien J. (2011). Ips typographus population development after a severe storm in a nature reserve in southern Sweden. Journal of Applied Entomology 135(1–2): 132–141. https://doi.org/10.1111/j.1439-0418.2010.01520.x.
Kouki J., Arnold K., Martikainen P. (2004). Long-term persistence of aspen – a key host for many threatened species – is endangered in old-growth conservation areas in Finland. Journal of Nature Conservation 12(1): 41–52. https://doi.org/10.1016/j.jnc.2003.08.002.
Kruys N., Jonsson B.G. (1999). Fine woody debris is important for species richness on logs in managed boreal spruce forests of northern Sweden. Canadian Journal of Forest Research 29(8): 1295–1299. https://doi.org/10.1139/x99-106.
Küffer N., Gillet F., Senn-Irlet B., Job D., Aragno M. (2008). Ecological determinants of fungal diversity on dead wood in European forests. Fungal Diversity 1: 83–95.
Kunttu P., Halme P. (2008). Uhanalaisten ja silmälläpidettävien kääpälajien esiintyminen Keski-Suomessa. Metsähallituksen Luonnonsuojelujulkaisuja A 173: 1–83. [In Finnish].
Kuuluvainen T. (2002). Natural variability of forests as a reference for restoring and managing biological diversity in boreal Fennoscandia. Silva Fennica 36(1): 97–125. https://doi.org/10.14214/sf.552.
Linder P., Elfving B., Zackrisson O. (1997). Stand structure and successional trends in virgin boreal forest reserves in Sweden. Forest Ecology and Management 98(1): 17–33. https://doi.org/10.1016/S0378-1127(97)00076-5.
Manning J.A., Edge W.D. (2008). Small mammal responses to fine woody debris and forest fuel reduction in southwest Oregon. Journal of Wildlife Management 72(3): 625–632. https://doi.org/10.2193/2005-508.
Nilsson C., Stjernquist I., Bärring L., Schlyter P., Jönsson A.M., Samuelsson H. (2004). Recorded storm damage in Swedish forests 1901–2000. Forest Ecology and Management 199(1): 165–173. https://doi.org/10.1016/j.foreco.2004.07.031.
Nordén B., Ryberg M., Götmark F., Olausson B. (2004). Relative importance of coarse and fine woody debris for the diversity of wood-inhabiting fungi in temperate broadleaf forests. Biological Conservation 117(1): 1–10. https://doi.org/10.1016/S0006-3207(03)00235-0.
Päivinen J., Björkqvist N., Karvonen L., Kaukonen M., Korhonen K.M., Kuokkanen P., Lehtonen H., Tolonen A. (eds.) (2011). Metsähallituksen metsätalouden ympäristöopas. Metsähallituksen metsätalouden Julkaisuja 67. 162 p. [In Finnish].
Rassi P., Alanen A., Kanerva T., Mannerkoski I. (eds.) (2001). The red list of Finnish species. Ministry of the Environment & Finnish Environment Institute. Helsinki.
Renvall P. (1995). Community structure and dynamics of wood-rotting Basidiomycetes on decomposing conifer trunks in northern Finland. Karstenia 35(1): 1–51. https://doi.org/10.29203/ka.1995.309.
Shepperd W.D., Bartos D.L., Mata S.A. (2001). Above- and below-ground effects of aspen clonal regeneration and succession to conifers. Canadian Journal of Forest Research 31(5): 739–745. https://doi.org/10.1139/x01-001.
Siitonen J. (2001). Forest management, coarse woody debris and saproxylic organisms: Fennoscandian boreal forests as an example. Ecological Bulletins 49: 11–41.
Similä M., Kouki J., Martikainen P. (2003). Saproxylic beetles in managed and seminatural Scots pine forests: quality of dead wood matters. Forest Ecology and Management 174: 365–381. https://doi.org/10.1016/S0378-1127(02)00061-0.
Spies T.A., Franklin J.F., Thomas T.B. (1988). Coarse woody debris in Douglas-fir forests of western Oregon and Washington. Ecology 69(6): 1689–1702. https://doi.org/10.2307/1941147.
Ståhl G., Ringvall A., Fridman J. (2001). Assessment of coarse woody debris: a methodological overview. Ecological Bulletins 49: 57–70.
Stokland J.N. (2001). The coarse woody debris profile: an archive of recent forest history and an important biodiversity indicator. Ecological Bulletins 49: 57–70.
Stokland J.N., Tomter S.M., Söderberg U. (2004). Development of dead wood indicators for biodiversity monitoring: experiences from Scandinavia. In: Marchetti M. (ed.). Monitoring and indicators of forest biodiversity in Europe, from ideas to operationality. EFI-Proceedings No. 51. p. 207–226.
Stokland J.N., Siitonen J., Jonsson B.G. (2012). Biodiversity on dead wood. Cambridge University Press, Cambridge. https://doi.org/10.1017/CBO9781139025843.
Tikkanen O.-P., Martikainen P., Hyvärinen E., Junninen K., Kouki J. (2006). Red-listed boreal forest species of Finland: associations with forst structure, tree species, and decaying wood. Annales Zoologici Fennici 43: 373–383.
Tikkanen O.P., Predtechenskaya O., Ruokolainen A., Heikkilä R. (2017). Recovery of functional groups of fungi and wood-decaying species of conservation concern after variable intensity forest utilization. European Journal of Forest Research 136(5–6): 827–837. https://doi.org/10.1007/s10342-017-1073-0.
Woodall C.W., Liknes G.C. (2008). Relationships between forest fine and coarse woody debris carbon stocks across latitudinal gradients in the United States as an indicator of climate change effects. Ecological Indicators 8(5): 686–690. https://doi.org/10.1016/j.ecolind.2007.11.002.
Woodall C.W., Monleon V.J. (2008). Sampling protocols, estimation procedures, and analytical guidelines for down woody materials indicator of the Forest Inventory and Analysis Program. 2nd ed. General Technical Report NRS-22. USDA Forest Service, Northern Research Station. https://doi.org/10.2737/NRS-GTR-22.
Total of 55 references.
