Eero Muinonen  ,
Perttu Anttila,
Jaakko Heinonen,
Jukka Mustonen
,
Perttu Anttila,
Jaakko Heinonen,
Jukka Mustonen
Estimating the bioenergy potential of forest chips from final fellings in Central Finland based on biomass maps and spatially explicit constraints
Muinonen E., Anttila P., Heinonen J., Mustonen J. (2013). Estimating the bioenergy potential of forest chips from final fellings in Central Finland based on biomass maps and spatially explicit constraints. Silva Fennica vol. 47 no. 4 article id 1022. https://doi.org/10.14214/sf.1022
Abstract
The technical potential of forest chips from final fellings in Central Finland was estimated using a method based on biomass maps derived from a multi-source forest inventory technique. Image segmentation techniques were applied to a satellite image mosaic to detect stand boundaries. The technical potential of forest chips was computed based on primary forestry residues, i.e. logging residues and stumps from final fellings. Harvesting level definitions for final fellings were established using realized statistics for roundwood at the municipality level as well as larger area statistics. The sensitivity of the potential to ecological and technical constraints in the model was also examined. The technical recovery rate of stump harvesting according to biomass harvesting guidelines was evaluated separately. The critical prerequisites for using the advanced, spatially explicit approach to analysing forest energy potentials may lie in the existence of spatially explicit forest inventory data and the biometric models for tree biomass assortments. The method applied was capable of taking into account the constraints that rely upon map data, such the actual forwarding distance or steepness of the slope in the terrain. The calculation results can be used for strategic decision making in the field of forest bioenergy production.
Keywords
biomass;
stumps;
logging residues;
remote sensing;
forest energy
-
Muinonen,
Finnish Forest Research Institute, Joensuu Unit, P.O. Box 68, FI-80101 Joensuu, Finland
E-mail
eero.muinonen@metla.fi
- Anttila, Finnish Forest Research Institute, Joensuu Unit, P.O. Box 68, FI-80101 Joensuu, Finland E-mail perttu.anttila@metla.fi
- Heinonen, Finnish Forest Research Institute, Joensuu Unit, P.O. Box 68, FI-80101 Joensuu, Finland E-mail jaakko.heinonen@metla.fi
- Mustonen, Stora Enso, Talvikkitie 40 C, FI-01300 Vantaa, Finland E-mail jukka.mustonen@storaenso.com
Received 15 May 2013 Accepted 26 August 2013 Published 30 October 2013
Views 184046
Available at https://doi.org/10.14214/sf.1022 | Download PDF

1 Introduction
Finland is committed to raising the proportion of renewable energy sources in its final consumption of energy to 38% by 2020 (EU 2009). One of the key means of doing this is through increasing the use of forest chips, which are wood chips obtained as a by-product from forest operations. In 2012, a total of 8.3 million cubic metres of forest chips was consumed by heat and power plants and in small-scale housing (Ylitalo 2013). This was a bit more than half of the target set for 2020: Finland should then use annually 25 TWh (equivalent to 13.5 million cubic metres) of wood chips in combined heat and power (CHP) production and separate heat production (Ministry of Employment… 2010).
Approximately half of the forest chips used in 2012 was made of small trees from early thinnings, 34% of crown biomass from final fellings, 14% of stumps and roots from final fellings and the remaining 5% of large-sized, sub-quality stemwood (Ylitalo 2013). Of these assortments, the supply costs of small trees are the highest because there is an additional cost of felling compared to the supply of crown biomass or sub-quality stemwood. Obtaining a supply of stump biomass also involves the additional cost of pulling the stumps out of the ground, but this is typically lower than the cost of felling small trees (Laitila et al. 2010). Crown biomass, stumps and sub-quality stemwood are by-products of harvesting industrial roundwood, whereas small trees can be procured either in separate operations or as integrated with the pulp wood supply.
Previously, it has been estimated that the domestic potential of forest chips would be enough to meet the national target. According to Kärhä et al. (2010), the techno-ecological potential would range from 43 to 50 TWh (roughly from 21 to 25 million cubic metres), depending on the scenario applied. They also estimated that the techno-economical potential of forest chips would be 27–29 TWh (14–15 million cubic metres). Corresponding to the techno-ecological estimate provided by Kärhä et al. (2010), a figure of 25 million cubic metres for the maximum sustainable potential was given in a report by Peltola and Ihalainen (2012). These two assessments are based on National Forest Inventory (NFI) data. Anttila et al. (2013) stated that the technical potential would be 14–17 million cubic metres if small trees were harvested as whole trees. In their study the potential of biomass from final fellings was calculated based on felling statistics from between the years 2002 and 2011, biomass expansion factors and assumptions about the availability of the biomass.
Since the estimates by Anttila et al. (2013) are bound to municipality-level statistics, they can incorporate constraints that reduce the theoretical potential only at the municipality level. However, most of the constraints are spatially explicit (i.e. constraints for which the geographic location can be defined). These include, for example, slope, the forwarding distance and the smallest economically feasible removal at a forest stand. The studies by Kärhä et al. (2010) and Peltola and Ihalainen (2012) are based on inventory-plot-level data and may have only partially considered spatially explicit constraints. Therefore, there is a need for a methodology where spatially explicit constraints related to forest inventory data could be applied. The data should, thus, have wall-to-wall coverage.
In Finland, the k-nearest neighbour estimation method (k-NN) is the underlying methodology used for the Finnish Multi-Source National Forest inventory (MS-NFI). This approach has been widely applied for mapping forest attributes and the results can be produced at the municipality level and as wall-to-wall maps (Tomppo 2006; Tomppo et al. 1998, 2008, 2012). Tuominen et al. (2010) further applied this technique for mapping forest biomass variables by first estimating a sample plot-level biomass using existing tree-level biomass component models. They also noted that spatially explicit raster maps for the forest biomass serve as a good basis for further calculating the technical and economical bioenergy potentials. To proceed in using operational kinds of treatment units, image segmentation techniques can be applied first, after which an aggregation of forest attributes (including biomass variables) is possible. Estimating forest attributes at the segment level based on Landsat TM satellite data and the k-NN method has also been investigated by Mäkelä et al. (2011), who found that the k-NN method offers a promising approach to estimating initial data for scenario analyses at the local level.
Because the potentials of biomass from final fellings are bound to harvesting levels of industrial roundwood, the regional harvesting levels have to be constrained in the calculation, as it has been done, e.g., in the models by Noon et al. (1996) and Mahmoudi et al. (2009). In addition, the candidate segments should be restricted to those where procurement is sustainable with respect to, e.g., land use class, soil and site type, slope, segment area and distance to road (e.g. Castellano et al. 2009; Jones et al. 2013).
The primary aims of this study were 1) to develop a method for estimating the technical potential of forest chips from final fellings based on biomass maps and spatially explicit constraints, and 2) to apply the method in the area covered by the Forestry Centre of Central Finland (Fig. 1). We also examined the sensitivity of the potential to the ecological and technical constraints in the model. An additional aim was to evaluate the technical recovery rate of stump harvesting according to biomass harvesting guidelines.
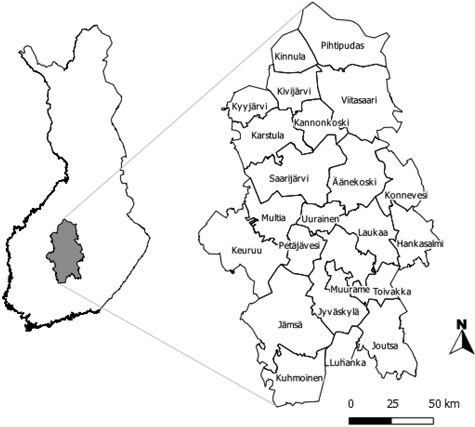
Fig. 1. Location of the region of Central Finland and the municipalities in the area (on the map to the right); (Digital map data: © National Land Survey of Finland MML/VIR/MYY/328/08).
2 Materials
2.1 Multi-source forest inventory materials
Satellite data for the segmentation consisted of an image mosaic built from several IRS and SPOT-5 images. Additionally, Landsat TM image data was used to fill in gaps caused by clouds in the mosaic. The image mosaic covers Central Finland and it has been resampled to a 20-metre pixel size in the Finnish Uniform Coordinate System. More detailed information of the satellite image materials can be found in a report by Tomppo et al. (2012). Also, road locations were incorporated into this study by extracting them from an MS-NFI raster map, where this information is presented as a separate category. Total land area in Central Finland region is 16700 km2, of which 13880 km2 (83%) is classified as forest land (Peltola and Ihalainen 2012).
The main sources of input data for the necessary GIS analyses used in the study are listed in Table 1. The raster map of the forest biomass variables (Tuominen et al. 2010) and the thematic maps of the forest attributes from MS-NFI comprise the most important information sources. The functions or equations applied in the study by Tuominen et al. (2010) have been presented by Laasasenaho (1982), Petersson and Ståhl (2006) as well as by Repola et al. (2007). Biomass estimates for the relascope sampled trees were obtained first, and these were then summed up at the sample plot level to aid the k-NN estimation.
| Table 1. Sources of the map data used in the study. | |
| Map data | Reference/Source |
| Raster map of forest biomass variables | Tuominen et al. (2010) |
| Thematic maps of forest attributes | MS-NFI of Finland (see Tomppo et al. 2012) |
| Municipality boundaries | National Land Survey of Finland (NLS) |
| National conservation areas + Natura2000 areas | Finnish Environmental Institute |
| Digital Elevation model, 25m | National Land Survey of Finland (NLS) (see Elevation model 25 m 2013) |
| Road data | MS-NFI of Finland (see Tomppo et al. 2012) |
2.2 Stump recovery study material
The proportion of the stump biomass collected from the total stump biomass in a forest stand area was pre-examined in a separate analysis. This analysis was based on existing materials from a stand development modelling study and two studies for checking the stand-level forest inventories. These materials have been reported and compiled for forest research by Anttila et al. (2001). Altogether, 146 stands were selected for estimating the recovery rate of stump harvesting (Table 2).
| Table 2. Number of observations (n), mean values for the basal area (G, m2/ha), the basal area weighted mean diameter at breast height (Dg, cm) and the stand age (Age, years) in the stump recovery study materials for Scots pine stands, Norway spruce stands and mixed stands of Scots pine and Norway spruce. | ||||
| Study material | Variable | Scots pine | Norway spruce | Mixed |
| SPATI | n | 13 | 25 | 25 |
| Dg | 29.6 | 30.6 | 27.5 | |
| G | 22.9 | 25.6 | 31.9 | |
| Age | 95.5 | 60.7 | 68.1 | |
| ENSO | n | 7 | 1 | 19 |
| Dg | 29.6 | 27.9 | 27.3 | |
| G | 17.2 | 28.9 | 25.9 | |
| Age | 91.7 | 84 | 85.8 | |
| KYMI | n | 11 | 12 | 33 |
| Dg | 28.3 | 27.8 | 27.5 | |
| G | 19.12 | 22.8 | 23.1 | |
| Age | 99.7 | 87.7 | 94.5 | |
The “SPATI” material contains fixed area sample plots established in North Karelia, Finland between the years 1988 and 1994 for spatial growth modelling (see, for example, Pukkala et al. 1994 for details). The data were obtained from 66 Scots pine (Pinus sylvestris L.) plots, 49 Norway spruce (Picea abies (L.) Karst.) plots and 43 plots mixed stands of Scots pine and Norway spruce. All trees have been measured by species and diameter at breast height. Sample tree measurements have been used to conduct height and age of the trees (see Pukkala et al. 1994). Stand-level characteristics (mean age at breast height, mean diameter) were also available, which helped when selecting suitable mature stands for the stump recovery study.
The “ENSO” data set was established in 1991 to check the inventory by compartments and this dataset has been used in several forest inventory studies (see, for example, Kangas and Maltamo 2000a). Originally, there were 579 forest stands, and six to twelve relascope sample plots have been systematically located in each stand. The diameter at breast height for each tree included in the sample plots using a relascope factor of two (m2/ha) has been recorded (in 1 cm classes). The median tree height was recorded as well. Available information about the stand development class and the site type were utilised when selecting the stands for this study.
The “KYMI” material originates from the years 1984 and 1985 and it is also a dataset containing forest stands and systematically located relascope sample plots (see, for example, Suutarla 1985; Kangas and Maltamo 2000b). Originally, there were 555 forest stands in the material and the aim has been to measure eight to twelve sample plots in each stand. A relascope factor of two (m2/ha) has been used. The median tree height and stand development class information were used when selecting the stands and doing the computations.
In the ENSO and KYMI data sets, mature Scots pine and Norway spruce stands where the basal area of the Scots pine or Norway spruce trees was more than 90% of the total basal area, respectively, were selected to the study material. The selection of mixed stands of Scots pine and Norway spruce contained mature stands; in these stands, both tree species together made up 90% or more of the total basal area and neither species individually made up more than 90% of the stand basal area. Site class and diameter were used to determine the maturity of the stand according to forestry guidelines (Tapio 2006).
3 Methods
3.1 Overview of the calculation system used for the biomass potential
The calculations for the technical potential of the forest biomass in this study are based on a framework where a forest stand register covering a large area is used to report the aggregations of forest biomass variables (Fig. 2). These biomass variables are initially expressed in tonnes of dry weight, and conversion factors are applied to obtain the potentials in volume and energy units (m3 and GJ, respectively).
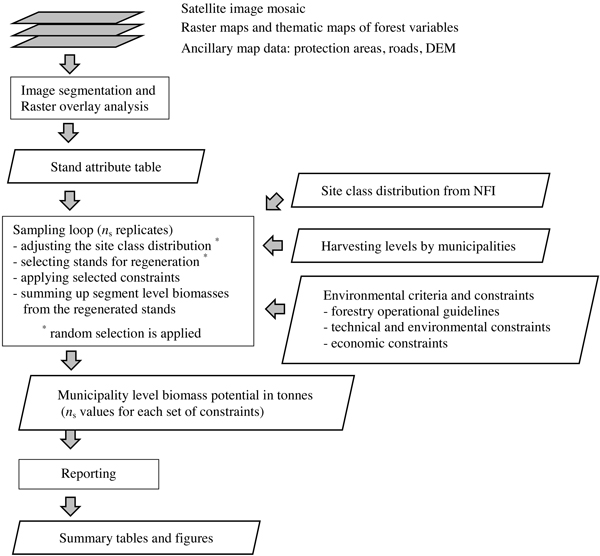
Fig. 2. Framework of the system for calculating the potential of forest chips.
The calculation framework thus presumes a stand-level database of forest attributes: satellite image data and image segmentation algorithms were used to delineate the stand boundaries, whereas the forest variable estimates are based on a basic pixel-by-pixel-level output from a multi-source forest inventory study conducted in Central Finland (Tuominen et al. 2010). Image segments furnished with the calculated forest attributes then represent forest stands in the calculation system.
Different kinds of technical and environmental constraints are introduced in further steps. A sampling loop is needed (Fig. 2) because random selection is applied when adjusting the site class distribution and selecting the stands for final felling. The primary output result from the calculation system consists of municipality-level sums of the biomass assortments, i.e. crown biomass (logging residues) and stump biomass by tree species.
The main results for the biomass assortments were then calculated as average values from the replicates produced by the sampling loop. The reporting phase contains summary table calculations for the given scenarios and sets of constraints. It also contains the necessary unit conversions.
The approach and the methodology that are applied in this study for assessing forest biomass resources can be categorised as a resource-focussed assessment and a spatially explicit analysis (see Vis et al. 2010), respectively. Scenario analysis is incorporated in this study via the definitions for the harvesting levels of industrial roundwood.
3.2 Image segmentation and raster overlay analysis
Forest stand boundaries for the analysis were delineated using an image segmentation algorithm presented by Pekkarinen (2002) and satellite image data. Initial segments were created for a satellite image mosaic that was first smoothed with a moving average filter using a 3 × 3 pixel window, after which the segment boundaries were produced using three iterative rounds for region merging. No post-processing was done for the segment boundaries after using the segmentation algorithm. The boundaries were converted into a vector format and the centroids for the segments were generated using ArcGIS utilities (Esri Products 2013).
Spatially explicit forest resource data from a multi-source forest inventory (Tuominen et al. 2010; Tomppo 2006) form the main input for the methodology, and the most important calculation tools are the existing biometric, tree-level models of the different biomass components for the existing tree species. A biomass map produced in the study by Tuominen et al. (2010) is used as the input raster map of biomass variables in this study, for which nearest neighbour resampling was applied to produce a raster map having a pixel size of 20 metres and a grid matching the one in the satellite image mosaic.
Forest attributes other than the biomass variables originate from the MS-NFI raster map for Central Finland (Tomppo et al. 2012). These attribute values have been generalised to the raster cells using the k-NN method allowing the imputation of all interesting forest variables simultaneously (for a more detailed discussion of the approach, see Tomppo et al. 2012). In MS-NFI raster map, forestry land includes forest land, poorly productive forest land and unproductive forest land (Tomppo et al. 2012). In this study, thematic map data from the MS-NFI raster map was utilised to exclude non-forestry land (e.g. waters, roads) from the analysis. The nature conservation areas and areas of the Natura 2000 network were also excluded from the analyses.
Forest attributes at the segment-level were calculated using a raster GIS zonal analyses, where the raster map of the biomass variables (Tuominen et al. 2010) and the thematic map of the forest variables (MS-NFI) are overlaid with the stand delineation. Thereafter, the mean values or mode values (for category variables) of the forest variables in the segments were produced. The resulting stand-level attributes comprise a stand register with interesting forest stand variables (Table 3) for further analyses (see also Vis et al. 2010).
Additional auxiliary variables, such as the distance from roads or the steepness of the slope, which are needed for further potential analyses, were later joined with the aforementioned stand attribute table (Table 3).
| Table 3. Stand variables calculated at the segment level and the sources of the data. Biomass is expressed using dry weight (tonnes/ha). | ||
| Attribute | Unit/Values | Source |
| Mean height | dm | * |
| Mean diameter at breast height | cm | * |
| Site fertility class | 1:‘Fertile’,…, 7:’Very poor’ | * |
| Basal area | m²/ha | * |
| Total volume | m3/ha | ** |
| Stem volume, Scots pine | m3/ha | ** |
| Stem volume, Norway spruce | m3/ha | ** |
| Stem volume, deciduous tree species | m3/ha | ** |
| Dominating tree species, (by total volume) | “pine”, “spruce”, “birch” | |
| Stem biomass, Scots pine | t/ha | ** |
| Stem biomass, Norway spruce | t/ha | ** |
| Stem biomass, deciduous tree species | t/ha | ** |
| Biomass of living branches, Scots pine | t/ha | ** |
| Biomass of living branches, Norway spruce | t/ha | ** |
| Biomass of living branches, deciduous tree species | t/ha | ** |
| Biomass of needles, Scots pine | t/ha | ** |
| Biomass of needles, Norway spruce | t/ha | ** |
| Biomass of foliage, deciduous tree species | t/ha | ** |
| Belowground biomass, Scots pine | t/ha | ** |
| Belowground biomass, Norway spruce | t/ha | ** |
| Belowground biomass, deciduous tree species | t/ha | ** |
| Source: * MS-NFI (see, for example, Tomppo et. al 2012); ** Tuominen et al. (2010) | ||
3.3 Harvesting level definitions
Harvesting levels were defined using annual statistics for roundwood removals at the municipality level (see, for example, MetINFO 2013). Statistics for the time period of 2000–2009 were examined. The annual total harvesting level by municipality was calculated first by summing up the timber assortment level removals. Possible consolidations of municipalities in the region were taken into account. The share of regeneration cuttings was estimated based on the proportion of harvested roundwood by felling method for the years 2000–2009 in Finland (Torvelainen 2010). In years 2000–2009 this share has been between 60 and 75% and in the whole time period 2000–2009 the share of regeneration cuttings was 69%.
To account for inter-annual changes in harvesting volumes, three sets of harvesting levels were defined (Fig. 3): for the average scenario (AVG), the average roundwood removals from regeneration fellings by municipality were assumed. For the minimum (MIN) and maximum (MAX) scenarios, the annual roundwood removals from regeneration fellings were selected from the years 2009 and 2007 having smallest and largest total roundwood removals at the forestry centre level, respectively. At the forestry centre level, the scenarios MIN, AVG and MAX represent annual final fellings of approximately 2.3 mill. m3, 3.5 mill. m3 and 3.9 mill. m3, respectively (Fig. 3).
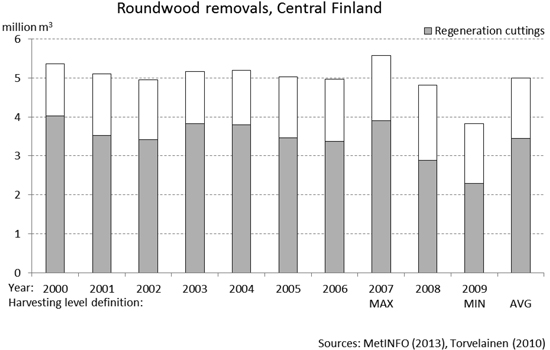
Fig. 3. Roundwood removals and the harvesting level definitions for the annual final fellings in Central Finland.
3.4 Stump recovery rate
The stump biomass, i.e. the biomass of stumps and roots (> 1 cm), was computed for each tree as a function of the tree species, the diameter at breast height and the height of the tree using biomass models for pine, spruce and birch trees (Repola 2008, 2009). The explanatory variable was diameter at breast height for the pine and spruce models, and diameter and height for the birch model. For the ENSO and KYMI data sets, the tree height curves at plot level were estimated using sample tree measurements and the approach presented by Siipilehto (1999).
The stump recovery rate is described as the share of the collected stump biomass out of the total stump biomass in the stand after following the basic forestry guidelines presented by Tapio (2006) and the guidelines for the harvesting of forest biomass for energy wood (see Äijälä et al. 2010; Kärhä 2012). In the analyses, the following rules were followed:
- all stumps with a diameter of less than 20 cm were left on the harvesting site (Kärhä 2012)
- in addition to the small stumps above, 25 larger stumps per hectare were not extracted: this selection is done randomly, starting from stumps of deciduous tree species.
The stump diameter (ds) mentioned above was approximated here as a transform, ds = 2 + 1.25d, where d is the diameter at breast height (cm), (see, for example, Repola 2008, 2009). One hundred simulation runs were conducted for each stand in the study materials, SPATI, ENSO and KYMI, and the mean stump recovery value was calculated for each stand based on these simulation runs.
Results for the value of the stump recovery rate are presented in Table 4. The total mean value for the stump recovery value was 0.89. Following these results, the value of the stump recovery parameter in the model application was set at a value 0.9.
| Table 4. Summary statistics for the stump recovery values in the study materials by stand categories, (SD = standard deviation, n = number of stands). | ||||||
| Stand category | Data set | n | mean | SD | min | max |
| Pine stands | SPATI | 13 | 0.89 | 0.041 | 0.82 | 0.95 |
| ENSO | 7 | 0.86 | 0.12 | 0.60 | 0.95 | |
| KYMI | 11 | 0.91 | 0.032 | 0.86 | 0.95 | |
| Spruce stands | SPATI | 25 | 0.88 | 0.044 | 0.78 | 0.96 |
| ENSO | 1 | 0.93 | - | 0.93 | 0.93 | |
| KYMI | 12 | 0.93 | 0.02 | 0.88 | 0.95 | |
| Mixed stands | SPATI | 25 | 0.87 | 0.051 | 0.78 | 0.94 |
| ENSO | 19 | 0.89 | 0.032 | 0.82 | 0.94 | |
| KYMI | 33 | 0.91 | 0.034 | 0.84 | 0.97 | |
3.5 Environmental criteria and constraints
The technical and economic accessibility of the biomass from logging residues and stumps, together with the environmental criteria, such as protecting forest soil, affect the bioenergy potential of forest chips. These regulations and criteria were implemented in the calculation model as constraints (Table 5, basic and optional constraints) that limit the availability of the forest biomass.
Guidelines for harvesting the forest biomass for energy, presented by Tapio, the Finnish Forestry Development Centre, were used for the model calculations (Äijälä et al. 2010), in addition to the general Finnish forestry guidelines (Tapio 2006). These operational recommendations for energy wood harvesting in Finland include ecological guidelines for protecting forest soil and the remaining trees. The technical recovery parameters for the residues and stumps applied in this study partly account for these aims. The economic accessibility constraints (Table 5) are based on instructions from the Internet sites of Finnish companies (see Lehtonen et al. 2010). Logging residues and stumps in poor soils should not be recovered, and buffer zones around remaining trees should be left at the stump harvesting sites.
| Table 5. Constraints applied in the calculation system to account for the technical, economic and environmental protection criteria. | |
| Constraint | Value or measure |
| Basic constraints (I) | |
| Net annual increment | Harvesting levels in scenarios are below the net annual increment level in Central Finland, (see, for example, MetINFO (2013)) |
| Technical accessibility | |
| – recovery rate for logging residues | 70%, (Äijälä et. al 2010) |
| – recovery rate for stump extraction | 90%, (see section 3.4) |
| – the proportion of unmerchantable stem top | Scots pine: 4%, Norway spruce: 5%, (Hakkila et al. 2004); broadleaved tree species: 17% (for Southern Finland, see Peltola and Ihalainen 2010, p. 72) |
| – steepness of slope | steepness ≤ 20 degrees, (Ponsse 2012) |
| Economic accessibility | |
| – minimum recovery volume for logging residues | 20 m3/ha and 40 m3/stand |
| – minimum recovery volume for stumps | 100 m3/stand |
| – minimum area for stump harvesting | 2 ha |
| Protection of forest soil | |
| – recovery of logging residues and stumps | Only from fertile stands, i.e. feasible site fertility classes: 1–4 (Äijälä et al. 2010) |
| Protection of water and remaining trees | A buffer zone of 3 m at stump harvesting sites (Äijälä et al. 2010) |
| Optional constraints (II and III) | |
| – maximum actual forwarding distance (II) | 300 metres, (Uotila and Viitala 2000) |
| – dominating tree species in regeneration stands for stump extraction (III) | Norway spruce |
Generally, the stand-wise totals (in tonnes) of the biomass variables were obtained by multiplying the average biomass (t/ha) in the stand (see Table 3) by the area of the stand (ha). Thereafter, the technical accessibility was implemented using coefficients for the recovery rates for logging residues, stump extraction, the proportion of the unmerchantable stem top and the effect of the slope (see text below). Additionally, 3-metre buffer zones at the edges of the stump harvesting sites were created (Quantum GIS Development Team 2013), and they were extracted from the stump recovery area when computing the stand-wise biomass of the stumps (see Table 3, below-ground biomass). Basic densities (see Table 6) were applied for evaluating the economic accessibility of the stands.
The steepness of terrain slope technically limits the ability to perform mechanical harvesting. For example, the operating instructions for forest machinery mention a slope angle limit of 20 degrees (Ponsse 2012). Furthermore, in order to diminish the risk of erosion and nutrient leaching, steep slopes should be avoided. A limit of 35% (≈ 20 degrees) has been suggested by Fernholz et al. (2009) and Vasaitis et al. (2008). In this study, it was assumed that the proportion of biomass harvested in a stand is relative to the share of the feasible area (slope ≤ 20 degrees) in that stand. This share of feasible area in a stand is described using a slope coefficient (Fig. 4).
For analysing the slope, the 25-metre resolution DEM was first resampled to a 20-metre cell size using nearest neighbour resampling. After this, a slope raster and a 1/0 -valued “feasible slope” raster were created. Zonal raster analyses (mean value) were then used to obtain the share of the area where the steepness of the slope was less or equal to 20 degrees (Fig. 4). If the share of the feasible area in a segment was 0.50 or smaller, then that particular segment was excluded from the analyses. Otherwise, the biomass available in a stand was calculated by multiplying the total biomass in the stand by the slope coefficient value in that particular stand. It can be noted here that the slope coefficient was also applied in selecting stands for regeneration to fulfil the harvesting level for each municipality.
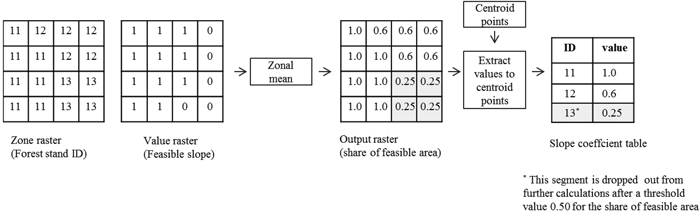
Fig. 4. Calculation of the slope coefficient for the segments was based on raster overlay analyses using a 20 metre grid cell: the “Feasible slope” is a DEM-based, logical raster layer indicating whether the steepness of the slope is less or equal to 20 degrees (1:TRUE; 0: FALSE).
The MS-NFI data was used for raster overlay GIS distance analysis to aid in finding the distance to the nearest road from each centroid point of the segment. The actual forwarding distance was calculated by multiplying the direct distance from the stand centroid to the nearest road by a winding factor value of 1.4 (Uotila and Viitala 2000). As an optional constraint (II), a maximum actual forwarding distance limit of 300 metres was applied to select the regeneration sites that were economically the most feasible in this sense for biomass harvesting. In Southern Finland, the average actual forwarding distance is close to 360 metres (Uotila and Viitala 2000, p. 29).
In Finland, stump harvesting is mostly limited to the regeneration sites that are dominated by Norway spruce due to the shallow root system of Norway spruce and the good yield of stump wood per hectare. In the case of Scots pine, the stump harvesting is made more difficult by the deep tap root that also carries stones and impurities to the extracted stump wood material (Laitila et al. 2008). Thus, an optional constraint (III) involved selecting the stump recovery sites from among only the regeneration sites dominated by Norway spruce. The effects of these optional constraints on the biomass potential were analysed separately at the Forestry centre level.
In addition, an unconstrained theoretical potential at the Forest centre level was calculated for the harvesting level definition, AVG. The theoretical potential was obtained by summing up the biomass of logging residues and stumps from all of the stands selected for regeneration cutting. Table 5 shows the proportions of the unmerchantable stem tops that were assumed for the tree species’ categories.
3.6 Sampling loop
Calculating stand site classes as pixel-level mode values tends to produce more peaked distributions than the actual site class distribution, i.e. the distribution based on the Finnish NFI (Peltola and Ihalainen 2010). Thus, it was necessary to adjust the site (fertility) class distribution in the stand attribute table to match the NFI-based distribution (Fig. 5). For that reason, stands were selected randomly from a source class and transferred to a target class until the share of the target class was large enough or until the source class was empty. The target class was always the neighbouring class on the tail side of the distribution. The transferring process started on both tails of the distribution, with the second outermost class as the source class, and proceeded towards the centre of the distribution.
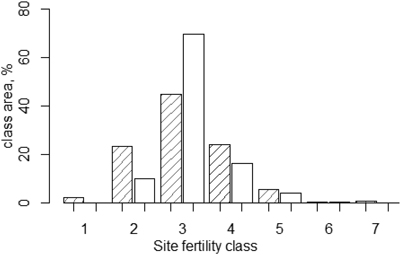
Fig. 5. Adjusting the site class distribution in the stand attribute table (bars without a line pattern) was based on a distribution adapted from Peltola and Ihalainen (2010), (bars with a line pattern).
The potentials of the primary forestry residues (logging residues, stumps) were computed as follows. At first, the stands that were available for regeneration were detected using the Finnish forestry operational guidelines, where the regeneration criteria comprise the minimum mean diameter for each of the soil fertility classes (see Tapio 2006). The stands were selected randomly for final felling from the available stands until the harvesting level from the final felling (in m3) was achieved for each municipality. Finally, the computation of the potential of forest chips from final felling was based on the selected stands that satisfied the given set of constraints (Table 5). Following the approach presented by Vis et al. (2010), the amount of logging residue (crown biomass) was calculated as the sum of the branch biomass, foliage biomass and biomass of the unmerchantable stem top.
3.7 The number of replicates
The sampling variance in the calculation results is composed of two components: the variance due to the site class distribution adjustment (![]() ) and the variance due to the selection of stands for regeneration (
) and the variance due to the selection of stands for regeneration (![]() ). In order to estimate the variance components, the site class adjustment was repeated 25 times, and for each site class adjustment the stand selection was repeated 200 times. Altogether, the results were computed 5000 times using the basic constraints and AVG harvesting level. The estimate of the variance due to stand selection was the mean value
). In order to estimate the variance components, the site class adjustment was repeated 25 times, and for each site class adjustment the stand selection was repeated 200 times. Altogether, the results were computed 5000 times using the basic constraints and AVG harvesting level. The estimate of the variance due to stand selection was the mean value ![]() , i = 1,2,…,25, where x stands for sum of the biomass from logging residues and stumps at the forestry centre level, and Vari(x) is the variance among 200 samples given a fixed site class distribution. The estimate of the variance due to site class adjustment was
, i = 1,2,…,25, where x stands for sum of the biomass from logging residues and stumps at the forestry centre level, and Vari(x) is the variance among 200 samples given a fixed site class distribution. The estimate of the variance due to site class adjustment was ![]() , where
, where ![]() is the mean value of the 200 samples given a fixed site class distribution.
is the mean value of the 200 samples given a fixed site class distribution.
Out of the total variance among all SSs (stand selection) and SCs (site class adjustment) in the test simulation data, the ![]() was 97% for the residue biomass and more than 99% for the stump biomass and the total biomass at the forestry centre level. Thus, the variance due to site class adjustment (
was 97% for the residue biomass and more than 99% for the stump biomass and the total biomass at the forestry centre level. Thus, the variance due to site class adjustment (![]() ) was very small compared to the variance due to stand selection for regeneration (
) was very small compared to the variance due to stand selection for regeneration (![]() ).
).
Based on the estimates of the variance components, the final results were computed from 500 replicates for each municipality. Replicates were generated by repeating the site class adjustment 5 times and repeating the stand selection 100 times for each site class distribution. The ratio 5/100 roughly approximates the optimal ratio of sample sizes in two phase sampling (Cochran 1977).
3.8 Reporting
The estimates of the municipality-level potential of forest chips were computed as the mean of 500 replicates. The mean values of the biomass dry weight (tonnes) were converted into solid volume units (m3) and energy units (GJ). The tonnes of dry weight biomass were converted into the volume (v, (m3)) of the biomass assortment by dividing the dry weight (md, (t)) by the basic density (r0g, (t/m3)) (Table 6):
![]()
The tonnes of dry weight were converted into energy (W) units (GJ) as follows. Given a lower heating value (Qnet,d, (MJ/kg)) for a biomass assortment and assuming moisture as received (Mar, (%)), the biomass assortment was converted from tonnes dry weight (md) into energy units as follows:

where a lower heating value as received (Qnet,ar) is calculated as follows:
![]()
The approach presented briefly above (in Eq. 2 and Eq. 3) is adapted from Alakangas (2000).
The parameter values for the lower heating values (Qnet,d) were adapted from the existing literature for pine, spruce and broadleaved trees (Table 6). The moisture rate of the logging residues and stumps as received was assumed to be 50% and 35%, respectively (see, for example, Alakangas 2000).
| Table 6. Basic densities (r0g) and lower heating values of dry matter (Qnet,d) for the different biomass types. | ||
| Biomass type | r0g, (t/m3) | Qnetd, (MJ/kg) |
| Logging residues, Scots pine 1) | 0.395 a) | 20.5 c) |
| Logging residues, Norway spruce 2) | 0.465 a) | 19.7 c) |
| Logging residues, broadleaved 2) | 0.500 a) | 19.7 c) |
| Stumps, Scots pine | 0.475 a) | 19.5 c) |
| Stumps, Norway spruce | 0.435 a) | 19.1 c) |
| Stumps, broadleaved | 0.450 b) | 18.5 d) |
| Notes: 1) With needles; 2) Without needles or foliage. Sources: a) Alakangas (2000), p. 45; b) estimated based on the study by Kärkkäinen (2007), p. 156; c) Alakangas (2000), p. 44; d) p. 67. | ||
4 Results
4.1 Sampling variance
The variations due to the random selection of stands for regeneration within the municipalities increased with more constraints (Fig. 6). In terms of the theoretical potential, all crown and stump biomass is accessible in any selection of regeneration stands and the variation is quite small, with a median value of 0.28% and a mean value of 0.32%. In the cases of constraints ”I” and ”II & III”, the median values for the coefficient of variation resulted in 2.3% and 6.0%, respectively (Fig. 6). The mean values for these cases were 2.8% and 6.8%, respectively.
By setting ns at a value of 25, 100 and 500, the SD(%) for the sample mean would, on average, be 1.4% , 0.68% and 0.31%, respectively, with all basic and optional constraints (in the case “II & III”). This shows that a total of 500 replicates are enough for analysing the crown and stumps biomass together.
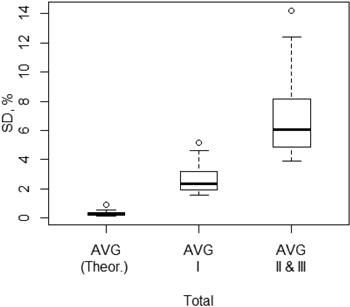
Fig. 6. Coefficient of variation (SD, %) within municipalities in the set of replicates (ns = 500) for the theoretical potential (Theor.) and for the technical potentials of forest chips from final fellings in Central Finland in the harvesting level AVG under different sets of constraints; (I: basic constraints; II: basic constraints and an actual forwarding distance limit of 300 m; III: basic constraints and a stump extraction limit to regeneration stands dominated by Norway spruce). (In the boxplot, the box region shows the range between 1st and 3rd quartiles (including 50% of the observations), the thick line is the median and the outer lines extend to the most extreme data point which is no more than 1.5 times the length of the box away from the box. The most extreme observations are also plotted (R Core Team 2012)).
4.2 Potential of forest chips
The technical potentials (in tonnes dry mass) for the three harvesting scenarios, MIN, AVG and MAX, are presented in Fig. 7, where the theoretical potential is also presented for the AVG harvesting level definition.
When only the basic constraints were applied, the annual forest-centre-level potentials for the residues in the MIN, AVG and MAX scenarios were 212 000 tonnes (470 000 m3), 320 000 tonnes (710 000 m3) and 361 000 tonnes (810 000 m3), respectively (Fig. 7a). For stumps, the results for the MIN, AVG and MAX scenarios were 141 000 tonnes (310 000 m3), 212 000 tonnes (470 000 m3) and 240 000 tonnes (530 000 m3), respectively (Fig. 7b). The results for the spruce stumps in the harvesting levels MIN, AVG and MAX were 71 900 tonnes (165 000 m3), 109 000 tonnes (250 000 m3) and 123 000 tonnes (280 000 m3), respectively.
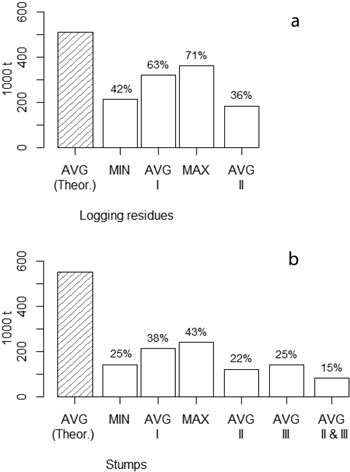
Fig. 7. Theoretical potential (Theor.) and the technical potentials in Central Finland for logging residues (a) and stumps (b) from final fellings in the harvesting levels MIN, AVG and MAX under different sets of constraints (I: basic constraints; II: basic constraints and an actual forwarding distance limit of 300 m; III: basic constraints and a stump extraction limit to regeneration stands dominated by Norway spruce). At the top of each bar there is the percentage that the bar represents of the theoretical potential.
The municipality-level technical potentials of forest chips from final fellings in tonnes dry mass (1000 t) are presented in Table 7. The results were calculated for the AVG harvesting level definition and all of the basic and optional constraints (Table 5) were applied.
Following the results presented in Table 7, the technical potential of forest chips from final fellings for energy in Central Finland is 0.26 million tonnes (dry mass), that is 4.6 million GJ (1.3 TWh). The energy potentials from logging residues and stumps are 3.2 million GJ (0.9 TWh, 70%) and 1.4 million GJ (0.4 TWh, 30%), respectively. Moreover, in the MIN and MAX scenarios the technical potentials in Central Finland resulted in 0.85 TWh and 1.5 TWh, respectively, when applying all basic and optional constraints. The theoretical potential that was based on the AVG scenario resulted in 5.2 TWh.
| Table 7. Potential of forest chips from final fellings by municipality (1000 tonnes dry mass), applying all basic and optional constraints; the harvesting level AVG is assumed (Residue = logging residues; Stump = stumps and roots; pine = Pinus sylvestris L.; spruce = Picea abies (L.) Karst.; broadl. = broadleaved tree species (mainly Betula pendula, B.pubescens, Alnus incana, Populus tremula)). Total % value is relative to the theoretical potential. | ||||||||||
| Municipality | Residue | Stump | Residue | Stump | Total | Total % | ||||
| pine | spruce | broadl. | pine | spruce | broadl. | All | All | |||
| Hankasalmi | 1.6 | 6.5 | 1.5 | 1.1 | 3.6 | 0.7 | 9.6 | 5.5 | 15.1 | 31.5 |
| Joutsa | 3.2 | 6.7 | 2.5 | 1.1 | 2.5 | 0.7 | 12.4 | 4.3 | 16.6 | 24.1 |
| Jyväskylä | 3.7 | 10.0 | 2.8 | 2.4 | 5.5 | 1.3 | 16.6 | 9.2 | 25.8 | 29.1 |
| Jämsä | 4.6 | 10.9 | 3.1 | 2.8 | 5.9 | 1.4 | 18.6 | 10.1 | 28.7 | 28.1 |
| Kannonkoski | 1.4 | 2.3 | 0.6 | 0.5 | 0.9 | 0.2 | 4.4 | 1.5 | 5.9 | 20.8 |
| Karstula | 2.3 | 3.1 | 1.0 | 0.6 | 1.2 | 0.2 | 6.3 | 2.0 | 8.3 | 18.7 |
| Keuruu | 4.7 | 7.7 | 2.1 | 1.4 | 2.8 | 0.5 | 14.6 | 4.6 | 19.2 | 24.1 |
| Kinnula | 0.8 | 1.0 | 0.3 | 0.2 | 0.4 | 0.1 | 2.1 | 0.7 | 2.8 | 17.9 |
| Kivijärvi | 1.3 | 1.9 | 0.6 | 0.3 | 0.6 | 0.1 | 3.8 | 1.0 | 4.8 | 18.9 |
| Konnevesi | 1.3 | 4.8 | 1.2 | 0.9 | 2.6 | 0.6 | 7.2 | 4.0 | 11.2 | 27.5 |
| Kuhmoinen | 2.6 | 6.5 | 1.7 | 1.6 | 3.4 | 0.8 | 10.8 | 5.8 | 16.6 | 28.3 |
| Kyyjärvi | 0.8 | 0.6 | 0.2 | 0.0 | 0.1 | 0.0 | 1.6 | 0.2 | 1.8 | 10.9 |
| Laukaa | 2.0 | 5.4 | 1.4 | 1.2 | 2.9 | 0.6 | 8.9 | 4.7 | 13.6 | 27.8 |
| Luhanka | 0.5 | 1.3 | 0.4 | 0.2 | 0.6 | 0.2 | 2.2 | 1.0 | 3.2 | 20.8 |
| Multia | 1.8 | 3.4 | 0.8 | 0.8 | 1.6 | 0.2 | 6.0 | 2.6 | 8.6 | 24.9 |
| Muurame | 0.4 | 1.1 | 0.3 | 0.3 | 0.6 | 0.1 | 1.7 | 1.0 | 2.8 | 28.9 |
| Petäjävesi | 1.7 | 3.9 | 1.0 | 0.9 | 2.0 | 0.4 | 6.6 | 3.2 | 9.8 | 30.2 |
| Pihtipudas | 2.8 | 3.9 | 1.2 | 0.7 | 1.3 | 0.2 | 7.9 | 2.2 | 10.1 | 19.8 |
| Saarijärvi | 3.2 | 5.7 | 1.5 | 1.2 | 2.6 | 0.5 | 10.4 | 4.3 | 14.7 | 21.5 |
| Toivakka | 1.2 | 2.5 | 0.9 | 0.4 | 0.9 | 0.3 | 4.6 | 1.6 | 6.2 | 23.5 |
| Uurainen | 0.9 | 2.1 | 0.5 | 0.4 | 1.0 | 0.2 | 3.6 | 1.5 | 5.1 | 23.3 |
| Viitasaari | 4.2 | 7.0 | 1.9 | 1.3 | 2.5 | 0.5 | 13.1 | 4.3 | 17.4 | 23.1 |
| Äänekoski | 2.4 | 6.4 | 1.5 | 1.3 | 3.3 | 0.7 | 10.3 | 5.3 | 15.6 | 25.9 |
| SUM | 49.5 | 104.6 | 29.1 | 21.5 | 48.8 | 10.4 | 183.2 | 80.8 | 264.0 | 24.9 |
| kg/ha a) | 35.7 | 75.4 | 21.0 | 15.5 | 35.2 | 7.5 | 132.0 | 58.2 | 190.2 | – |
| a) kg dry mass; Area of forest land in Central Finland: 1 388 000 ha (Peltola and Ihalainen 2012). | ||||||||||
5 Discussion and conclusions
Based on the fact that we utilised remote sensing satellite data in the analyses, a certain degree of uncertainty in the modelling approach stems from the satellite remote sensing-based forest variable estimations (see also Kärkkäinen at al. 2008; Mäkelä et al. 2011). For example, the limited point accuracy of the satellite image-based estimation of forest variables has so far limited the analysis of the potential of small trees harvested for energy wood. The segmentation techniques also produced uncertainty regarding the location of the stand boundaries. However, the general applicability of the calculation model as a whole, i.e. the spatial analysis utilising existing map data, gives a very good starting point for analysing forest bioenergy potentials. Forest stand data registers from the operational forest inventory by compartments are another good data source for model applications, like the one in this study.
With the calculation system that we applied, the harvesting level definition directly affects the level of the resulting technical potentials. Vis et al. (2010) mention that integrating the existing net annual increment (NAI) statistics into the work flow for a basic spatially explicit approach provides an indication of the annual biomass production capacity. For a more advanced spatially explicit approach, like the one used in this study, a biomass map was produced using a remote sensing technique (Tuominen et al. 2010) and linked to NAI statistics via harvesting level definitions. The annual total drain in Central Finland for the years 2000–2009 has been 5.2–6.7 million m3 (MetINFO 2013). The annual total increment for the years 2004–2008 on forest and scrub land available for wood supply has been 8.33 million m3/a (Peltola and Ihalainen 2010, p. 75). The harvesting levels defined in this study are then assumed to represent a level that is lower than the level of the net annual increment. In this study, these harvesting levels were given to the analysis as the definitions AVG, MIN and MAX for industrial roundwood removals in Central Finland. The annual harvesting levels from regeneration cuttings in Central Finland ranged from 2.3 to 3.9 mill. m3. Using harvesting level definitions that are based on the statistics presented here, it was possible to examine the true fluctuations in the annual biomass of logging residues and stumps.
In this study, we accounted for the technical and environmental constraints and operational instructions for forestry operations in a spatially explicit way. GIS analyses need to be performed and various models and data need to be used with this type of approach. Preparing the input data for analysis, applying techniques for multi-source remote sensing and performing image segmentation is a quite demanding and laborious task. The working procedures, computer software tools and biometric models for these analyses therefore need to be further developed to make it easier to implement these techniques in the future. With this approach, forest information in GIS databases can be used and the results can be applied to strategic decision making in the field of forest bioenergy production.
The random variation in the simulation outcome results originates from adjusting the site class distribution to match the NFI-based distribution and from selecting the stands for regeneration. Adjusting the site classes randomly can cause the set of stands capable of being regenerated to be slightly different in each case. The randomly selected stands for final felling then constituted the set of stands to which the given constraints were applied. The spatial location of the regeneration stands and the distribution of forest resources to municipalities of different sizes affect the amount of variation in the results. The municipalities in the study area are of different sizes and the results are relatively more precise for larger municipalities. In this study, we noted that most of the variation was produced by the random selection of the stands for final fellings. We found that 500 replicates was a reasonable amount of replicates for computing the municipality-level potentials.
Forest energy potentials have also been computed for Central Finland using other methods where the potentials are derived, without any spatial aspects, directly from the statistics on the removals of industrial roundwood by Finnish municipalities (Anttila et al. 2013). At the forest-centre-level, with the basic and optional constraints, we estimated that the potentials for logging residues and stumps were 183 000 tonnes (409 000 m3) and 81 000 tonnes (181 000 m3), respectively. Both of these are low (at the 68% level) compared to the results in the study by Anttila et al. (2013); their results show potentials of 599 000 m3 and 265 000 m3 for logging residues and stumps, respectively. Their analyses are based on the years 2002–2011, which had the same average level of roundwood removals compared as in this study (2000–2009) (see MetINFO 2013). In their study, Anttila et al. (2013) applied recovery rates of 0.70 and 0.95 for crown biomass and stumps, respectively.
Notable differences resulted when the optional constraints were applied in this study. After also introducing the optional constraints, the technical potentials for the residues and stumps are roughly 60% and 40%, respectively, of those for the basic constraints in the average scenario. Furthermore, the results by Anttila et al. (2013) contain Norway spruce stumps only. The results for the spruce stumps (250 000 m3) after only applying basic constraints to the average harvesting level are close to the results reported by Anttila et al. (2013).
Analyses of the forest biomass potentials have been integrated into the MELA System (Siitonen et al. 1996), which is a Finnish forestry model and an operational decision support system for forest management planning (see Kärkkäinen et al. 2008). A MELA analysis with NFI10-NFI11 data for the largest sustainable harvesting level of merchantable wood and energy wood in Central Finland for the years 2009–2018 shows a cutting removal rate of 6.2 million m3/a for merchantable wood. From regeneration cuttings, the reported energy wood removal for crown biomass was 589 000 m3/a, and for stumps 770 000 m3/a. A stump diameter of 25 cm or larger was required. The recovery rates for logging residues and stumps were 0.70 and 0.85, respectively (see MetINFO – MELA 2013).
In the basic scenario proposed by Kärhä et al. (2010), the techno-ecological biomass potential of forest chips in Central Finland in the year 2020 was estimated to be 3.3 TWh, of which 1.1 TWh and 1.3 TWh come from logging residues and stumps, respectively, and 0.9 TWh from small trees. The recovery rates 0.70 (logging residues), 0.85 (pine stumps) and 0.90 (spruce stumps) were assumed. In addition, separate percentages, i.e. 72% (logging residues) and 85% (stumps), were assumed to represent the share of feasible harvesting sites in Central Finland (for further details of the approach, see Kärhä et al. 2010). In this study, when applying the basic set of constraints, the potential in Central Finland resulted in 2.6 TWh, which was comprised of logging residues (1.6 TWh) and stumps (1.0 TWh).
In Central Finland, the consumption of forest chips in 2012 has been 1.07 million m3, of which 325 000 m3 was logging residues and 32 000 m3 was from large-sized timber (Ylitalo 2013). The consumption of logging residues represents 80% of the potential estimated using the basic and optional constraints. The amount of stump and root biomass used in 2012 was 205 000 m3, indicating that part of the feedstock originates outside Central Finland.
We carried out a separate simulation study to establish the stump recovery rate as a means of supporting the parameter value setting. For example, in an earlier study (Lehtonen et al. 2010), a stump recovery rate of 95% was used and the simulation experiments indicated a slightly lower value, 90%, for this parameter. Naturally, the width of the buffer zones applied around, for example, the remaining trees and the existence of special habitats affect the operational stump recovery rate.
Remote sensing-based inventories of natural resources offer invaluable information that can be used for decision making in forestry and bioenergy issues. Besides satellite image data, Airborne Laser Scanning (ALS) has recently become into operational use for forest inventories at forestry centres in Finland. This can open up new possibilities for biomass potential analyses, too. Moreover, the multi-source forest inventory result database, which includes raster maps of the biomass in Finland, was recently given an open access and this will also aid in developing applications. The information value of the biomass component output in forest inventories has now proven to be high. As the harvesting of small trees for forest bioenergy increases, remote automatic methods for detecting the potential young stands suitable for energy wood harvesting is also an important topic of future research.
The spatially explicit method used in this study is capable of taking into account the constraints that rely on map data, such the actual forwarding distance. After conducting a GIS analysis, the new attribute can be imported into the segment attribute table for further use in calculations. The next steps might be further studies utilising road map data to calculate the supply cost by optimising the biomass flow from the stands to the plants (see, for example, Ranta 2005; Kanzian et al. 2009). More accurate and detailed stand inventory data would make it possible to simulate the development and operations for the stands and optimise forest management (Rørstad et al. 2010). Stand inventory databases may not always, however, be available. For those situations, our method of using a harvesting scenario approach seems to be a feasible solution.
The variation present in the simulation outcomes at the municipality level represents the uncertainty that exists in the operational markets for roundwood. Instead of using even probabilities in the random sampling of segments for regeneration cutting, different weights could be used according to owner type or category. This would require integrating timber selling behaviour aspects or information on the forest owners’ preferences into analyses of the forest energy potentials.
The critical prerequisites for using the advanced, spatially explicit approach to analysing forest energy potentials may lie in the existence of spatially explicit forest inventory data and the biometric models for tree biomass assortments for the various tree species. To support the important sustainability criteria in the decision-making process, the importance of a reliable and objective forest inventory system at national and regional levels cannot be emphasised too much.
Acknowledgements
The authors would like to thank Dr Kari T. Korhonen, Dr Sakari Tuominen and Dr Juha Laitila for their valuable comments and help during the study, as well as Dr Aleksi Lehtonen and Paula Puolakka for their help and earlier work in starting this study.
References
Äijälä O., Kuusinen M., Koistinen A. (2010). Hyvän metsänhoidon suositukset energiapuun korjuuseen ja kasvatukseen. [Forest management recommendations for energy wood harvesting and silviculture]. Forestry Development Centre Tapio. 31 p. http://www.tapio.fi/files/tapio/Aineistopankki/Energiapuusuositukset_verkkoon.pdf. [Cited 26 Sep 2012]. [In Finnish].
Alakangas E. (2000). Suomessa käytettyjen polttoaineiden ominaisuuksia. [Properties of fuels used in Finland]. Technical Research Centre of Finland (VTT). Research Notes 2045. http://www.vtt.fi/inf/pdf/tiedotteet/2000/T2045.pdf. [Cited 13 Feb 2013]. [In Finnish].
Anttila P., Haara A., Maltamo M., Miina J., Päivinen R. (2001). Metsän mittauksen tutkimusaineistoja. [Research data for forest mensuration]. Joensuun yliopisto, metsätieteellinen tiedekunta.9 p. + CD-rom. ISBN 952-458-004-7. [In Finnish].
Anttila P., Nivala M., Laitila J., Korhonen K.T. (2013). Metsähakkeen alueellinen korjuupotentiaali ja käyttö. [Regional harvesting potential and use of forest chips]. Metlan työraportteja / Working Papers of the Finnish Forest Research Institute 267. 24 p. http://www.metla.fi/julkaisut/workingpapers/2013/mwp267.htm. ISBN 978-951-40-2420-7 (PDF). [Cited 21 Aug 2013]. [In Finnish].
Castellano P.J., Volk T.A., Herrington L.P. (2009). Estimates of technically available woody biomass feedstock from natural forests and willow biomass crops for two locations in New York State. Biomass and Bioenergy 33: 393–406. http://dx.doi.org/10.1016/j.biombioe.2008.08.001.
Cochran W.G. (1977). Sampling techniques. 3. ed. Wiley, New York. 428 p.
Elevation model 25 m. (2013). National Land Survey of Finland. http://www.maanmittauslaitos.fi/en/digituotteet/elevation-model-25-m. [Cited 12 Mar 2013].
Esri Products. (2013). http://www.esri.com/products. [Cited 25 Feb 2013].
EU. (2009). Directive 2009/28/EC of the European Parliament and of the Council of 23 April 2009 on the promotion of the use of energy from renewable sources and amending and subsequently repealing Directives 2001/77/EC and 2003/30/EC. http://europa.eu/legislation_summaries/energy/renewable_energy/en0009_en.htm. [Cited 21 Aug 2013].
Fernholz K., Bratkovich S., Bowyer J., Lindburg A. (2009). Energy from woody biomass: A review of harvesting guidelines and a discussion of related challenges. Dovetail Partners Inc., United States.
Hakkila P. (2004). Developing technology for large-scale production of forest chips. Technology programme report 6/2004. Tekes. 99 p. http://akseli.tekes.fi/opencms/opencms/OhjelmaPortaali/ohjelmat/Puuenergia/en/etusivu.html. [Cited 26 Feb 2013].
Jones G., Loeffler D., Butler E., Hummel S., Chung W. (2013). The financial feasibility of delivering forest treatment residues to bioenergy facilities over a range of diesel fuel and delivered biomass prices. Biomass and Bioenergy 48: 171–180. http://dx.doi.org/10.1016/j.biombioe.2012.11.023.
Kangas A., Maltamo M. (2000a). Percentile based basal area diameter distribution models for Scots pine, Norway spruce and birch species. Silva Fennica 34(4): 371–380.
Kangas A., Maltamo M. (2000b). Performance of percentile based diameter distribution prediction and Weibull method in independent data sets. Silva Fennica 34(4): 381–398.
Kanzian C., Holzleitner F., Stampfer K., Ashton S. (2009). Regional energy wood logistics – optimizing local fuel supply. Silva Fennica 43(1): 113–128.
Kärhä K. (2012). Comparison of two stump-lifting heads in final felling Norway spruce stand. Silva Fennica 46(4): 625–640.
Kärhä K., Elo J., Lahtinen P., Räsänen T., Keskinen S., Saijonmaa P., Heiskanen H., Strandström M., Pajuoja H. (2010). Kiinteiden puupolttoaineiden saatavuus ja käyttö Suomessa vuonna 2020. [Availability and use of solid wood fuels in Finland in 2020]. Ministry of Employment and the Economy. Publications, Energy and the climate 66/2010. 68 p. http://www.tem.fi/files/28437/TEM_66_2010_verkkojulkaisu.pdf. [Cited 10 Apr 2013]. [In Finnish].
Kärkkäinen L., Matala J., Härkönen K., Kellomäki S., Nuutinen T. (2008). Potential recovery of industrial wood and energy wood raw material in different cutting and climate scenarios for Finland. Biomass and Bioenergy 32(10): 934–943. http://dx.doi.org/10.1016/j.biombioe.2008.01.008.
Kärkkäinen M. (2007). Puun rakenne ja ominaisuudet. [Structure and properties of wood]. Metsäkustannus Oy, Helsinki. 468 p. [In Finnish].
Laasasenaho J. (1982). Taper curve and volume functions for pine, spruce and birch. Communicationes Instituti Forestalis Fenniae 108. 74 p.
Laitila J., Asikainen A., Anttila P. (2008). 1. Energiapuuvarat. [Energy wood resources]. In: Kuusinen M., Ilvesniemi H. (eds.). 2008. Energiapuun korjuun ympäristövaikutukset, tutkimusraportti. Tapion ja Metlan julkaisuja. p. 6–12. www.metsavastaa.net/energiapuu/raportti. [Cited 16 Apr 2013]. [In Finnish].
Laitila J., Heikkilä J., Anttila P. (2010). Harvesting alternatives, accumulation and procurement cost of small-diameter thinning wood for fuel in Central Finland. Silva Fennica 44: 465–480.
Lehtonen A., Anttila P., Puolakka P. (2010). Biomass energy Europe, illustration case for Finland, 2010. http://www.eu-bee.info. [Cited 22 Mar 2013].
Mahmoudi M., Sowlati T., Sokhansanj S. (2009). Logistics of supplying biomass from a mountain pine beetle-infested forest to a power plant in British Columbia. Scandinavian Journal of Forest Research 24: 76–86. http://dx.doi.org/10.1080/02827580802660397.
Mäkelä H., Hirvelä H., Nuutinen T., Kärkkäinen L. (2011). Estimating forest data for analyses of forest production and utilization possibilities at local level by means of multi-source National Forest Inventory. Forest Ecology and Management 262(8): 1345–1359. http://dx.doi.org/10.1016/j.foreco.2011.06.027.
MetINFO Forest Information Services. (2013). http://www.metla.fi/metinfo/index-en.htm. [Cited 18 Apr 2013].
MetINFO – MELA. (2013). Alueelliset hakkuumahdollisuusarviot. MELA Tulospalvelu TuPa. [Projections of regional cutting possibilities]. http://mela2.metla.fi/mela/tupa/tupaindex.htm. [Cited 19 Apr 2013]. [In Finnish].
Ministry of Employment and the Economy. (2010). Finland’s national action plan for promoting energy from renewable sources pursuant to Directive 2009/28/EC. Energy Department. 55 p. http://ec.europa.eu/energy/renewables/action_plan_en.htm. [Cited 21 Aug 2013].
Noon C., Daly M. (1996). GIS-based biomass resource assessment with BRAVO. Biomass and Bioenergy 10: 101–109. http://dx.doi.org/10.1016/0961-9534(95)00065-8.
Pekkarinen A. (2002). Image segment-based spectral features in the estimation of timber volume. Remote Sensing of Environment 82: 349–359. http://dx.doi.org/10.1016/S0034-4257(02)00052-4.
Peltola A., Ihalainen A. (2010). Forest resources. In: Ylitalo E. (ed.). Finnish Statistical Yearbook of Forestry. p. 37–88.
Peltola A., Ihalainen A. (2012). Forest resources. In: Ylitalo E. (ed.). Finnish Statistical Yearbook of Forestry. p. 37–78.
Petersson H., Ståhl G. (2006). Functions for below-ground biomass of Pinus sylvestris, Picea abies, Betula pendula and Betula pubescens in Sweden. Scandinavian Journal of Forest Research 21(7): 84–93. http://dx.doi.org/10.1080/14004080500486864.
Ponsse. (2012). Operating and service instructions, Ponsse Ergo 8W. Ponsse Plc.
Pukkala T., Kolström T., Miina J. (1994). A method for predicting tree dimensions in Scots pine and Norway spruce stands. Forest Ecology and Management 65: 123–134. http://dx.doi.org/10.1016/0378-1127(94)90164-3.
Quantum GIS Development Team. (2013). Quantum GIS geographic information system. Open Source Geospatial Foundation Project. http://qgis.osgeo.org. [Cited 22 Mar 2013].
R Core Team (2012). R: a language and environment for statistical computing. R Foundation for Statistical Computing, Vienna, Austria. http://www.R-project.org/. [Cited 20 Aug 2013]. ISBN 3-900051-07-0.
Ranta T. (2005). Logging residues from regeneration fellings for biofuel production – a GIS-based availability analysis in Finland. Biomass and Bioenergy 28(2): 171–182. http://dx.doi.org/10.1016/j.biombioe.2004.08.010.
Repola J. (2008). Biomass equations for birch in Finland. Silva Fennica 42(4): 605–624.
Repola J. (2009). Biomass equations for Scots pine and Norway spruce in Finland. Silva Fennica 43(4): 625–647.
Repola J., Ojansuu R., Kukkola M. (2007). Biomass functions for Scots pine, Norway spruce and birch in Finland. Working Papers of the Finnish Forest Research Institute 53. http://www.metla.fi/julkaisut/workingpapers/2007/mwp053.htm. [Cited 7 Feb 2013].
Rørstad P.K., Trømborg E., Bergseng E., Solberg B. (2010). Combining GIS and forest modelling in estimating regional supply of harvest residues in Norway. Silva Fennica 44: 435–451.
Siipilehto J. (1999). Improving the accuracy of predicted basal-area diameter distribution in advanced stands by determining stem number. Silva Fennica 33(4): 281–301.
Siitonen M., Härkönen K., Hirvelä H., Jämsä J., Kilpeläinen H., Salminen O., Teuri M. (1996). Mela handbook 1996 edition. Research Paper 622. The Finnish Forest Research Institute. 452 p.
Suutarla T. (1985). Kuvioittaisen inventoinnin päivitys ja sen luotettavuus. [Reliability in updating a stand-level forest inventory]. Metsänarvioimistieteen pro gradu. Helsingin yliopisto, maatalous-metsätieteellinen tiedekunta. 47 p. [In Finnish].
Tapio. (2006). Hyvän metsänhoidon suositukset. [Silvicultural guidelines]. Forestry Development Centre Tapio. 100 p. http://www.metsavastaa.net/hyvan-metsanhoidon-suositukset. [Cited 1 Mar 2013]. [In Finnish].
Tomppo E. (2006). The Finnish multi-source national forest inventory – small area estimation and map production. In: Kangas A., Maltamo M. (eds.). Forest inventory – methodology and applications. Springer, Netherlands. p. 195–224. http://dx.doi.org/10.1007/1-4020-4381-3_12.
Tomppo E., Katila M., Moilanen J., Mäkelä H., Peräsaari J. (1998). Kunnittaiset metsävaratiedot 1990–1994. [Forest resources by municipalities 1990–1994]. Metsätieteen aikakauskirja – Folia Forestalia 4B/1998: 619–839. [In Finnish].
Tomppo E., Haakana M., Katila M., Peräsaari J. (2008). Multi-source national forest inventory – methods and applications. Managing Forest Ecosystems 18. Springer. 374 p. ISBN 978-1-4020-8712-7.
Tomppo E., Katila M., Mäkisara K., Peräsaari J. (2012). The Multi-source National Forest Inventory of Finland – methods and results 2007. Metlan työraportteja / Working Papers of the Finnish Forest Research Institute 227. 233 p. ISBN 978-951-40-2357-6 (PDF). http://www.metla.fi/julkaisut/workingpapers/2012/mwp227.htm. [Cited 22 Feb 2013].
Torvelainen J. (2010). Harvesting and transportation of roundwood. In: Ylitalo E. (ed.). Finnish Statistical Yearbook of Forestry. p. 195–214.
Tuominen S., Eerikäinen K., Schibalski A., Haakana M., Lehtonen A. (2010). Mapping biomass variables with a multi-source forest inventory technique. Silva Fennica 44(1): 109–119.
Vasaitis R., Stenlid J., Thomsen I.M., Barklund P., Dahlberg A. (2008). Stump removal to control root rot in forest stands. A literature study. Silva Fennica 42(3): 457–483.
Vis M.W., van den Berg D., Anttila M.P., Böttcher H., Dees M., Domac J., Eleftheriadis I., Gecevska V., Goltsev V., Gunia K., Kajba D., Koch B., Köppen S., Kunikowski G., Lehtonen A.H.S., Leduc S., Lemp D., Lindner M., Mustonen J., Paappanen T., Pekkanen J.M., Ramos C.I.S., Rettenmaier N., Schneider U.A., Schorb A., Segon V., Smeets E.M.W., Torén C.J.M., Verkerk P.J., Zheliezna T.A., Zibtsev S. (2010). Harmonization of biomass resource assessments. Volume I: Best practices and methods handbook. 220 p. http://www.eu-bee.info. [Cited 15 Apr 2013].
Uotila E., Viitala E-J. (2000). Tietiheys metsätalouden maalla. [Forest road density in forestry land]. Metsätieteen aikakauskirja 1/2000: 19–33. [In Finnish].
Ylitalo E. (2013). Puun energiakäyttö 2012. [The energy use of wood 2012]. Metsätilastotiedote 15/2013. 7 p. http://www.metla.fi/tiedotteet/metsatilastotiedotteet/2013/puupolttoaine2012.htm. [Cited 7 May 2013].
Total of 56 references
Send to email
