Polina Volkova  ,
Alexey Shipunov,
Polina Borisova,
Reed Moseng,
Ranelle Ivens
,
Alexey Shipunov,
Polina Borisova,
Reed Moseng,
Ranelle Ivens
In search of hybridity: the case of Karelian spruces
Volkova P., Shipunov A., Borisova P., Moseng R., Ivens R. (2014). In search of hybridity: the case of Karelian spruces. Silva Fennica vol. 48 no. 2 article id 1072. https://doi.org/10.14214/sf.1072
Highlights
- Karelian spruces have morphology that is typical for P. obovata and characterized with genetic variation, described previously for P. abies
- Karelian spruces evolved due to introgression between P. abies and P. obovata. However, it is unclear whether Karelian spruces could be treated as P. fennica, because unequivocal morphological and genetic characters of the latter are still absent.
Abstract
Distribution ranges of spruces, European Picea abies and Siberian P. obovata intersect in the Eastern Europe and Urals, forming wide zone of introgressive hybridization where species discrimination is difficult. We applied both molecular (mtDNA and cpDNA sequences) and morphological approaches with goals of elucidating the origin of spruces in undisturbed forests of Russian Karelia (considered as part of the abovementioned introgression zone). Karelian spruces have morphology that is typical for P. obovata and characterized with genetic variation, described previously for P. abies. This contradiction between morphology and organellar DNA could be itself an evidence of hybrid origin because morphological data should have a genetic basis. If the genes responsible for the observed morphological differences are nuclear, that explains why we did not see any deviation of Karelian spruces towards P. obovata in organellar markers. In this situation nuclear gene flow from P. obovata should be performed via pollen. Thus, we should expect Karelian spruces to have cpDNA haplotypes (inherited paternally in conifers) typical for P. obovata. However, it is not the case for the majority of plants sampled and requires additional explanation like chloroplast capture in the introgresson zone. In all, we think that Karelian spruces evolved due to introgression between P. abies and P. obovata. However, it is unclear whether Karelian spruces could be treated as P. fennica, because unequivocal morphological and genetic characters of this hybridogenous species are still absent.
Keywords
cpDNA;
Picea;
plant mtDNA;
introgression;
northern taiga
-
Volkova,
Moscow South-West High School (No. 1543), 26 Bakinskikh komissarov str. 3–5, RU-119571 Moscow, Russia
E-mail
avolkov@orc.ru
- Shipunov, Department of Biology, Minot State University, Minot, North Dakota, USA 58707 E-mail dactylorhiza@gmail.com
- Borisova, Biological Department, Moscow State University, Vorobjevy Gory, RU-119899, Moscow, Russia E-mail salixhastata@ya.ru
- Moseng, Minot High School, Minot, North Dakota, USA 58701 E-mail dactylorhiza@gmail.com
- Ivens, Department of Biology, Minot State University, Minot, North Dakota, USA 58707 E-mail dactylorhiza@gmail.com
Received 9 December 2013 Accepted 26 May 2014 Published 16 June 2014
Views 143250
Available at https://doi.org/10.14214/sf.1072 | Download PDF

Abbreviations
| ANOSIM | Analysis of similarity |
| CP | Coefficient of projection |
| CQN | Coefficient of narrowing |
| DC | Distance from the base of cone to the position of maximal width |
| DS | Distance from the base of scale to the position of maximal width |
| DSL | Scale width in 0.1 of scale maximal width distance from the tip |
| HC | Cone maximal width |
| HS | Scale maximal width |
| LC | Cone length |
| LS | Scale length |
| PCA | Principal component analysis |
| RAPD | Random amplified polymorphic DNA |
1 Introduction
High importance of forest ecosystems is beyond doubt. Knowledge of species composition and genetic variability for dominant trees is essential for rational use of natural resources (Brautingam et al. 2013). However, this is sometimes difficult to achieve. Well-known examples are spruces, Picea spp., an important genus of dominant forest trees. In Eurasia, one of the largest continuous distribution areas for forest trees is formed by two spruce species: P. abies (L.) Karst. and P. obovata Ledeb. The first has European range; the second grows in Siberia and Eastern Asia. Distribution ranges of these species intersect in the Eastern Europe and Urals, forming wide zone of introgressive hybridization which appeared due to secondary contact between P. abies and P. obovata after the last glaciation (Krutovskii and Bergmann 1995; Popov 2005; Popov and Melnik 2006; Tollefsrud et al. 2008b). In this introgression zone the discrimination between species is difficult; spruces with intermediate morphology are believed to be hybrids and often considered as a hybrid species P. × fennica (Regel) Kom., distributed across almost all Russian plain and Scandinavia (Ramenskaja and Andreeva 1982; Potokina et al. 2012). Difficulties with morphological delimitation of P. abies and P. obovata impelled some authors (e.g. Schmidt-Vogt 1974) to treat them as geographical varieties of one species, which had a support from allozyme data (e.g. Krutovskii and Bergmann 1995).
Characters of cones and seed scales are widely accepted as the most useful for the discrimination of these spruces (Ramenskaja and Andreeva 1982; Popov 2003; 2005; 2010). Picea abies is characterized by longer (10–16 cm vs. 4–8 cm) cones, and seed scales of different shape (rhomboid with toothed tip vs. fan-shaped with rounded tip). To add objectivity into seed scale shape determination, several ratios (coefficients) were suggested for species determination, e.g., coefficient of narrowing and coefficient of projection and their difference (Popov 2003; 2005; 2010; Popov and Melnik 2006). A geometric morphometric approach (Zelditch et al. 2004) which could take into account the essential shape of scales instead of linear measures and their ratios, could be useful in this case but as far as we know, this method has not been applied here. There are some other morphological characters of vegetative shoots and needles which are sometimes used for species discrimination (Orlova and Egorov 2011; Potokina et al. 2012), but their applicability is doubtful. However, morphological characters alone could hardly be used for delimitation of the three spruce species in case of their sympatry as there exist a smooth morphological gradient between typical P. abies and P. obovata (Popov 2005) and high morphological variability of putative P. fennica was revealed (Popov 2007; Potokina et al. 2012)
Molecular data could provide a more definitive answer to the question about the nature of spruce populations attributed to P. fennica. Both genetics of Picea as a whole (Nystedt et al. 2013) and population structure of P. abies in particular are well-examined (Lagercrantz and Ryman 1990; Sperisen et al. 2001; Tollefsrud et al. 2008a; 2008b; 2009). In our case (delimitation between P. abies and P. obovata), mitochondrial nad1 and trnL-trnF chloroplast markers have been proved to be useful (Tollefsrud et al. 2008a; 2008b). In spruces, mitochondrial genome inheritance is maternal whereas the chloroplast genome is coming from wind-distributed pollen (Sutton et al. 1991). This fact provides opportunity for studying gene flow in the introgression zone from each of the two “pure” species separately (Hipkins et al. 1994). We should bear in mind, however, that species delimitation detected by molecular markers is complicated by interactions between introgression, incomplete lineage sorting (Zhou et al. 2010) which are especially typical for conifers (Du et al. 2009), and also historic and contemporary gene flow and environmental selection (Hamilton and Aitken 2013). Various combinations of these evolutionary forces seem to result in different genetic. Greater diagnostic value for delimitation between P. abies and P. obovata was attributed to mtDNA (Tollefsrud et al. 2008a; 2008b), whereas in numerous conifer species complexes cpDNA was more species specific and mtDNA variation matched with geography rather than with taxonomy (Du et al. 2009; Zhou et al. 2010).
Nowadays the only considerable areas of relatively undisturbed forests in Europe are located in Russian North Karelia (Lampainen et al. 2004). In the same time taxonomical status of spruces frequently dominating in northern taiga forest remains uncertain. According to morphological data, all the three species (namely, P. abies, P. obovata and P. fennica) occur there (Ramenskaja and Andreeva 1982; Orlova and Egorov 2011). However, neither RAPD (random amplified polymorphic DNA, Kopylova et al. 2011) nor nuclear microsatellite data (Potokina et al. 2012) were able to verify this hypothesis. Unfortunately, North Karelia was not included in the only large-scaled study of Eurasian spruces, based on mitochondrial and chloroplast markers (Tollefsrud et al. 2008b). In our work, we tried to use both molecular and morphological approaches with goals of elucidating the origin of spruces in North Karelia and finding the characters that discriminate them best.
2 Materials and methods
2.1 Morphology
Most material was collected in 2010–2012 from 104 trees in 9 locations of North Karelia (environs of Chupa, not far from the Arctic Circle and the coast of White Sea, Table 1). For comparison, we also collected plant material in Germany (48 trees and 4 locations, Table 1) and in Siberia (25 trees, 3 locations from different climatic zones in Krasnoyarsk region and in Buryatia Republic, Table 1) where each of the parental species occurs solely (P. abies and P. obovata correspondingly: Komarov 1968). We have chosen P. abies from southern genetic domain for the comparison to analyze “pure” species, because gene flow from Siberian spruces was reported for northern domain of P. abies (Tollefsrud et al. 2008a, 2008b). Unfortunately, as far as we know, cone morphology of southern domain of P. abies was not studied, but published data on northern domain suggest that morphological variation in cones is more longitudinal then latitudinal (Popov 2003) making thus German populations comparable with P. abies from northern domain. Typically, we picked ripe cones from trees stayed at least 10 m apart, one cone per tree. Seed scale contours were projected on paper and then scanned.
| Table 1. Geographic origin, mtDNA and cpDNA haplotypes and number of plants subjected to morphological analysis in the investigated locations of Picea spp. View larger in new window/tab. |
In 2001, we also collected cone and scale material in the same region as a part of preliminary study. This time, we did not distinguish between trees, but pooled all cones collected on the transect in every 10 m together. Data of these 321 cones (location “a”) were used only once, in the “extended” dataset (see below).
Cones and scales were measured to obtain the most frequently used morphological characters, namely, (1) LC, cone length; (2) HC, cone maximal width; (3) DC, distance from the base of cone to the position of maximal width; (4) LS, scale length; (5) HS, scale maximal width; (6) DS, distance from the base of scale to the position of maximal width and (7) DSL, scale width in 0.1 of HS distance from the tip. Two more coefficients: coefficient of narrowing (CQN, equal to DSL/HS*100) and coefficient of projection (CP, equal to (LS-DS)/HS*100) and their difference (Popov 2005) were also added to the character set.
The shape of seed scales was analyzed using the thin-plate spline approach (Zelditch et al. 2004). Instead of true landmarks, we used semi-landmarks which were distributed evenly along the contour of every seed scale (counter-clockwise, starting from the base). Screen digitizer software tpsDig2 (Rohlf 2010a) was used to catch coordinates of every landmark. Weight (principal warps) matrices were obtained from tpsRelw (Rohlf 2010b), and super-imposed images of scales – from tpsSuper software (Rohlf 2004). Classic and geometric morphometry data was visualized with multivariate methods like PCA (principal component analysis). The significance of PCA grouping was tested with ANOSIM (analysis of similarity, Warton et al. 2012) based on 99 or more permutations. For the comparison between populations, non-parametric tests were used, with Bonferroni correction for multiple comparisons, if applicable. R statistic environment (R Core Team 2013) was used for most calculations and plots.
2.2 Molecular data
In 2010–2012, needle material was collected from the majority of trees accessed for morphological data (Table 1). These needles were used for DNA extraction. DNA was extracted using a MO BIO PowerPlant DNA Isolation Kit (MO BIO Laboratories, Carlsbad, California, USA). Dry needle material (~ 0.1 g) was powdered using a sterile mortar and pestle and then processed in accordance with the supplied protocol.
Two fragments were sequenced: chloroplast trlL-trnF region using primers trnt_trnf_c_new (5’-GGAGGATAATAACATTGCAT-3’, Tollefsrud 2008b) and trnt_trnf_d (5’-GGGGATAGAGGGACTTGAAC-3’, Taberlet et al. 1991), and mitochondrial nad1 region, using primers nad1for (5’-CTCTCCCTCACCCATATGATG-3’, Sperisen et al. 2001) and nad1rev (5’-AGATCCCCATATATTCCCGG-3’, Sperisen et al. 2001; with correction from Dr. Mari Mette Tollefsrud, Norwegian Forest and Landscape Institute, pers. comm. in 2013). PCR was carried out as follows: the reaction mixture in a total volume of 20 μL contained 5.2 μL of Taq PCR Master Mix (QIAGEN Corporation, Germantown, Maryland, USA), 1 μL of 10 μM solutions of forward and reverse primers, 1 μL of DNA solution from the extraction above and 11.8 μL water. Samples were incubated in a thermal cycler: 35 cycles of 94° for 1 min; 47 or 53° (for cpDNA and mtDNA, respectively) for 1 min, 72° for 2 min, and finally 72° for 10 min. Single band PCR products were supplied for purification and sequencing to Functional Biosciences, Inc. (Madison, Wyoming, USA) and sequenced there in accordance with standard protocol with both primers (for mitochondrial fragment) or just with one primer (chloroplast fragment, most of cases): Table 1. Sequences were then assembled and edited using Sequencher™ 4.5 (Genes Codes Corporation, Ann Arbor, Michigan, USA). Chloroplast sequences were aligned with ClustalX (Thompson et al. 1997) using gap opening cost 9, gap extension cost 0.05 and IUB weight matrix, followed by manual adjustments; mitochondrial DNA sequences were aligned manually. All haplotype sequences were submitted to GenBank (Table 2). For the alignment, we also used haplotype sequences provided by Dr. Mari Mette Tollefsrud (Norwegian Forest and Landscape Institute, pers. comm. in 2013)
| Table 2. GenBank accession numbers for chloroplast and mitochondrial haplotypes discovered. | ||
| Haplotype | Haplotype full name | GenBank accession number |
| _CCC | _CCC_abies_i2 | KF896137 |
| _CAC | _CAC_abies_m3 | KF896138 |
| _CCA | _CCA_obovata_d11 | KF896139 |
| _TCC | _TCC_abies_c9 | KF896140 |
| GCAC | GCAC_abies_d4 | KF896141 |
| GCCA | GCCA_obovata_g3 | KF896142 |
| GCCC | GCCC_abies_b8 | KF896143 |
| 721bp | 721bp_obovata_c5 | KF896145 |
| 755bp | 755bp_na_l3 | KF896146 |
| 857bp | 857bp_obovata_m1 | KF896147 |
| 891bp | 891bp_abies_m5 | KF896148 |
| 925bp | 925bp_obovata_l1 | KF896149 |
| 959bp | 959bp_obovata_l2 | KF896150 |
3 Results
3.1 Morphology
Most morphological characters were able to distinguish Picea abies from P. obovata and from Karelian spruces (Fig. 1), which was supported with the non-parametric pairwise Wilcoxon test (p < 0.001 after Bonferroni correction). However, in most cases Karelian spruces were not separated from “pure” P. obovata (pairwise Wilcoxon test p > 0.05). Only width of scale tip (DSL) allowed for some differentiation between these two groups (pairwise Wilcoxon test: p = 0.006). Nevertheless, DSL values were largely intersecting (interquartile range: 6–8 mm vs. 7–9 mm for Karelian and Siberian trees respectively), making this character less useful for discrimination.
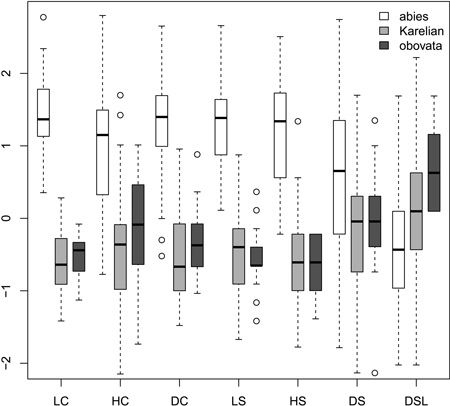
Fig. 1. Boxplots showing the variation of most frequently used scaled morphological characters. Characters are represented in values of standart deviations to facilitate comparison of variability in different characters. Absolute and quartile range along with median and outliers are given. Abbreviations are: LC, cone length; HC, cone maximal width; DC, distance from the base of cone to the position of maximal width; LS, scale length; HS, scale maximal width; DS, distance from the base of scale to the position of maximal width; DSL, scale width in 0.1 of HS distance from the tip.
Ratios (Fig. 2) had not more discrimination power then raw morphological characters with an exception of coefficient of narrowing (CQN) that was able to separate (Wilcoxon pairwise test: p<<0.01) “pure” P. abies (interquartile range: 28–42), Karelian spruces (50–64) and “pure” P. obovata (62–75). However, within-group variation of this character was still quite high (Fig. 2). The mean difference between coefficients of narrowing and projection for Karelian spruces (the most important diagnostic character, according to Popov 2005) were equal to 6.6, which was typical for P. obovata (i.e. more then 5.0: Popov 2005), the difference between these two groups was not significant (Wilcoxon pairwise test: p = 0.06). Interquartile range of differences between coefficients of narrowing and projection for “pure” P. abies was from –54 to –12 which is typical for this species (less then –5.0: Popov 2005).
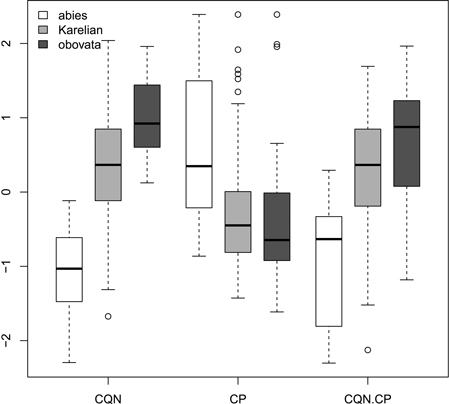
Fig. 2. Boxplots showing the variations of scaled morphological coefficients (ratios). Abbreviations are: CQN, equal to (scale width in 0.1 of scale maximal width distance from the tip) / (scale maximal width) * 100; CP, equal to [(scale length) − (distance from the base of scale to the position of maximal width)] / (scale maximal width) * 100; CQN.CP, equal to CQN – CP.
We obtained the general “picture” of spruce diversity using PCA on scaled raw characters (i.e., without ratios). Two first components acquired 80.5% of variation (64.8% and 15.7% for PC1 and PC2, respectively) and therefore were used in subsequent analysis (Fig. 3). The most influential morphological characters (characters with biggest loadings on the particular component) were LS and LC for PC1 and DS for PC2. Similar to individual characters, multivariate analysis was able to distinguish P. abies from pooled Siberian and Karelian samples (ANOSIM R = 0.86, significance = 0.01), but was not able to separate Karelian samples from “pure” P. obovata (ANOSIM R = –0.05, significance = 0.85).
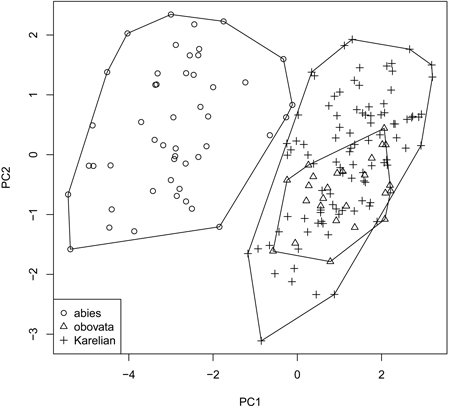
Fig. 3. Principal component ordination plot representing morphological diversity of studied spruces.
To understand if any heterogeneity existed in our Karelian populations, we added here location “a” of our preliminary sampling and obtained the extended dataset of 510 samples. However, neither PCA nor the advanced classification methods (like recursive partitioning) could split this dataset in well-supported subgroups (not shown).
Geometric morphometric analysis allowed us to construct super-imposed (“averaged”) images of seed scales (Fig. 4). It also resulted in matrix of principal warps (“weight matrix”) which was scaled and used in PCA together with morphological characters. The resulting graph was similar with “classical morphology” PCA (not shown). There was again no significant difference between Karelian samples and “pure” P. obovata (ANOSIM R = –0.06, significance = 0.8).
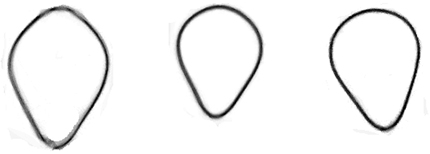
Fig. 4. Superimposed images of seed scales of studied spruces. From left to right: Picea abies, “Karelian spruces”, Picea obovata.
3.2 Molecular analysis
We obtained chloroplast sequences for 5−18 trees from each locality in Northern Karelia with except for location “o” from where one tree was analyzed (60 trees in total: Table 1). In all, we discovered 7 chloroplast haplotypes in our Karelian samples. These haplotypes were different in two substitutions and one G-insert (Fig. 5). Majority (60%) of the trees were characterized by haplotype _CAC, haplotypes _CCC and GCCA were also quite abundant (10% and 21% correspondingly), single trees also had haplotypes _CCA, GCAC, GCCC and _TCC (Table 1). Different haplotypes always co-existed in same locality (Table 1). Morphological analysis of samples to which haplotypes data was available, returned no significant difference in any morphological character between trees with cpDNA haplotypes of Siberian origin (with CA end: Tollefsrud et al. 2008b, see Discussion) and with other haplotypes of European origin (for every raw morphological character, Wilcoxon test p-values > 0.29).
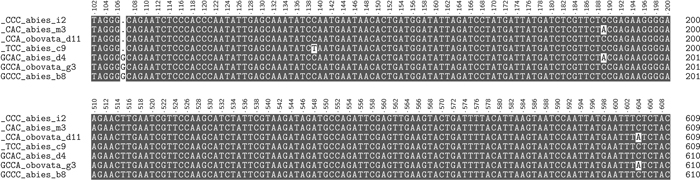
Fig. 5. Two fragments of the alignment of chloroplast haplotypes found, species identity and sample code are shown immediately after haplotype names. View larger in new window/tab.
In general, amplification of mitochondrial nad1 marker was less successful (1−10 trees from four localities in Northern Karelia, 19 trees in total: Table 1) but we were able to find 6 mitochondrial haplotypes (721bp, 755bp, 857bp, 891bp, 925bp and 959bp, names from Tollefsrud et al. 2008a) in Karelian samples.
We also sequenced cpDNA and mtDNA of several trees from different locations of “pure” P. obovata (7 and 5 trees respectively). All the individuals were characterized by chlorotype GCCA and mitotype 712s (Table 1), typical for this species (Tollefsrud et al. 2008b).
4 Discussion
Morphological heterogeneity within Karelian samples was not enough to split them in any reliable way, even using an extended sampling. In accordance with morphological data and in line with previously published results (Popov 2003; 2007), Karelian spruces have morphology that is typical for P. obovata. Although seed scales of Karelian samples have slightly more acute tip then “pure” P. obovata (as indicated by values of narrowing coefficient), these differences are too small and were not revealed by shape analysis (geometric morphometry: Fig. 4).
However, molecular analysis resulted otherwise. All the revealed in Karelian spruces mtDNA haplotypes were typical for P. abies (Tollefsrud et al. 2008b). According to Tollefsrud et al. (2008b), our cpDNA haplotypes with CA end have Siberian origin and are much more abundant in populations of P. obovata, whereas other haplotypes widely distributed in Europe and are more frequent in P. abies populations. Haplotypes with G-insert have been also once considered as typical for P. obovata (Ran et al. 2006) but since there was only one sample of P. obovata in the cited research, we decided not to use this insert as diagnostic. Taking all these considerations into account, 75% of Karelian spruces had chloroplast haplotypes of European origin. Thus, genetic variation in all the analyzed locations of Karelian spruce was typical for P. abies (some admixture of obovata-specific chloroplast haplotypes is typical for P. abies populations and explained by extensive pollen flow: Tollefsrud et al. 2008b).
This contradiction between morphology and organellar DNA could be itself an evidence of hybrid origin because morphological data should have a genetic basis. It was shown for different conifers that cone morphology is under not only environmental, but also genetic control (e.g. Kumar et al. 2007; Hamilton and Aitken 2013). Specifically, main diagnostic character, i.e. shape of seed scales, of P. abies and P. obovata mainly depends on the genetic characteristics of the plant (Popov 2003). Nuclear microsatellite data delimited Karelian P. fennica (pooled together with P. obovata) from P. abies (species were initially determined on morphological basis: Potokina et al. 2012). However, this delimitation was not perfect and the authors failed to differentiate P. fennica from P. obovata. Extensive pollen flow could notably reduce differentiation at nuclear markers (Tollefsrud et al. 2008b and references therein) but what is more important, Potokina et al. (2012) used samples only from previously glaciated North-Western Russia where introgression between spruce species is pronounced (Tollefsrud et al. 2008b). Thus, plants referred to P. abies and P. obovata in the cited work could already represent genetic mixture of “pure” parent species.
There are several possible explanations for the discrepancy between morphological and organellar DNA data. First, natural selection and/or epigenetic variation (Flatscher et al. 2012; Brautingam et al. 2013) of morphological characters could not be excluded. The climate of Northern Karelia is much colder and more continental than even in north of Western Europe (Kuznetsov 1960), and selective pressure towards the Siberian phenotype may take place. For example, rounded cone scales of Siberian phenotype were shown to reflect adaptation to cold climate (Schmidt-Vogt 1974). Clear influence of environmental gradient from maritime to continental climate on clinal variation in both morphological and nuclear genetic characters was recently revealed in P. sitchensis × P. glauca hybrid zone (Hamilton and Aitken 2013). Interestingly, more rounded cone scales in P. sitchensis × P. glauca hybrid zone were typical for more continental climate (Hamilton and Aitken 2013), mirroring morphological differences between more maritime P. abies and more continental P. obovata and variation in contact zone between these species (Ramenskaja and Andreeva 1982; Popov 2003; 2005; 2010).
If the genes responsible for the observed morphological differences are nuclear (the indirect evidence provided by Potokina et al. 2012), that explains why we did not see any deviation of Karelian spruces towards P. obovata in neutral organellar markers. Differentiation identified with organellar and nuclear markers has often been found to be independent in conifers (as was shown also for P. abies), and populations fixed for a single organelle haplotype do not necessarily show low diversity at nuclear markers (Tollefsrud et al. 2009 and references therein). In this situation nuclear gene flow from P. obovata should be performed via pollen as was shown earlier (Tollefsrud et al. 2008b). Abundance of chlorotypes typical for P. abies in Karelian spruces could have the following explanations. One possibility is the common phenomenon of closely related species sharing cpDNA haplotypes in the introgression zone, probably by chloroplast capture (i.e. the introgression of a chloroplast from one species into another, resulting in the exchange of chloroplast genomes: Rieseberg and Soltis 1991), which is typical for conifers (Hipkins et al. 1994). Fixation of P. abies mitotype in all Karelian locations possibly reflects postglacial recolonization history of Northern Karelia. Picea abies migrated to Fennoscandia shortly after retreat of the last maximum glaciation and even sustained there in small ice-free refugia during most of the last ice age (Parducci et al. 2012). Thus, established P. abies trees were the likely seed parents of early generations of Karelian spruces, receptive to some pollen flow from P. obovata. These processes appear to have contributed to patterns of “mitochondrial capture” of the maternally inherited P. abies mitotype in Karelian hybrid zone, as was shown in P. sitchensis × P. glauca hybrid zone (Hamilton and Aitken 2013). One more reason of the contradiction between morphology and DNA could be the relative scarcity of Siberian spruce data: those haplotypes which are now considering as typical for P. abies could be later discovered in P. obovata.
Thus, Karelian spruces evolved due to introgression between P. abies and P. obovata. However, it is unclear whether Karelian spruces could be treated as P. fennica, because unequivocal morphological and genetic characters of the latter are still absent (Ramenskaja and Andreeva 1982; Popov 2003; Kopylova et al. 2011; Potokina et al. 2012). Moreover, obtained data suggest treating P. abies and P. obovata as geographical varieties (or subspecies) of one biological species as was suggested earlier (e.g. Schmidt-Vogt 1974; Krutovskii and Bergmann 1995) and also adopted in some recent treatments (e.g. Annotated Checklist of the Panarctic Flora 2014). This treatment is supported by clinal morphological variation (Popov 2003; 2005; 2010), which is likely adaptive to increasing of climate continentality from west to east (Schmidt-Vogt 1974; Hamilton and Aitken 2013) and also by molecular delimitation between European and Siberian spruces mainly on mtDNA and not cpDNA markers (Tollefsrud et al. 2008b) reflecting geographical and not taxonomical structure (Du et al. 2009; Zhou et al. 2010). These considerations should be taken into account in guiding management of genetic resources, biotechnology and ecosystem conservation.
Acknowledgements
Authors are grateful for the members of White Sea expedition of Moscow South-West High School, especially to I. Degtjarenko, I. Vorontsov, N. Vorontsov, P. Dmitriev, and also to E. Trushina, K. Trushin, P. Petrov, A. Esjkova for the help in collection and measurements. The work on the Kem-Ludskij archipelago (island Perejma) was done within the limits of the contract with the Natural Reserve “Kandalakshskij”. Sample collection in Siberia was partly organized in collaboration with “Altachejskij zakaznik” refuge. The expeditions were partly funded by “Sovremennoe estestvoznanie” foundation (grant #P11-018) and by Moscow Institute of Open Education.
References
Annotated checklist of the Panarctic flora (PAF). Vascular plants. (2014). http://nhm2.uio.no/paf/. [Cited 5 April 2014].
Brautingam K. et al. (2013). Epigenetic regulation of adaptive responses of forest tree species to the environment. Ecology and Evolution 3(2): 399–415. http://dx.doi.org/10.1002/ece3.461.
Du K.F., Petit R.J., Liu J.Q. (2009). More introgression with less gene flow: chloroplast versus mitochondrial DNA in the Picea asperata complex in China, and comparison with other conifers. Molecular Ecology 18: 1396–1407. http://dx.doi.org/10.1111/j.1365-294X.2009.04107.x.
Flatscher R., Frajman B., Schonswetter P., Ovidiu P. (2012). Environmental heterogeneity and phenotypic divergence: can heritable epigenetic variation aid speciation? Genetic Research article ID 698421.
Hamilton J.A., Aitken S.N. (2013). Genetic and morphological structure of a spruce hybrid (Picea sitchensis × P. glauca) zone along a climatic gradient. American Journal of Botany 100(8): 1651–1662. http://dx.doi.org/10.3732/ajb.1200654.
Hipkins V.D., Krutovskii K.V., Strauss S.H. (1994). Organelle genomes in conifers: structure, evolution and diversity. Forest Genetics 1(4): 179–189.
Komarov V.L. (1968). Picea Dietrich. In: Komarov V.L. (ed.). Flora of the USSR, vol. 1. Israel program for Scientific Translations, Jerusalem. p. 111–119.
Kopylova T.A., Orlova L.V., Egorov A.A., Potokina E.K. (2012). Identification of Picea abies, P. fennica, P. obovata (Pinaceae) and their forms with the help of molecular marker methods. Botanicheskij Zhurnal 97: 1416–142. [In Russian].
Krutovskii K.V., Bergmann F. (1995). Introgressive hybridization and phylogenetic relationships between Norway, Picea abies (L.) Karst., and Siberian, P. obovata Ledeb., spruce species studied by isozyme loci. Heredity 74: 464–480. http://dx.doi.org/10.1038/hdy.1995.67.
Kumar D., Negi S.S., Pandey R., Pundir I., Tomar A., Kumar P. (2007). Variation in cone and seed morphology of Pinus roxburghii: effect of population and mother tree. Indian Forester 133: 749–757.
Kuznetsov V.V. (1960). The White Sea and biological peculiarities of its flora and fauna. AN SSSR Publisher, Moscow–Leningrad. 323 p. [In Russian].
Lagercrantz U., Ryman N. (1990) Genetic structure of Norway spruce (Picea abies): concordance of morphological and allozymic variation. Evolution 44: 38–53. http://dx.doi.org/10.2307/2409523.
Lampainen J., Kuuluvainen T., Wallenius T.H., Karjalainen L., Vanha-Majamaa I. (2004). Long-term forest structure and regeneration after wildfire in Russian Karelia. Journal of Vegetation Science 15: 245–256. http://dx.doi.org/10.1111/j.1654-1103.2004.tb02259.x.
Nystedt B. et al. (2013). The Norway spruce genome sequence and conifer genome evolution. Nature 497: 579–584. http://dx.doi.org/10.1038/nature12211.
Orlova L.V., Egorov A.A. (2011). To the systematics and geographical distribution of Finnish spruce (Picea fennica (Regel) Kom., Pinaceae). Novosti sistematiki vysshikh rastenij 42: 5–23. [In Russian].
Parducci L. et al. (2012). Glacial survival of boreal trees in northern Scandinavia. Science 335: 1083–1086. http://dx.doi.org/10.1126/science.1216043.
Popov P.P. (2003). Structure and differentiation of spruce populations in eastern Europe and western Siberia. Russian Journal of Ecology 34: 27–33. http://dx.doi.org/10.1023/A:1021810904403.
Popov P.P. (2005). European and Siberian spruce. Nauka, Novosibirsk. 233 p. [In Russian].
Popov P.P. (2007). Phenotypic placement of spruce populations in Euro-Siberian part of range. Vestnik Ekologii, Lesovedenija i Landhsftovedenija 8: 108–115. [In Russian].
Popov P.P. (2010). Form structure and geographic differentiation of spruce populations in Northwestern Russia. Russian Journal of Ecology 41: 336–343. http://dx.doi.org/10.1134/S1067413610050036.
Popov P.P., Melnik P.G. (2006). Geographical differentiation of European spruce populations in the eastern part of range. Vestnik ekologii, lesovedenija i landshaftovedenija 6: 90–101. [In Russian].
Potokina E.K., Orlova L.V., Vishnevskaya M.S., Alekseeva E.A., Potokin A.F., Egorov A.A. (2012). Genetic differentiation of spruce populations in Northwest Russia revealed with microsatellite markers. Ekologicheskaya Genetika 10(2): 40–49. [In Russian].
R Core Team. (2013). R: a language and environment for statistical computing. R Foundation for Statistical Computing, Vienna, Austria. http://www.R-project.org/. [Cited 2 April 2014].
Ramenskaja M.L., Andreeva V.N. (1982). Manual of the higher plants of Murmansk region and Karelia. Nauka, Leningrad. 435 p. [In Russian].
Ran J.H., Wei X.X., Wang X.Q. (2006). Molecular phylogeny and biogeography of Picea (Pinaceae): implications for phylogeographical studies using cytoplasmic haplotypes. Molecular Phylogenetics and Evolution 41: 405–419. http://dx.doi.org/10.1016/j.ympev.2006.05.039.
Rieseberg L.H., Soltis D.E. (1991). Phylogenetic consequences of cytoplasmic gene flow in plants. Evolutionary Trends in Plants 5(1): 65–84.
Rohlf F.J. (2004). tpsSuper. Version 1.14. State University at Stony Brook, N.Y. http://life.bio.sunysb.edu/morph/. [Cited 2 April 2014].
Rohlf F.J. (2010a). tpsDig2. Version 2.16. State University at Stony Brook, N.Y. http://life.bio.sunysb.edu/morph/. [Cited 2 April 2014].
Rohlf F.J. (2010b). tpsRelw: relative warps. Version 1.49. State University at Stony Brook, N.Y. http://life.bio.sunysb.edu/morph/. [Cited 2 April 2014].
Schmidt-Vogt H. (1974). Die systematische Stellung der gemeinen Fichte (Picea abies [L.] Karst.) und der sibirischen Fichte (Picea obovata Ledeb.) in der Gattung Picea. Ein Beitrag zur Einführung von Erkenntnissen auf dem Gebiet forstlischer Genökologie in die Systematik der Baumarten. Allgemeine Forst und Jagdzeitung 145: 46–60.
Sperisen C., Büchler U., Gugerli F., Matyas G., Geburek T., Vendramin G.G. (2001). Tandem repeats in plant mitochondrial genomes: application to the analysis of population differentiation in the conifer Norway spruce. Molecular Ecology 10(1): 257–263. http://dx.doi.org/10.1046/j.1365-294X.2001.01180.x.
Sutton B.C.S., Flanagan D.J., Gawley R., Newton C.H., Lester D.T., El-Kassaby Y.A. (1991). Inheritance of chloroplast and mitochondrial DNA in Picea and composition of hybrids from introgression zones. Theoretical and Applied Genetics 82: 242–248. http://dx.doi.org/10.1007/BF00226220.
Taberlet P., Gielly L., Pautou G., Bouvet J. (1991). Universal primers for amplification of three non-coding regions of chloroplast DNA. Plant Molecular Biology 17: 1105–1109. http://dx.doi.org/10.1007/BF00037152.
Thompson J.D., Gibson T.J., Plewniak F., Jeanmougin F., Higgins D.G. (1997). The CLUSTAL_X windows interface: flexible strategies for multiple sequence alignment aided by quality analysis tools. Nucleic Acids Research 25(24): 4876–4882. http://dx.doi.org/10.1093/nar/25.24.4876.
Tollefsrud M.M. et al. (2008a). Genetic consequences of glacial survival and postglacial colonization in Norway spruce: combined analysis of mitochondrial DNA and fossil pollen. Molecular Ecology 17: 4134–4150. http://dx.doi.org/10.1111/j.1365-294X.2008.03893.x.
Tollefsrud M.M., Brochmann C., Sperisen C. (2008b). Paternal introgression from Siberian spruce (Picea obovata) to Norway spruce (P. abies): tracing pollen and seed flow with chloroplast and mitochondrial DNA. In: Tollefsrud M.M. Phylogeography, diversity and hybridization in Norway spruce. PhD thesis. University of Oslo, Norway.
Tollefsrud M.M., Sønstebø J.H., Brochmann C., Johnsen Ø., Skrøppa T., Vendramin G.G. (2009). Combined analysis of nuclear and mitochondrial markers provide new insight into the genetic structure of North European Picea abies. Heredity 102: 549–562. http://dx.doi.org/10.1038/hdy.2009.16.
Warton D.I., Wright T.W., Wang Y. (2012). Distance-based multivariate analyses confound location and dispersion effects. Methods in Ecology and Evolution 3: 89–101. http://dx.doi.org/10.1111/j.2041-210X.2011.00127.x.
Zelditch M.L., Swiderski D.L., Sheets H.D., Fink W.L. (2004). Geometric morphometrics for biologists: a primer. Elsevier Academic Press, USA. 455 p.
Zhou Y.F., Abbott R.J., Jiang Z.Y., Du F.K., Milne R.I., Liu J.Q. (2010). Gene flow and species delimitation: a case study of two pine species with overlapping distribution in Southeast China. Evolution 64: 2342–2352.
Total of 40 references
