Arshad Ali,
Ming-Shan Xu,
Yan-Tao Zhao,
Qing-Qing Zhang,
Liu-Li Zhou,
Xiao-Dong Yang,
En-Rong Yan 
Allometric biomass equations for shrub and small tree species in subtropical China
Ali A., Xu M.-S., Zhao Y.-T., Zhang Q.-Q., Zhou L.-L., Yang X.-D., Yan E.-R. (2015). Allometric biomass equations for shrub and small tree species in subtropical China. Silva Fennica vol. 49 no. 4 article id 1275. https://doi.org/10.14214/sf.1275
Highlights
- Diameter (D) and height (H) are strong predictors in species-specific and multispecies models for the aboveground biomass of subtropical shrubs and small trees
- Although wet basic density and crown shape may improve the predictive power of aboveground biomass slightly, the labor intensive measurements for wet basic density and crown shape may be disregarded when a large number of individuals are to be surveyed
- Our results extend the generality of D-H models for aboveground biomass for large trees to subtropical shrubs and small trees.
Abstract
Species-specific allometric equations for shrubs and small trees are relatively scarce, thus limiting the precise quantification of aboveground biomass (AGB) in both shrubby vegetation and forests. Fourteen shrub and small tree species in Eastern China were selected to develop species-specific and multispecies allometric biomass equations. Biometric variables, including the diameter of the longest stem (D), height (H), wet basic density (BD), and crown area and shape were measured for each individual plant. We measured the AGB through a non-destructive method, and validated these measurements using the dry mass of the sampled plant components. The AGB was related to biometric variables using regression analysis. The species-specific allometric models, with D and H as predictors (D-H models) accounted for 70% to 99% of the variation in the AGB of shrubs and small trees. A multispecies allometric D-H model accounted for 71% of the variation in the AGB. Although BD, as an additional predictor, improved the fit of most models, the D-H models were adequate for predicting the AGB for shrubs and small trees in subtropical China without BD data.
Keywords
aboveground biomass;
allometric equations;
carbon storage;
biometric variables;
shrubs;
subtropical forests
- Ali, School of Ecological and Environmental Sciences, East China Normal University, Shanghai 200241, China; Tiantong National Forest Ecosystem Observations and Research Station, Ningbo 315114, Zhejiang, China; Department of Environmental Sciences, Abdul Wali Khan University Mardan, 23200, KPK, Pakistan E-mail arshadforester@gmail.com
- Xu, School of Ecological and Environmental Sciences, East China Normal University, Shanghai 200241, China; Tiantong National Forest Ecosystem Observations and Research Station, Ningbo 315114, Zhejiang, China E-mail yumsh09@lzu.edu.cn
- Zhao, School of Ecological and Environmental Sciences, East China Normal University, Shanghai 200241, China; Tiantong National Forest Ecosystem Observations and Research Station, Ningbo 315114, Zhejiang, China E-mail zhaoyantao1991@163.com
- Zhang, School of Ecological and Environmental Sciences, East China Normal University, Shanghai 200241, China; Tiantong National Forest Ecosystem Observations and Research Station, Ningbo 315114, Zhejiang, China E-mail qingzq@yeah.net
- Zhou, School of Ecological and Environmental Sciences, East China Normal University, Shanghai 200241, China; Tiantong National Forest Ecosystem Observations and Research Station, Ningbo 315114, Zhejiang, China E-mail 792920738@qq.com
- Yang, School of Ecological and Environmental Sciences, East China Normal University, Shanghai 200241, China; Tiantong National Forest Ecosystem Observations and Research Station, Ningbo 315114, Zhejiang, China E-mail xjyangxd@sina.com
-
Yan,
School of Ecological and Environmental Sciences, East China Normal University, Shanghai 200241, China; Tiantong National Forest Ecosystem Observations and Research Station, Ningbo 315114, Zhejiang, China
E-mail
eryan@des.ecnu.edu.cn
Received 5 November 2014 Accepted 1 June 2015 Published 16 June 2015
Views 122424
Available at https://doi.org/10.14214/sf.1275 | Download PDF

1 Introduction
The accurate quantification of plant aboveground biomass (AGB) and belowground biomass (i.e., roots) is crucial for the evaluation of ecosystem carbon storage, and toward understanding carbon dynamics in response to global climatic changes (Flombaum and Sala 2007; Brassard et al. 2009), as well as other ecological processes such as wood production and nutrient cycling (Conti and Díaz 2013). In forest ecosystems, the AGB of shrubs and small trees (diameter at breast height (DBH) < 5 cm) comprises an essential component of total forest biomass (Helmisaari et al. 2002). However, due to constraints related to the harvesting of all woody plants in forests, in terms of labor and time, most empirical studies have ignored shrubs and small trees in forest biomass calculations, thus underestimating the totality of overall values (e.g., Cavanaugh et al. 2014).
Although there are well-developed allometric equations for large trees (DBH > 5 cm, e.g., Brown et al.1989; Chave et al. 2005, 2014), these equations are not suitable for calculating the AGB of shrubs and small trees because of their restriction in the DBH range, and different growth forms and physiognomies, as compared to trees. For instance, Litton and Kauffman (2008) reported that generalized allometric models can either underestimate the AGB of individuals with small DBHs, or overestimate the AGB of individuals with large DBHs. Applying generalized allometric models developed for large trees to shrubs and small trees, may overestimate or underestimate the actual biomass (Brown et al. 1989; Chave et al. 2005). Therefore, there is an urgent need to develop allometric equations that accurately reflect the AGB of shrubs and small trees.
The biomass of a tree species is typically estimated by extracting several individuals in a sampling plot to determine the actual mass of that species; subsequently relating this mass to biometric variables through an allometric model (Whittaker and Woodwell 1968). Even though this method is more accurate in the determination of the AGB for a specific tree species at a given site, it is not applicable at the regional scale due to its destructive nature. Further, because this approach includes the cutting of trees for fresh mass measurements (Montès et al. 2000); it is not suitable for endangered species. However, the AGB of trees may be calculated through a non-destructive method by multiplying the wet basic density (BD) and tree volume, which is calculated through the direct dendrometric method (Miles and Smith 2009). For example, Montès et al. (2000) estimated the AGB of trees through the allometric relationships among tree shapes, dendrometric measurements, tree volumes, and BD. To validate the estimated biomass, this approach still requires the extraction of physical samples to determine the dry mass of trees.
Evergreen broadleaved forests are the important natural resource in biodiversity conservation, and play a critical role in global carbon cycling. Currently, shrublands represent a large proportion (approximately 80%) of the vegetation types in subtropical China, due to long-term anthropogenic disturbances (Wang et al. 2005). However, species-specific allometric equations for shrubs and small trees are much less common than those for large trees in the region (Yang et al. 2010; Ali et al. 2014). Therefore, the development of allometric biomass equations for shrubs and small trees may assist to more accurately quantify the AGB for this vegetation type.
For this study, our objective was to develop species-specific and multispecies allometric biomass equations for shrubs and small trees. Specifically, we tested the relative performance of different biometric variables to predict the AGB of 14 shrub and small tree species in subtropical China.
2 Methods and materials
2.1 Study site and forest
This study was conducted in the Tiantong National Forest Park (29°48´N, 121°47´E, 200 m a.s.l.), in Zhejiang Province, China. This region has a warm and humid subtropical climate with an average temperature of 28.1 °C and 4.2 °C during the warmest and the coldest months, respectively. The average annual precipitation is 1374.7 mm, most of which occurs between May and August, whereas the annual evaporation rate (from a free water surface) is 1320.1 mm (Song and Wang 1995). Soils in this area belong to Ferralsols (World Reference Base for Soil Resources 2006), with pH values that range from 4.4 to 5.1. The parental material is composed of mesozoic sediments and acidic intrusive rocks, including quartzite and granite (Song and Wang 1995). The zonal vegetation type is subtropical evergreen broadleaved forests, which typically consists of tree (8–18 m high), shrub layer (< 4 m high) and herb layer (< 1 m high) strata (Wang et al. 2005; Yan et al. 2009).
2.2 Species sampling
Following the floristic description of the study region Song and Wang (1995), 14 shrub and small tree species were selected that frequently appeared in the shrub layer. Five to 13 individuals per species were selected in order to incorporate the entire plant size range. Several biometric variables were measured for each individual plant prior to the extraction of physical samples through the destructive method (Table 1). In addition, due to the differences in crown shapes (CS), such as multi- and single-stemmed species in this study (Zeng et al. 2010), we characterized CS as inverted cone-shaped crown (CoC), hemisphere-shaped crown (HsC), or parabolic-shaped crown (PrC) to investigate whether the addition of CS improved the model prediction (Ludwig et al. 1975). The maximum crown diameters and their perpendicular diameters were measured to quantify the crown areas (CA) of each plant, following Conti et al. (2013).
| Table 1. Summary of the range values (min-max) of biometric variables and total aboveground biomass of shrubs and small trees (DBH < 5 cm) across 14 species in subtropical forests in Tiantong National Forest Park in Eastern China. View in new window/tab. |
Fresh samples of stem wood, branches or twigs, and leaves were collected from each individual of each species, stored and sealed in plastic bags, and then transported to the laboratory, where fresh and oven-dried masses (oven at 80 °C until constant mass) were recorded to estimate the water content (%) of each sample. Additionally, BD was measured as the ratio of the oven-dried mass of a sample to the mass of water that was displaced by its green volume, following Chave et al. (2005). The total fresh mass of each individual plant was calculated through the multiplication of wet BD and total tree volume (Miles and Smith 2009). The water content of each individual plant was calculated through the conversion of fresh mass to dry mass, which was oven dried in the laboratory (Table 1).
2.3 Statistical analysis
All of the variables were log-transformed in order to apply linear models, and we developed single-variable and multiple-variable allometric equations for each species. Here, single-variable refers to either diameter (D), height (H), or crown area (CA), while multiple-variable refers to the combination of two or three of these factors. For single- and multiple-variable equations, BD or CS were not considered as primary variables, but as additional variables to examine whether they improved the selected model by assessing the goodness-of-fit (i.e., the R2 value) and Akaike Information Criterion (AIC).
In addition, we constructed a set of multispecies AGB regression equations by including all individuals from the 14 species (n = 96). Three different allometric equations were developed for multiple species: (1) single-variable, with or without BD-CS models, (2) two-variable, with or without BD-CS models, and (3) multiple-variable, with or without BD-CS models. Single-variable, with or without BD-CS models were developed using simple linear regressions. Two-variable and multiple-variable models were developed using multiple regressions.
The best species-specific and multispecies statistical models were selected according to the highest R2 and the lowest AIC (Johnson and Omland 2004). We also derived the predictive mean squared error (PMSE) of the regression for each model, and calculated a correction factor (CF) for each model (Baskerville 1972), which should be applied to the AGB in those cases where log-transformed variables are included in the equation. Statistical analyses were carried out using the Infostat statistical package, version-2012 (Di Rienzo et al. 2012).
3 Results
3.1 Species-specific allometric models
Among the single-variable, with or without BD-CS models, D was the best predictor of the AGB for 11 species, except to Quercus fabri, Schima superba and Symplocos setchuensis, accounting for 59–99% of the AGB variations (Table 2). The best models (R2 = 0.99; p < 0.001) corresponded to Cyclobalanopsis glauca, Eurya nitida, Machilus thunbergii and Symplocos stellaris. For Schima superba and Symplocos setchuensis, H was the best predictor of AGB (R2 = 0.84 and R2 = 0.79, respectively), although D also performed well for Schima superba (R2 = 0.71). The inclusion of BD as a predictor improved the prediction power of models for most species (Table 2). The CA showed a weak predictive capability, with the highest value and a useful additional predictor for Quercus fabri (R2 = 0.68, p < 0.05).
| Table 2. Best fitted species-specific regression models for the prediction of aboveground biomass of shrubs and small trees (DBH < 5 cm) across 14 species in subtropical forests in Tiantong National Forest Park in Eastern China. Parameters and statistical criteria are shown for the best fitted model. | ||||
| Species | Species-specific aboveground biomass model | R2 | AIC | CF |
| Adinandra millettii | 1 Ln(AGBp) = –10.7 + 2.50×Ln(D)+12.5×BD 2 Ln(AGBp) = –3.83 + 1.99×Ln(D)+0.860×Ln(H) | 0.96* 0.99** | 6.63 –1.98 | 1.06 1.01 |
| Camellia fraterna | 1 Ln(AGBp) = –3.54 + 2.33×Ln(D) 2 Ln(AGBp) = –4.03 + 1.16×Ln(H)+2.15×Ln(D) | 0.87*** 0.99** | 11.82 –12.18 | 1.12 1.00 |
| Castanopsis carlesii | 1 Ln(AGBp) = –1.70 + 1.18×Ln(D)+0.634×Ln(PrC) 2 Ln(AGBp) = –1.66 + 1.34×Ln(D)–0.21×Ln(H)+0.64×Ln(PrC) | 0.70** 0.67** | 52.39 54.34 | 1.94 2.05 |
| Cyclobalanopsis glauca | 1 Ln(AGBp) = –17.4 + 0.141×Ln(D)+21.6×BD 2 Ln(AGBp) = –3.55 + 2.01×Ln(D)+0.867×Ln(H) | 0.99* 0.99* | –13.02 –11.02 | 1.00 1.00 |
| Cyclobalanopsis stewardiana | 1 Ln(AGBp) = –3.67 + 3.07×Ln(D) 2 Ln(AGBp) = –3.86 + 3.36×Ln(H)–0.307×Ln(CA) | 0.98** 0.99** | 1.01 –2.33 | 1.02 1.01 |
| Diospyros kaki | 1 Ln(AGBp) = –2.80 + 1.64×Ln(D) 2 Ln(AGBp) = –5.57 + 1.89×Ln(D)+1.16×Ln(H)+2.72×BD | 0.70* 0.99* | 6.85 –22.25 | 1.05 1.00 |
| Eurya nitida | 1 Ln(AGBp) = –3.59 + 2.47×Ln(D) 2 Ln(AGBp) = –3.86 + 1.99×Ln(D)+0.95×Ln(H) | 0.99*** 0.99*** | –10.07 –19.35 | 1.01 1.00 |
| Eurya rubiginosa | 1 Ln(AGBp) = –3.42 + 2.22×Ln(D) 2 Ln(AGBp) = 8.92–0.71×Ln(D)–1.06×Ln(H)+1.10×Ln(PrC)- 16.1×BD | 0.59* 0.99* | 24.10 22.78 | 1.72 1.03 |
| Loropetalum chinense | 1 Ln(AGBp) = –9.50 + 2.70×Ln(D)+10.0×BD 2 Ln(AGBp) = –8.93 + 1.95×Ln(D)+0.769×Ln(H)+8.76×BD | 0.76* 0.83* | 20.63 19.50 | 1.20 1.16 |
| Machilus thunbergii | 1 Ln(AGBp) = –3.51 + 2.59×Ln(D) 2 Ln(AGBp) = –3.14 + 2.49×Ln(D)–0.875×Ln(H)+0.503×Ln(CA) | 0.99*** 0.99* | –5.51 –6.80 | 1.01 1.01 |
| Quercus fabri | 1 Ln(AGBp) = –10.9 + 0.753×Ln(CA)+14.8×BD 2 Ln(AGBp) = –13.5 + 1.15×Ln(D)+0.346×Ln(CA)+18.2×BD | 0.68* 0.82* | 33.54 30.58 | 2.11 1.68 |
| Schima superba | 1 Ln(AGBp) = –3.74 + 2.79×Ln(H) 2 Ln(AGBp) = –3.68 + 3.08×Ln(H)–0.361×Ln(CA) | 0.84* 0.87* | 11.41 12.20 | 1.11 1.12 |
| Symplocos setchuensis | 1 Ln(AGBp) = –5.62 + 3.24×Ln(H)+2.06×BD 2 Ln(AGBp) = –4.77–0.384×Ln(D)+3.72×Ln(H) | 0.79* 0.79* | 16.02 15.99 | 1.13 1.13 |
| Symplocos stellaris | 1 Ln(AGBp) = –3.63 + 2.66×Ln(D) 2 Ln(AGBp) = –3.25 + 3.84×Ln(D)–1.66×Ln(H) | 0.99*** 0.99** | 1.88 –6.36 | 1.02 1.01 |
| AGBp, predicted aboveground biomass (kg); Ln, natural logarithm; H, total height (m); D, diameter of the longest stem (cm); CA, crown area (m2); BD, basic density (g cm–3); PrC, parabolic crown variable (m3). R2, coefficient of determination are indicated with asterisks if statistically significant. *: p < 0.05; **: p < 0.01; ***: p < 0.001) PMSE, predictive mean squared error; CF, correction factor; AIC, Akaike information criterion 1) Single-variable with or without BD-CS best fitted model (inclusion of BD and/or CS, if it improves the model capacity) 2) Multiple-variable best fitted model i.e., combination of two or three variables (inclusion of BD and/or CS , if it improves the model capacity) | ||||
Among the multiple-variable models, the D-H model was optimal for predicting the AGB for 10 species, resolving up to 99% of the variations in the AGB in all cases, except for Cyclobalanopsis stewardiana, Quercus fabri, Machilus thunbergii and Schima superba. For Cyclobalanopsis stewardiana and Schima superb, H and CA accounted for 99% and 87% of the variations in the AGB, respectively. For Quercus fabri, D and CA were the best predictors (R2 = 0.82, p < 0.05). The three variable (D, H and CA) model performed well for only Machilus thunbergii (R2 = 0.99, p < 0.05). The inclusion of BD in the multiple-variable models also increased the prediction power of models for most species (Table 2). The inclusion of CS (parabolic) increased the predictive power of allometric models for only Castanopsis carlesii and Eurya rubiginosa.
3.2 Multispecies aboveground biomass regression models
Similar to the species-specific allometric models, D was the best predictor for AGB with the pooled data of all species, followed by H (Fig. 1a and 1b). The regression relationship between CA and AGB was weak (Fig. 1c). Among the two-variable models (Table 3), D-H was the best multispecies model for estimating the AGB (R2 = 0.71, p < 0.001). The multiple-variable model explained the same variation (71%) as did the D-H model. As expected, the inclusion of BD to the model improved the estimation of the AGB. In contrast, the inclusion of CS to the model did not improve the goodness-fit of the models.
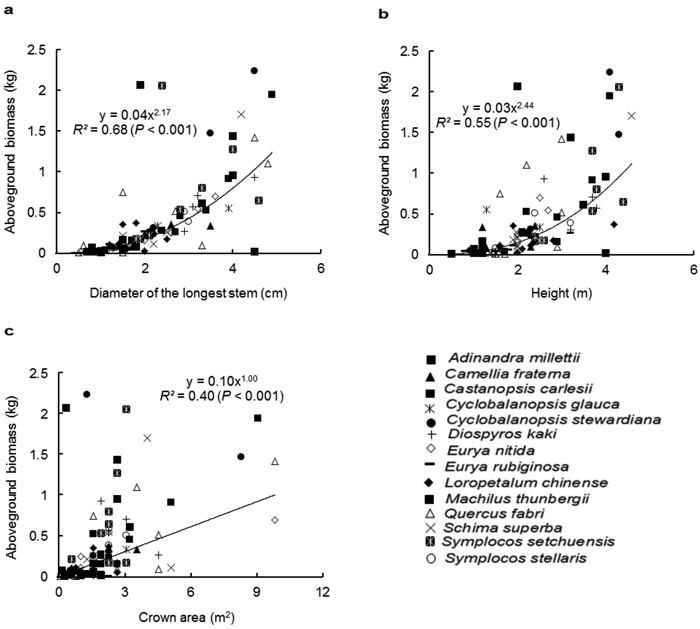
Fig. 1. Relationship between the aboveground biomass (kg) and (a) diameter of the longest stem (D, cm), (b) height (H, m) and (c) crown area (CA, m2), for all shrub and small tree species. Different symbols represent individual species, whereas the trend line represents power function (Y = aXb).
| Table 3. Best fitted multispecies regression models for the prediction of aboveground biomass of shrubs and small trees (DBH < 5 cm) across 14 species in subtropical forests in Tiantong National Forest Park in Eastern China. Parameters and statistical criteria are shown for the best fitted model (n = 96). | ||||
| Multispecies aboveground biomass model | R2 | PMSE | AIC | CF |
| 1 Single-variable with or without BD-CS model | ||||
| a) Ln(AGBp) = –3.23 + 2.17×Ln(D) | 0.68*** | 0.82 | 250.70 | 1.46 |
| b) Ln(AGBp) = –4.97 + 2.20×Ln(D)+3.06×BD | 0.70*** | 0.79 | 247.68 | 1.45 |
| 2 Two-variable with or without BD-CS model | ||||
| a) Ln(AGBp) = –3.50 + 1.65×Ln(D)+0.842×Ln(H) | 0.71*** | 0.75 | 244.48 | 1.42 |
| b) Ln(AGBp) = –5.40 + 1.65×Ln(D)+0.885×Ln(H)+3.31×BD | 0.73*** | 0.72 | 240.09 | 1.34 |
| 3 Multiple-variable with or without BD-CS model | ||||
| a) Ln(AGBp) = –3.43 + 1.50×Ln(D)+0.782×Ln(H)+0.16×Ln(CA) | 0.71*** | 0.79 | 244.72 | 1.42 |
| b) Ln(AGBp) = –5.29 + 1.52×Ln(D)+0.83×Ln(H)+0.145×Ln(CA)+3.23×BD | 0.73*** | 0.74 | 240.54 | 1.40 |
| AGBp, predicted aboveground biomass (kg); Ln, natural logarithm; H, total height (m); D, diameter of the longest stem (cm); CA, crown area (m2); BD, basic density (g cm–3). R2, coefficient of determination are indicated with asterisks if statistically significant. *: p < 0.05; **: p < 0.01; ***: p < 0.001). PMSE, predictive mean squared error; AIC, Akaike information criterion; CF, correction factor a) Single-variable or multiple-variable models without BD or CS b) Single-variable or multiple-variable models with BD or CS | ||||
4 Discussion
Allometric biomass equations developed specifically for shrubs and small trees are relatively limited in the literature. This study investigated the validity of several models with respect to the three primary biometric variables (i.e., D, H and CA), for estimating the AGB of shrubs and small trees in subtropical China. With the developed 28 species-specific equations and three multispecies allometric equations, we strongly recommend that, over other biometric variables, D and H are the best predictors of the AGB for shrubs and small trees in this study region. Zeng et al. (2010) also strongly suggested that D and H are the good predictors in species-specific allometric models for estimating the total AGB of four subtropical shrub species. The consistent findings between this study and Zeng et al. (2010) suggest that these species have the same architectures and branching patterns within the range of sizes studied. Further, in agreement with Zeng et al. (2010), but contrary to Conti et al. (2013), we found that crown variables have less import, as compared with D and H, for estimating the AGB. A possible reason might involve differences in the crown shapes of shrub species between the subtropical forests (e.g., this study and Zeng et al. 2010), and the semiarid Chaco forests (e.g., Conti et al. 2013). It is interesting that D and H are also good predictors for the AGB of large trees (Brown et al. 1989; Zianis and Mencuccini 2004; Chave et al. 2005; Pilli et al. 2006; Yang et al. 2010; Ali et al. 2014). This suggests that the D-H model is highly adaptable to shrubs and small trees, in that they present similar dimensional relationships between biometric variables (D-H), and the AGB with the previously published equations for large trees (e.g., Brown et al. 1989; Chave et al. 2005; Chave et al. 2014). However, it is notable that, in comparison with the allometric models for large trees, the D-H models developed for shrubs and small trees are expected to have improved performance in estimating the AGB of shrubs and small trees within their specific size range variability (i.e., DBH < 5 cm) (Litton and Kauffman 2008).
In this study, different multispecies biomass equations exhibited almost identical predictive capacity regardless of the number of variables included. Based on the AIC, the best predictive model included D, H, and BD. Even though BD improved the fit of the model, the difference in the resolution power between models, with or without BD as a predictor, was only 2% in the goodness of fit. This justifies that the measurement of BD may be disregarded to estimate the AGB of shrubs and small trees when a large number of individuals are to be surveyed, since it involves additional time-consuming activities for collecting and processing samples. In practice, the D and H measurements are convenient compared with other biometric variables (e.g.,, BD, CA and CS). Therefore, we recommend model 2a (Table 3) for the estimation of the AGB of all species combined, due to the excellent balance between the number of input variables required and the predictive power (Chave et al. 2005). Our results also suggest that using natural log-log models is statistically suitable for quantifying the size (D-H)-AGB relationships in almost all cases, as is the case for others shrub species globally (Hierroet al. 2000; Conti et al. 2013).
We acknowledge that our developed models were based on a small number of individuals sampled (i.e., five to thirteen individuals per species), as this might strictly limit the application of our biomass equations at local scales. Additionally, it is important to note that regression models should not be used beyond the range of the variability in predictor variables.
In conclusion, the species-specific allometric models developed in this study, with D and H as predictors, may account for a high variation (70% to 99%) in the AGB of shrubs and small trees. The multispecies allometric (D-H) model, developed by the pooling of all species, also provided good predictive power (i.e., 71%) for the estimation of AGB. The allometric biomass equations of shrubs and small trees provided in this study might be helpful toward the generation of more accurate estimations of the AGB in shrub vegetation in subtropical China.
Acknowledgments
We thank Wu Zhou, Min Guo, Qiang Zhong, Datong Lu, Yanjun Wen and Jun Huang for their help in the field and laboratory. Constructive comments from Professor Han Y.H. Chen (Lakehead University, Canada) helped to substantially improve an earlier version of this manuscript. This work was supported by the National Natural Science Foundation of China (Grant No. 31270475) and the Key Scientific and Technological Project of Ningbo City in China (Grant No.2012C10027).
References
Ali A., Ma W.J., Yang X.D., Sun B.W., Shi Q.R., Xu M.S. (2014). Biomass and carbon stocks in Schima superba dominated subtropical forests of eastern China. Journal of Forest Science 60: 198–207.
Baskerville G.L. (1972). Use of logarithmic regression in the estimation of plant biomass. Canadian Journal of Forest Research 2: 49–53. http://dx.doi.org/10.1139/x72-009.
Brassard B.W., Chen H.Y.H., Bergeron Y. (2009). Influence of environmental variability on root dynamics in northern forests. Critical Reviews in Plant Sciences 28: 179–197. http://dx.doi.org/10.1080/07352680902776572.
Brown S., Gillespie A.J.R., Lugo A.E. (1989). Biomass estimation methods for tropical forests with applications to forest inventory data. Forest Science 35: 881–902.
Cavanaugh K.C., Gosnell J.S., Davis S.L., Ahumada J., Boundja P., Clark D.B., Mugerwa B., Jansen P.A., O’Brien T.G., Rovero F., Sheil D., Vasquez R., Andelman S. (2014). Carbon storage in tropical forests correlates with taxonomic diversity and functional dominance on a global scale. Global Ecology and Biogeography 23: 563–573. http://dx.doi.org/10.1111/geb.12143.
Chave J., Andalo C., Brown S., Cairns M.A., Chambers J.Q., Eamus D., Fölster H., Fromard F., Higuchi N., Kira T., Lescure J-P., Nelson B.W., Ogawa H., Puig H., Riéra B., Yamakura T. (2005). Tree allometry and improved estimation of carbon stocks and balance in tropical forests. Oecologia145: 87–99. http://dx.doi.org/10.1007/s00442-005-0100-x.
Chave J., Réjou-Méchain M., Búrquez A., Chidumayo E., Colgan M.S., Delitti W.B.C., Duque A., Eid T., Fearnside P.M., Goodman R.C., Henry M., Martínez-Yrízar A., Mugasha W.A., Muller-Landau H.C., Mencuccini M., Nelson B.W., Ngomanda A., Nogueira E.M., Ortiz-Malavassi E., Pélissier R., Ploton P., Ryan C.M., Saldarriaga J.G., Vieilledent G. (2014). Improved allometric models to estimate the aboveground biomass of tropical trees. Global Change Biology 20: 3177–3190. http://dx.doi.org/10.1111/gcb.12629.
Conti G., Enrico L., Casanoves F., Díaz S. (2013). Shrub biomass estimation in the semiarid Chaco forest: a contribution to the quantification of an underrated carbon stock. Annals of Forest Science 70: 515–524. http://dx.doi.org/10.1007/s13595-013-0285-9.
Conti G., Díaz S. (2013). Plant functional diversity and carbon storage – an empirical test in semiarid forest ecosystems. Journal of Ecology 101: 18–28. http://dx.doi.org/10.1111/1365-2745.12012.
Di Rienzo J.A., Casanoves F., Balzarini M.G., Gonzalez L., Tablada M., Robledo C.W. (2012). InfoStat. Statistical software. Grupo Infostat FCA UNC, Córdoba, Argentina. http://www.infostat.com.ar.
Flombaum P., Sala O.E. (2007). A non-destructive and rapid method to estimate biomass and aboveground net primary production in arid environments. Journal of Arid Environments 69: 352–358. http://dx.doi.org/10.1016/j.jaridenv.2006.09.008.
Helmisaari H.S., Makkonen K., Kellomaki S., Valtonen E., Malkonen E. (2002). Below- and above-ground biomass, production and nitrogen use in Scots pine stands in eastern Finland. Forest Ecology and Management 165: 317–326. http://dx.doi.org/10.1016/S0378-1127(01)00648-X.
Hierro J.L., Branch L.C., Villareal D., Clark K.L. (2000). Predictive equations for biomass and fuel characteristics of Argentine shrubs. Journal of Range Management 53: 617–621.
Johnson J.B., Omland K.S. (2004). Model selection in ecology and evolution. Trends in Ecology and Evolution 19: 101–108.
Litton C.M., Kauffman J.B. (2008). Allometric Models for Predicting Aboveground Biomass in Two Widespread Woody Plants in Hawaii. Biotropica 40: 313–320. http://dx.doi.org/10.1111/j.1744-7429.2007.00383.x.
Ludwig J.A., Reynolds J.F., Whitson P.D. (1975). Size-biomass relationships of several Chihuahuan desert shrubs. The American Midland Naturalist 94: 451–461.
Miles P.D., Smith W.B. (2009). Specific gravity and other properties of wood and bark for 156 tree species found in North America. Research Note NRS-38. US Department of Agriculture, Forest Service, Northeastern Research Station, Newtown Square, PA. 35 p.
Montès N., Gauquelin T., Badri W., Bertaudiere V., Zaoui E.H. (2000). A nondestructive method for estimating above-ground forest biomass in threatened woodlands. Forest Ecology and Management 130: 37–46. http://dx.doi.org/10.1016/S0378-1127(99)00188-7.
Pilli R., Anfodillo T., Carrer A. (2006). Towards a functional and simplified allometry for estimating forest biomass. Forest Ecology and Management 237: 583–593. http://dx.doi.org/10.1016/j.foreco.2006.10.004.
Song Y.C., Wang X.R. (1995). Vegetation and flora of Tiantong National Forest Park Zhejiang Province (in Chinese with English abstract). Shanghai Scientific & Technological Literature Publishing House. 16 p.
Wang X.H., Yan E.R., Yan X., Wang L.Y. (2005). Analysis of degraded evergreen broad-leaved forest communities in eastern China and issues in forest conservation. Acta Ecologica Sinica 25: 1796–1803.
Whittaker R.H., Woodwell G.M. (1968). Dimension and production relations of trees and shrubs in the Brookhaven forest, New York. Journal of Ecology 56: 1–25.
World Reference Base for Soil Resources (2006). A framework for international classification, correlation and communication. Food and Agriculture Organization of the United Nations, Rome. 128 p. ISBN 92-5-105511-4.
Yan E.R., Wang X.H., Guo M., Zhong Q., Zhou W., Li Y.F. (2009). Temporal patterns of net soil N mineralization and nitrification through secondary succession in the subtropical forests of eastern China. Plant and Soil 320: 181–194. http://dx.doi.org/10.1007/s11104-008-9883-y.
Yang T.H., Song K., Da L.J., Li X.P., Wu J.P. (2010). The biomass and aboveground net primary productivity of Schima superba–Castanopsis carlesii forests in east China. Science China Life Science 53: 811–821. http://dx.doi.org/10.1007/s11427-010-4021-5.
Zeng H.Q., Liu Q.J., Feng Z.W., Ma Z.Q. (2010). Biomass equations for four shrub species in subtropical China. Journal of Forest Research 15: 83–90. http://dx.doi.org/10.1007/s10310-009-0150-8.
Zianis D., Mencuccini M. (2004). On simplifying allometric analyses of forest biomass. Forest Ecology and Management187: 311–332. http://dx.doi.org/10.1016/j.foreco.2003.07.007.
Total of 27 references
