Přemysl Humplík  ,
Petr Čermák,
Tomáš Žid
,
Petr Čermák,
Tomáš Žid
Electrical impedance tomography for decay diagnostics of Norway spruce (Picea abies): possibilities and opportunities
Humplík P., Čermák P., Žid T. (2016). Electrical impedance tomography for decay diagnostics of Norway spruce (Picea abies): possibilities and opportunities. Silva Fennica vol. 50 no. 1 article id 1341. https://doi.org/10.14214/sf.1341
Highlights
- Statistical parameters of EIT datasets with values of electrical resistance of heartwood are possible to employ in refining heartwood rot diagnostics
- Sapwood proportion is decreasing as the proportion of decay on the radial cut expands
- Using EIT datasets and sapwood proportion, trees with rot can be split into two groups as per proportion of decay: [< 35%] and [> 35%].
Abstract
The paper aimed at testing the potential of refining tree rot diagnostics carried out by means of electrical impedance tomography (EIT). Examined was the use of EIT datasets with electrical resistance values and sapwood proportion determined on the basis of tomograms. Making use of datasets with resistance values in EIT rot diagnostics is not a default method, although datasets stay unaffected by a fixed colour scale and subsequent subjective evaluation unlike tomograms. Tomography measurement was carried out for 27 individuals of Norway spruce (Picea abies [L.] Karst.) in two stands north-east of Brno, Czech Republic. Once felled down, radial cut-outs were sampled at the measurement site and used for localising rot and determining the extent of the area of decay. The results were subsequently compared with tomograms. EIT datasets containing values of electrical resistance found by measuring were statistically processed and compared with the extent of rot area identified within the cuts. Sapwood proportion values were also detected using the tomograms. The baseline assumption that sapwood proportion decreases as the rot area in the radial cut expands was confirmed. In trees with rot percentage to 35% approximately, sapwood proportion was exceeding 30% except one tree. In trees with rot percentage exceeding 35%, sapwood proportion was below 30%. On the basis of interpreted datasets, the trees can be split into three characteristic groups that correspond to the occurrence, extent and nature of the rot.
Keywords
sapwood;
heartwood;
tomogram;
decay proportion;
impedance dataset
-
Humplík,
Mendel University in Brno, Faculty of Forestry and Wood Technology, Zemědělská 1665/3, 613 00 Brno, Czech Republic
E-mail
premysl.humplik@mendelu.cz
- Čermák, Mendel University in Brno, Faculty of Forestry and Wood Technology, Zemědělská 1665/3, 613 00 Brno, Czech Republic E-mail petr.cermak@mendelu.cz
- Žid, Mendel University in Brno, Faculty of Forestry and Wood Technology, Zemědělská 1665/3, 613 00 Brno, Czech Republic E-mail tomas.zid@mendelu.cz
Received 26 March 2015 Accepted 28 December 2015 Published 11 January 2016
Views 65902
Available at https://doi.org/10.14214/sf.1341 | Download PDF

1 Introduction
Electrical impedance tomography (EIT) and its particular application, Electrical resistance tomography (ERT), are generally used to determine the spatial resistance distribution in a non-destructive manner. Electrical resistance and its reciprocal electrical conductivity are physical properties that enable making conclusions about the structure of objects. A low resistance can indicate increased moisture content, whereas hollowed structures cause the resistance to increase. EIT methods were first applied to trees in 1998 (Just et al. 1998). Resistance in tree stems can be influenced by water content, cell structure, ion concentration, and other factors in wood (Göcke 2011).
Tomographic methods have emerged as the least invasive methods for assessing internal decay (Bucor, 2005). Tomography can identify decay including early stages of rot which would otherwise go undetected by acoustic tomography (Brazee et al. 2010). For example, Bieker et al. (2010) used EIT to monitor infection in four individuals of European ash (Fraxinus excelsior L.) inoculated with Trametes versicolor (L.:Fr.) Pilát. EIT accurately identified areas of incipient decay, even in the absence of measurable changes in density. Sometimes, however, incipient decay may not be visible in the tomogram, because smaller resistivity differences can be lost in the tomogram’s colour scheme.
Tomographic methods can also be used for detecting heartwood and sapwood (Weihs et al. 1999; Hanskötter 2004). The basic principle of the detection is the fact that sapwood with its higher moisture content has a lower resistivity than heartwood. Bieker, Rust (2010) tested ERT in estimating the area of conductive sapwood in Scots pine (Pinus sylvestris L.). The tomograms showed a sapwood width of approx. 2 cm (28%) smaller than the staining method (cross-sections stained with benzidine after harvesting). But it is likely that ERT results display the physiological active sapwood, the width of which is over-estimated by staining. The tomographic method can therefore be considered a powerful method for the non-destructive estimation of sapwood and heartwood width.
Trees reduce the spread of decay by creating a reaction zone as the fungus penetrates the sapwood. Since the formation of the reaction zone implies a sacrificial conversion of sapwood, the sapwood area of the tree can be reduced as decay progresses. Oliva et al. (2012) investigated Norway spruce with Heterobasidion annosum decay in Central Sweden and found that the proportion of section was significantly associated with a reduction of the conductive sapwood proportion.
Norway spruce (Picea abies [L.] Karst.) is amongst the most significant European tree species as well as one with a high occurrence of stem decay.
In Norway spruce, only the use of RISI (Relative Impedance in Situ Examination) has been published out of the methods based on the measurement of electrical resistance; the approach makes use of four point resistivity measurements and was employed in detecting wood decay caused by Heterobasidion annosum (Larsson et al. 2004).
EIT provides two types of results that can be used in various manners for evaluating tree health and layout of the inner structure of the trunk. The above-mentioned raster image tomogram is the basic output of the method and shows zones with variable ranges of electrical resistance highlighted with different colours. Datasets with electrical resistance values are primarily intended for compiling the raster image and are usually not employed when carrying out EIT diagnostics of rot. A dataset contains positions of all tomogram raster image squares and the electrical resistance values assigned. Since tomograms make use of a relative colour scale from which the breadth of resistance value range or the values corresponding to the specific points in the cross section are not apparent at first glance, any comparison of individual trees with different resistance values may then be very complicated or misleading. Making use of directly measured values, along with tomograms, is a logical step for improving EIT measurement interpretation.
The aim of this study was to examine the possibilities and opportunities of making use of processing the measured resistance values for the diagnostics of rot or possibly for quantifying other parameters related to the spread of rot, such as sapwood proportion in the trunk. Norway spruce was selected as the key commercial tree species of Central Europe; it is also a species for which the number of reports produced and based on tomography methods is relatively low. Our basic hypothesis was assuming that not only the distribution of various resistance values in the trunk, but also the properties of datasets were of diagnostic importance, which particularly goes for the data of heartwood which is primarily damaged by rots in the event of Norway spruce. Our specific aim was to examine the following hypotheses: (i) statistical parameters of datasets (dispersion, quantils, median, etc.) of the measured values of electrical resistance are important for the diagnostics of rot and the determination of tree-specific extent of rot infestation; (ii) the relative proportion of sapwood decreases with the spread of rot, the sapwood proportion specified by a tomograph may be an auxiliary indicator of rot presence and expansion.
2 Materials and methods
2.1 Study site and assessment design
The research was underway on Proklest, a site north-east of Brno, South Moravia, Czech Republic. The mean annual (1961–2012) temperature was 7.1 °C, the mean annual precipitation was 779 mm, the mean precipitation per growing season (April to September) was 475 mm. The elevation of the site is 540–580 m. The soil is one of the cambisol soil type.
Two monoculture stands of Norway spruce (Picea abies) placed close to each other were selected for the measuring activities.
A total of 27 sample trees were measured in September and October 2013 (Table 1) with electrical resistance being identified in each of them using Treetronic, an electric impedance tomograph of Argus electronic GmbH. The measurements rely on point-like electrodes (galvanized nails) placed around the boundary of a tree stem. First (positive) electrode is oriented to north, then it is followed by alternately connected positive and negative electrodes on trunk perimeter. 24 electrodes were used for all the measurements. A low frequency current 8.3 Hz was applied and measured in a dipol-dipol configuration (Reynolds 1997). All measurements were executed standardly according to the machine´s manual (Göcke 2011). A current is supplied into the stem using two of the electrodes. The resulting electric field depends on the resistance distribution and is measured in pairs by the other electrodes in order to obtain a potential difference (voltage).
| Table 1. Basic characteristics of the forest stands. | ||||
| Month of measurement | GPS | Forest age | Number of trees | Height of tomographic measurement |
| September | 49°18´N, 16°46´E | 100 | 15 | 130 cm |
| October | 49°19´N, 16°45´E | 110 | 12 | 60 cm |
Immediately after the measurements, i.e. the same day, the trees were felled down by routing the cut at a height of electrode location. Radial cut-outs were collected from butts, their thickness being 10 cm approximately; the day after each of them was levelled by shaving and photographed.
2.2 Calculations and data analysis
The obtained data were processed using the PiCUS Q72 EXP Treetronic software application, one that provides graphical results (tomograms) as well as datasets that complement tomogram raster image resistance values and determine the coordinates of raster image field peaks in the tomogram. Coordinates of raster image triangle peaks were computed from X/Y coordinates of triangle centres. This way each triangle centre was assigned one of the electrical resistance values obtained by measuring. Using centre coordinates, points were plotted using the ArcMap 10.2 program to which a seven-grade colour scale was added on the basis of the frequency of the occurrence of electrical resistance values within the overall scale of resistance for each of the trees. The tomograms newly displayed in this way were used for separating heartwood and sapwood polygons with electrical resistance values. The line of division was routed along the thin green transitional layer (Fig. 1), which is located between the blue layer of sapwood and the yellow transitional layer. The green rings in the tomograms correspond to the steep rise in resistivity from sapwood to heartwood.
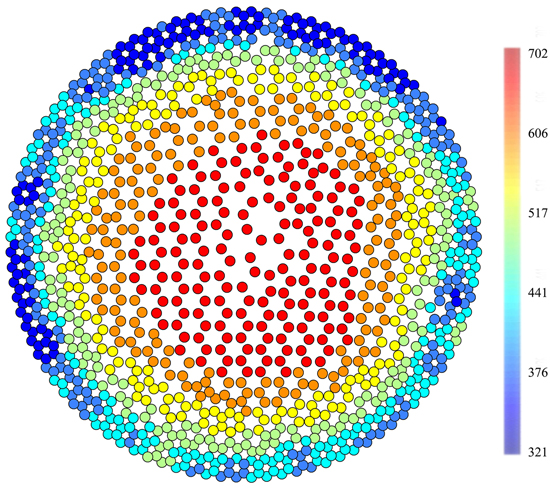
Fig. 1. A tomogram (Ωm) of a healthy individual (September, n. 9) displayed in GIS, when points replace the raster image. There is a clearly visible green transitional boundary between heartwood and sapwood.
The same heartwood/sapwood boundary was previously used for pine Pinus sylvestris (Bieker and Rust 2010). The internal subdivision of resistance in the tomograms is the same for both Picea abies and Pinus sylvestris meaning that the green layer has a width of only a single pixel unlike the yellow layer which may be several pixels wide. When making the division line at the point of the displayed rot, the width of the sapwood layer was maintained the same as in the healthy portion of the trunk until reconnecting to the green layer. The values of the pixels along which the line of division was routed always belonged to the heartwood dataset. The primary objective of splitting the datasets into the heartwood and sapwood portions was to compare the resistance values of both portions of the trunk in trees with different extent of rot infestation.
Tomogram and cross-section photograph overlapping was implemented using Adobe Photoshop. The overlaps were used for studying the tomogram accuracy when locating the rot with the proportion of the area (%) of the rot on the cross section mismatching the blue zone on the tomogram being the key criterion. The trees were classified into three groups: fully (<10%), partially (10–50%) and significantly (>50%).
The proportion of sapwood was measured by means of Arcmap 10.2 using the tomograms that were presumed to display only functional sapwood (see Introduction) whist using the same procedure of dividing, i.e. along the green points of the raster image.
Again, the measurement of percentage of rot-affected wood on radial cross sections was carried out by means of Arcmap 10.2. In addition to interpreting tomograms and datasets, the relative areas of rot-infested wood found on the cross section were employed in assessing the relationship between the relative size of sapwood and proportion of rot-infested wood. The data were processed using the STATISTICA 12 software.
3 Results
3.1 The presence and area of decay on the cross section, determination of sapwood proportion
Out of 27 trees, absence of decay was found in 7 trees when cut, while decay was present in 19 trees – from early to developed stages affecting a considerable portion of heartwood. Advanced stage of decay was found in 7 trees, with four of them observed to have formed cavities (Table 2). In terms of normal development of rot in the trunk, tree 7B was an exception in that it had developed a cavity while the cut area affected by rot was small, 18% (Table 2). In addition, the area of decay was located at the transition between heartwood and sapwood and exhibited a considerable disintegration of the structure of wood (Fig. 3). These atypical properties are important for the interpretation of subsequent tomography measurements (see Section 3.3).
| Table 2. Decay quantification and description. While sapwood proportion was found from tomograms, the remaining characteristics, i.e. decay proportion, relative cavity area and decay description, were obtained from radial cuts. | ||||||
| Tree ID | Diameter (cm) | Sapwood propotion (%) | Decay propotion (%) | Relative cavity area (%) | Overall EIT and real cut | Decay description |
| 1 | 123 | 33.7 | - | - | - | - |
| 2 | 122 | 33.1 | - | - | - | - |
| 5 | 169 | 37.5 | - | - | - | - |
| 6 | 132 | 32.3 | - | - | - | - |
| 9 | 153 | 33.3 | - | - | - | - |
| 11 | 147 | 36.0 | - | - | - | - |
| 4B | 137 | 38.1 | - | - | - | - |
| 13 | 146 | 36.7 | - | - | - | - |
| 2B | 218 | 34.1 | 4.8 | - | Fully | 2IR, 1RDS+M |
| 10B | 174 | 31.9 | 6.7 | - | Fully | 3IR |
| 3B | 188 | 42.1 | 7.5 | - | Fully | 1IR, 1RDS+M |
| 12B | 179 | 30.3 | 8.5 | - | Fully | 4IR |
| 8B | 194 | 36.8 | 9.5 | - | Partially | 2VR+M |
| 3 | 131 | 35.4 | 10.5 | - | Partially | 2IR, 1VR |
| 15 | 177 | 36.4 | 11.9 | - | Significantly | 3IR, 1RDS+M |
| 1B | 188 | 43.9 | 13.7 | - | Significantly | 7IR, 2VR |
| 7 | 160 | 41.7 | 17.9 | - | Significantly | 1RDS |
| 7B | 157 | 28.0 | 18.6 | 1.9 | Partially | 1VR, 1RDS+M |
| 11B | 132 | 33.7 | 22.6 | - | Significantly | 4IR, 1VR+M |
| 14 | 140 | 37.5 | 22.8 | - | Significantly | 3IR, 2VR, 1RDS+M |
| 8 | 118 | 38.7 | 32.4 | - | Significantly | 1IR, 1RDS |
| 12 | 178 | 19.2 | 35.2 | - | Partially | 4VR+M, 3RDS+M |
| 6B | 220 | 23.1 | 43 | 6.3 | Significantly | 2VR, 1RDS+M |
| 5B | 173 | 24.8 | 46.4 | 2.1 | Fully | 3RDS+M |
| 10 | 173 | 19.8 | 47 | - | Significantly | 1RDS+M |
| 4 | 128 | 20.4 | 74.4 | - | Significantly | 1RDS |
| 9B | 180 | 19.3 | 85.4 | unknown | Significantly | 1RDS |
| nIR = Incipient rot (early stages) nVR = Visible rot (without destroying the wood structure) nRDS = Advanced rot destroying the wood structure n = The number of occurrences (spots) of rot +M = Mycelium | ||||||
Sapwood proportion reduces as the decay proportion on the radial cut increases (Fig. 2). To this end, the trees can be divided into two distinct groups of which the first group with decay proportion to 35% approximately has sapwood proportion over 30% except one tree while the other group with the decay proportion above 35% has a sapwood proportion below 25%.
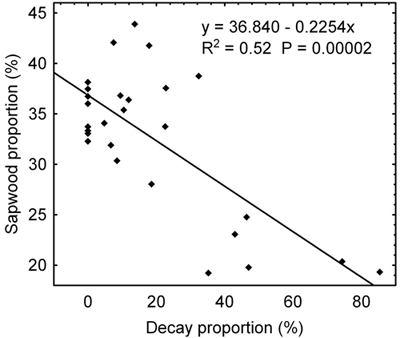
Fig. 2. Relation between a sapwood proportion found through tomography measurements and a decay proportion identified on the radial cut implemented on the site of tomography measurements.
3.2 Tomogram evaluation and comparison with tree cut-outs
In spruces of good health, the circular zone of heartwood is always in red, i.e. with higher electrical resistance values. The heartwood zone connects to the thin, green-yellowish transitional part and blue-coloured outer ring of sapwood with higher values of electrical resistance (Fig. 3, tree 2). As a rule, the inner portion of heartwood is typically disrupted when trunk decay occurs and seen on the tomogram as a zone with lower electrical resistance (Fig. 3, tree 2B). As the area of decay expands, the tomogram shows a visible disintegration of heartwood-zones are emerging with low resistance and linking the central and the perimeter portions (Fig. 3; trees 8B, 1B). The advanced stages of decay than clearly show the break-up of the heartwood portion, with an extensive zone of low resistance emerging in the heartwood portion on the one hand while places with some stage of advanced decay form zones with high resistance (Fig. 3, tree 9B). Tomograms thus in some cases will not show a real picture of layout and size of the rot as detected on cuts on places of measurement (Table. 2, Fig. 3; trees 1B, 8, 7B).
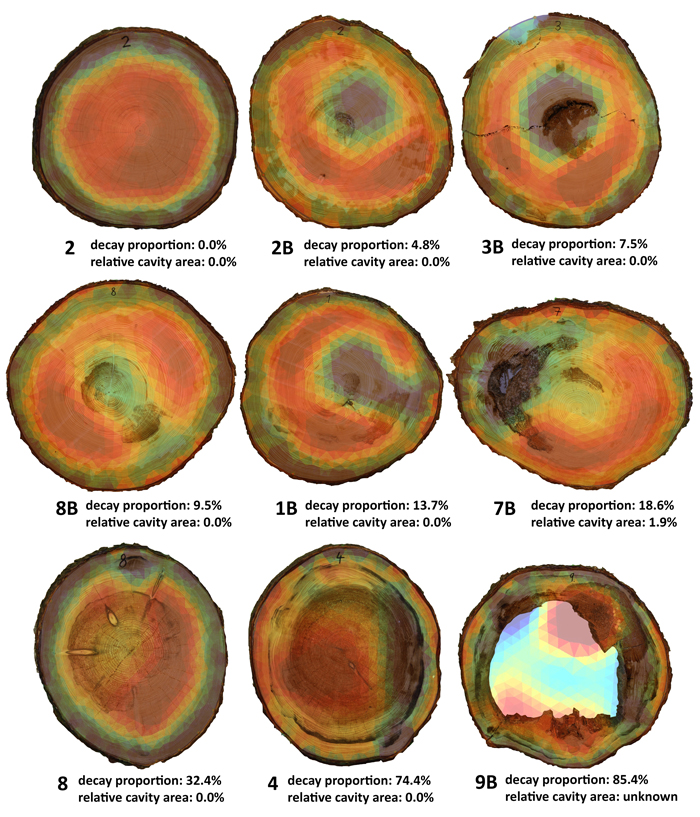
Fig. 3. Cuts with overlapping tomograms being sorted as per decay proportion in the real cut. Present are also three exceptions (1B, 3B, 7B) as described in Section 3.3. Due to the cavity filling deliberately falling out during the felling, the cavity presence and extent could not be determined during the tomography measurement.
3.3 Evaluation of electrical resistance datasets – categorising trees by presence and extent of the decay
In healthy trees, both sapwood and heartwood resistance value data were normally distributed to some extent. The interquartile range Q3–Q1 (Q0.75–Q0.25) was not greater than 350 Ωm and also the range of non-outliers of heartwood data was narrow given the quantil size; it was not broader than 700 Ωm for any of the trees. In any of the healthy trees, Q3 did not exceed 1000 Ωm. Sapwood data of trees without rotting feature a small range of both quantils and non-outliers (Fig. 4).
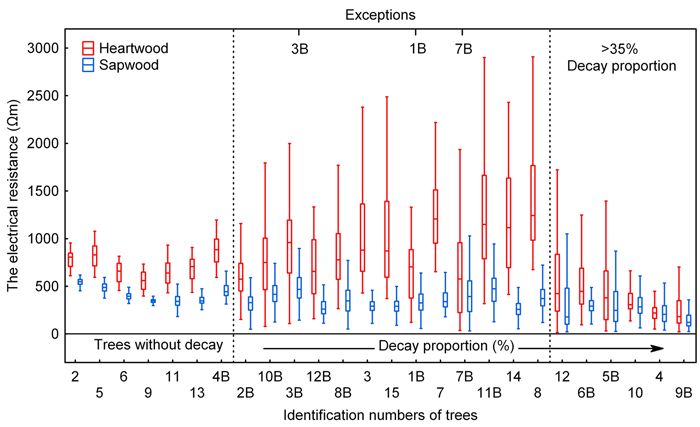
Fig. 4. Electrical resistance values split into heartwood and sapwood data. Sorted by decay proportion (as measured on radial cuts). The central rectangle spans the first quartile (Q1-25%) to the third quartile (Q3-75%). A segment inside the rectangle shows the median and “whiskers” above and below the box show the locations of the minimum and maximum (1%).
Based on the distribution of electrical resistance values (Fig. 4), trees without the presence of decay can be clearly distinguished from trees affected by rotting, even from those in which there is only an early rotting stage affecting only a few % of the cut area (see below). Subsequently, individuals with the presence of decay can be divided under statistical characteristics of datasets into two groups, which we referred to as “lesser or medium-sized area of decay” and “large area of decay” groups of trees; these groups can also be clearly distinguished (Fig. 4).
Already at low values of rot area, a change was apparent in the range of electrical resistance values and involved an expanded range of non-outliers in both heartwood and sapwood. Examples include tree 2B with rot area of 4.8 %. The interquartile range Q3–Q1 for this tree equals that for the trees without decay, but ranges of non-outliers of both heartwood and sapwood portions do not clearly distinguish the tree from healthy individuals (Fig. 4). As the rot area expanded, the interquartile range Q3–Q1 for the heartwood portion grew as well, up to the values above 1500 Ωm. Noticeably also grew the range of non-outliers of heartwood portion, exceeding 2500 Ωm in some cases. Sapwood resistance values did not change very much as the area of decay expanded.
The last group of trees which is referred herein to as “large area of decay” trees had low values of electrical resistance for heartwood, 500 Ωm and less, the median values being in all cases above the value in healthy trees as well as in trees with a lesser extent of rot. Significantly lower were also interquartile ranges Q3–Q1 of heartwood data when compared with the previous group. The distribution of heartwood data is distinctively left-sided for this group; likewise, left-sided distribution can be observed for the sapwood data as well, except trees 6B and 10. At the same time, the left-sided distribution of sapwood data does not occur in any of the previous two groups. Similarly to the previous group, both sapwood and heartwood data have relatively a large range of non-outliers with respect to the interquartile range. This characteristic makes them clearly different from the group of trees without rot. Overlapped interquartile ranges of heartwood and sapwood data appear to be the most prominent trait distinguishing the “large area of decay” tree group from the previous groups. The overlapping of interquartile range of heartwood data and that of sapwood data is more than a half; for some of the trees, the ranges overlap completely. Since trees in this group had the decay proportion greater than 35% (see Table 2), it is the same group delimited as early as evaluating the relationship between the sapwood proportion and the decay proportion (Fig. 2).
Three trees from our set of 27 measured trees (indicated on Fig. 4) showed some differences in the values of electrical resistance compared with trees with similar area of rot. Parameters of the electrical resistance dataset for tree 1B with a decay proportion of 13.7% are the closest to tree 2B with a significantly lower proportion of decay. The portion of trunk affected by rot, however, is dislocated in the tree into small facets with incipient decay. This very fragmentation may be the reason for the differences described above. The properties of the electrical resistance dataset for tree 3B, particularly the tree median, correspond with a significantly higher decay proportion than the 7.5% as identified. This can be likely explained by the fact that this tree was found to be in an advanced stage of decay with evident stage of disintegration of the wood structure (Fig. 3), which was otherwise not seen before the rot area became significantly larger. Similar is the case of tree 7B with a decay proportion of 18%, with however again a very advanced rot seen to destroy the wood structure. Based on the decay proportion, the tree on Fig. 4 was included in the group with a lesser or medium-sized area of decay; on the basis of the characteristics of the electrical resistance dataset, this tree could be included at the beginning of the “large area of decay” tree group or on the boundary between the two groups.
4 Discussion
The correct interpretation of data is a key challenge in using the technology of impedance tomography, and requires seeking instruments for facilitating (Nicolotti et al. 2003). Overlapping of tomograms with real radial cuts (Fig. 2) makes it evident that EIT tomograms not always make it possible to determine the range or stage of the rot without additional information. The grounds for this include a single colour scale, which is adapted for each tomogram to fit the range of electrical resistance. In individuals with the presence of rot, the range of electrical resistance significantly increases due to the increased resistance values in the heartwood portion (Fig. 3). This increase causes the colour scale to shift toward red, thus shifting of the colour range of the zone with decay, which then may not be shown to the full extent in the tomogram. This fact can be prevented by combining the results obtained from EIT with those of acoustic tomography (Brazee et al. 2010; Göcke 2011). However, such a combination naturally requires double instrumentation and double measurements, i.e. significantly increased demand in terms of both materials and logistics. Enhancing the interpreting potential based directly on information provided by EIT presents a solution without such complications.
The statistical processing of datasets showed that comparison of statistical parameters of sets of hardwood and sapwood electrical resistance data makes it possible to clearly distinguish trees without the presence of decay from those with rot. Any clear explanation for the increase in the median values of resistance in heartwood and increased values of variance of the data as a result of growing decay proportion in the “lesser or medium-sized area of decay” group of trees is still missing. Generally, it can be concluded that trees with the stress burden caused by drought, injury or the presence of pathogens typically exhibit higher electrical resistance values than healthy trees (Davis et al. 1979; Shigo 1985). The detected increase in the values of resistance in heartwood are also very likely to relate with the presence of fungal pathogen – the fungus, however, is normally already present in a stage of latency even in the unaffected portion of heartwood (Parfitt et al. 2010). A question remains, what mechanism/mechanisms are the cause for this increased resistance in heartwood.
In the portions of heartwood, water content is growing as the rot develops (Göcke 2011). Assumptions are possible in this regard that the opposite process may occur in the portion unaffected by the rot. When hyphae penetrate into cells, most of wood-decaying fungi are capable of hydrolysing pectin in the surface membranes (Green and Clausen 1999; Schwarze and Landmesser 2000); generally, it is the first of the changes in the internal environment as the fungus colonisation takes place. Penetrating hyphae and intense enzymatic activity in wood decomposition (Schwarze 2007) cause changes in the content of ions in the wood. These may lead to the electrical resistance becoming reduced (Jartti 1978; Shortle and Smith 1987), as well as increased. If both of the processes, i.e. changes in water content levels in the different parts of heartwood and changes in ion concentrations, coexist, then they may lead to a significant variance of electrical resistance values determined in the heartwood portion of trees with rot under development.
Electrical resistance considerably responds to physiological changes caused by the advancement of rot; this influence may be manifest in the characteristics of heartwood data to a greater extent than decay proportion. This fact explains the three exceptions (see Section 3.3 and Fig. 4) that with the properties of their datasets do not match the level of rot to the extent that would be predicted. On the other hand, since the resistance in air-filled cavities is high, the presence of these is assumed to result in higher heartwood resistance values.
The cavities involved in our cases of such trees were only very small and did not reflect on the datasets to any significant extent. In the event of larger cavities it is uncertain whether such trees would be possible to recognise based on statistical parameters of datasets. They are likely to overlap with the “lesser or medium-sized area of decay” tree group. Direct use of tomograms is possible in detecting cavities, however, as well as is sapwood proportion. When detected based on tomograms, sapwood proportion may serve as an additional indicator for discerning the “lesser or medium-sized area of decay” tree group and the “large area of decay” tree group. Sapwood proportion was dependent of a decay proportion, which in particular applied to trees with a decay proportion greater than 35% approximately (See Section 3.1, Fig. 2). This boundary matches that between the two groups as defined by the statistical processing of datasets. Then, it can be noted for instance, that if statistical properties of datasets correspond to a lesser or medium-sized area of decay, but a low sapwood proportion indicates that the area is larger, a cavity can be assumed to exist within the rot developed in a carpet-like manner.
Distinctive changes in the nature of rot explain the reduction of sapwood proportion and in particular its significant extent if decay proportion exceeds 35%. The decay had already stopped to occur in the form of foci of varied intensity; rather, it generally blends to form a single deposit occupying most of the heartwood portion. Similar conclusions were reached by Oliva et al. (2012) for Norway spruce in Central Sweden. They found that the loss of sapwood through decaying caused by Heterobasidion annosum comprised two phases: up to 40% decay (when decay increases correlated poorly with a decrease in sapwood) and more than 40% decay (when the proportion of decay significantly correlated with a decrease in the proportion of sapwood). According to Oliva et al. (2012), the smaller sapwood in decayed trees would not reduce radial growth; rather, it would be to some extent the result of previous periods of low growth due to the formation of a reaction zone (induced by decaying). It is very important for our use of the parameter as an indicator (see above). A rapid decrease in the sapwood area supports a qualitative shift in the allocation of tree resources towards defence when stress factors appear.
Trees with an area of decay beyond the limit are therefore considerably more susceptible to mortality, so discerning them from trees with a lesser area of decay is very important for the diagnosis and subsequent management. The difference between the limit value of decay proportion between our study (35%) and the study of Oliva et al. (2012) (40%) referred to above could be caused by the different way of measuring the size of sapwood. On the other hand, it can also be determined by the properties of rots, since our study involved cases of decay caused by various pathogens. The molecular diagnostic assay for the detection and identification of wood decay fungi identified, as part of a parallel study, the following fungi species: Stereum spp., Heterobasidion spp, Porodaedalea spp., Fomitopsis pinicola, and Armillaria spp. Likewise, the cause may consist in the differences in the site and climatic conditions in our study and that of Sweden.
The effect of the season of the year on the values can be a factor that can further challenge the exact interpretation of resulting EIT datasets. The most dramatic differences in measured results occur in winter at the temperature < 0°C (Larsson et al. 2004); lesser differences also exist between the other periods of the year, but lie in the overall shift of resistance values rather than in the characteristics of datasets that we used for discerning the individual groups of trees (interquartile range Q3–Q1, range of non-outliers). We therefore assume that the groups in question can be equally discerned in other parts of the year than the autumn, i.e. the period when our measurements were underway.
5 Conclusions
The method of comparison of the statistical parameters of datasets based on EIT offers an attractive alternative and/or addition to the basic interpretation of tomograms. EIT datasets and a sapwood proportion make it possible to clearly identify trees without rot. Trees with rot can be split into two groups: trees with a lesser or medium-sized area of decay (decay proportion < 35%) and trees with a large area of decay (decay proportion > 35%). Sapwood proportion found based on tomograms reduces as decay proportion on the radial cut increases.
Acknowledgements
The research was supported by the European Social Fund and the state budget of the Czech Republic, Project Indicators of trees vitality Reg. No. CZ.1.07/2.3.00/20.0265. Supported by a grant from Iceland, Liechtenstein and Norway; Project Frameworks and possibilities of forest adaptation measures and strategies connected with Climate change, No.: EHP-CZ02-OV-1-019-2014. and projects 30/2013, 36/2013 supported by Internal Grant Agency of the Faculty of Forestry and Wood Technology, Mendel University in Brno.
References
Bieker D., Rust S. (2010). Electric resistivity tomography shows radial variation of electrolytes in Quercus robur. Canadian Journal of Forest Research 40(6): 1189–1193. http://dx.doi.org/10.1139/X10-076.
Bieker D., Kehr R., Weber G., Rust S. (2010). Non-destructive monitoring of early stages of white rot by Trametes versicolor in Fraxinus excelsior. Annals of Forest Science 67(2): 210–216. http://dx.doi.org/10.1051/forest/2009103.
Bieker D., Rust S. (2010). Non-destructive estimation of sapwood and heartwood width in Scots pine (Pinus sylvestris L.). Silva Fennica 44(2): 267–273. http://dx.doi.org/10.14214/sf.153.
Brazee N., Marra R., Göecke L., Van Wassenaer P. (2010). Nondestructive assessment of internal decay in three hardwood species of northeastern North America using sonic and electrical impedance tomography. Forestry 84: 33–39. http://dx.doi.org/10.1093/forestry/cpq040.
Bucor V. (2005). Ultrasonic techniques for nondestructive testing of standing trees. Ultrasonics 43(4): 237–239. http://dx.doi.org/10.1016/j.ultras.2004.06.008.
Davis W., Shigo A., Weyrick R. (1979). Seasonal changes in electrical resistance of inner bark in red oak, red maple and eastern white pine. Forest Science 25(2): 282–286.
Deflorio G., Fink S., Schwarze F.W.M.R. (2008). Detection of incipient decay in tree stems with sonic tomography after wounding and fungal inoculation. Wood Science and Technology 42: 117–132. http://dx.doi.org/10.1007/s00226-007-0159-0.
Dubbel V., Weihs U., Krummheuer F., Just A. (1999). Neue Methode zur zweidimensionalen Darstellung von Fäulen an Fichte. AFZ/Der Wald 26: 1422–1425.
Göcke L. (2011). PiCUs: treetronic electrical impedance tomograph for trees. Argus electronic gmbh. Rostock, Germany. 35 p.
Green F., Clausen C.A., (1999). Production of polygalacturonase and increase of longitudinal gas permeability in southern pine by brown-rot and white-rot fungi. Holzforschung 53: 563–568. http://dx.doi.org/10.1515/HF.1999.093.
Hagrey S.A.al. (2007). Geophysical imaging of rootzone, trunk, and moisture heterogeneity. Journal of Experimental Botany 58: 839–854. http://dx.doi.org/10.1093/jxb/erl237.
Hanskötter B. (2004). Diagnose fakultativer Farbkerne an stehenden Rotbuche (Fagus sylvatica L.) mittels “Elektrischer Widerstandstomographie”. Ph.D. thesis. Department of Forest Science and Ecology, Georg-August Univ. Göttingen, Germany. 133 p.
Jartti P. (1978). On the measurement of internal decay in living trees. Silva Fennica 12(2): 140–148. http://dx.doi.org/10.14214/sf.a14851.
Larsson B., Bengtsson B., Gustafsson M. (2004). Nondestructive detection of decay in living trees. Tree Physiology 24(7): 853–858. http://dx.doi.org/10.1093/treephys/24.7.853.
Nicolotti G., Socco L.V., Martinis R., Godio A., Sambuelli L. (2003). Application and comparison of three tomographic techniques for detection of decay in trees. Journal of arboriculture 29(2): 66–78.
Oliva J., Camarero J.J., Stenlid J. (2012). Understanding the role of sapwood loss and reaction zone formation on radial growth of Norway spruce (Picea abies) trees decayed by Heterobasidion annosum s.l. Forest Ecology and Management 274: 201–209. http://dx.doi.org/10.1016/j.foreco.2012.02.026.
Reynolds J.M. (1997). An introduction to applied and environmental geophysic. John Wiley & Sons, West Sussex. 796 p.
Shigo A.L., Shortle W.C. (1985). Shigometry: a reference guide. Agriculture handbook no. 646. U.S. Department of Agriculture, Forest Service, Washington, DC. 49 p.
Shortle W.C., Smith K.T. (1987). Electrical properties and rate of decay in spruce and fir wood. Phytopathology 77(6): 811–814. http://dx.doi.org/10.1094/Phyto-77-811.
Schwarze F.W.M.R. (2007). Wood decay under the microscope. Fungal biology reviews 21(4): 133–170. http://dx.doi.org/10.1016/j.fbr.2007.09.001.
Schwarze F.W.M.R., Landmesser H. (2000). Preferential degradation of pit membranes within tracheids by the basidiomycete Physisporinus vitreus. Holzforschung 54: 461–462. http://dx.doi.org/10.1515/HF.2000.077.
Weihs U., Dubbel V., Krummheuer F., Just A. (1999). Die elektrische Widerstandstomographie - Ein vielversprechendes Verfahren zur Farbkerndiagnose an stehenden Rotbuchen. Forst und Holz 6: 166–170.
Total of 22 references.
