Werner Poschenrieder  ,
Andreas Rais,
Jan-Willem G. van de Kuilen,
Hans Pretzsch
,
Andreas Rais,
Jan-Willem G. van de Kuilen,
Hans Pretzsch
Modelling sawn timber volume and strength development at the individual tree level – essential model features by the example of Douglas fir
Poschenrieder W., Rais A., van de Kuilen J.-W. G., Pretzsch H. (2015). Modelling sawn timber volume and strength development at the individual tree level – essential model features by the example of Douglas fir. Silva Fennica vol. 50 no. 1 article id 1393. https://doi.org/10.14214/sf.1393
Highlights
- An individual tree timber growth and quality model toolbox was designed
- It realistically predicts an increase of bending strength with planting density
- Prediction was shown to be based on consideration of essential intrinsic variables
- Height‑diameter‑allometry depending on planting density was effective
- Consideration of cambial age and knot area ratio was crucial.
Abstract
We designed a streamlined timber growth and quality model that aims at the effect of stand management on the efficiency of wood resource use. Applying the R based module toolbox to experimental plots of Douglas fir (Pseudotsuga menziesii [Mirb.] Franco) we analysed essential model features for reflecting the influence of planting density on board strength. The current version realistically predicted a significant increase of centre board bending strength at tree age 40 with initial stand density. Model performance gained clear advantage from a) parameterisation of height to diameter allometry as dependent on planting density b) consideration of cambial age and cross‑sectional knot area in board strength computation. Crown shape was less decisive. The model produced a significant effect of planting density even after a whole rotation period of 70 years as well as a realistic spectrum of board bending strength.
Keywords
sawing;
wood quality modelling;
stem structure;
grading;
sensitivity test;
R statistical environment
-
Poschenrieder,
Technische Universität München, Chair of Forest Growth and Yield Science, Hans Carl von Carlowitz Platz 2, 85354 Freising, Germany
 http://orcid.org/0000-0002-9028-8583
E-mail
Werner.Poschenrieder@lrz.tum.de
http://orcid.org/0000-0002-9028-8583
E-mail
Werner.Poschenrieder@lrz.tum.de
- Rais, Technische Universität München, Chair of Forest Growth and Yield Science, Hans Carl von Carlowitz Platz 2, 85354 Freising, Germany; Technische Universität München, Holzforschung München, Winzererstrasse 45, 80797 Munich, Germany E-mail Andreas.Rais@hfm.tum.de
- van de Kuilen, Technische Universität München, Holzforschung München, Winzererstrasse 45, 80797 Munich, Germany E-mail vandekuilen@hfm.tum.de
- Pretzsch, Technische Universität München, Chair of Forest Growth and Yield Science, Hans Carl von Carlowitz Platz 2, 85354 Freising, Germany E-mail Hans.Pretzsch@lrz.tum.de
Received 20 May 2015 Accepted 11 November 2015 Published 9 December 2015
Views 223211
Available at https://doi.org/10.14214/sf.1393 | Download PDF

Supplementary Files
1 Introduction
The earliest tools for the prediction of wood and timber yield were observation based tables for single species stands that exclusively focused on volume growth. In the course of the 1960s and 1970s they were replaced by empirical models of stand development that were implemented in computer programs to calculate printed yield tables. During the same period simulators of stand growth were developed to follow new requirements such as the prediction of volume growth in mixed forest stands. On the one hand, model evolution lead to observation based individual tree simulators to capture the effect of local competition in heterogeneous stands. On the other hand, it resulted in physiological process models that often assume a simplified representation of stand structure e.g. as a single vegetation layer or an ensemble of interacting cohort layers (Pretzsch et al. 2008). To describe the effect of a changing weather regime on stand dynamics, structure and yield, also hybrids of both types were constructed (Mäkelä et al. 2000; Weiskittel et al. 2010). They model carbon assimilation mechanistically and describe its allocation within the stand based on individual tree competition (ibid).
An additional challenge to modelling arose from timber quality management, covering the whole production chain from stand treatment to sawing. Wood quality models aim to predict the properties of timber based on measured forest inventory data or assumptions of stand development in response to scenarios of management or future climate. Following the references in Mäkelä et al. (2010), their main development phase began in the late 1980s with the SYLVER growth and sawing simulation system (Mitchell 1988). As also presented by Mäkelä et al. (2010), a spectrum of models and modules since has evolved that covers all main types of growth algorithms and may imply a high level of stem shape and structure detail description (Houllier et al. 1995; Hann et al. 1997; Di Lucca 1999; Todoroki et al. 2005).
Wood quality models may either be used to estimate the volume to quality relation based on inventory data or on future scenario simulation results. Therefore, they need to predict stem structure on the spatial scale of individual boards (Mäkelä et al. 2010). The most central structure of the lower stem (butt log) in radial direction adheres to the juvenile growth phase that is complex and governed by strong competition on the individual tree level (Donato et al. 2012) but has rarely been covered by individual tree models (e.g. Ritchie and Hamann 2007). Hence, one likely approach is a backward projection that is based on a known planting pattern and the current stand structure. This method takes into account the range of diameter growth gained by wood core or stem disk data.
In strength grading the knot size is a decisive indicating property for wood quality. A crucial component of any wood quality simulator that reflects the inner structure of stems and logs to compute board strength thus is the vertical and radial positioning and the number of branches as they have a major impact on strength (Mäkinen et al. 2001). Branch growth depends on assimilation and allocation into branch sapwood and hence on vertical position and local competition (Gort et al. 2010) which is in turn determined by stand age and spacing.
Branch models for wood quality estimation are typically branch distribution models (e.g. Houllier et al. 1995), and only few (e.g. Hein et al. 2007) take into account local stand density as reported by Seifert (2003). However, to capture the effect of management options, local competition has to be taken into account as crowns may reflect aboveground competition by crown position (Muth and Bazzaz 2003), crown dimensions (Thorpe et al. 2010) or details of the hull shape (Rouvinen and Kuuluvainen 1997). Hence, branch growth and dimension need to be modelled based on the situation of the immediate aboveground environment of a tree either on the level of individual branch growth (Seifert 2003) or by means of a competition dependent growth of the crown’s convex hull as proposed e.g. by Pretzsch et al. (2002).
Crown and branch architecture and the influence of annual stem growth on the inner structure of logs and boards have been modelled in high detail by considering the description of tree growth and resulting stem architecture on a mechanistic level (Kellomäki 1999; Mäkelä et al. 2000). As an approach to describe structure forming processes even on the microscopic scale, Lang and Kaliske (2013) used the finite elements method to show the influence of bending on fibre direction.
Modelling frameworks for wood quality often package modules of high theoretical detail (Mitchell 1988; Maguire et al. 1991; Meredieu et al. 1999). In contrast, the modelling framework of this study is marked by a generally lean approach for a module chain that spans from reconstructed early growth via individual tree inventory through to future prognosis of board strength and grading. Its basic concept is an actinomorphic perception of the tree with a radially symmetrical convex crown hull. This work in particular aimed to identify the minimum set of features of a distance dependent individual tree model that were necessary to capture the effect of planting density on board strength. It finally evaluated the module set based on the effect of planting density on board strength of Douglas fir (Pseudotsuga menziesii [Mirb.] Franco) over a whole rotation period.
The investigation was based on the combination and interdisciplinary evaluation of related tree dimension, stem disk and board strength data from two long term observation sites of pure Douglas fir stands in south-eastern Germany with one representing rather dry and the other indicating favourable soil climatic conditions. We simulated the development of tree architecture on scales ranging from stem and crown shape to branch position and size and even into higher detail via the inner structure of the stem to the knottiness and annual ring width of individual boards. Based on the final result we derived the bending strength on board level. The current model version was evaluated with respect to its quality of reconstruction to age 20 and prognosis to age 40 as compared to an earlier approach (basic model version) that was marked by more simplistic assumptions regarding both wood structure and height to diameter influence on board strength. Eventually, the simulated effect of planting density on board strength over a presumed rotation period of 70 years was studied through comparison of current and basic version as well.
2 Material and methods
2.1 General architecture of the model
The simulation model covers the major relevant linkages reaching from stand management and site influence via individual tree competition and growth to crown shape and branch dimension and further down to knottiness, wood density and strength of the individual board. The functionality of the model may be readily modified by adding or replacement of plug-in computation objects. Parameter values are provided by a data object and given by site and species. Supplementary file 1 provides basic technical documentation.
Predicted growth is driven by diameter increase as dependent on individual tree size and position. It starts at the earliest state of the stand that had been recorded on the individual tree level. Previous growth is reconstructed from first inventory of the tree individual and collective annual ring data. It covers the early phase of stand development when structure has not been recorded by inventory of individual trees. All variable values that refer to the starting conditions of prediction will be marked by the adjective setup in the following. Hence, the inventory that had defined the corresponding stand structure is named setup inventory and any registered diameter at breast height (1.3 m) setup DBH. Fig. 1 gives an outline of simulated individual tree growth finalised by logging and sawing.
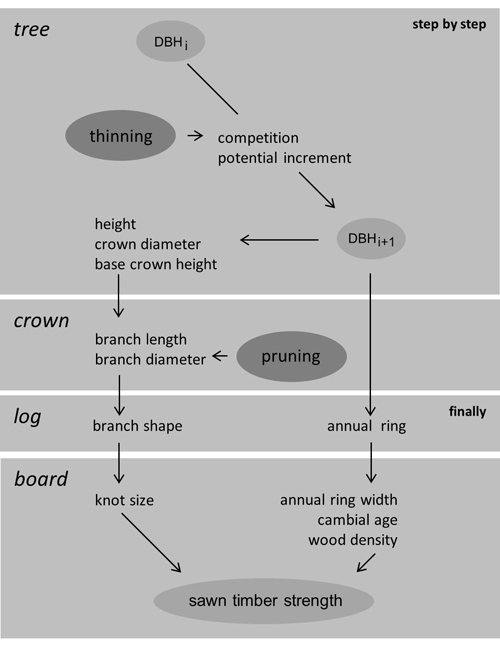
Fig. 1. Simulation of individual tree growth, finalised by logging and sawing; tree and crown components are computed within each time step; thinning and pruning are optional and occasional.
2.2 DBH growth
Potential DBH growth depends on DBH through a unimodal function. Each annual step of growth prediction multiplies potential growth by competition as based on local density, local DBH dominance and local mean neighbour distance. Local density is expressed through stand density index (SDI) (Reineke 1933; Pretzsch and Biber 2010). While potential growth was taken from a quantile regression over stem disk data, the parameters for competition were calibrated using individual tree plot inventory data. Therefore, growth initially was computed based on local SDI within 2.5 fold crown radius alone. In a second step, a regression was applied to both, mean neighbour distance and central tree dominance within 10 m radius as expressed by relation of DBH to the quadratic mean stem diameter of the nearest neighbour trees. When predicted growth was computed during simulation the remaining residuals were randomly drawn from a normal distribution and added after competition had been taken into account. Growth reconstruction guides DBH growth within quantiles of the DBH growth to DBH distribution based on stem disk data.
2.3 Height, crown and branch growth
Predicted tree height depends on tree DBH as controlled by stand biological age. Within the current model the relation was separately parameterised for each planting density. In the basic version it was considered as independent on early stand density. Reconstructed height is most simply the setup height divided by setup age. Crown shape is built of convex hulls of circular cross‑section (cylindric shadow crown and paraboloid light crown). Crown size and base height are computed via allometric relation from stem size. A whorl is generated and appended to the top of stem each time tree height was computed. It has six equal sized branches at regular radial position that originate from the stem vertical axis at identical height and vertical angle. The angle of the branch to the stem axis is close to 90 degrees within the part of the stem that is sawn to logs. Branch diameter is determined by distance of branch origin to crown mantle and an empirical regression between diameter and length. It is computed as long as the whorl is surrounded by the crown and is kept constant at its last computed value if the whorl position is below crown base. Hence, all branches of a whorl are equal in length and diameter and the size of each is inferred from the same idealised circular crown cross section based on a regression through measured data. While the process of branch mortality within the live crown part is not explicitly described, it is represented by its effect on the average branch size at a vertical position. Below the allometrically calculated crown base any branch is assumed to be dead. The following sections explain the algorithms in detail. Table 1 and Table 2 associate parameter values and parameterisation sample sizes to each equation.
| Table 1. Equations of DBH growth given with parameterisation sample size and parameter values. View in new window/tab. |
| Table 2. Equations of tree height, crown shape, branch size and board strength given with parameterisation sample size and parameter values. View in new window/tab. |
2.4 DBH growth details
The equation used for potential growth is the Hugershoff growth function (Hugershoff 1936) that is commonly used to describe the relation between diameter and growth in annual ring data analysis. It is given by Eq. 1:
![]()
where pq is a q-quantile (%) at a given diameter d (equation by Hugershoff 1936), and a10 to a12 are parameters (a0 to a2 in Table 1). Within the scope of this work it was adapted to DBH growth by DBH pairs from stem disks via a 95% quantile regression. Growth prediction is based on the 95% quantile that is reduced by a competition coefficient of local density, neighbour distance and dominance as shown in Eq. 2:
![]()
where Δd(d) is growth at diameter d, S is SDI (Pretzsch and Biber 2010; Reineke 1933), ![]() is mean distance of nearest neighbours,
is mean distance of nearest neighbours, ![]() is the quadratic mean stem diameter of nearest neighbours [cm] and a20 to a24 are parameters (a0 to a4 in Table 1). Nearest neighbour range is within a radius of 10 m around the central tree.
is the quadratic mean stem diameter of nearest neighbours [cm] and a20 to a24 are parameters (a0 to a4 in Table 1). Nearest neighbour range is within a radius of 10 m around the central tree.
During reconstruction the model uses a reduced set of equations, as outlined in the following. Crown closure marks the onset of competition in the early phase of stand development. It is defined as mechanical contact between crown bases and is based on planting pattern as well as an assumed crown diameter to DBH ratio. As the course of competition in the past is not known, even competition determined DBH growth is immediately based on the Hugershoff equation and computed from additional quantiles defined by the same parameterisation data set as potential growth in prediction. Before crown closure it follows a quantile regression of level 50%. After crown closure it proceeds between quantiles of growth (pq, Eq. 1), as illustrated by Fig. 2. In detail it is based on coarse diameter approximations summing up pq over the number of time steps from 1 to n, where n corresponds to the start year of growth prediction (t0). The resulting diameter approximations will be named ![]() in the following, e.g.
in the following, e.g. ![]() for estimation from the 50% quantile. The estimated Δd(d) is controlled by a weight α as shown in Eq. 3:
for estimation from the 50% quantile. The estimated Δd(d) is controlled by a weight α as shown in Eq. 3:
![]()
where ![]() and
and ![]() define a growth corridor as either
define a growth corridor as either
![]()
or
![]()
and weight α is defined as

Thus, Fig. 2 would correspond to a case where Eq. 5 was applied and α was at around 0.2. A final reconstruction step stretches or shrinks each DBH increment by identical factor, i.e. the ratio of measured diameter at simulation start to diameter resulting from the reconstructed increments of Eq. 3.
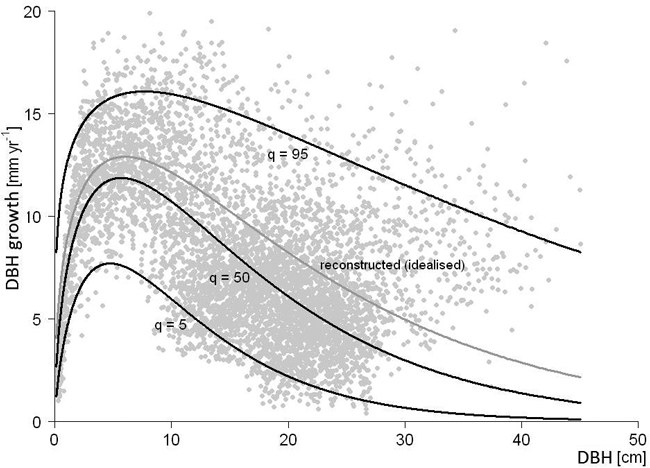
Fig. 2. Exemplary DBH growth reconstruction inferred from a first inventory DBH larger than the one resulting from the corresponding time integral over the 50% quantile; reconstructed growth is drawn in grey (idealised as 75% quantile); guiding quantiles q are drawn in black (5%, 50% and 95%).
2.5 Height, crown and branch growth details
Tree height in prediction was computed from DBH via the Michailov stand height curve (Michailoff 1943). To describe the relation of height to DBH as dependent on stand biological age, both parameters of the Michailov curve were controlled by stand quadratic mean stem diameter (QMD) via linear regression functions as given by Eq. 7:

where h is tree height, h0 is breast height (const = 1.3 m), dg is QMD, d is diameter at breast height, and a30 to a33 are parameters (a0 to a3 in Table 2). Crown allometry (Eq. 8, 9) was implemented as in the SILVA individual tree simulator (Pretzsch et al. 2002). Crown base height is defined as
![]()
where h is tree height, d is diameter at breast height, and a40 to a42 are parameters (a0 to a2 in Table 2). Crown diameter is given as
![]()
with variable definitions h, d as in Eq. 8 and parameters a50 to a54 ( a0 to a4 in Table 2). Branch diameter is coupled to crown diameter through a linear relationship:
![]()
In Eq. 10 ![]() and
and ![]() are branch diameter and length and a60 to a62 are parameters (a0 to a2 in Table 2). Time of crown closure is based on a crown diameter and estimated age at DBH = 5 cm as well as the planting pattern that determines the tree size when crowns touch. Crown base height is at zero before canopy closure. It is interpolated between canopy closure and start of the prognosis part of simulation along DBH via a curve that is initially linear and gradually transitions into the crown base height equation of SILVA (Pretzsch et al. 2002) that implies a strong and positive influence of the height to diameter ratio.
are branch diameter and length and a60 to a62 are parameters (a0 to a2 in Table 2). Time of crown closure is based on a crown diameter and estimated age at DBH = 5 cm as well as the planting pattern that determines the tree size when crowns touch. Crown base height is at zero before canopy closure. It is interpolated between canopy closure and start of the prognosis part of simulation along DBH via a curve that is initially linear and gradually transitions into the crown base height equation of SILVA (Pretzsch et al. 2002) that implies a strong and positive influence of the height to diameter ratio.
2.6 Computation of board strength from board internal structure
Within the current model version board strength computation uses cambial age to distinguish between juvenile and mature timber. Moreover it is based on two criteria for knot impact of the biggest branch in board, i.e. (1) the ratio of knot to board cross-sectional area (total knot area ratio, tKAR) of British Standard BS 4978 (2007) and (2) the DEK value from German standard DIN 4074-1 (2012) that is defined as the largest ratio among all knots of the minimal surface knot diameter to the side width of the board on which the knot is visible. Parameterisation depends on whether cambial age is more or less than 20 years. Wood density computation at board level uses Eq. 11:
![]()
where ![]() is the mean cambial age and
is the mean cambial age and ![]() is mean ring width of the board. The parameter set a70 to a73 is named a0 to a3 in Table 2. Board strength is coupled to Eq. 11 as given by Eq. 12:
is mean ring width of the board. The parameter set a70 to a73 is named a0 to a3 in Table 2. Board strength is coupled to Eq. 11 as given by Eq. 12:
![]()
where ![]() ,
, ![]() ,
, ![]() are DEK, mean cambial age and tKAR and a80 to a84 are parameters (a0 to a4 in Table 2). In the basic model version board strength merely relies on distance from pith and DEK as inner structural properties and outer grading criteria, i.e. trunk diameter:
are DEK, mean cambial age and tKAR and a80 to a84 are parameters (a0 to a4 in Table 2). In the basic model version board strength merely relies on distance from pith and DEK as inner structural properties and outer grading criteria, i.e. trunk diameter:
![]()
![]()
Variables ![]() and
and ![]() are defined as in Eq. 11 and 12 and according conventions apply to parameters an in Table 2.
are defined as in Eq. 11 and 12 and according conventions apply to parameters an in Table 2. ![]() is distance from pith at the board cross‑sectional centre and
is distance from pith at the board cross‑sectional centre and ![]() is the top diameter of the enclosing log. Individual board strength is computed by the structural properties of the board cross sectional area within the stem disk taken at median vertical position of the log under consideration. The annual rings and the branch projections from the whorl of biggest branch diameter within the log are intersected with a diameter dependent sawing pattern. While the horizontal angle between neighbouring branches within a whorl is fixed to 60°, the rotational position of each whorl is set by random drawing from an equal distribution between 0° and 360° when the inner structure of the log is constructed. A typical stem cross section from simulation of a pruned future crop tree with board positions and resulting knot interference is illustrated in Fig. 3. The crucial difference between the current model and the basic model is summarised in Table 3.
is the top diameter of the enclosing log. Individual board strength is computed by the structural properties of the board cross sectional area within the stem disk taken at median vertical position of the log under consideration. The annual rings and the branch projections from the whorl of biggest branch diameter within the log are intersected with a diameter dependent sawing pattern. While the horizontal angle between neighbouring branches within a whorl is fixed to 60°, the rotational position of each whorl is set by random drawing from an equal distribution between 0° and 360° when the inner structure of the log is constructed. A typical stem cross section from simulation of a pruned future crop tree with board positions and resulting knot interference is illustrated in Fig. 3. The crucial difference between the current model and the basic model is summarised in Table 3.
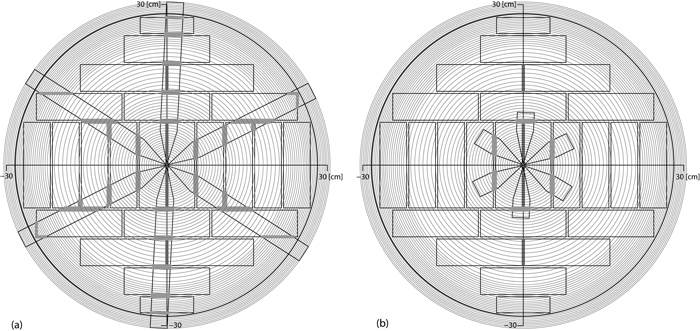
Fig. 3. Inner structure of boards resulting from application of a sawing pattern to simulated branches and annual rings from a stem 60 cm in diameter; if branches not pruned (a) and if pruned (b). View larger in new window/tab.
| Table 3. Crucial algorithm alternatives implemented in basic (B) and current (C) version. | |||||
| category of algorithm | focus of algorithm | presumed impact on board strength through | alternatives | version | |
| B | C | ||||
| evaluation of timber strength | structure to board strength | board strength | distance from pith, DEK1 | x | |
| juvenile and mature by cambial age, tKAR2 | x | ||||
| calibration of allometry | measured tree heights to parameters of height curve | dynamics of H/D ratio crown base height branch growth | generalist | x | |
| planting density specific | x | ||||
| 1 knot value from DIN 4074-1 (2012) 2 total knot area ratio from BS 4978 (2007) | |||||
2.7 Site properties
Two sites were investigated. One is named Heigenbrücken and is located in the Spessart region southeast of Frankfurt. It is marked by a deep root horizon and rather moist climatic conditions. The other is near Ansbach west of Nuremberg. It is marked by a comparatively shallow root zone due to a clay barrier layer. While to a stand age of 20 it was better in productivity, to an age of 30 it was equal and to an age of 40 it was markedly weaker. Site conditions as taken from Rais et al. (2014b) are presented in Table 4. Both sites are subject to systematic long term observation backed by regular data collection and permanent data maintenance. The individual tree inventory on all plots had started in 1989 at age 19 (setup inventory) and had been repeated at five year time step. Within the scope of this paper the sites will comprehensively be referred to as Favourable and Dry respectively.
| Table 4. Soil and climate properties of the experimental sites. | |||
| property | Ansbach shallow, dry, poor (Dry) | Heigenbrücken moist, fertile (Favourable) | |
| location | AMSL (m) | 460 | 415 |
| coordinates | 49°13´N, 10°33´E | 49°59´N, 09°22´E | |
| climate in growing season 1st of May to 30th of September | temperature (°C) 1) | 15.6 ± 0.4 | 15.3 ± 0.5 |
| precipitation (mm) 1) | 346 ± 106 | 379 ± 41 | |
| soil | type | sand (SI) | loamy sand (IS) |
| depth (cm) | 30 | > 200 | |
| 1 values based on the climate between the years 1998 and 2008 | |||
Silvicultural treatment aimed to select trees from the mature stand and preserve them for future production of high quality sawn timber. The future crop tree system (1) initially marks individuals for future preservation minimising mutual competition between them and (2) in the neighbourhood of each future crop tree removes the strongest competitors that are non-future crop trees. On the experimental sites of this work an exponentially falling guide curve defined the minimum count of live trees to maintain per unit stand area as dependent on dominant tree height (Kenk and Hradetzky 1984; Klädtke et al. 2012). Stand density was guided through control and thinning at each 3 m step along the curve that started from 2000 ha–1 at a height of 12 m, via 700 ha–1 at 21 m and 250 ha–1 at 36 m, reaching close to the asymptote of 160 ha–1 at 48 m.
2.8 Parameterisation data
Stem disk data from the site of higher and more general growth potential were preferred for parameterisation while the sample from the dryer site was still investigated for representation of dominant trees (sampling restricted to non-future crop trees). For the main focus of the analysis, exclusively growth parameters of site Favourable were used based on 60 individuals that had been felled in winter 2011 to sample stem disks and detailed data of crown size, branch length and diameter. The same trees were used for the calibration of competition and growth residuals based on the individual tree inventory data. Growth parameters of 100 trees sampled on site Dry were exclusively used for a preceding sensitivity analysis of tree growth prediction. Computation of board strength from internal board structure was parameterised including the tree samples from both sites. Measured strength had been taken from 998 centre boards and 936 side boards. Details are given in Rais et al. (2014a).
2.9 Model setup data
Simulation and evaluation then focused on the rather poor site Dry. The current model version and the basic version both were run on the same set of plots. Setup DBH was taken from the setup inventory, while tree height, crown diameter and crown base height were based on DBH via the relations found on the parameterisation site. Given by planting density per ha (in parentheses), the number of undisturbed selected plots, each 30m by 30m in size, was 6 (1000 ha–1), 5 (2000 ha–1), 3 (4000 ha–1). Table 5 presents the corresponding stand properties at simulation start.
| Table 5. Stand properties in simulation setup for the evaluation of model versions; stand characteristics from survey 1989. | ||||||
| stand property | planting density (ha–1) | |||||
| Heigenbrücken (Favourable) | Ansbach (Dry) | |||||
| 1000 | 2000 | 4000 | 1000 | 2000 | 4000 | |
| QMD (cm) | 15 | 14 | 12 | 17 | 14 | 13 |
| absolute number of trees | 373 | 1286 | 1094 | 497 | 829 | 579 |
| absolute number of future crop trees | 86 | 155 | 108 | 84 | 70 | 44 |
| total area (ha) | 0.45 | 0.81 | 0.45 | 0.54 | 0.45 | 0.27 |
| number of stems (ha–1) | 829 | 1588 | 2431 | 920 | 1842 | 2144 |
| corresponding number of future crop trees (ha–1) | 191 | 191 | 240 | 156 | 156 | 163 |
| basal area (m² ha–1) | 15 | 24 | 25 | 20 | 27 | 26 |
2.10 Model evaluation on measured board strength
To evaluate the quality of prognosis, bending strength of boards was the criterion used. A sample of non-future crop trees of DBH > 25 cm had been taken in winter 2010/2011 (Rais et al. 2014a), i.e. given by planting density in parentheses 50 (1000 ha–1), 38 (2000 ha–1) and 16 (4000 ha–1) at site Favourable and 14 (1000 ha–1), 30 (2000 ha–1) and 16 (4000 ha–1) at site Dry. Accordingly, simulations were run from an age of 19 at setup inventory (referred to as an age of 20 for convenience) to an age of 40 (2010). As virtual sawing was time expensive, the result set of simulated felled trees was reduced to a random sample of 20 to 30 at maximum per plot, stratified by DBH after preselection by DBH > 25 cm. Simulated plots where thinned exactly as it had been recorded within the long term observation database on the individual tree level. Simulation ended with a clearcut but exclusively non future crop trees were selected for virtual sawing. Thus, the number of simulated sawn trees was reduced to around 20 in all plots. Eventually, the number of trees per planting density by site Dry and Favourable respectively was 66 of 108, 72 of 128 (1000 ha–1), 112 of 173, 85 of 105 (2000 ha–1) and 78 of 85, 50 of 52 (4000 ha–1) co-dominant and dominant non future crop trees. As no future crop trees were included, pruning had neither been applied to the real nor to the simulated trees. All simulations applied the same crosscutting to stems as it was used for the sampled trees, starting at breast height (1.3 m) with each log of length 4.1 m (Rais et al. 2014a).
2.11 Model evaluation on long term prognosis
In order to assess the long term effect of the modifications within a whole rotation period, both current version and basic version were run to a stand age of 70 and final clearcut. Thinning in that case was simulated in accordance to the guide curve. Pruning was simulated as it had occurred in the real plot at a top height of 15 m up to a maximum height of 6 m and comprised only branches below crown base and the first whorl above the base of the crown. For virtual sawing, all result trees were pooled by planting density. A sample of 20 trees at maximum, stratified by DBH, was taken from all felled trees per decade, resulting in a total of around 100 per planting density taken from roughly 600.
2.12 Result analysis
To evaluate precision and transferability of individual tree growth prediction, simulated and observed time course of quadratic mean stem diameter (QMD) and total tree volume on the 2000 ha–1 planting density plots were compared. Total volume was calculated as sum of all individual tree volumes. Individual tree volume was approximated by the Denzin formula (Graves 2013) given in Eq. 15.

where v [m3] is tree volume d [cm] is diameter at breast height (1.3 m) and h [m] is tree height. When simulation results were compared to measured data, statistical analyses of board strength by planting density were confined to boards of a cross sectional area larger or equal 50 cm2 in accordance to the sampling method that had concentrated on strong boards. They were conducted using the statistical software R (R core team 2014). Probability distributions were compared (1) visually through box plots, (2) by confidence interval of estimated median (3) the post-hoc Tukey HSD test (Miller 1981) based on the results of a preceding analysis of variance (Chambers et al. 1992). In the result section, (1), (2) and (3) will be denoted as VIS, CIM and HSD. The functions used were boxplot {graphics} with default options for the ranges shown (box marks interquartile range, IRQ), boxplot.stats {grDevices} and TukeyHSD with aov {stats}. In addition mean bias (MBE) and mean absolute bias (MABE) of board strength statistics where given and constructed by bootstrapping (Efron 1979; Davison and Hinkley 1997) to extrapolate on iteration of the whole model test. Both were computed from 1000 resamplings with laying back and their confidence intervals estimated nonparametrically by 100 resamplings of the resulting bias collection using boot {boot} from R (Davidson and Hinkley 1997; Canty and Ripley 2014). MBE and MABE were expressed as difference between simulated and measured data statistics. Criterion of significance in general was an α level of 5%. For better comparability to 40 year results, the box plot evaluations of board strength from 70 year simulations used the same restriction to minimum board cross sectional area (≥ 50 cm2).
3 Results
QMD as well as total tree volume of the 2000 ha–1 planting density plots were plausibly reproduced by the model over time of test prognosis from age 20 to 40 (Fig. 4). Moreover, the 2.5% and 97.5% quantiles of simulated DBH were close to the observed range (large dots). Similarity was high in particular if site specific parameters of potential growth had been used at site Favourable (Fig. 4 A). Diameter and volume growth over the last ten years were overestimated if the parameter set of site Favourable was applied to site Dry (Fig. 4 C).
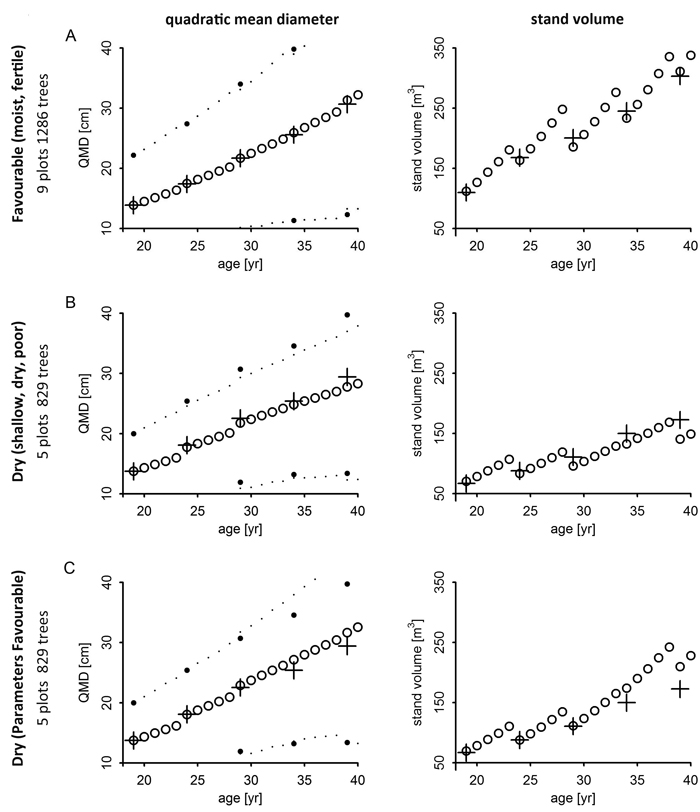
Fig. 4. QMD, DBH quantiles (2.5% and 97.5%) and total tree volume by site using site related parameterisation (rows A, B) and parameters from site Favourable on site Dry (row C); measured data mean given as +.
Centre board bending strength at age 40 and grouped by planting density had median values in the range from 20 to 35 Nmm–2 (Fig. 5, Fig. 6). Interquartile ranges of measured board strength reached from 12 to 20 Nmm–2 while the ranges computed from real board structure or simulated by the model were smaller and lay between 6 and 10 Nmm–2. At the parameterisation site (Favourable), as Fig. 5 A illustrates, measured bending strength significantly increased with initial planting density (HSD). Median strength computed on measured board structure (Fig. 5 B and Table 6, MBE) also was dependent on planting density with a significant increase (HSD). At 2000 ha–1 it deviated from the measured board bending strength by –6% to +4% and at 4000 ha–1 by –25% to –2% (CIM). Median bending strength as simulated by the current model version (Fig. 5 C and Table 6) was somewhat lower than measured (–21% to –5%) at planting densities of 1000 and 2000 ha–1 and underestimated by –28% to –12% (CIM), at a planting density of 4000 ha–1. It was similar (VIS) in the interquartile ranges to the strength data computed on real board structure. The increase of both computed and simulated board strength median with planting density was significant (HSD).
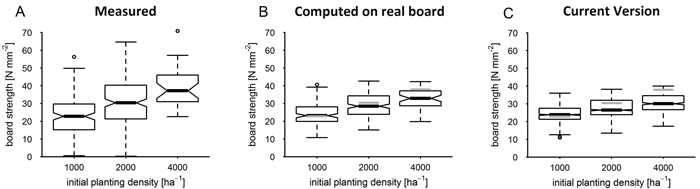
Fig. 5. Board strength at parameterisation site by planting density after 40 years as measured (A), as computed based on sample board structure (B) and as simulated by the current version; the boxplot notches correspond to the 95% confidence interval (CI) of the median; grey horizontal lines mark the median of measured data in diagrams of simulated result distributions. View larger in new window/tab.
| Table 6. Bias of real board at parameterisation site Favourable (Fav) given as CI range of bias (Nmm–1) by planting density (ha–1), top row as computed from real board (com), bottom row as simulated (sim). | |||||||||||||
| set | variable | mean | median | Q1 | Q3 | ||||||||
| 1000 | 2000 | 4000 | 1000 | 2000 | 4000 | 1000 | 2000 | 4000 | 1000 | 2000 | 4000 | ||
| Fav com | MBE | 1.13 | –1.55 | –6.96 | –0.03 | –1.63 | –4.55 | 5.08 | 2.93 | –3.94 | –1.79 | –6.12 | –8.43 |
| 0.99 | –1.71 | –1.71 | –0.25 | –1.80 | –4.82 | 4.91 | 2.67 | –4.26 | –2.05 | –6.35 | –8.78 | ||
| MABE | 1.30 | 1.74 | 6.94 | 1.34 | 1.89 | 4.81 | 5.06 | 2.95 | 4.34 | 2.22 | 6.32 | 8.80 | |
| 1.18 | 1.62 | 6.73 | 1.20 | 1.74 | 4.62 | 4.92 | 2.73 | 4.06 | 2.01 | 6.12 | 8.46 | ||
| Fav sim | MBE | 1.33 | –3.15 | –8.92 | 0.61 | –3.69 | –7.72 | 6.23 | 2.8 | –5.91 | –2.23 | –8.42 | –10.9 |
| 1.22 | –3.27 | –9.1 | 0.39 | –3.86 | –7.95 | 6.06 | 2.57 | –6.24 | –2.36 | –8.59 | –11.2 | ||
| MABE | 1.43 | 3.27 | 9.11 | 1.50 | 3.83 | 7.96 | 6.20 | 2.83 | 6.23 | 2.38 | 8.58 | 11.2 | |
| 1.30 | 3.15 | 8.92 | 1.38 | 3.69 | 7.76 | 6.08 | 2.61 | 5.91 | 2.22 | 8.41 | 10.9 | ||
At the test site (Dry) real board strength (Fig. 6 A) showed a considerable and significant shift from 1000 to 2000 ha–1 (CIM) but only a trend of increase between 2000 and 4000 ha–1 as indicated by a difference in distribution skewness (VIS). The median of simulated bending strength was close to the measured one at 1000 and 4000 ha–1 (Fig. 6 B) but underestimated the one at 2000 ha–1 planting density (VIS, Table 7). As compared to median measured bending strength it had a more linear relation to the early stand density (VIS, CIM), similar to the measured and simulated strength median at the site of parameterisation. In contrast, the basic model version (Fig. 6 C, Basic Version) significantly underestimated board strength at 2000 and 4000 ha–1. Its median board bending strength showed no significant increase with initial planting density (VIS). Moreover, it was marked by a notably more underestimated variability.
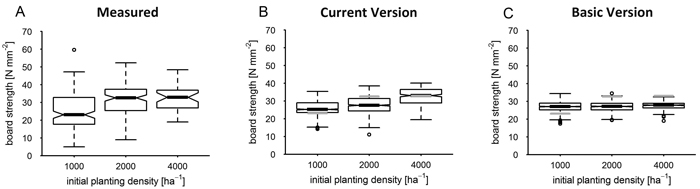
Fig. 6. Board strength by planting density at site Dry after 40 years as measured and as simulated by current and basic version. Grey lines mark the median of measured data; the boxplot notches correspond to the 95% confidence interval (CI) of the median; grey horizontal lines mark the median of measured data in diagrams of simulated result distributions. View larger in new window/tab.
| Table 7. Bias of modelled board strength as CI range of bias (Nmm–1) by planting density (ha–1) at site Dry. | |||||||||||||
| set | variable | mean | median | Q1 | Q3 | ||||||||
| 1000 | 2000 | 4000 | 1000 | 2000 | 4000 | 1000 | 2000 | 4000 | 1000 | 2000 | 4000 | ||
| Dry sim | MBE | 1.45 | –4.77 | –0.35 | 2.21 | –4.84 | 0.43 | 6.1 | –1.56 | 1.55 | –3.9 | –6.23 | –0.51 |
| 1.34 | –4.89 | –0.51 | 1.95 | –5 | 0.23 | 6 | –1.7 | 1.35 | –4.05 | –6.4 | –0.78 | ||
| MABE | 1.54 | 4.89 | 1.08 | 2.53 | 4.99 | 1.3 | 6.1 | 1.86 | 1.98 | 4.03 | 6.39 | 1.3 | |
| 1.41 | 4.74 | 0.98 | 2.31 | 4.85 | 1.16 | 6 | 1.69 | 1.83 | 3.9 | 6.25 | 1.44 | ||
Cambial age that is a predictor of bending strength in the current model increased in simulated as well as in measured boards and by a similar amount along planting density (CIM). Distance from pith that had originally been used to differentiate between juvenile and mature wood underestimated the age of boards from the 4000 ha–1 plots by more than 14 ± 4% both in measured and simulated data. Radial board position did only to a part reflect the variability of board cambial age as could be shown by its unprecise prediction of age with a relative residual standard deviation as large as 20%. While in the current model crown base height at simulation start in line with height to diameter ratio significantly and realistically increased along planting density from 3 m (1000 ha–1) to 6 m (4000 ha–1), in the earlier model approach it markedly decreased in median from 7 m to 3.5 m (site Dry, representative plots 9, 8, 3). If height to diameter allometry had been calibrated as dependent on planting density, the main underlying variable that is mean tree height like in reality was around 12 m and suggested a slight increase of around 1 m from the lowest to the highest planting density. In the basic model it ranged from 17 m down to 12 m. Concomitantly, the mean biggest branch diameter from each of the two bottom logs (height to 9.5 m) decreased along planting density in the current model (41.6 ± 0.3 mm down to 31 ± 0.6 mm) as well as in reality (36.8 ± 0.9 mm down to (27.9 ± 1.5 mm), while in the earlier basic approach the slope of the relation was slightly positive (31.9 ± 0.4 mm to 34 ± 0.6 mm). Hence, the realistic dependence of board bending strength on planting density in the current model was related to a corresponding sensitivity of underlying board, stem and crown structure key properties.
Over a whole rotation period, the board strength distribution of all trees removed, including the final clearcut, still differed in median and width between current version and basic version if compared at equal planting density (VIS, CIM, Fig. 7). The positive trend from smallest to highest initial density in the result of the current model version was retained (CIM). Board strength resulting from the basic model version is similarly unaffected by the planting density at plot foundation as at age 40 and has a remarkably smaller interquartile range (VIS).
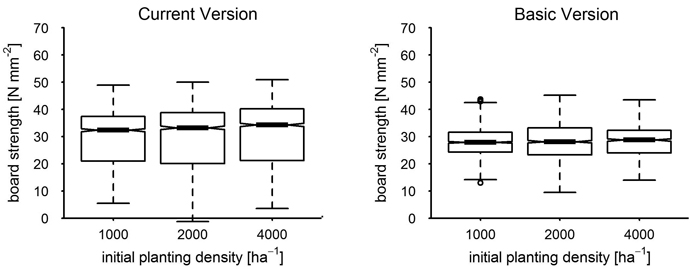
Fig. 7. Board strength by planting density of the current version versus basic version at age 70; the boxplot notches correspond to the 95% confidence interval (CI) of the median.
4 Discussion
As demonstrated by detailed model comparison, sensitivity of centre board bending strength to planting density was based on selective and plausible refinement of crucial model aspects. The final drop and bias of simulated growth in the course of test prognosis at site Dry was likely due to some underestimation of potential QMD increase and determined by an underrepresentation of dominant trees within the stem disk sample. If site dependence of potential growth is accounted for, the model toolbox may be applied as an extensible streamlined simulator to support the expert in estimating the trend of management effects. Variability as currently predicted by the model was lower as compared to measured data. Hence, at the current state of development it is recommendable (1) to discuss the sensitivity of scenario evaluations to an estimated bias of variability or (2) to parameterise a random generator for residual deviation and to add its result to strength on the individual board level.
At the site of parameterisation, measured board strength significantly increased with initial planting density, an effect that could be reproduced by the model due to a refined sensitivity to cambial age and crown structure. The lower real growth potential and a resulting higher cambial age of sample boards at site Dry were a likely determinant of underestimated strength at intermediate planting density and overemphasis of the linearity within the strength to density relation. As potential growth data at the dryer site were still to be verified, the effect has yet to be proven.
The improvement of board structure to bending strength computation had a major influence on board strength median and variability even after a whole rotation period. There is considerable potential in further refinement of structure to strength translation that lead to a markedly similar and underestimated data spread when it was both applied to real and simulated boards.
4.1 Extension of the structure to board strength computation had a strong effect
The importance of a board specific strength calculation is likely due to the fact that for softwood species the majority of the total variation of strength is attributed to differences between boards within a log (Moore et al. 2013). In detail, a significant positive effect on the quality of strength prediction from stem and board structure may certainly be attributed to the consideration of cambial age that is a major determinant of board strength in conifers (e.g. DeBell et al. 2004; Torquato et al. 2014). This likely holds also true for deciduous tree species, due to a general effect of wind on bending and fibre direction within the stems of young trees.
However, one likely improvement within the current version as compared to the basic one also was to take into account the relative area covered by the branch within the cross sectional area of the board. The used knot value tKAR (“total knot area ratio”) is defined by the British Standard BS 4978 (2007) and is one of the most important visual knot parameters in sawn timber strength grading (Stapel and Van de Kuilen 2014). An analysis of the individual factors which are most relevant for strength prediction quality might be interesting within the scope of a separate study.
The approaches tried within this work were restricted to macroscopical wood and board properties. They did not include effects on the microscopic scale, e.g. the impact of wind pressure on fibre direction. Forest management controls stand density through planting pattern or thinning. Hence, it will likely take influence on the aerodynamic regime, on stem bending and fibre direction and eventually on bending strength of sawn timber. An interesting question of further model analysis could be, whether there is significant improvement, if bending effects are taken into account, e.g. by including results from fibre direction modelling (Lang and Kaliske 2013).
4.2 Density related H/D allometry is an important indicator of early juvenile competition
Control of tree height parameterisation through planting density strongly improved the prediction of board bending strength. It still had a remarkable influence over a whole rotation period, even if some of the effect of generalised height parameterisation in the basic model was attenuated due to the convergence of relative crown base height in the long term. Reconstruction of early tree development exclusively based on the planting pattern and the state of the already established stand is an essential component of wood quality simulation: As exemplarily measured tree heights and crown base heights at the age of prognosis start indicate, stand density during the early phase of stand development has slightly promoted tree height and considerably suppressed diameter growth as also found by Saha et al. (2012). When a common stand height curve calibration was used for all plots without taking into account initial planting density as a grouping criterion, trees on plots of smaller planting density and larger QMD were falsely assigned a larger height than on plots of higher initial density. The height to diameter ratio is an obvious criterion of preceding early neighbour competition, especially in the juvenile phase of stands (Pretzsch and Rais, submitted), and also was applied to crown dimensions within the scope of this study. Hence, decreasing stand density in the basic model promoted crown base height, reduced branch diameters and raised board strength to an unrealistic level. When stand height curve parameterisation was grouped by planting density, the clearly furthering effect of planting density on crown base height was correctly reflected, as the crown model taken from Pretzsch et al. (2002) is sensitive to early competition via the H to D ratio. The crown dimension model goes in line with e.g. results given by Mäkinen et al. (1999) that the H to D ratio is among the best indicators for branch increment. It stands to reason that the resulting model improvement to a large part was due to the concomitant effect on branch diameter development during the juvenile phase.
4.3 Crown gross shape is generally crucial, age dependence recommendable
Within the scope of this study the conifer crown had the shape of an elliptical paraboloid above the height of maximum crown diameter. While Pretzsch et al. (2002) recommend a reverse truncated cone for the shadow part of the crown, the authors had favoured the concept of a cylindrical crown base, as it had represented the measured branch length at age 40 somewhat more realistically. In addition, the simulation with a truncated conical crown base had not produced a more realistic branch diameter profile during simulation. Hann (1999) presents a model for the crown hull shape that reflects the social status within a stand not only by crown height and diameter but also by curvature of the light crown longitudinal section. For dominant trees it confirms the concept of a paraboloid light crown and a cylindrical shadow crown whereas suppressed trees are rather represented by a cone. The approach could be applied to further improve the simulation of crown development during the juvenile phase. Within this work a cone crown shape was used in early model prototypes for mature trees as well as it is a convenient gross estimator of branch length. The simple cone is infeasible to represent crown volume (Rautiainen et al. 2008). Consequently it had entailed a notably incorrect prognosis of branch diameter at a given vertical position along the stem and should be strictly avoided for mature stands.
4.4 Additional approaches to branch diameter computation are likely candidates for analysis
Ellsworth and Reich (1993) prove the steep and negative vertical gradient of photosynthetic capacity within the crown that follows the decrease of canopy transmittance in downward direction. In accordance, crown base height that is an indicator of light attenuation within the canopy was used to infer branch size from vertical position via a convex crown hull. Colin and Houllier (1992) based prediction of whorl and branch characteristics by vertical position on the height of the first living branch as well as the crown base height. Houllier et al. (1995) integrated the alternative approach to crown shape into a growth prediction model. They estimated the required crown base properties from the maximum base diameter that would be possible for cone shaped crowns and an empirical survival time of branches below base height. Moreover, they included variability of branch angle, branch size and branch count per whorl into model prediction. Weiskittel et al. (2006) have shown that maximum branch size is the most responsive variable to silvicultural regime among a range of Douglas fir plantations (5 to 65 years old). Hein et al. (2007) successfully predict the effect of planting density in a Norway spruce stand (Picea abies [L.] Karst.) with respect to dead branches within the living crown and branch number as well as branch differentiation on the whorl level. Hence, additional variability of board strength prediction can likely be explained and modelled through a higher differentiation of branch and knot properties. Ikonen et al. (2009) applied a mechanistical description of shoot growth based on light interception (Kellomäki and Strandman 1995; Kellomäki et al. 1999) to predict future board quality. It might also be used to extend our model e.g. to cover the early phase of stand development and to describe the dynamics of more complex deciduous tree crown shapes.
4.5 The early growth phase might be replaced by simulation starting in the juvenile phase
The assumption of this work that inter tree contact at the crown base edge marked the onset of crown shift was taken from a proven concept of early stand development simulation outlined by Valentine et al. (2013) for Loblolly Pine (Pinus taeda L.). A more detailed approach to crown and branch reconstruction was presented by Seifert (2003) who constructed crown shape at simulation start based on competition on the level of vertical layers, each 30 cm high and interpolated the crown hull back to an assumed state of symmetrical shape before canopy closure. If prognosis would have to be based on planting pattern and site alone, reconstruction would be omitted. An intriguing challenge would be to simulate stand dynamics at a developmental stage that has rarely been described by observation based algorithms. High emphasis was to be put on self-thinning (review by Reynolds and Ford 2005) and mortality in young stands. Crown shape dynamics as described by Seifert (2003) might possibly be used to create a variety of possible stand and crown evolution paths in the course of crown closure supported by stochasticity.
4.6 The modelling toolbox is open to coupling with physiological biomass growth models
The description of growth dynamics, competition and allometry within this work was based on the external observation of individual trees and is insensitive to driving force variability on an intra-annual time scale. In contrast physiological models are sensitive to weather events and may take into account the coupling of belowground and aboveground competition as controlled by water and nitrogen limitation (originally by Schwinning and Weiner 1998). Mäkinen et al. (2001) have shown the influence of nutrient supply on crown characteristics and branch count. Within environmental change studies, there is a strong requirement for physiological models that predict base variables of log grading (e.g. Deckmyn et al. 2008; 2009). Due to a modular object oriented architecture the experimental system that has been presented in this work may be readily coupled with any physiological model, that exports an interface to transport gross cohort volume growth or lists of individual trees on annual time step (e.g. via SOAP, Mitra and Lafon 2007).
5 Conclusion
The wood quality toolbox provides model extensions for stem structure development and board strength prognosis that may even be coupled to the most abstract individual tree representation with a branchless crown of convex hull shape. It realistically predicted the shift of centre board bending strength between stands of minimum and maximum initial planting density, due to the explanation of bending strength by cambial age and knot area ratio and their relation to indicators of early competition. The toolbox is a comprehensive development and testing platform for generalist and portable board strength algorithms that are compatible to growth simulators with a purely external tree perception as well as more mechanistic approaches.
Height to diameter allometry is retention of early competition. Hence, if branch size computation implies stem height to diameter ratio and prognosis is based on data of a mature stand, it is recommendable to couple allometry to planting density. The bending strength and crown base height algorithms applied both address basic properties of the wood quality model and mark a threshold of usability. The suggested modelling system is based on the commonly used statistical R package and is technically convenient to pass within the research community. In its current state it may be applied to assist the expert in trend prediction of density and pruning related stand management options. High potential lies in a further explanation of board strength variability through additional stem structure properties and branch size variation based on theory of existing related work.
Acknowledgement
We thank the Bavarian State Ministry for Nutrition, Agriculture, and Forestry for permanent support of the project W 07 “Long-term experimental plots for forest growth and yield research” and for funding the project X36 ”Relationship between spacing and wood quality of Douglas-fir in Bavaria“. Thanks are also due to Prof. Dr. Thomas Seifert for critical discussion of the evaluation concept, and Dr. Rüdiger Grote for pre-reviewing the paper.
References
British Standards Institution (2011). BS 4978 2007 + A1: 2011. Visual Strength Grading of Softwood. BSI, London. ISBN 978-0-580-73681-0. 22 p.
Canty A., Ripley B. (2014). boot: Bootstrap R (S-Plus) functions. R package version 1.3-11. https://cran.r-project.org/web/packages/boot/index.html.
Colin F., Houllier F. (1992). Branchiness of Norway spruce in northeastern France: predicting the main crown characteristics from usual tree measurements. Annales des Sciences Forestières 49: 511–538. http://dx.doi.org/10.1051/forest:19910606.
Davison A.C., Hinkley D.V. (1997). Bootstrap methods and their applications. Cambridge University Press, Cambridge. ISBN 0-521-57391-2.
DeBell D.S., Singleton R., Gartner B.L., Marshall D.D. (2004). Wood density of young-growth western hemlock: relation to ring age, radial growth, stand density, and site quality. Canadian Journal of Forest Research 34: 2433–2442. http://dx.doi.org/10.1139/x04-123.
Deckmyn G., Verbeeck H., Op de Beeck M., Vansteenkiste D., Steppe K., Ceulemans R. (2008). ANAFORE: a stand-scale process-based forest model that includes wood tissue development and labile carbon storage in trees. Ecological Modelling 215: 345–368. http://dx.doi.org/10.1139/x04-123.
Deckmyn G., Mali B., Kraigher H. (2009). Using the process-based stand model ANAFORE including Bayesian optimisation to predict wood quality and quantity and their uncertainty in Slovenian beech. Silva Fennica 43(3): 523–534. http://dx.doi.org/10.14214/sf.204.
Di Lucca C.M. (1999). TASS/SYLVER/TIPSY: systems for predicting the impact of silvicultural practices on yield, lumber value, economic return and other benefits. In: Bamsey C.R. (ed.). Stand density management conference: using the planning tools. November 23–24, 1998, Clear Lake Ltd., Edmonton, AB. p. 7–16.
DIN (2012). DIN 4074-1. Sortierung von Holz nach der Tragfähigkeit – Teil 1: Nadelschnittholz. [Strength grading of wood – part 1: coniferous sawn timber]. Beuth Verlag, Berlin. [In German].
Donato D.C., Campbell J.L., Franklin J.F. (2012). Multiple successional pathways and precocity in forest development: can some forests be born complex? In: Palmer M. (ed.). Journal of Vegetation Science 23: 576–584. http://dx.doi.org/10.1111/j.1654-1103.2011.01362.x.
Efron B. (1979). Bootstrap methods: another look at the jackknife. The Annals of Statistics 1979: 1–26. http://dx.doi.org/10.1214/aos/1176344552.
Ellsworth D., Reich P. (1993). Canopy structure and vertical patterns of photosynthesis and related leaf traits in a deciduous forest. Oecologia 96: 169–178. http://dx.doi.org/10.1007/BF00317729.
Gort J., Zubizarreta-Gerendiain A., Peltola H., Kilpeläinen A., Pulkkinen P., Jaatinen R., Kellomäki S. (2010). Differences in branch characteristics of Scots pine (Pinus sylvestris L.) genetic entries grown at different spacing. Annals of Forest Science 67(7): 705. http://dx.doi.org/10.1051/forest/2010030.
Graves H.S. (2013). Forest Mensuration. In: Forgotten Books, London (Original work published 1906). p. 154.
Hann D. (1999). An adjustable predictor of crown profile for stand-grown Douglas-fir trees. Forest Science 45: 217–225.
Hann D.W., Hester A.S., Olsen C.L. (1997). ORGANON user’s manual, version 6.0. Department of Forest Resources, Oregon State University, Corvalli.
Hein S., Mäkinen H., Yue C., Kohnle U. (2007). Modelling branch characteristics of Norway spruce from wide spacings in Germany. Forest Ecology and Management 242: 155–164. http://dx.doi.org/10.1016/j.foreco.2007.01.014.
Houllier F., Leban J., Colin F. (1995). Linking growth modelling to timber quality assessment for Norway spruce. Forest Ecology and Management 74: 91–102. http://dx.doi.org/10.1016/0378-1127(94)03510-4.
Hugershoff R. (1936). Die mathematischen Hilfsmittel des Kulturingenieurs und Biologen. II. Teil: Herleitung von gesetzmäßigen Zusammenhängen. [The mathematical facilities of the forestry engineer and biologist. II. Part: derivation of regular principles]. Manuskriptdruck, Dresden. [In German].
Ikonen V., Kellomäki S., Peltola H. (2009). Sawn timber properties of Scots pine as affected by initial stand density, thinning and pruning: a simulation based approach. Silva Fennica 43(3): 411–431. http://dx.doi.org/ 10.14214/sf.197.
Kellomäki S., Strandman H. (1995). A model for the structural growth of young Scots pine crowns based on light interception by shoots. Ecological Modelling 80: 237–250. http://dx.doi.org/ 10.1016/0304-3800(94)00065-P.
Kellomäki S., Ikonen V., Peltola H., Kolström T. (1999). Modelling the structural growth of Scots pine with implications for wood quality. Ecological Modelling 122: 117–134. http://dx.doi.org/10.1016/S0304-3800(99)00086-1.
Kenk G., Hradetzky J. (1984). Behandlung und Wachstum der Douglasien in Baden-Württemberg. [Management and growth of douglas fir in Baden-Württemberg]. Mitteilungen der Forstlichen Versuchs und- Forschungsanstalt Baden-Württemberg 113. 89 p. [In German].
Klädtke J., Kohnle U., Kublin E., Ehring A., Pretzsch H., Uhl E., Spellmann H., Weller A. (2012). Wachstum und Wertleistung der Douglasie in Abhängigkeit von der Standraumgestaltung. [Growth and value production of Douglas-fir under varying stand densities]. Schweizerische Zeitschrift für Forstwesen 163(3): 96–104. [In German]. http://dx.doi.org/10.3188/szf.2012.0096. .
Maguire D., Kershaw J., Hann D. (1991). Predicting the effects of silvicultural regime on branch size and crown wood core in Douglas-fir. Forest Science 37(5): 1409–1428.
Mäkelä A., Landsberg J., Ek A.R., Burk T.E., Ter-Mikaelian M., Agren G.I., Oliver C.D., Puttonen P. (2000). Process-based models for forest ecosystem management: current state of the art and challenges for practical implementation. Tree Physiology 20: 289–298. http://dx.doi.org/10.1093/treephys/20.5-6.289.
Mäkelä A., Grace J., Deckmyn G., Kantola A., Kint V. (2010). Simulating wood quality in forest management models. Forest Systems 19: 48–68. http://dx.doi.org/10.5424/fs/201019S-9314.
Mäkinen H., Saranpää P., Linder S. (2001). Effect of nutrient optimization on branch characteristics in Picea abies (L.) Karst. Scandinavian Journal of Forest Research 16: 354–362. http://dx.doi.org/10.1080/02827580120345.
Meredieu C., Dreyfus P., Saint-André L., Leban J.-M. (1999). A chain of models from tree growth to properties of boards for Pinus nigra ssp. Laricio Arn.: simulation using CAPSIS and WINEpifn. In: Nepveu G. (ed.). Third Workshop “Connection between Silviculture and Wood Quality through Modelling Approaches and Simulation Software”. La Londe-Les-Maures, France, September 5–12. IUFRO WP S5.01-04. Proceedings. p. 505–513.
Michailoff I. (1943). Zahlenmäßiges Verfahren für die Ausführung der Bestandeshöhenkurven. [Numerical algorithm for the implementation of stand height curves]. Forstw. Cbl. u. Thar. Jahrb. 6: 273–279. [In German].
Mitchell K.J. (1988). SYLVER, modelling the impact of silviculture on yield, lumber value, and economic return. Forest Chronicle 64: 127–131. http://dx.doi.org/10.5558/tfc64127b1-2.
Mitra N., Lafon Y. (2007). SOAP version 1.2 Part 0: primer (second edition) – W3C recommendation. http://www.w3.org/TR/2007/REC-soap12-part0-20070427/. [Cited 4 Feb. 2015].
Moore J.R., Lyon A.J., Searles G.J., Lehneke S.A., Ridley-Ellis D.J. (2013). Within- and between-stand variation in selected properties of Sitka spruce sawn timber in the UK: implications for segregation and grade recovery. Annals of Forest Science 70: 403–415. http://dx.doi.org/10.1007/s13595-013-0275-y.
Muth C.C., Bazzaz F.A. (2003). Tree canopy displacement and neighborhood interactions. Canadian Journal of Forest Research 33: 1323–1330. http://dx.doi.org/10.1139/x03-045.
Pretzsch H., Biber P. (2010). Size-symmetric versus size-asymmetric competition and growth partitioning among trees in forest stands along an ecological gradient in Central Europe. Canadian Journal of Forest Research 40: 370–384. http://dx.doi.org/ 10.1139/X09-195.
Pretzsch H., Rais A. (submitted). Wood quality in complex forests versus even-aged monocultures - review, conclusions, and perspective.
Pretzsch H., Biber P., Ďurský J. (2002). The single tree-based stand simulator SILVA: construction, application and evaluation. Forest Ecology and Management 162, 3–21. http://dx.doi.org/10.1016/S0378-1127(02)00047-6.
Pretzsch H., Grote R., Reineking B., Rötzer T., Seifert S. (2008). Models for forest ecosystem management: a European perspective. Annals of Botany 101: 1065–87. http://dx.doi.org/10.1093/aob/mcm246.
Rais A., Poschenrieder W., Pretzsch H., van de Kuilen J.-W.G. (2014a). Influence of initial plant density on sawn timber properties for Douglas-fir (Pseudotsuga menziesii (Mirb.) Franco). Annals of Forest Science 71: 617–626. http://dx.doi.org/10.1007/s13595-014-0362-8.
Rais A., van de Kuilen J.-W.G., Pretzsch H. (2014b). Growth reaction patterns of tree height, diameter, and volume of Douglas-fir (Pseudotsuga menziesii [Mirb.] Franco) under acute drought stress in Southern Germany. European Journal of Forest Research 133(6): 1043–1056. http://dx.doi.org/10.1007/s10342-014-0821-7.
Rautiainen M., Mõttus M., Stenberg P., Ervasti S. (2008). Crown envelope shape measurements and models. Silva Fennica 42(1): 19–33. http://dx.doi.org/10.14214/sf.261.
R Core Team (2014). R: a language and environment for statistical computing. R Foundation for Statitstical Computing, Vienna, Austria. http://www.R-project.org/.
Reineke L.H. (1933). Perfecting a stand-density index for even-aged forests. Journal of Agricultural Research 46: 627–638. http://dx.doi.org/10.1111/j.1365-2745.2005.00976.x.
Reynolds J.H., Ford E.D. (2005). Improving competition representation in theoretical models of self-thinning: a critical review. Journal of Ecology 93: 362–372. http://dx.doi.org/10.1111/j.1365-2745.2005.00976.x.
Ritchie M.W., Hamann J.D. (2007). Individual-tree height-, diameter- and crown-width increment equations for young Douglas-fir plantations. New Forests 35: 173–186. http://dx.doi.org/10.1007/s11056-007-9070-7.
Rouvinen S., Kuuluvainen T. 1997: Structure and asymmetry of tree crowns in relation to local competition in a natural mature Scots pine forest. Canadian Journal of Forest Research 27 (6): 890–902. http://dx.doi.org/10.1139/x97-012.
Saha S., Kuehne C., Kohnle U., Brang P., Ehring A., Geisel J., Leder B., Muth M., Petersen R., Peter J., Ruhm W., Bauhus J. (2012). Growth and quality of young oaks (Quercus robur and Quercus petraea) grown in cluster plantings in central Europe: a weighted meta-analysis. Forest Ecology and Management 283: 106–118. http://dx.doi.org/10.1016/j.foreco.2012.07.021.
Schwinning S., Weiner J. (1998). Mechanisms determining the degree of size asymmetry in competition among plants. Oecologia 113(4): 447–455. http://dx.doi.org/10.1007/s004420050397.
Seifert T. (2003). Integration von Holzqualität und Holzsortierung in behandlungssensitive Waldwachstumsmodelle. [Integration of wood quality and wood grading into management sensitive forest growth models]. Doctoral dissertation, Technische Universität München, Universitätsbibliothek. [In German].
Stapel P., Van De Kuilen J.W.G. (2014). Efficiency of visual strength grading of timber with respect to origin, species, cross section, and grading rules: A critical evaluation of the common standards. Holzforschung 68: 203–216. http://dx.doi.org/10.1515/hf-2013-0042.
Thorpe H.C., Astrup R., Trowbridge A., Coates K.D. (2010). Competition and tree crowns: a neighborhood analysis of three boreal tree species. Forest Ecology and Management 259: 1586–1596. http://dx.doi.org/10.1016/j.foreco.2010.01.035.
Todoroki C.L., Monserud R., Parry, D (2005). Predicting internal lumber grade from log surface knots: actual and simulated results. Forest Products Journal 55: 38–47.
Torquato L.P., Auty D., Hernández R.E., Duchesne I., Pothier D., Achim A. (2014). Black spruce trees from fire-origin stands have higher wood mechanical properties than those from older, irregular stands. Canadian Journal of Forest Research 44: 118–127. http://dx.doi.org/10.1139/cjfr-2013-0164.
Valentine H.T., Amateis R.L., Gove J.H., Mäkelä A. (2013). Crown-rise and crown-length dynamics: application to loblolly pine. Forestry 86: 371–375. http://dx.doi.org/10.1093/forestry/cpt007.
Weiskittel A.R., Maguire D., Monserud R., Rose R., Turnblom E.C. (2006). Intensive management influence on Douglas fir stem form, branch characteristics, and simulated product recovery. New Zealand Journal of Forest Science 36: 293–312.
Weiskittel A.R., Maguire D.A., Monserud R.A., Johnson G.P. (2010). A hybrid model for intensively managed Douglas-fir plantations in the Pacific Northwest, USA. European Journal of Forest Research 129: 325–338. http://dx.doi.org/10.1007/s10342-009-0339-6.
Total of 56 references.
Send to email
