Cedric A. Goussanou  ,
Sabin Guendehou,
Achille E. Assogbadjo,
Maguette Kaire,
Brice Sinsin,
Aida Cuni-Sanchez
,
Sabin Guendehou,
Achille E. Assogbadjo,
Maguette Kaire,
Brice Sinsin,
Aida Cuni-Sanchez
Specific and generic stem biomass and volume models of tree species in a West African tropical semi-deciduous forest
Goussanou C. A., Guendehou S., Assogbadjo A. E., Kaire M., Sinsin B., Cuni-Sanchez A. (2016). Specific and generic stem biomass and volume models of tree species in a West African tropical semi-deciduous forest. Silva Fennica vol. 50 no. 2 article id 1474. https://doi.org/10.14214/sf.1474
Highlights
- Non-destructive sampling approach applied to derive ground truth observations and generate robust basic wood densities
- Species-specific and generic allometric equations
- Specific equations have better predictive capabilities than generic models.
Abstract
The quantification of the contribution of tropical forests to global carbon stocks and climate change mitigation requires availability of data and tools such as allometric equations. This study made available volume and biomass models for eighteen tree species in a semi-deciduous tropical forest in West Africa. Generic models were also developed for the forest ecosystem, and basic wood density determined for the tree species. Non-destructive sampling approach was carried out on five hundred and one sample trees to analyse stem volume and biomass. From the modelling of volume and biomass as functions of diameter at breast height (Dbh) and stem height, logarithmic models had better predictive capabilities. The model validation showed that in absence of data on height, models using Dbh only as variable was an alternative. The comparison of basic wood densities to data published in literature enabled to conclude that the non-destructive sampling was a good approach to determining reliable basic wood density. The comparative analysis of species-specific models in this study with selected generic models for tropical forests indicated low probability to identify effective generic models with good predictive ability for biomass. Given tree species richness of tropical forests, the study demonstrated the hypothesis that species-specific models are preferred to generic models, and concluded that further research should be oriented towards development of specific models to cover the full range of dominant tree species of African forests.
Keywords
carbon stock;
allometric equations;
non-destructive sampling;
basic wood density
-
Goussanou,
Laboratory of Applied Ecology, Faculty of Agronomic Sciences, University of Abomey-Calavi, 01 BP 526 Cotonou, Benin
E-mail
cedricgoussanou@gmail.com
- Guendehou, Laboratory of Applied Ecology, Faculty of Agronomic Sciences, University of Abomey-Calavi, 01 BP 526 Cotonou, Benin; Benin Centre for Scientific and Technical Research, 03 BP 1665 Cotonou, Benin E-mail sguendehou@yahoo.fr
- Assogbadjo, Laboratory of Applied Ecology, Faculty of Agronomic Sciences, University of Abomey-Calavi, 01 BP 526 Cotonou, Benin E-mail assogbadjo@yahoo.fr
- Kaire, Centre Régional AGRHYMET, Département Formation et Recherche, BP 11011 Niamey, Niger E-mail m.kaire@agrhymet.ne
- Sinsin, Laboratory of Applied Ecology, Faculty of Agronomic Sciences, University of Abomey-Calavi, 01 BP 526 Cotonou, Benin E-mail bsinsin@gmail.com
- Cuni-Sanchez, University of Copenhagen, Center for Macroecology, Evolution and Climate, Nørregade 10, P.O. Box 2177, 1017 Copenhagen K, Denmark E-mail aidacuni@hotmail.com
Received 5 September 2015 Accepted 30 December 2015 Published 25 January 2016
Views 221503
Available at https://doi.org/10.14214/sf.1474 | Download PDF

Supplementary Files
1 Introduction
Human activities such as commercial fellings, fuelwood gathering, fires, and agricultural activities disturb forest ecosystems through deforestation and forest degradation and release the carbon stored in living biomass, soil, dead organic matter and litter pools to the atmosphere. Between the years 2000 and 2010, more than 3 million ha of tropical forest were lost in Africa including 875 000 ha in West Africa (FAO 2011). To address the issue a number of human-induced activities including reducing emissions from deforestation and forest degradation, sustainable management of forests, conservation and enhancement of forest carbon stocks have been proposed by the international community (UNFCCC 2010). To assess the performance of these activities, in terms of emissions reduction compared to a reference level, historical and current data on carbon stocks as well as tools such as biomass models would be required.
Databases on biomass and volume functions have been developed in other regions including Europe (Zianis et al. 2005), North America (Tritton and Hornbeck 1982; Ter-Mikaelian and Korzukhin 1997; Jenkins et al. 2004) and Australia (Eamus et al. 2000; Grierson et al. 2000; Keith et al. 2000). In West Africa, available functions (Adekunle 2007; Akindele and LeMay 2006; Henry et al. 2010; Sawadogo et al. 2010; Mbaekwe and Mackenzie 2008; Onyekwelu 2004; Guendehou et al. 2012) suggest that the topic has not been comprehensively addressed yet in the region. Henry et al. (2011) have compiled available allometric equations for sub-Saharan Africa and already underscored that there are very few equations for the region. This comprehensive compilation, as well as other recent studies (Djomo et al. 2010; Ebuy et al. 2011; Ryan et al. 2011; Vieilledent et al. 2012; Colgan et al. 2013; Fayolle et al. 2013; Mugasha et al. 2013; Mate et al. 2014; Ngomanda et al. 2014) did not include the majority of tropical tree species growing in West Africa. A recent study by Guendehou et al. (2012) also highlighted the need to expand the development of biomass models to further regions and tree species.
The use of generic allometric equations could be an alternative for carbon stocks quantification, especially in the tropics characterised by a diversity of tree species. Surprisingly, to our knowledge, trees used to develop these generalised equations (e.g. Brown 1997; Baker et al. (2004); Chave et al. 2005) did not include major tree species from Africa. Furthermore, several studies already found that the application of the generalised equations to area outside the data domain for which they were developed resulted in high uncertainties associated with tree biomass and volume estimation (Clark et al. 2001; Basuki et al. 2009; Alves et al. 2010; Henry et al. 2010; Fonseca et al. 2012; Guendehou et al. 2012; Lima et al. 2012; Fayolle et al. 2013; Ngomanda et al. 2014). This finding supports the development and application of local and species-specific biomass and volume models to study dynamics of carbon stocks.
Most of the approaches used to develop biomass models involved destructive sampling of trees (Gibbs et al. 2007; Devi and Yadava 2009; Peichl et al. 2012). This approach does not seem appropriate in the current context of using forests to mitigate climate change (Guendehou and Lehtonen 2014), as it releases an important amount of carbon to the atmosphere. Also, it does not protect threatened species in forest ecosystems. Furthermore, biomass models are to be consistent with allometric scaling laws (West et al. 1997; Enquist et al. 1998; West et al. 1999) which suggest that the size influences nearly all of the structural, functional and ecological characteristics of organisms and that the tree characteristics, including diameter and height, would be good predictors of tree volume and biomass. Some models including variables such as crown cover (JAFTA 2000) as input, previously developed in Benin, were difficult to apply as these variables were not always readily available or easy to measure.
In Benin, the very few studies on allometric equations (Fonton et al. 2002; 2009; Adjolohoun et al. 2013) were carried out in ecosystems other than semi-deciduous forest except for Guendehou et al. (2012). The main objective of this study was to develop volume and biomass models for eighteen native dominant tree species in a natural tropical semi-deciduous forest called Lama in Benin, using non-destructive sampling approach. Further objectives were to develop generic volume and biomass models and determine basic wood densities of the tree species. The study intends to test the hypothesis that species-specific models are preferred to generic models.
2 Material and methods
2.1 Study site
The study site was the Lama forest reserve, a semi-deciduous forest (Nagel et al. 2004) located in southern Benin between 6°55´ and 7°00´ N and 2°04´ and 2°12´ E (Fig. 1). The forest consists of 16 250 ha, including 4 777 ha of natural forest called ‘Noyau central’, entirely protected.
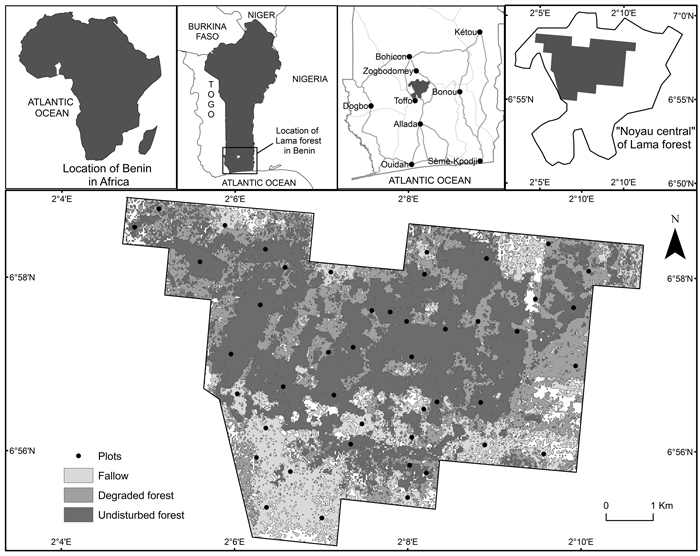
Fig. 1. Location of the study area.
The climate in southern Benin is tropical humid. The monthly average temperatures vary between 25 and 29 °C. The highest temperature 38 °C was observed between February and March and the lowest one (15 °C) was recorded in December. The site falls within a tropical moist zone according to the IPCC regional climate classification scheme (IPCC 2006). The mean annual precipitation in the experimental site is 1 200 mm with monthly precipitations exceeding 100 mm in all months except for January, February and December. Two wet and two dry seasons are observed throughout the year. The principal rainy season occurs between mid-March and mid-July and the shorter rainy season between mid-September and mid-November.
The soil in the study area consists of hydromorphic clayey vertisol (40–60% of clay) characterized by a poor drainage and a pH range of 5–5.5 in the 0–30 cm horizon (Küppers et al. 1998). The pH increases up to 6.5–7 in deeper horizons due to the appearance of limestone at a depth of 150 cm.
Küppers et al. (1998) reported 67 families from a flora inventory carried out in the Lama forest. Mondjannagni (1969), Paradis and Houngnon (1977) and Akoègninou (1984) also described the species richness of the forest. Dominant tree species reported by previous studies (von Bothmer et al. 1986; Küppers et al. 1998; Nagel et al. 2004; Bonou et al. 2009) include indigenous species such as Afzelia Africana Sm., Anogeissus leiocarpa (DC.) Guill. & Perr., Ceiba pentandra (L.) Gaertn., Celtis brownii Rendle, Dialium guineense WiIld., Diospyros mespiliformis Hochst. Ex A.DC., Holarrhena floribunda (G. Don) Durand and Schinz, and Mimusops andongensis Hiern. The distribution of these species varies according to the vegetation cover (e.g. natural forest and fallow). The current study has extended the list of dominant tree species based on ground truth data as described below in section on species selection.
2.2 Sampling design and data collection
2.2.1 Plots selection
A systematic sampling procedure was first applied by overlaying a grid of points spaced from each other of 1 km on the study area map using QGIS 1.8 together with data from the most recent national forest inventory (NFI) carried out in 2007. The intersections of the lines on the grid were considered as the centre of the plots. Using this approach, 45 plots were identified within the boundary of the study area. Then, since the study area covers different vegetation types, the 45 plots were redistributed proportionately to the area of each vegetation type in order to avoid bias in the sampling. This resulted in 20, 10 and 15 plots of 50 × 50 m in natural dense forest, degraded forest and fallow respectively. Within each vegetation type, the allocated plots were redistributed randomly using the random point function of QGIS 1.8. The geographical coordinates of the centre of the plots were recorded using a GPS. The boundaries of the plots were defined using tape and a string. The geographical coordinates of the four corners of the plots were also recorded. These plots were used for the field measurements. The total area sampled was 11.25 ha and represented 0.23% of the “Noyau central” in line with the range reported by Chave et al. (2003; 2004) and GFOI (2013).
2.2.2 Species selection
Eighteen dominant tree species were selected based on the importance value index (IVI) computed following the approach of Curtis and Macintosh (1951). The IVI is used to determine the overall importance of each species in the community structure based on the relative frequency, relative density and relative dominance. These species included: Terminalia superba Engl. and Diels, Lonchocarpus sericeus (Poir.) Kunth, Mimusops andongensis, Holoptelea grandis (Hutch.) Mildbr, Khaya senegalensis (Desr.) A. Juss, Albizia zygia (DC.) J.F.Macbr., Drypetes floribunda (Müll.Arg.) Hutch., Celtis brownie Rendle, Lecaniodiscus cupanioides Planch. ex Benth, Triplochiton scleroxylon K.Schum., Sterculia tragacantha Lindl., Diospyros abyssinica (Hiern) F.White, Malacantha alnifolia (Baker) Pierre, Zanthoxylum zanthoxyloides (Lam.) Zepern. & Timler, Cynometra megalophylla Harms, Ficus sur Forssk., Cassipourea congoensis R.Br. ex DC., Holarrhena floribunda. Other species with high IVI including A. africana, A. leiocarpa, C. pentandra, D. guineense and D. mespiliformis were already studied by Guendehou et al. (2012).
2.2.3 Measurements of tree characteristics of individual trees
All living trees in each plot were measured for Dbh, using a non-destructive sampling and data collected were combined to calculate the IVI. Then, for the selected dominant species, detailed measurements on diameter along the stem and height were undertaken and wood samples were collected for basic wood densities measurement in laboratory. For studied species, each individual tree identified during the sampling was systematically measured for Dbh, and the data collected showed that at least one (1) tree was sampled in each existing Dbh class. The width of the diameter classes was 5 cm. Hollow trees and trees with broken top were not measured. Measurements were carried out between October 2013 and February 2014. In total 501 trees were measured. Table 1 gives the number of trees sampled, data on stem diameter, stem height and total height and the range of the measurements.
| Table 1. Compilation of measurements of diameter and height for each sampled tree. | |||||
| Species | Number of sample trees | Number of diameter measurement | Dbh range (cm) | Stem height range (m) | Total height range (m) |
| Lonchocarpus sericeus | 23 | 145 | 3.2–38.5 | 2.28–20.48 | 2.28–24.15 |
| Drypetes floribunda | 28 | 162 | 2.4–31.5 | 2–9.96 | 2–12.09 |
| Albizia zygia | 28 | 168 | 2.5–65.5 | 3.03–26.73 | 3.03–28.08 |
| Lecaniodiscus cupanioides | 22 | 118 | 3.3–29.3 | 3.67–13.86 | 4.1–15.82 |
| Ficus sur | 27 | 163 | 4.4–67.7 | 3.25–21.85 | 3.25–26.64 |
| Zanthoxylum zanthoxyloides | 19 | 119 | 4.2–31.6 | 3.42–10.34 | 4.33–12.06 |
| Mimusops andongensis | 26 | 164 | 3.9–46.4 | 4–20.7 | 4–23 |
| Celtis brownii | 27 | 159 | 3.3–29.3 | 2.31–14.56 | 2.31–16.38 |
| Sterculia tragacantha | 31 | 194 | 2.9–34.6 | 2.02–16.2 | 2.02–18.8 |
| Cassipourea congoensis | 28 | 143 | 2.8–22.4 | 3.22–18.7 | 3.22–22.66 |
| Khaya senegalensis | 27 | 160 | 3.7–40.2 | 3.05–19.5 | 4.35–24 |
| Holarrhena floribunda | 32 | 187 | 2.9–41.3 | 2.1–20.25 | 2.1–23.25 |
| Cynometra megalophylla | 19 | 122 | 2.9–36 | 5.35–19.32 | 5.35–21.28 |
| Malacantha alnifolia | 27 | 169 | 2.9–31.9 | 3.6–13.72 | 3.6–17.92 |
| Terminalia superba | 37 | 240 | 8.2–44.4 | 6.32–26.04 | 9.44–33.93 |
| Triplochiton scleroxylon | 48 | 309 | 2.3–47.5 | 2.4–25.44 | 2.4–30.52 |
| Diospyros abyssinica | 18 | 109 | 1.8–32.7 | 3–19.26 | 3–22.14 |
| Holoptelea grandis | 34 | 207 | 3.5–32.9 | 4.62–22.54 | 5.4–25.3 |
2.2.4 Measurement of sample trees
On each tree sampled, diameter measurement was performed first at the bottom (diameter on the ground), then at 1.30 meter above the ground and every meter along the stem from 1.3 m up to 6.3 m using a ladder. The absence of buttress on the sampled trees made it easier to measure diameter at the bottom. When the stem height was higher than 6.3 m, the diameter at the top of the stem was computed using a linear extrapolation based on two last diameters recorded along the tree stem (Guendehou et al. 2012).
Stem height is defined as height from the bottom to crown base. Using an optical Suunto clinometer PM-5, stem height and total height were estimated from observations recorded on the bottom, the crown base and the top of trees. Given the difficulty to record observations at the top of the tree in closed canopy, we assumed that total height measurement was uncertain and therefore was not used as variable in the model development.
For each sample trees, two wood samples were extracted at 1.3 m, at two points diametrically opposed, using an increment borer, except for trees in lower diameter classes (Dbh < 5 cm) for which one sample was collected. Based on the diameter of the increment borer (5 mm) and the length of the fresh sample collected, the volume of the sample was estimated. In total, 873 wood samples were collected and oven-dried at 90 °C to constant weight (during 48 hours) in laboratory. Dry mass of samples was measured using an electronic balance (Ohaus Pionneer Analytical Model scale) and the basic wood density was calculated as ratio of dry mass to fresh volume of the sample. Table 2 shows the basic wood densities of sampled tree species and the comparison with existing data.
| Table 2. Mean wood density (g cm−3) of the selected tree species in Lama forest reserve and comparison with other published data; wood density range includes all observations without modification. Wood density is given as oven-dry mass per fresh volume. | ||||||||
| Species | This study | Others studies | ||||||
| Number of wood sample | Wood Density range | Mean (Standard deviation) | Coefficient of varation (%) | Brown 1997 | Kindt et al. 2015 | IPCC 2006 | Zanne et al. 2009 | |
| C. megalophylla | 34 | 0.81–1.3 | 0.98 (0.08) | 7.96 | - | - | - | - |
| D. abyssinica | 31 | 0.45–1.90 | 0.86 (0.29) | 33.73 | - | 0.83 | - | - |
| Z. zanthoxyloides | 33 | 0.65–1.43 | 0.84 (0.14) | 16.62 | - | - | - | - |
| D. floribunda | 46 | 0.51–1.07 | 0.77 (0.12) | 15.67 | - | - | - | - |
| M. andongensis | 48 | 0.42–0.98 | 0.77 (0.11) | 14.51 | - | - | - | - |
| L. cupanioides | 36 | 0.42–1.03 | 0.77 (0.14) | 17.86 | - | - | - | - |
| C. congoensis | 39 | 0.62–0.83 | 0.75 (0.05) | 6.64 | - | - | - | 0.66 |
| L. sericeus | 42 | 0.48–0.95 | 0.75 (0.11) | 14.15 | - | 0.70 | - | 0.75 |
| C. brownii | 42 | 0.52–0.98 | 0.73 (0.09) | 13.04 | - | 0.72 | - | - |
| A. zygia | 52 | 0.44–0.73 | 0.65 (0.08) | 13.31 | 0.46 | 0.51 | - | 0.49 |
| H. grandis | 58 | 0.42–0.76 | 0.63 (0.09) | 14.08 | 0.59 | 0.61 | 0.59 | 0.59 |
| M. alnifolia | 46 | 0.48–0.73 | 0.61 (0.06) | 9.24 | 0.45 | - | 0.45 | - |
| K. senegalensis | 52 | 0.41–0.74 | 0.59 (0.07) | 11.83 | 0.60 | 0.66 | - | 0.63 |
| T. superba | 74 | 0.37–0.69 | 0.56 (0.06) | 10.74 | 0.45 | 0.46 | 0.40–0.66 | 0.46 |
| H. floribunda | 57 | 0.43–0.61 | 0.54 (0.04) | 8.32 | - | 0.47 | - | 0.47 |
| T. scleroxylon | 86 | 0.35–0.6 | 0.46 (0.07) | 15.11 | 0.32 | - | 0.28–0.44 | 0.33 |
| F. sur | 50 | 0.32–0.52 | 0.45 (0.05) | 11.97 | - | - | - | - |
| S. tragacantha | 47 | 0.16–0.44 | 0.32 (0.08) | 25.80 | - | - | - | - |
2.2.7 Stem volume and biomass estimation
The stem volume of each tree was calculated as the sum of the volumes of sections of the stem, starting from the base up to the top of the stem (between 0and 1.3 m; 1.3 m and 2.3 m and so on). The formula of a truncated cone (Netshiluvhi and Scholes 2001) was used to compute the volumes.
where V is the volume of a section, π = pi, h = height of the stem section, d1 and d2 are the diameters of the truncated cone.
Stem biomass was calculated by multiplying the basic wood density with total stem volume.
2.3 Data analysis and model approaches
Volume and biomass models were developed and tested using the approach reported by Guendehou et al. (2012). Models were estimated and tested using the statistical computing software R (R Development Core Team 2012). A number of linear and non-linear volume and biomass functions, using only Dbh as variable or a combination of Dbh and stem height, were tested. A non-linear model form with multiplicative error was used as the basis of the model formulation. A logarithmic transformation was used to obtain homoscedastic variance, and to transform the equation to a linear form (Fig. 2).
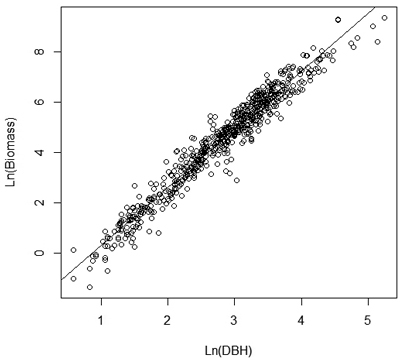
Fig. 2. Linear relationship with constant variance between ln (biomass) and ln(Dbh).
The statistical parameters analysed for model comparison and selection included the standard error and significance of model parameters, the residual standard deviation of the model, the adjusted coefficient of determination, residuals vs. fitted, and the relative root mean square error (rRMSE). The analysis resulted in the selection of the following models:


where X = stem biomass (kg) or volume (10−3 m3), Dbh = the diameter at breast height at 1.3 m (cm) above ground, H = stem height (m), x0, x1 and x2 are model parameters, ln is the natural logarithm., and σ is the residual standard deviation of the linearized models.
These linear models were derived from non-linear model form to address the heteroscedasticity (non-constant variance) of observations (Vieilledent et al. 2012; Guendehou et al. 2012; Mc Roberts et al. 2015). Biomass and volume are derived using the following equations:


where X = biomass (kg) or volume (10−3 m3), Y = biomass (kg) or volume (10−3 m3), Dbh = the Dbh at 1.3 m (cm), H = stem height (m), x0, x1 and x2 are model parameters, and σ is the residual standard deviation of the linearized models.
Species-specific models were developed by fitting equations to species-specific observations on Dbh, stem height, volume and biomass only. For the generic models, all observations collected in this study and those from Guendehou et al. (2012) were combined. This resulted in 617 trees used for the generic volume and biomass models. Chave et al. (2004) recommended more than 100 trees. Generic models in this study were compared to specific models and other published generic models by analysing the differences between predictions and observations.
3 Results
3.1 Basic wood density
The highest value of basic wood density (1.90 g/cm–3) was obtained for D. abyssinica whereas the lowest value (0.16 g/cm–3) corresponded to S. tragacantha (Table 2). The highest mean value (0.98 g/cm–3) was observed in C. megalophylla which is three times higher than the lowest mean density in S. tragacantha. Drypetes floribunda, Mimusops andogensis and Lecaniodiscus cupanioides had the same mean value (0.77 g/cm–3) although the density values for L. cupanioides were distributed throughout a wider range. Cassipourea congoensis and Lonchocarpus sericeus also had the same mean value (0.75 g/cm–3) but basic wood density data were distributed in a narrow range. The analysis of the observations indicated that only six out of eighteen tree species studied had basic wood density higher than 0.75 g/cm–3 (Table 2).
The coefficient of variation (CV) associated with species-specific basic wood density was less than 18% for all species except for D. abyssinica (34%) and S. tragacantha (26%) indicating low variation of wood density between individuals of the same species. However, lower values of densities were observed in younger trees in lower diameter classes. The variation of wood density between studied species was relatively high as indicated by the CV (30%).
3.2 Stem volume and biomass models
For both model formulation including models with Dbh only and models using a combination of Dbh and height as variables, high adjusted coefficient of determination was observed (Tables 3 and 4) suggesting that all species-specific and generic models accounted for a high proportion of variation of data. Inclusion of tree stem height in addition to stem diameter improved the performance of all models (lower rRMSE and residual standard deviation). Most of the model parameters were significant at Pr(>|t|)<0.001.
| Table 3. Total stem volume models, parameter estimates, standard errors of parameter estimates, adjusted coefficients of determination, relative RMSEs and bias correction. V = Volume (10−3 m3); Dbh = the Dbh at 1.3 m (cm); H = tree stem height (m); x0, x1 and x2 are model parameters; RMSE = root mean square error; σ = model residual standard deviation. Stem is described as height to crown base. Figures in brackets are standard errors of the parameters. | |||||||
| Species | Model parameters | Adjusted R2 (%) | Relative RMSE (%) | σ2/2 | df | ||
| x0 | x1 | x2 | |||||
| Model structure: ln(V) = x0 + x1ln(Dbh) | |||||||
| H. grandis | –1.58*** (0.11) | 2.36*** (0.04) | 99.03 | 15 | 0.01 | 32 | |
| T. scleroxylon | –1.96*** (0.10) | 2.48*** (0.03) | 99.13 | 17 | 0.02 | 46 | |
| C. congoensis | –1.90*** (0.11) | 2.53*** (0.05) | 98.74 | 17 | 0.02 | 26 | |
| D. abyssinica | –1.92*** (0.21) | 2.51*** (0.08) | 98.28 | 24 | 0.04 | 16 | |
| Z. zanthoxyloides | –1.71*** (0.18) | 2.37*** (0.07) | 98.6 | 18 | 0.02 | 17 | |
| A. zygia | –1.83*** (0.13) | 2.49*** (0.04) | 99.3 | 18 | 0.02 | 26 | |
| K. senegalensis | –1.76*** (0.15) | 2.33*** (0.05) | 98.71 | 18 | 0.02 | 25 | |
| M. andongensis | –1.71*** (0.15) | 2.35*** (0.05) | 98.86 | 18 | 0.02 | 24 | |
| C. brownii | –1.80*** (0.16) | 2.37*** (0.06) | 98.18 | 23 | 0.02 | 25 | |
| S. tragacantha | –1.47*** (0.18) | 2.31*** (0.06) | 97.66 | 24 | 0.03 | 29 | |
| C. megalophylla | –1.52*** (0.13) | 2.31*** (0.05) | 99.28 | 14 | 0.01 | 17 | |
| L. sericeus | –1.81*** (0.14) | 2.42*** (0.05) | 99.13 | 17 | 0.02 | 21 | |
| H. floribunda | –1.63*** (0.09) | 2.36*** (0.03) | 99.39 | 14 | 0.01 | 30 | |
| D. floribunda | –1.53*** (0.13) | 2.23*** (0.05) | 98.53 | 19 | 0.02 | 26 | |
| L. cupanioides | –1.38*** (0.21) | 2.24*** (0.09) | 96.88 | 23 | 0.03 | 20 | |
| M. alnifolia | –1.46*** (0.09) | 2.23*** (0.04) | 99.34 | 13 | 0.01 | 25 | |
| T. superba | –1.52*** (0.12) | 2.35*** (0.04) | 99.06 | 11 | 0.01 | 35 | |
| F. sur | –1.55*** (0.13) | 2.30*** (0.04) | 99.22 | 15 | 0.01 | 25 | |
| Generic | –1.48*** (0.04) | 2.29*** (0.01) | 97.51 | 32 | 0.05 | 615 | |
| Model structure: ln(V) = x0 + x1ln(Dbh) + x2ln(H) | |||||||
| H. grandis | –2.10*** (0.11) | 1.95*** (0.07) | 0.66*** (0.10) | 99.56 | 11 | 0.01 | 31 |
| T. scleroxylon | –2.33*** (0.07) | 2.04*** (0.05) | 0.64*** (0.07) | 99.7 | 10 | 0.01 | 45 |
| C. congoensis | –2.36*** (0.17) | 2.15*** (0.12) | 0.60** (0.18) | 99.09 | 14 | 0.01 | 25 |
| D. abyssinica | –2.60*** (0.26) | 1.96*** (0.18) | 0.91** (0.27) | 98.94 | 19 | 0.03 | 15 |
| Z. zanthoxyloides | –2.63*** (0.21) | 2.30*** (0.04) | 0.53*** (0.10) | 99.46 | 11 | 0.01 | 16 |
| A. zygia | –2.10*** (0.10) | 2.15*** (0.07) | 0.52*** (0.09) | 99.69 | 12 | 0.01 | 25 |
| K. senegalensis | –1.90*** (0.10) | 1.89*** (0.08) | 0.62*** (0.10) | 99.46 | 11 | 0.01 | 24 |
| M. andongensis | –2.17*** (0.10) | 1.99*** (0.05) | 0.64*** (0.08) | 99.66 | 10 | 0.01 | 23 |
| C. brownii | –1.95*** (0.11) | 2.04*** (0.08) | 0.48*** (0.09) | 99.12 | 14 | 0.01 | 24 |
| S. tragacantha | –1.75*** (0.11) | 1.84*** (0.07) | 0.69*** (0.09) | 99.21 | 14 | 0.01 | 28 |
| C. megalophylla | –1.97*** (0.27) | 2.17*** (0.09) | 0.35. (0.19) | 99.38 | 12 | 0.01 | 16 |
| L. sericeus | –2.03*** (0.11) | 2.07*** (0.08) | 0.50*** (0.11) | 99.56 | 12 | 0.01 | 20 |
| H. floribunda | –1.95*** (0.07) | 2.11*** (0.04) | 0.44*** (0.06) | 99.75 | 9 | 0.00 | 29 |
| D. floribunda | –2.06*** (0.10) | 2.03*** (0.04) | 0.59*** (0.07) | 99.58 | 10 | 0.01 | 25 |
| L. cupanioides | –2.14*** (0.18) | 1.92*** (0.07) | 0.72*** (0.12) | 98.9 | 13 | 0.01 | 19 |
| M. alnifolia | –1.85*** (0.17) | 2.08*** (0.07) | 0.39* (0.15) | 99.46 | 12 | 0.01 | 24 |
| T. superba | –1.93*** (0.12) | 2.14*** (0.05) | 0.39*** (0.08) | 99.43 | 9 | 0.00 | 34 |
| F. sur | –1.85*** (0.13) | 2.15*** (0.13) | 0.32*** (0.09) | 99.47 | 12 | 0.01 | 24 |
| Generic | –2.10*** (0.04) | 2.00*** (0.02) | 0.63*** (0.53) | 98.71 | 24 | 0.02 | 614 |
| Table 4. Total stem biomass models, parameter estimates, standard errors of parameter estimates, adjusted coefficients of determination, relative RMSEs and bias correction. X = Biomass (kg); Dbh = the Dbh at 1.3 m (cm); H = tree stem height (m); x0, x1 and x2 are model parameters; RMSE = root mean square error; σ = model residual standard deviation. Stem is described as height to crown base. Figures in brackets are standard errors of the parameters. | |||||||
| Species | Model parameters | Adjusted R2 (%) | Relative RMSE (%) | σ2/2 | df | ||
| x0 | x1 | x2 | |||||
| Model structure: ln(X) = x0 + x1ln(Dbh) | |||||||
| H. grandis | –2.44*** (0.10) | 2.51*** (0.04) | 99.23 | 16 | 0.01 | 32 | |
| T. scleroxylon | –2.64*** (0.14) | 2.44*** (0.05) | 98.24 | 24 | 0.03 | 46 | |
| C. congoensis | –2.25*** (0.12) | 2.56*** (0.06) | 98.6 | 17 | 0.02 | 26 | |
| D. abyssinica | –2.06*** (0.29) | 2.49*** (0.11) | 96.74 | 34 | 0.08 | 16 | |
| Z. zanthoxyloides | –2.36*** (0.21) | 2.55*** (0.08) | 98.27 | 22 | 0.02 | 17 | |
| A. zygia | –2.63*** (0.17) | 2.60*** (0.05) | 98.92 | 23 | 0.03 | 26 | |
| K. senegalensis | –2.50*** (0.16) | 2.40*** (0.06) | 98.56 | 22 | 0.02 | 25 | |
| M. andongensis | –1.98*** (0.20) | 2.35*** (0.07) | 97.99 | 24 | 0.03 | 24 | |
| C. brownii | –2.30*** (0.18) | 2.44*** (0.07) | 97.89 | 23 | 0.03 | 25 | |
| S. tragacantha | –2.93*** (0.22) | 2.40*** (0.08) | 96.48 | 32 | 0.05 | 29 | |
| C. megalophylla | –1.68*** (0.16) | 2.37*** (0.06) | 98.99 | 17 | 0.02 | 17 | |
| L. sericeus | –2.39*** (0.17) | 2.53*** (0.06) | 98.76 | 21 | 0.02 | 21 | |
| H. floribunda | –2.33*** (0.11) | 2.39*** (0.04) | 99 | 18 | 0.02 | 30 | |
| D. floribunda | –2.09*** (0.16) | 2.35*** (0.06) | 98.15 | 22 | 0.03 | 26 | |
| L. cupanioides | –2.21*** (0.25) | 2.47*** (0.10) | 96.44 | 27 | 0.04 | 20 | |
| M. alnifolia | –1.91*** (0.12) | 2.21*** (0.04) | 98.94 | 17 | 0.02 | 25 | |
| T. superba | –2.38*** (0.16) | 2.45*** (0.05) | 98.31 | 16 | 0.01 | 35 | |
| F. sur | –2.52*** (0.17) | 2.35*** (0.05) | 98.68 | 21 | 0.02 | 25 | |
| Generic | –1.98*** (0.06) | 2.30*** (0.02) | 95.07 | 45 | 0.10 | 615 | |
| Model structure: ln(X) = x0 + x1ln(Dbh) + x2ln(H) | |||||||
| H. grandis | –2.72*** (0.14) | 2.28*** (0.09) | 0.35516* (0.14) | 99.35 | 14 | 0.01 | 31 |
| T. scleroxylon | –3.15*** (0.11) | 1.86*** (0.08) | 0.86*** (0.10) | 99.28 | 16 | 0.01 | 45 |
| C. congoensis | –2.71*** (0.17) | 2.21*** (0.13) | 0.58** (0.19) | 99.06 | 15 | 0.01 | 25 |
| D. abyssinica | –2.81*** (0.41) | 1.88*** (0.28) | 1.00* (0.43) | 97.45 | 33 | 0.06 | 15 |
| Z. zanthoxyloides | –3.38*** (0.28) | 2.48*** (0.59) | 0.58*** (0.14) | 99.14 | 14 | 0.01 | 16 |
| A. zygia | –2.99*** (0.12) | 2.14*** (0.08) | 0.70*** (0.11) | 99.55 | 15 | 0.01 | 25 |
| K. senegalensis | –2.64*** (0.12) | 1.97*** (0.10) | 0.60*** (0.13) | 99.2 | 15 | 0.01 | 24 |
| M. andongensis | –2.43*** (0.20) | 2.00*** (0.11) | 0.63*** (0.16) | 98.72 | 18 | 0.02 | 23 |
| C. brownii | –2.46*** (0.13) | 2.08*** (0.09) | 0.52*** (0.11) | 98.88 | 16 | 0.01 | 24 |
| S. tragacantha | –3.23*** (0.18) | 1.90*** (0.12) | 0.74*** (0.15) | 98.03 | 21 | 0.03 | 28 |
| C. megalophylla | –2.50*** (0.28) | 2.11*** (0.09) | 0.63** (0.19) | 99.36 | 13 | 0.01 | 16 |
| L. sericeus | –2.58*** (0.17) | 2.23*** (0.13) | 0.43* (0.17) | 99.02 | 18 | 0.01 | 20 |
| H. floribunda | –2.73*** (0.10) | 2.08*** (0.06) | 0.55*** (0.09) | 99.55 | 12 | 0.01 | 29 |
| D. floribunda | –2.63*** (0.15) | 2.14*** (0.06) | 0.60*** (0.11) | 99.11 | 16 | 0.01 | 25 |
| L. cupanioides | –2.99*** (0.25) | 2.14*** (0.10) | 0.74*** (0.17) | 98.16 | 19 | 0.02 | 19 |
| M. alnifolia | –2.35*** (0.22) | 2.03*** (0.09) | 0.44* (0.19) | 99.09 | 15 | 0.01 | 24 |
| T. superba | –2.83*** (0.19) | 2.21*** (0.08) | 0.43** (0.13) | 98.71 | 14 | 0.01 | 34 |
| F. sur | –2.94*** (0.17) | 2.14*** (0.07) | 0.45*** (0.12) | 99.16 | 16 | 0.01 | 24 |
| Generic | –2.63*** (0.07) | 1.99*** (0.03) | 0.67*** (0.04) | 96.35 | 39 | 0.07 | 614 |
The fact that some observations were lacking in higher diameter classes (Dbh > 50 cm), due to the structure of the forest, (majority of the trees has Dbh < 40 cm) resulted in wide confidence intervals of the predictions (Fig. 3; Supplementary files 1 and 2).
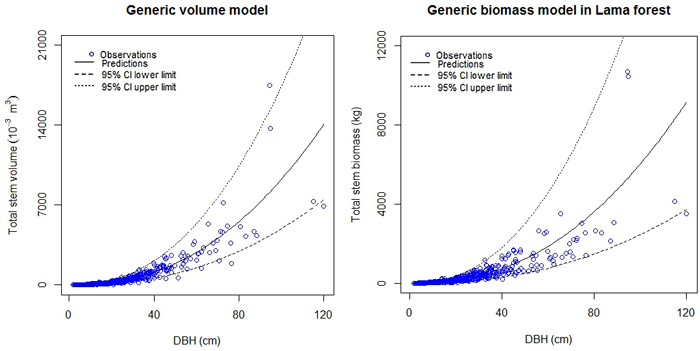
Fig. 3. Generic models for stem volume and stem biomass in Lama forest reserve.
No large differences in stem volume among studied species were observed for Dbh less than 20 cm (Fig. 4). For Dbh more than 20 cm, the stem volume of C. cassipourea was the highest followed by D. abyssinica and A. zygia. The lowest stem volume was found for D. floribunda. The observed order of magnitude of stem volume was: C. cassipourea > D. abyssinica > A. zigia > T. scleroxylon > L. sericeus > T. superba > H. grandis > H. floribunda > Z. zanthoxyloides > S. tragacantha > C. megalophylla > C. brownii > M. andongensis > F. sur > K. senegalensis > L. cupanioides > M. alnifolia > D. floribunda (Fig. 4).
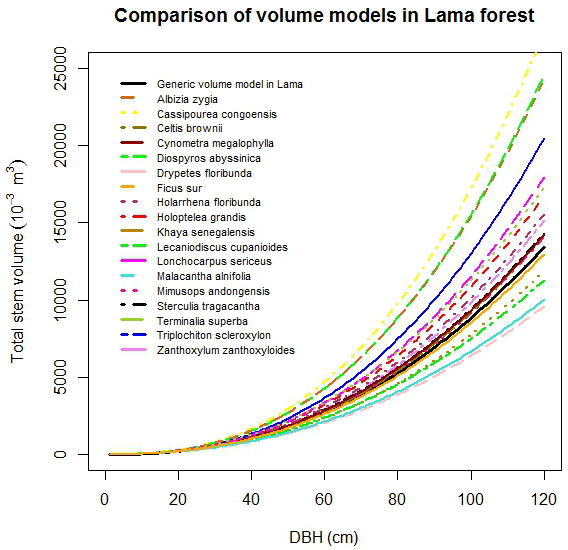
Fig. 4. Comparison of stem volume functions by selected tree species.
C. congoensis had the highest stem biomass. The combination of stem volume and wood density explained the observed order of magnitude of biomass in tree species: C. congoensis > D. abyssinica > Z. zanthoxyloides > A. zygia > L. sericeus > C. megalophylla > L. cupanioides > H. grandis > C. brownii > > T. superba > M. andongensis > D. floribunda > H. floribunda > T. scleroxylon > K. senegalensis > F. sur > M. alnifolia > S. tragacantha (Fig. 5). For instance, although, D. floribunda had the lowest stem volume, its biomass was higher than in S. tragacantha which had the lowest stem biomass because of the lower wood density found in S. tragacantha. The generic biomass model provided good approximations for biomass estimation of T. scleroxylon and K. senegalensis only. Large differences were observed with the other species suggesting that the application of the generic model to these species will result in higher uncertainties.
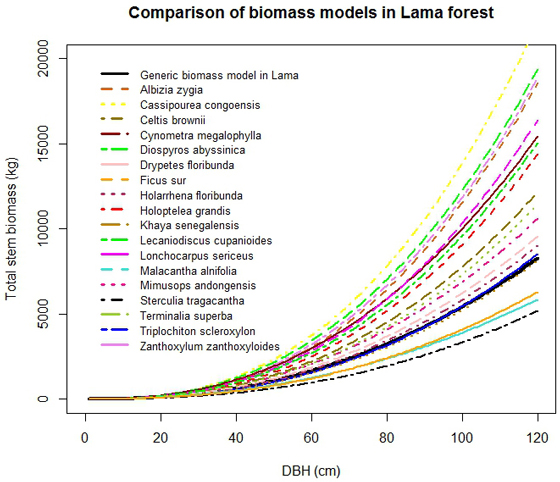
Fig. 5. Comparison of stem biomass functions by selected tree species.
4 Discussions
4.1 Basic wood density
The observed small differences in wood densities between individuals of same species are in agreement with the conservation features of wood density inside species reported by Chave et al. 2006; Swenson and Enquist 2007. Lower values of wood densities identified in general in younger trees in lower diameter classes were also reported by previous studies (Bao et al. 2001; Guendehou et al. 2012) who justified this finding by the fact that lignin content is lower in younger trees than mature ones. This finding also indicated that wood density in the studied species increases from pith to bark. As wood samples were not collected along the stem, this study could not conclude on the vertical variation of wood density. The non-destructive sampling applied was based on the assumption that wood density does not vary significantly from pith to bark along the stem. Given that tree species studied were in the same edaphoclimatic conditions, the large differences observed between wood densities of the eighteen tree species could not be directly attributable to environmental conditions, but more to differences between species (Nogueira et al. 2007; Gourlet-Fleury et al. 2011). These differences could be explained by the intrinsic characteristics of species (Chave et al. 2006; 2009; Zanne et al. 2010; Zeidler, 2012). Guendehou et al. (2012) already reported large differences in wood densities in the Lama forest. This finding is in agreement with Baker et al. (2004); Muller-Landau (2004) and Svob et al. (2014) who also identified that differences in wood densities in tropical forests are large.
Most of the tree species with low wood densities (less 0.75 g cm–3) are fast-growing species except for A. zygia, F. sur, M. alnifolia and S. tragacantha. Similar results were found by Muller-Landau (2004) and Yeboah et al. (2014). In general, fast-growing trees are light demanding and produce low-density wood as found by Rueda and Williamson (1992), van Gelder et al. (2006) and Henry et al. (2010). However other studies have shown that some pioneer light demanding tree species can, unexpectedly, have high wood density (e.g Lophira alata, Fayolle et al. 2012) and this may be explained by wood composition and structure (Martínez-Cabrera et al. 2009; Poorter et al. 2010; Zanne et al. 2010).
For most tree species, mean values for wood densities reported in this study (Table 2) did not deviate significantly from data contained in published literature (Brown 1997; IPCC 2006; Zanne et al. 2009 and Kindt et al. 2015). For instance, mean value of 0.75 g cm–3 found in this study for L. sericeus, was also reported by Zanne et al. (2009) and was only 7% higher than the value reported by Kindt et al. (2015). Although, above consulted literature did not provide comprehensive information on the methodological approach used to determine densities, it seems that the reported densities were determined using volumetric approach. The fact that the results of this study were close to the published data justifies that the non-destructive sampling approach used to determine wood density was reliable. This comparison highlighted the double advantage of the non-destructive sampling used to determine wood density, including providing reliable estimates and protecting trees and forest ecosystems. Few studies reported wood densities based on non-destructive sampling (Chave et al. 2006; Sungpalee et al. 2009; Gryc et al. 2010; Carson et al. 2014) but none of them reported on the tree species in this study.
4.2 Stem volume and stem biomass models
Given that the studied species were in the same edaphoclimatic conditions, which means uniform forest, the model specification was based on the assumption that the between-plot and the within-plot variations of tree properties were not significant as confirmed by the analysis of the basic wood density.
Models with two variables (Dbh and height) performed well, for all species, compared to models that use Dbh as predictor, based on statistical analyses (higher R2, lower rRMSE and residual standard deviation). This finding was reported in other studies (Guendehou et al. 2012; Fayolle et al. 2013; Ngomanda et al. 2014) which indicated that the inclusion of height in addition to stem diameter improved the performance of models. Models with one variable had also good predictive ability and can be used in the absence of stem height. High adjusted coefficient of determination (Adj R2 > 95%) found for both types of models (one and two variables) highlighted that the models accounted for a high proportion of variability in predictions, indicating that most of the variance was explained by the models. This was partly due to the stratified sampling approach used that collected observations on tree size in each existing diameter class (Marková and Pokorný 2011; Cienciala et al. 2013; Guendehou et al. 2012; Sileshi 2014).
The generic biomass and volume models developed in this study performed well, for all species in lower diameter classes only (Dbh < 20 cm), when compared to species-specific models (Fig. 4 and Fig. 5). For large trees, the generic biomass model provided good predictions for two species (T. scleroxylon, K. senegalensis) only out of eighteen. The model either overestimated (up to 60%) or underestimated (up to 63%) biomass for the other species (Fig. 5). Similar observations were made for the generic volume model which provided good predictions for F. sur and Mimusops andongensis only (Fig. 4). Given the importance of large trees in carbon budget in forest ecosystems, carbon stocks in large trees should be estimated with accuracy. But, the generic model was not able to predict biomass for the majority of studied species even in the same forest ecosystem (same edaphoclimatic conditions). This implies that specific models are preferred for an accurate volume and biomass estimation.
Brown (1997) developed generic model using observations collected in Africa, America and Asia to estimate total aboveground biomass. Ceiba pentandra, Holoptelea grandis, Khaya senegalensis, Malacantha alnifolia, Terminalia superba from our study were also included in the database used by Brown (1997) who provided up to 316% higher biomass estimates for all species except for C. congoensis for which biomass estimate was 2% lower (Supplementary file 3). Guendehou et al. (2012) reported similar finding when applying Brown (1997) to Afzelia africana, Anogeissus leiocarpa and Ceiba pentandra in Lama forest, but they also found that Brown (1997) provided lower biomass estimates for Diospyros mespiliformis and Dialium guineense. This shed doubt on the applicability of generic model to estimate biomass.
The generic model developed by Djomo et al. (2010a) based on data collected from Brown 1997; Araújo et al. 1999; Nelson et al. 1999; Ketterings et al. 2001 and Djomo et al. (2010b), when applied to the observations of this study gave 2–62% lower biomass estimates for fourteen tree species studied and 3–62% higher biomass estimates for K. senegalensis, S. tragacantha, M. alnifolia and F. sur (Supplementary file 3). Even if the database used by Djomo et al. (2010a) was larger than that of Brown (1997), their generic model was not able to predict with accuracy biomass estimates for the tree species in our study. Similar conclusions can be formulated when comparing the generic model from Basuki et al. (2009) in Indonesia to our data. Basuki et al. (2009) seems to be applicable to C. brownii, T. superba and M. andongensis only. Predictions of biomass with this model, resulted in higher estimates up to 113% (S. tragacantha) and lower biomass estimates up to 50% (C. congoensis) while the model was supposed to give higher estimates because developed to generate total above ground biomass. The generic model from Ngomanda et al. (2014) in Gabon also provided 1–31% lower biomass estimates for C. congoensis, D. abyssinica, Z. zanthoxyloides, A. zygia, C. megalophylla and L. sericeus while it should be the opposite.
From the above discussions, one could confirm the hypothesis that it is difficult to identify which of the several existing biomass and volume equations would be suitable to apply in given edaphoclimatic conditions. Several factors may explain this inability of generic models to provide accurate estimates. Even if this study has not addressed the issue thoroughly, it suggests that among these factors, bio-physiological properties of species and edaphoclimatic conditions would have larger effects, suggesting that considering all species together to develop generic models and applying models to regions for which they were not developed would not be consistent with ecological laws.
Given that wood densities data generated in this study were in line with published data in one hand and due to the fact that, technically, there are no big differences between measuring stem diameter and height (and thus stem volume) on standing trees and deriving these variables on logged trees, in another hand, justified the robustness of volume and biomass models developed in this study. Vann et al. (1998) already found that allometric equations developed from non-destructive sampling appears to be as robust as equations derived using actual weights.
To account for the aboveground biomass, the stem biomass estimated using the models developed in this study should be multiplied by the available biomass expansion factor (IPCC, 2006).
This study is among the first initiatives, in West Africa, using ground truth data collected from non-destructive approach on large tree sample to develop volume and biomass models. The development of the models is consistent with the higher tier method of the Intergovernmental Panel on Climate Change (IPCC 2003; 2006) to estimate carbon stocks and change in carbon stocks in forestry. The study contributes to expand the database on biomass and volume models and basic wood densities in Africa (Henry et al. 2011). It makes available data and tools to countries in the region to assist them to report their contribution to the global effort to mitigate climate change through the implementation of activities such as REDD (reducing emissions from deforestation and forest degradation, conservation of forest carbon stocks, sustainable management of forests, and enhancement of forest carbon stocks in developing countries). The study would also assist countries to meet their reporting requirements under the United Nations Framework Convention on Climate Change (UNFCCC) through the submission of greenhouse gas (GHG) inventories in biennial update reports and national communications (UNFCCC 2010).
5 Conclusions
The logarithmic model using Dbh and height as independent variables was the most suitable for volume and biomass estimation for the eighteen tree species studied. In circumstances where stem height is not available, the model with Dbh only can be used as it gives also good predictions. Based on the comparison between species-specific models and the generic model from the same site and with generic models in published literature, this study concludes that species-specific volume and biomass models are more appropriate for estimating tree volume and biomass. This work is a significant contribution to database on wood densities and allometric equations in tropical countries. It demonstrated that the non-destructive sampling approach needs to be promoted as the wood densities it generated do not deviate significantly from those of destructive sampling and that the models developed based on data collected from this sampling are robust. The data and models generated in this study are suitable for reporting carbon stocks and its changes under REDD, Clean Development Mechanism of the UNFCCC.
Acknowledgements
This study was conducted as part of the project “Pilot site: quantification and modelling of forest carbon stocks in Benin” funded by the Global Climate Change Alliance and the European Union. We thank the Permanent Interstates Committee for Drought Control in the Sahel (CILSS) and the Regional Centre AGRHYMET for the technical assistance provided during the implementation phase of the project. We also thank two anonymous reviewers for their useful comments on the manuscript.
References
Adekunle V.A.J. (2007). Non-linear regression models for timber volume estimation in natural forest ecosystem, southwest Nigeria. Research Journal of Forestry 1: 40–54. http://dx.doi.org/10.3923/rjf.2007.40.54.
Aholoukpe H., Dubos H.B., Flori A., Deleporte P., Amadji G., Chotte J.L., Blavet D. (2013). Estimating aboveground biomass of oil palm: allometric equations for estimating frond biomass. Forest Ecology and Management 292: 122–129. http://dx.doi.org/10.1016/j.foreco.2012.11.027.
Akindele S.O., LeMay V.M. (2006). Development of tree volume equations for common timber species in the tropical rainforest area of Nigeria. Forest Ecology and Management 226: 41–48. http://dx.doi.org/10.1016/j.foreco.2006.01.022.
Akoegninou A. (1984). Contribution à l’étude botanique des îlots de forêts denses humides semi-décidues en République Populaire du Bénin. [Contribution to botanical study of moist semi-deciduous forest in Benin Popular Republic]. Thesis dissertation, University of Bordeaux III.
Alves L.F., Vieira S.A., Scaranello M.A., Camargo P.B., Santos F.A.M., Joly C.A., Martinelli L.A. (2010). Forest structure and live aboveground biomass variation along an elevational gradient of tropical Atlantic moist forest (Brazil). Forest Ecology and Management 260: 679–691. http://dx.doi.org/10.1016/j.foreco.2010.05.023.
Araújo T.M., Higuchi N., de Carvalho Jr. J.A. (1999). Comparison of formulae for biomass content determination in a tropical rain forest site in the state of Pará, Brazil. Forest Ecology and Management 117: 43–52. http://dx.doi.org/10.1016/S0378-1127(98)00470-8.
Baker T.R., Phillips O.L., Malhi Y., Almeida S., Arroyo L., Di Fiore A., Erwin T., Killeen T.J., Laurance S.G., Laurance W.F., Lewis S.L., Lloyd J., Monteagudo A., Neill D.A., Patino S., Pitman N.C.A., Silva M., Vasquez-Martinez R. (2004). Variation in wood density determines spatial patterns in Amazonian forest biomass. Globlal Change Biology 10: 545–562. http://dx.doi.org/10.1111/j.1365-2486.2004.00751.x.
Bao F.C., Jiang Z.H., Jiang X.M., Lu X.X., Luo X.Q., Zhang S.Y. (2001). Differences in wood properties between juvenile wood and mature wood in 10 species grown in China. Wood Science and Technology 35: 363–375. http://dx.doi.org/10.1007/s002260100099.
Basuki T.M., van Laake P.E., Skidmore A.K., Hussin Y.A. (2009). Allometric equations for estimating the above-ground biomass in tropical lowland dipterocarp forests. Forest Ecology and Management 257(8): 684–1694. http://dx.doi.org/10.1016/j.foreco.2009.01.027.
Bonou W., Glèlè Kakai R., Assogbadjo A.E., Fonton H.N., Sinsin B. (2009). Characterisation of Afzelia africana Sm. habitat in the Lama forest reserve of Benin. Forest Ecology and Management 258: 1084–1092. http://dx.doi.org/10.1016/j.foreco.2009.05.032.
Brown S. (1997). Estimating biomass and biomass change of tropical forests: a primer. FAO Forestry Paper 134, Rome. 55 p.
Carson S.D., Cown D.J., McKinley R.B., Moore J.R. (2014). Effects of site, silviculture and seedlot on wood density and estimated wood stiffness in radiate pine at mid-rotation. New Zealand Journal of Forestry Science 44(26). http://dx.doi.org/10.1186/s40490-014-0026-3.
Chave J., Condit R., Lao S., Caspersen J.P., Foster R.B., Hubbell S.P. (2003). Spatial and temporal variation in biomass of a tropical forest: results from a large census plot in Panama. Journal of Ecology 91: 240–252. http://dx.doi.org/10.1046/j.1365-2745.2003.00757.x.
Chave J., Condit R., Aguilar S., Hernandez A., Lao Sperez R. (2004). Error propogation and scaling for tropical forest biomass estimates. Philosophical Transactions of the Royal Society B 359: 409–420. http://dx.doi.org/10.1098/rstb.2003.1425.
Chave J., Andalo C., Brown S., Cairns M.A., Chambers J.Q., Eamus D., Fölster H., Fromard F., Higuchi N., Kira T., Lescure J-P., Nelson B.W., Ogawa H., Puig H., Riéra B., Yamakura T. (2005). Tree allometry and improved estimation of carbon stocks and balance in tropical forests. Oecologia 145: 87–99. http://dx.doi.org/10.1007/s00442-005-0100-x.
Chave J., Muller-Landau H.C., Baker T.R., Easdale T.A., Ter Steege H., Webb C.O. (2006). Regional and phylogenetic variation of wood density across 2456 neotropical tree species. Ecological Applications 16(6): 2356–2367. http://dx.doi.org/10.1890/1051-0761(2006)016[2356:RAPVOW]2.0.CO;2.
Chave J., Coomes D., Jansen S., Lewis S.L., Swenson N.G., Zanne A. (2009). Towards a worldwide wood economics spectrum. Ecology Letters 12: 351–366. http://dx.doi.org/10.1111/j.1461-0248.2009.01285.x.
Cienciala E., Centeio A., Blazek P., da Cruz Gomes Soares M., Russ R. (2013). Estimation of stem and tree level biomass models for Prosopis juliflora pallida applicable to multi-stemmed tree species. Trees 27(4): 1061–1070. http://dx.doi.org/10.1007/s00468-013-0857-1.
Clark D.A., Brown S., Kicklighter D.W., Chambers J.Q., Thomlinson J.R., Holland E.A. (2001). Net primary production in tropical forests: an evaluation and synthesis of existing field data. Ecological Applications 11: 371–384. http://dx.doi.org/10.1890/1051-0761(2001)011[0371:NPPITF]2.0.CO;2.
Colgan M.S., Asner G.P., Swemmer T. (2013). Harvesting tree biomass at the stand level to assess the accuracy of field and airborne biomass estimation in savannas. Ecological Applications 23: 1170–1184. http://dx.doi.org/10.1890/12-0922.1.
Curtis J.T., Mc Intosh R.P. (1951). An upland forest continuum in the prairie forest border region of Wisconsin. Ecology 32: 476–496. http://dx.doi.org/10.2307/1931725.
Devi L.S., Yadava P.S. (2009). Aboveground biomass and net primary production of semi-evergreen tropical forest of Manipur, north-eastern India. Journal of Forestry Research 20: 151–155. http://dx.doi.org/10.1007/s11676-009-0026-y.
Djomo A.N., Ibrahima A., Saborowski J., Gravenhorst G. (2010). Allometric equations for biomass estimations in Cameroon and pan moist tropical equations including biomass data from Africa. Forest Ecology and Management 260(10): 1873–1885. http://dx.doi.org/10.1016/j.foreco.2010.08.034.
Eamus D., McGuinness K., Burrows W. (2000). Review of allometric relationships for estimating woody biomass for Queensland, the Northern Territory and Western Australia. National Carbon Accounting System Technical Report 5a. Australian Greenhouse Office, Canberra. 56 p.
Grierson P.F., Williams K., Adams M.A. (2000). Review of unpublished biomass-related information: Western Australia, South Australia, New South Wales and Queensland. National Carbon Accounting System Technical Report no. 25. Australian Greenhouse Office, Canberra.
Ebuy J., Lokombe Dimandja J., Ponette Q., Sonwa D., Picard N. (2011) Allometric equation for predicting aboveground biomass of three tree species. Journal of Tropical Forest Science 23: 125–132.
El-Juhany L.I., Aref I.M., El-Wakeel A.O. (2002). Evaluation of above-ground biomass and stem volume of three Casuarina species grown in the central region of Saudi Arabia. Emirates Journal of Agricultural Sciences 14: 8–13.
Enquist B.J., Brown J.H., West G.B. (1998). Allometric scaling of plant energetics and population density. Nature 395: 163–165. http://dx.doi.org/10.1038/25977.
FAO (Food and Agriculture Organization of the United Nations) (2011). State of the world’s forest. Rome, FAO. 179 p.
Fayolle A., Engelbrecht B., Freycon V., Mortier F., Swaine M., Rejou-Mechain M., Doucet J-L., Fauvet N., Cornu G., Gourlet-Fleury S. (2012). Geological substrates shape tree species and trait distributions in African moist forests. PLoS One 7(8): e42381. http://dx.doi.org/10.1371/journal.pone.0042381.
Fayolle A., Doucet J.L., Gillet J.F., Bourland N., Lejeune P. (2013). Tree allometry in Central Africa: testing the validity of pantropical multi-species allometric equations for estimating biomass and carbon stocks. Forest Ecology and Management 305: 29–37. http://dx.doi.org/10.1016/j.foreco.2013.05.036.
Fonseca W., Alice F.E., Rey-Benayas J.M. (2012). Carbon accumulation in aboveground and belowground biomass and soil of different age native forest plantations in the humid tropical lowlands of Costa Rica. New Forest 43: 197–211. http://dx.doi.org/10.1007/s11056-011-9273-9.
Fonton N.H., Glele Kakai R., Rondeux J. (2002). Étude dendrométrique d’Acacia auriculiformis A. Cunn. ex Benth. en mélange sur vertisol au Bénin. [Dendrometric study of Acacia auriculiformis A. Cunn. Ex Benth. in mixture on vertisol in Benin]. Biotechnologie, Agronomie, Société et Environnement 6(1): 29–37.
Fonton H.N., Dah-Dovonon J.Z., Adoko F.K., Dotchamou T. (2009). Modélisation du volume du fût d’arbre pour une gestion durable des écosystèmes forestiers soudaniens. [Modelling of tree stem volume for sustainable management of sudanian forest ecosystems]. Bois et Forêt des Tropiques 300(2): 95–100.
GFOI (Global Forest Observation Initiative) (2013). Integrating remote-sensing and ground-based observations for estimation of emissions and removals of greenhouse gases in forests: methods and guidance from the Global Forest Observations Initiative. Group on Earth Observations, Geneva, Switzerland, 2014.
Gourlet-Fleury S., Rossi V., Rejou-Mechain M., Freycon V., Fayolle A., Saint-Andre L., Cornu G., Gerard J., Sarrailh J-M., Flores O., Baya F., Billand A., Fauvet N., Gally M., Henry M., Hubert D., Pasquier A., Picard N. (2011). Environmental filtering of dense-wooded species controls above-ground biomass stored in African moist forests. Journal of Ecology 99(4): 981–990. http://dx.doi.org/10.1111/j.1365-2745.2011.01829.x.
Guendehou G.H.S., Lehtonen A. (2014). Guidance for tree measurement in tropical forest ecosystems using non-destructive sampling to develop stem biomass and volume models. Metlan työraportteja / Working Papers of the Finnish Forest Research Institute 287. 10 p.
Guendehou G.H.S., Lehtonen A., Moudachirou M., Mäkipää R., Sinsin B. (2012). Stem biomass and volume models of selected tropical tree species in West Africa. South Forests 74(2): 77–88. http://dx.doi.org/10.2989/20702620.2012.701432.
Gryc V., Vavrčík H., Šlezingerová J., Koňas P. (2010). Basic density of spruce wood, wood with bark, and bark of branches in locations in the Czech Republic. In: Levanic T., Gricar J., Hafner P., Krajnc R., Jagodic S., Gärtner H., Heinrich I., Helle G. (eds.). TRACE - tree rings in archaeology, climatology and ecology, vol. 8: proceedings of the DENDROSYMPOSIUM 2009, April 16th – 19th 2009, Otočec, Slovenia. GFZ Potsdam. Scientific Technical Report STR 10/05, Potsdam. p. 151–156.
Henry M., Besnard A., Asante W.A., Eshun J., Adu-Bredu S., Valentini R., Bernoux M., Saint-André L. (2010). Wood density, phytomass variations within and among trees, and allometric equations in a tropical rainforest of Africa. Forest Ecology and Management 260: 1375–1388. http://dx.doi.org/10.1016/j.foreco.2010.07.040.
Henry M., Picard N., Trotta C., Manlay R.J., Valentini R., Bernoux M., Saint‐André L. (2011) Estimating tree biomass of sub‐Saharan African forests: a review of available allometric equations. Silva Fennica 45(3B): 477–569. http://dx.doi.org/10.14214/sf.38.
IPCC (2006). 2006 IPCC guidelines for national greenhouse gas inventories, prepared by the National Greenhouse Gas Inventories programme. In: Eggleston H.S., Buendia L., Miwa K., Ngara T., Tanabe K. (eds). IGES, Japan.
JAFTA (Japan Forest Technical Association) (2000). The study on cartography, inventory and management of classified forest in northern area in Benin. Final report. Japan International Cooperation Agency (JICA), Cotonou.
Jenkins J.C., Chojnacky D.C., Heath L.S., Birdsey R.A. (2004). Comprehensive database of diameter-based biomass regressions for North American tree species. General Technical Report NE-319. US Department of Agriculture, Forest Service, Northeastern Research Station, Newtown Square, Pennsylvania.
Keith H., Barrett D., Keenan R. (2000). Review of allometric relationships for estimating woody biomass for New South Wales, the Australian Capital Territory, Victoria, Tasmania, and South Australia. National Carbon Accounting System Technical Report 5B. Australian Greenhouse Office, Canberra.
Ketterings Q.M., Coe R., Van Noordwijk M., Ambagu Y., Palm C.A. (2001). Reducing uncertainty in use of allometric biomass equations for predicting above-ground tree biomass in mixed secondary forests. Forest Ecology and Management 146: 199–202. http://dx.doi.org/10.1016/S0378-1127(00)00460-6.
Kindt R., Ordonez J., Smith E., Orwa C., Mosoti B., John I., Chege J., Harja D., Kehlenbeck K., Luedeling E., Lillesø J-P.B., Munjuga M., Mwanzia L., Sinclair F., Graudal L., Jamnadass R. (2015). ICRAF species switchboard. Version 1.2. World Agroforestry Centre, Nairobi.
Küppers K., Sturm H.J., Emrich A., Horst M.A. (1998). Evaluation écologique intégrée de la forêt naturelle de la Lama en République du Bénin. Rapport sur la flore et la sylviculture. Elaboré pour le compte du projet «Promotion de l’économie forestière et dubois» PN 95.66.647. Office National du Bois (ONAB), KfW and GTZ. [Integrated ecological assessment of the natural Lama forest in Benin Republic. Report on flora and sylviculture elaborated for the Project «Promotion de l’économie forestière et du bois» PN 95.66.647. Office National du Bois (ONAB), KfW and GTZ].
Lima A.J.N., Suwa R., Pires De Mello Ribeiro G.H., Kajimoto T., Dos Santos J., Pereira Da Silva R., Sampaio De Souza C.A., De Barros P.C., Noguchi H., Ishizuka M., Higuchi N. (2012). Allometric models for estimating above- and below-ground biomass in amazonian forests at São Gabriel da Cachoeira in the upper Rio Negro, Brazil. Forest Ecology and Management 277: 163–172. http://dx.doi.org/10.1016/j.foreco.2012.04.028.
Marková I., Pokorný R. (2011). Allometric relationships for the estimation of dry mass of aboveground organs in young highland Norway spruce stand. Acta Universitatis Agriculturae et Silviculturae Mendelianae Brunensis 9(6): 217–224. http://dx.doi.org/10.11118/actaun201159060217.
Martínez-Cabrera H.I., Jones C.S., Espino S., Schenk H.J. (2009). Wood anatomy and wood density in shrubs: responses to varying aridity along transcontinental transects. American Journal of Botany 96: 1388–1398. http://dx.doi.org/10.3732/ajb.0800237.
Mate R., Johansson T., Sitoe A. (2014). Biomass equations for tropical forest tree species in Mozambique. Forests 5: 535–556. http://dx.doi.org/10.3390/f5030535.
Mbaekwe E.I., Mackenzie J.A. (2008). The use of a best-fit allometric model to estimate above ground biomass accumulation and distribution in an age series of teak (Tectona grandis L.F.) plantations at Gambari forest reserve, Oyo state, Nigeria. Tropical Ecology 49: 259–270.
McRoberts R.E., Moser P., Oliveira L.Z., Vibrans C. (2015). A general method for assessing the effects of uncertainty in individual-tree volume model predictions on large-area volume estimates with a subtropical forest illustration. Canadian Journal of Forest Research 45: 44–51. http://dx.doi.org/10.1139/cjfr-2014-0266.
Mondjannangni A. (1969). Contribution à l’étude des paysages végétaux du Bas Dahomey. [Contribution to the study of plants communities’ landscape of Low Dahomey]. Annales Universite Abidjan 2, Abidjan.
Mugasha W.A., Eid T., Bollandsås O.M., Malimbwi R.E., Chamshama S.A.O., Zahabu E., Katani J.Z. (2013). Allometric models for prediction of above- and belowground biomass of trees in the miombo woodlands of Tanzania. Forest Ecology and Management 310: 87–101. http://dx.doi.org/10.1016/j.foreco.2013.08.003.
Muller-Landau H.C. (2004). Interspecific and intersite variation in wood specific gravity of tropical trees. Biotropica 36: 20–32.
Murali K.S., Bhat D.M., Ravindranath N.H. (2005). Biomass estimation equations for tropical deciduous and evergreen forests. International Journal of Agricultural Resources, Governance and Ecology 4(1): 81–92. http://dx.doi.org/10.1504/ijarge.2005.006440.
Nagel P., Sinsin B., Peveling R. (2004). Conservation of biodiversity in a relic forest in Benin – an overview. Regio Basiliensis 45: 125–137.
Nelson B.W., Mesquita R., Pereira J.L.G., De Souza S.G.A., Batista G.T., Couta L.B. (1999). Allometric regressions for improved estimate of secondary forest biomass in the Central Amazon. Forest Ecology and Management 117: 149–167. http://dx.doi.org/10.1016/S0378-1127(98)00475-7.
Netshiluvhi T.R., Scholes R.J. (2001). Allometry of South African woodland trees. Env-P-I 2001-007. CSIR, Division of Water, Environment and Forest Technology, Pretoria.
Ngomanda A., Engone Obiang N.L., Lebamba J., Moundounga Mavouroulou Q., Gomat H., Mankou G.S., Loumeto J., Midoko Iponga D., Kossi Ditsouga F., Zinga Koumba R., Botsika Bobé K.H., Mikala Okouyi C., Nyangadouma R., Lépengué N., Mbatchi B., Picard N. (2014). Site-specic versus pantropical allometric equation: which option to estimate the biomass of a moist central african forest. Forest Ecology and Management 312: 1–9. http://dx.doi.org/10.1016/j.foreco.2013.10.029.
Nogueira E.M., Nelson B.W., Fearnside P.M. (2005). Wood density in dense forest in central Amazonia, Brazil. Forest Ecology and Management 208: 261–286. http://dx.doi.org/10.1016/j.foreco.2004.12.007.
Nogueira E.M., Fearnside P.M., Nelson B.W., Franca M.B. (2007). Wood density in forests of Brazil’s ‘arc of deforestation’: implications for biomass and flux of carbon from land-use change in Amazonia. Forest Ecology and Management 248: 119–135. http://dx.doi.org/10.1016/j.foreco.2007.04.047.
Onyekwelu J.C. (2004). Above-ground biomass production and biomass equations for even-aged Gmelina arborea (ROXB) plantations in south-western Nigeria. Biomass and Energy 26: 39–46. http://dx.doi.org/10.1016/S0961-9534(03)00100-4.
Pan Y., Birdsey R.A., Phillips O.L., Jackson R.B. (2013). The structure, distribution, and biomass of the World’s Forests. Annual Review of Ecology, Evolution and Systematics 44: 593–622. http://dx.doi.org/10.1146/annurev-ecolsys-110512-135914.
Paradis G., Houngnon P. (1977). La végétation de l’aire classée de la Lama dans la mosaïque forêt-savane du Sud-Bénin. [Vegetation of protected area of Lama in forest-savannah mosaic of southern Benin]. Bulletin du Museum National d’Histoire Naturelle, Paris, 3ème série –Botanique 34: 169–198.
Peichl M., Leava N.A., Kiely G. (2012). Above- and belowground ecosystem biomass, carbon and nitrogen allocation in recently afforested grassland and adjacent intensively managed grassland. Plant and Soil 350: 281–296. http://dx.doi.org/10.1007/s11104-011-0905-9.
Poorter L., Mcdonald I., Alarcon A., Fichtler E., Licona J.C., Peña-Claros M., Sterck F., Villegas Z., Sass-Klaasssen U. (2010). The importance of wood traits and hydraulic conductance for the performance and life history strategies of 42 rainforest tree species. New Phytologist 185: 481–492. http://dx.doi.org/10.1111/j.1469-8137.2009.03092.x.
R Development Core Team (2012). R: a language and environment for statistical computing. R Foundation for Statistical Computing, Vienna, Austria. ISBN 3-900051-07-0. http://www.R-project.org.
Rueda R., Williamson G.B. (1992). Radial and vertical wood specific gravity in Ochroma pyramidale (Cav. ex Lam.) Urb (Bombacaceae). Biotropica 244: 512–518. http://dx.doi.org/10.2307/2389013.
Ryan C.M., Williams M., Grace J. (2011). Above and belowground carbon stocks in a miombo woodland landscape of Mozambique. Biotropica 43: 423–432. http://dx.doi.org/10.1111/j.1744-7429.2010.00713.x.
Sawadogo L., Savadogo P., Tiveau D., Dayamba S.D., Zida D., Nouvellet Y., Oden P.C., Guinko S. (2010). Allometric prediction of above-ground biomass of eleven woody tree species in the sudanian savanna-woodland of West Africa. Journal of Forestry Research 21: 475–481. http://dx.doi.org/10.1007/s11676-010-0101-4.
Segura M., Kanninen M. (2005). Allometric models for tree volume and total aboveground biomass in a tropical humid forest in Costa Rica. Biotropica 37(1): 2–8. http://dx.doi.org/10.1111/j.1744-7429.2005.02027.x.
Sileshi G.W. (2014). A critical review of forest biomass estimation models, common mistakes and corrective measures. Forest Ecology and Management 329: 237–254. http://dx.doi.org/10.1016/j.foreco.2014.06.026.
Sungpalee W., Itoh A., Kanzaki M., Sri-Ngernyuang K., Noguchi H., Mizuno T., Teejuntuk S., Hara M., Chai-Udom K., Ohkubo T., Sahunalu P., Dhanmmanonda P., Nanami S., Yamakura T., Sorn-Ngai A. (2009). Intra- and interspecific variation in wood density and fine-scale spatial distribution of stand-level wood density in a northern Thai tropical montane forest. Journal of Tropical Ecology 25: 359–370. http://dx.doi.org/10.1017/S0266467409006191.
Svob S., Arroyo-Mora. J.P., Kalacska M. (2014). A wood density and aboveground biomass variability assessment using pre-felling inventory data in Costa Rica. Carbon Balance and Management 9(9). http://dx.doi.org/10.1186/s13021-014-0009-y.
Swenson N.G, Enquist B.J. (2007). The relationship between stem and branch wood. American Journal of Botany 95: 516–519. http://dx.doi.org/10.3732/ajb.95.4.516.
Ter-Mikaelian M.T., Korzukhin M.D. (1997). Biomass equations for sixty-five North American tree species. Forest Ecology and Management 97: 1–24. http://dx.doi.org/10.1016/S0378-1127(97)00019-4.
Tritton L.M., Hornbeck J.W. (1982). Biomass equations for major tree species of the northeast. General Technical Report NE-69. US Department of Agriculture, Northeastern Forest Experiment Station, Broomall, Pennsylvania.
UNFCCC (United Nations Framework Convention on Climate Change) (2010). Report of the conference of the parties on its fifteenth session, held in Copenhagen from 7 to 19 December 2009. Addendum. Part two: action taken by the conference of the parties at its fifteenth session. Decisions adopted by the Conference of the Parties. FCCC/CP/2009/11/Add.1, United Nations Framework Convention on Climate Change.
Van Gelder H.A., Poorter L., Sterck F.J. (2006). Wood mechanics, allometry, and life-history variation in a tropical rain forest tree community. New Phytologist 171: 367–378. http://dx.doi.org/10.1111/j.1469-8137.2006.01757.x.
Vann D.R., Palmiotto P.A., Strimbeck G.R. (1998). Allometric equations for two South American conifers: test of a non-destructive method. Forest Ecology and Management 106: 55–71. http://dx.doi.org/10.1016/S0378-1127(97)00215-6.
von Bothmer K.H., Moumouni A.M., Patinvoh P. (1986). Plan Directeur de la Forêt Classée de la Lama. Projet de développement de l’économie forestière et production de bois. [Management plan of Lama forest reserve]. Project GTZ no. 79.2038.2.01-200. Direction des Eaux, Forêts et Chasse, and Office National du Bois, Cotonou.
Vieilledent G., Vaudry R., Andriamanohisoa D.F.S., Rakotonarivo S.O., Randrionasolo H.Z., Razafindrabe H.N., Bidaud Rakotoarivony C., Ebeling J., Masamoelina M. (2012). A universal approach to estimate biomass and carbon stock in tropical forests using generic allometric models. Ecological Application 22(2): 572–583. http://dx.doi.org/10.1890/11-0039.1.
West G.B., Brown J.H., Enquist B.J. (1997). A general model for the origin of allometric scaling laws in biology. Science 276: 122–126. http://dx.doi.org/10.1126/science.276.5309.122.
West G.B., Brown J.H., Enquist B.J. (1999). A general model for the structure and allometry of plant vascular system. Nature 400: 664–667. http://dx.doi.org/10.1038/23251.
Yeboah D., Burton D., Storer A.J., Opuni-Frimpong E. (2014). Variation in wood density and carbon content of tropical plantation tree species from Ghana. New Forests 45: 35–52. http://dx.doi.org/10.1007/s11056-013-9390-8.
Zanne A.E., Lopez-Gonzalez G., Coomes D.A., Ilic J., Jansen S., Lewis S.L., Miller R.B., Swenson N.G., Wiemann M.C., Chave J. (2009). Global wood density database. Dryad. Identifier. http://hdl.handle.net/10255/dryad.235.
Zanne A.E., Westoby M., Falster D.S., Ackerly D.D., Loarie S.R., Arnold S.E.J., Coomes D.A. (2010). Angiosperm wood structure: global patterns in vessel anatomy and their relation to wood density and potential conductivity. American Journal of Botany 97(2): 207–215. http://dx.doi.org/10.3732/ajb.0900178.
Zeidler A. (2012) .Variation of wood density in Turkish hazel (Corylus colurna L.) grown in the Czech Republic. Journal of Forest Science 58(4): 145–151.
Zianis D., Muukkonen P., Mäkipää R., Mencuccini M. (2005). Biomass and stem volume equations for tree species in Europe. Silva Fennica Monograph 4. 63 p. http://www.silvafennica.fi/pdf/smf004.pdf.
Total of 92 references.
